Introduction to AASHTO Load and Resistance Factor Design ...
22
Introduction to AASHTO Load and Resistance Factor Design Structural Supports for Signs, Luminaires Traffic Signals Overview Loads Calibration Dr. Jay A. Puckett, PE, F.ASCE Director of the Durham School University of Nebraska Emeritus Professor at University of Wyoming President BridgeTech, Inc. Dr. Michael G. Barker, PE Professor University of Wyoming
Transcript of Introduction to AASHTO Load and Resistance Factor Design ...

Introduction to AASHTOLoad and Resistance Factor Design
Structural Supports for Signs, Luminaires Traffic Signals
OverviewLoads
Calibration
Dr. Jay A. Puckett, PE, F.ASCEDirector of the Durham
School University of NebraskaEmeritus Professor at
University of WyomingPresident BridgeTech, Inc.
Dr. Michael G. Barker, PEProfessor
University of Wyoming
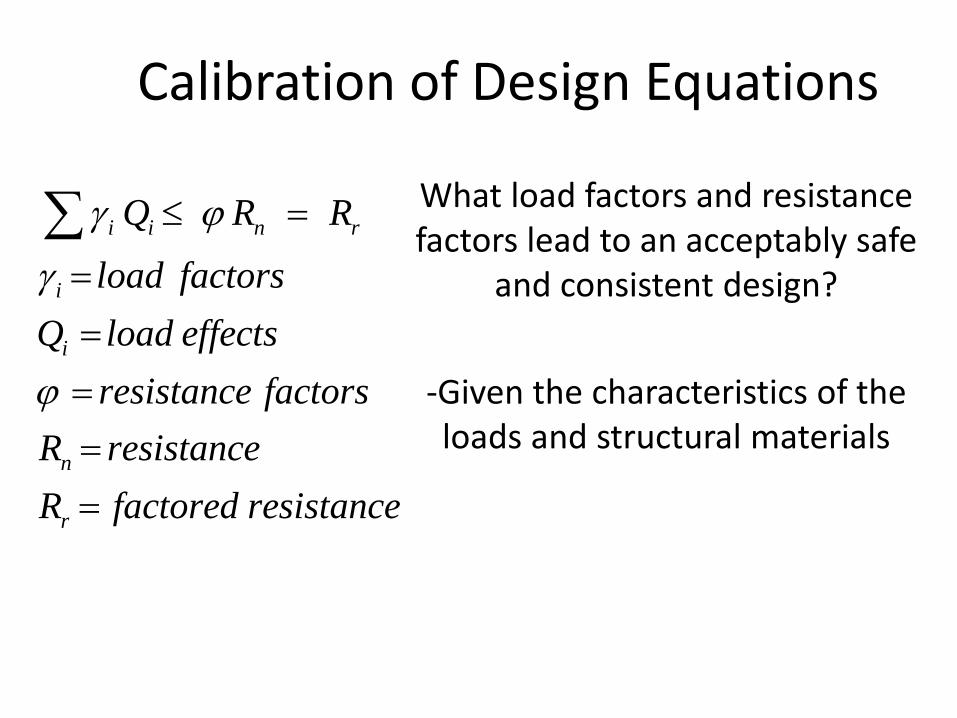
Calibration of Design Equations
Puckett 2007, 2009, 2010
What load factors and resistance factors lead to an acceptably safe
and consistent design?
-Given the characteristics of the loads and structural materials
γ ϕ
γ
ϕ
≤ =
=====
∑ i i n r
i
i
n
r
Q R R
load factorsQ load effects
resistance factorsR resistanceR factored resistance

Safety or Reliability Index β• Failure is defined as the Strength < Load (S < L)• Probability of failure is the Probability (S < L)• Reliability (Safety) Index β is a measure of the
Probability (Strength < Load)
• Intent of LRFD - β high enough for adequate safety and consistent over a range of design scenarios.
β = the number of standard deviations that the mean value of the limit state failure function is on the safe side of failure
Puckett 2007, 2009, 2010
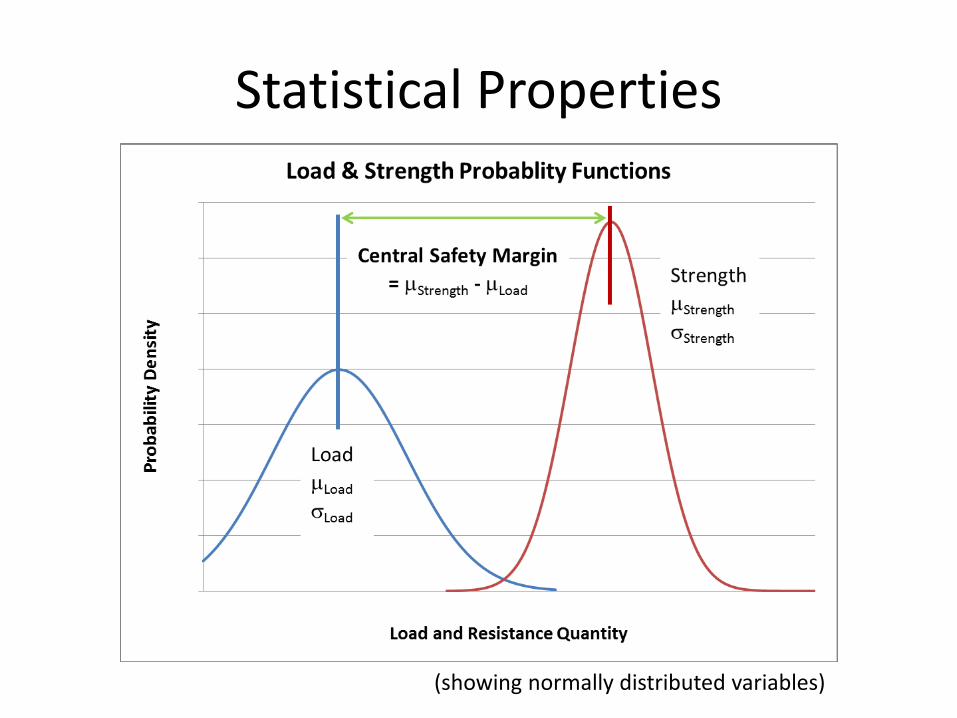
Statistical Properties
(showing normally distributed variables)
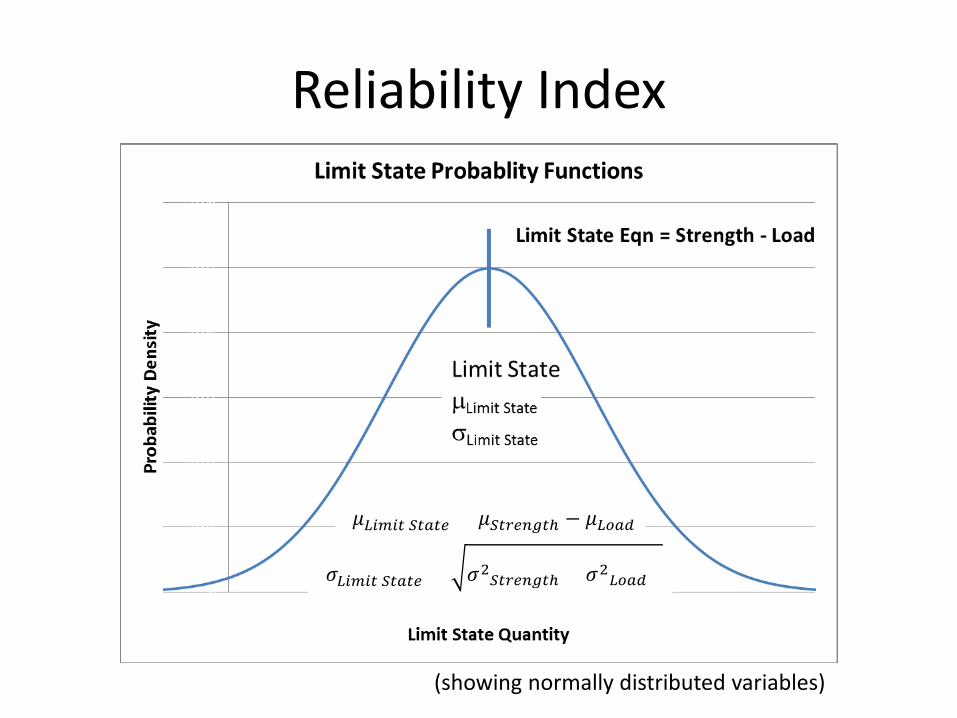
Reliability Index
(showing normally distributed variables)
𝜎𝜎𝐿𝐿𝐿𝐿𝐿𝐿𝐿𝐿𝐿𝐿 𝑆𝑆𝐿𝐿𝑆𝑆𝐿𝐿𝑆𝑆 = 𝜎𝜎2𝑆𝑆𝐿𝐿𝑆𝑆𝑆𝑆𝑆𝑆𝑆𝑆𝐿𝐿𝑆 + 𝜎𝜎2𝐿𝐿𝐿𝐿𝑆𝑆𝐿𝐿
𝜇𝜇𝐿𝐿𝐿𝐿𝐿𝐿𝐿𝐿𝐿𝐿 𝑆𝑆𝐿𝐿𝑆𝑆𝐿𝐿𝑆𝑆 = 𝜇𝜇𝑆𝑆𝐿𝐿𝑆𝑆𝑆𝑆𝑆𝑆𝑆𝑆𝐿𝐿𝑆 − 𝜇𝜇𝐿𝐿𝐿𝐿𝑆𝑆𝐿𝐿

Reliability Index
(showing normally distributed variables)
𝜷𝜷 =𝜇𝜇𝐿𝐿𝐿𝐿𝐿𝐿𝐿𝐿𝐿𝐿 𝑆𝑆𝐿𝐿𝑆𝑆𝐿𝐿𝑆𝑆𝜎𝜎𝐿𝐿𝐿𝐿𝐿𝐿𝐿𝐿𝐿𝐿 𝑆𝑆𝐿𝐿𝑆𝑆𝐿𝐿𝑆𝑆

Calibration
• Determine the statistical properties of loads• Determine the statistical properties of strength
(for optimal design using assumed φ and γi)• Determine β• Vary φ and γi until acceptable safety and
consistency achieved (“calibrate” to current accepted practice – current ASD procedures)

Loads Considered
Significant Dead Load EffectMostly Wind Load
• Dead & Wind• Ratio of Dead to Wind• Importance (300/700/1700 year wind)• Combined Moment & Torsion
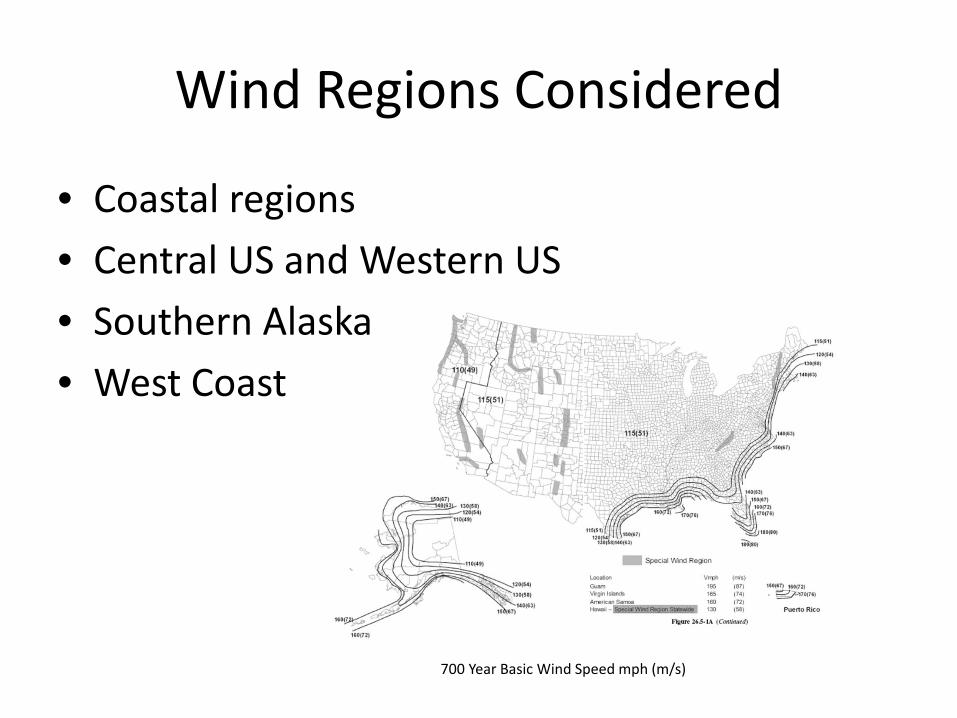
Wind Regions Considered
• Coastal regions• Central US and Western US• Southern Alaska• West Coast
700 Year Basic Wind Speed mph (m/s)

LRFD Reliability Index β
Optimized Design φRn = γD1MD + γWMMRI Year Wind
Load Qµln Qσln Q
Strength Rµln Rσln R
Probability Properties
Reliability Index (Lognormal Distributions)
Assume φ, γD1 , and γW
All Reliability Analyses Based On:MD + M700 = 1.0For EquivalentComparisons
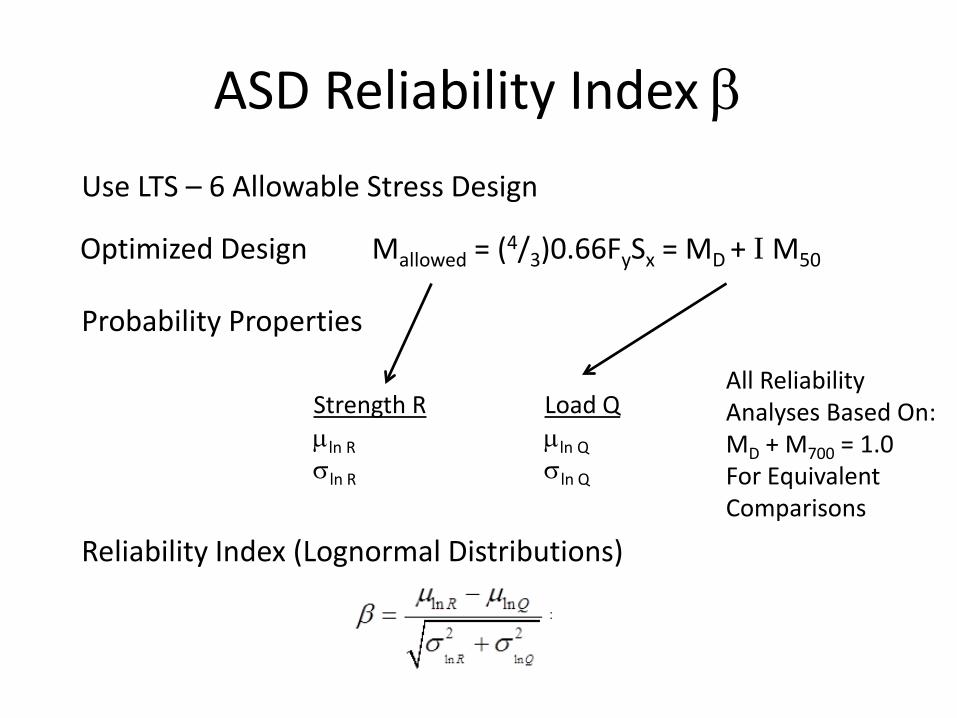
ASD Reliability Index β
Optimized Design Mallowed = (4/3)0.66FySx = MD + I M50
Load Qµln Qσln Q
Strength Rµln Rσln R
Probability Properties
Reliability Index (Lognormal Distributions)
Use LTS – 6 Allowable Stress Design
All Reliability Analyses Based On:MD + M700 = 1.0For EquivalentComparisons
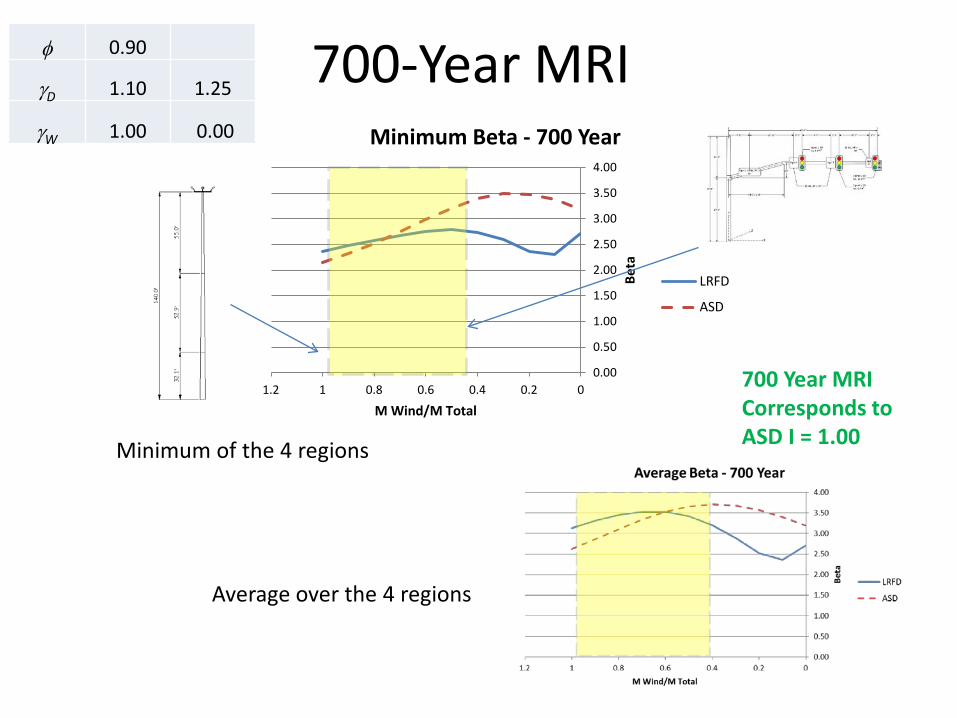
700-Year MRI
Minimum of the 4 regions
Average over the 4 regions
0.00
0.50
1.00
1.50
2.00
2.50
3.00
3.50
4.00
00.20.40.60.811.2
Beta
M Wind/M Total
Minimum Beta - 700 Year
LRFD
ASD
700 Year MRICorresponds toASD I = 1.00
φ 0.90
γD 1.10 1.25
γW 1.00 0.00

700-Year MRI
Minimum of the 4 regions
Average over the 4 regions
ASD Range of β LRFD Range of β
0.00
0.50
1.00
1.50
2.00
2.50
3.00
3.50
4.00
00.20.40.60.811.2
Beta
M Wind/M Total
Minimum Beta - 700 Year
LRFD
ASD
700 Year MRICorresponds toASD I = 1.00
φ 0.90
γD 1.10 1.25
γW 1.00 0.00
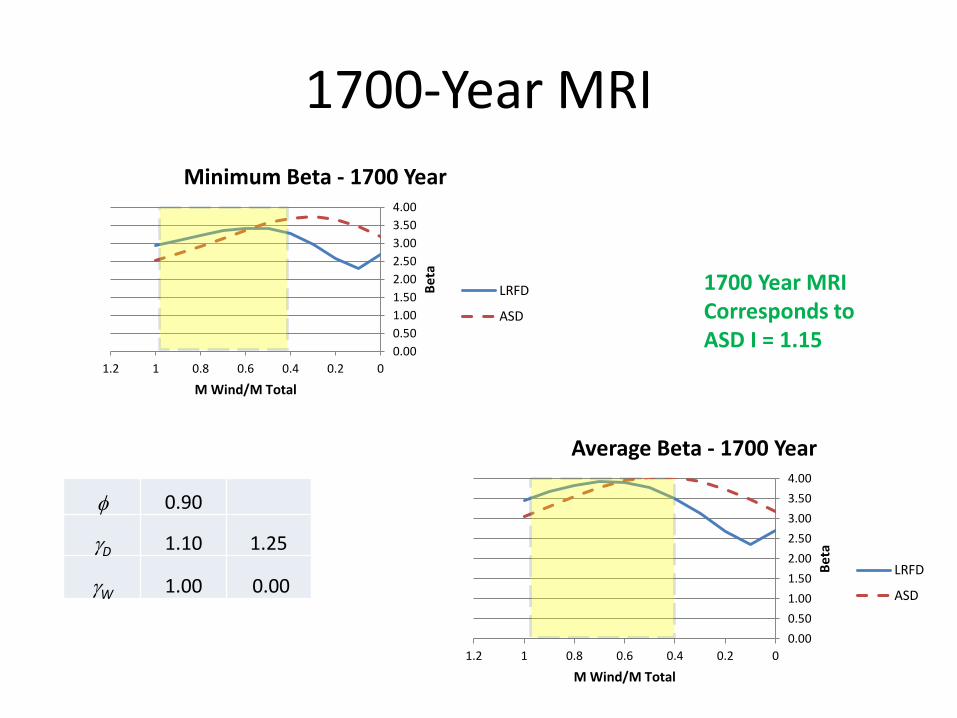
1700-Year MRI
φ 0.90
γD 1.10 1.25
γW 1.00 0.00
0.000.501.001.502.002.503.003.504.00
00.20.40.60.811.2
Beta
M Wind/M Total
Average Beta - 1700 Year
LRFD
ASD
0.000.501.001.502.002.503.003.504.00
00.20.40.60.811.2
Beta
M Wind/M Total
Minimum Beta - 1700 Year
LRFD
ASD
1700 Year MRICorresponds toASD I = 1.15
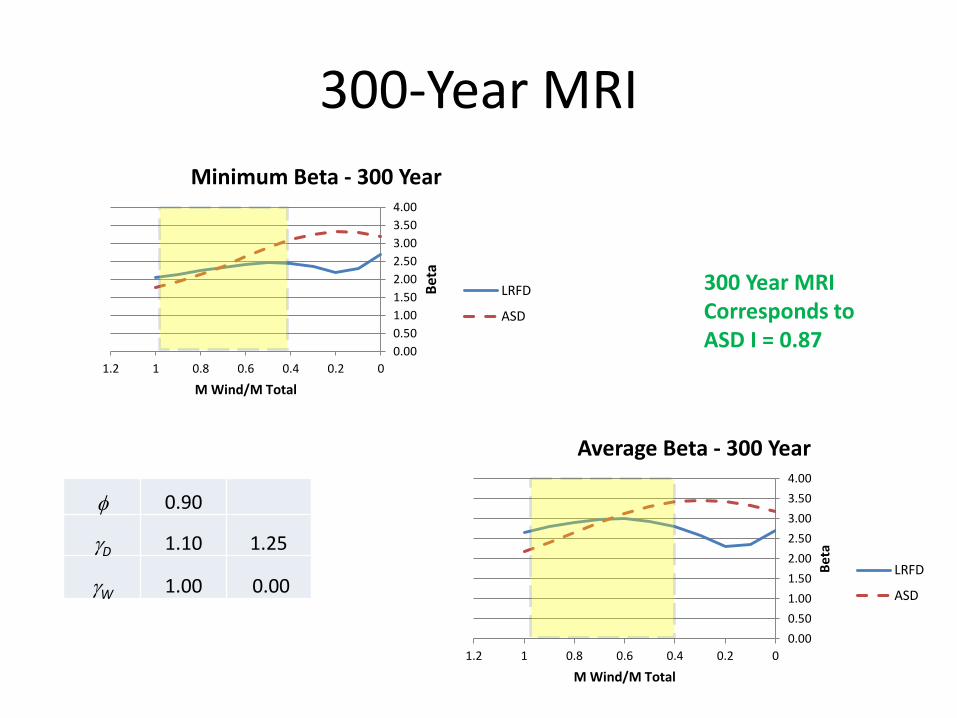
300-Year MRI
φ 0.90
γD 1.10 1.25
γW 1.00 0.00
0.000.501.001.502.002.503.003.504.00
00.20.40.60.811.2
Beta
M Wind/M Total
Average Beta - 300 Year
LRFD
ASD
0.000.501.001.502.002.503.003.504.00
00.20.40.60.811.2
Beta
M Wind/M Total
Minimum Beta - 300 Year
LRFD
ASD
300 Year MRICorresponds toASD I = 0.87
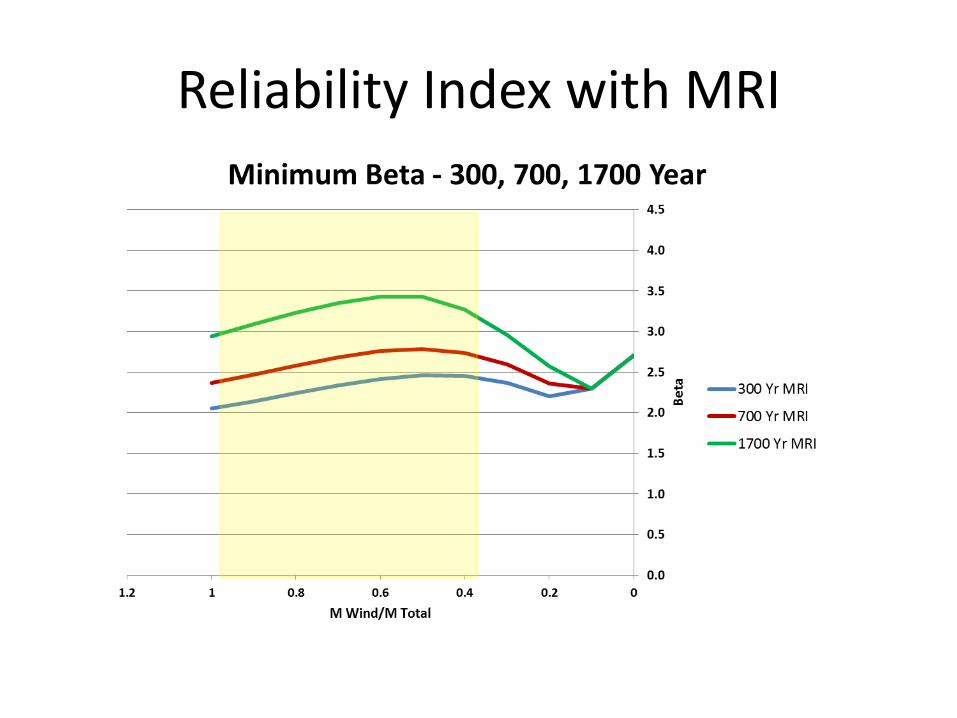
Reliability Index with MRI

Midwest & West Reliability Index
(Midwest and West)Load Ratio [WL/(DL+WL) = 0.5]Risk Category
Traffic Volume Typical High LowADT<100 3.03 3.89 3.03100<ADT<=1000 3.60 3.89 3.031000<ADT<= 10000 3.60 3.89 3.03ADT>10000 3.89 3.89 3.03Typical: Failure could cross travelwayHigh: Support failure could stop a life-line travelwayLow: Support failure could not cross travelwayRoadway sign supports: use 10 years (Low) (Midwest and West)Load Ratio [WL/(DL+WL) = 1.0]
ImportanceTraffic Volume Typical High LowADT<100 2.77 3.62 2.77100<ADT<=1000 3.35 3.62 2.771000<ADT<= 10000 3.35 3.62 2.77ADT>10000 3.62 3.62 2.77Typical: Failure could cross travelwayHigh: Support failure could stop a life-line travelwayLow: Support failure could not cross travelwayRoadway sign supports: use 10 years (Low)
Risk CategoryTraffic Volume Typical High LowADT<100 300 1700 300100<ADT≤1000 700 1700 3001000<ADT≤10000 700 1700 300ADT>10000 1700 1700 300Typical: Failure could cross travelwayHigh: Support failure could stop a life-line travelwayLow: Support failure could not cross travelwayRoadside sign supports: Use 10 years
ASD with I=1: β = 3.74
ASD with I=1: β = 2.69

Impact – Importance of MRI
0.60
0.70
0.80
0.90
1.00
1.10
1.20
00.20.40.60.811.2
Ratio
M Wind/M Total
LRFD Required Resistance Ratios (RnT/Rn700)
Rn300/Rn700
Rn1700/Rn700
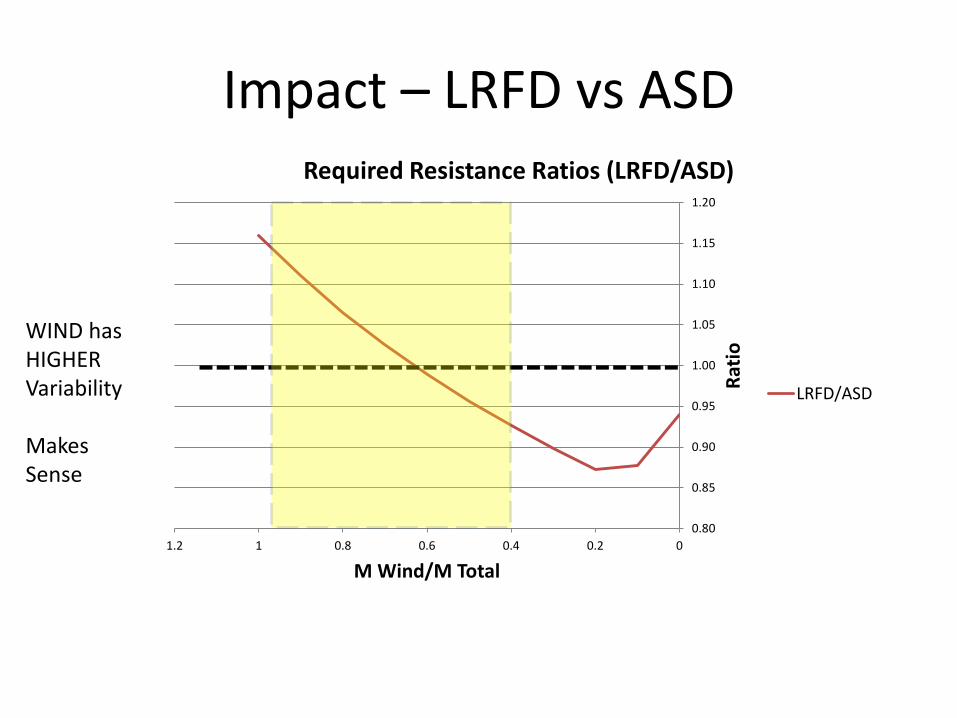
Impact – LRFD vs ASD
0.80
0.85
0.90
0.95
1.00
1.05
1.10
1.15
1.20
00.20.40.60.811.2
Ratio
M Wind/M Total
Required Resistance Ratios (LRFD/ASD)
LRFD/ASD
WIND has HIGHER Variability
Makes Sense

Calibration Summary
• LRFD Calibrated to Current ASD• MRI 300 ~ I=0.87, • MRI 700 ~ I=1.00, • MRI 1700 ~ I=1.15
• LRFD Provides Adequate Safety as Calibrated to Current ASD (β high enough)
• LRFD Provides More Consistent Safety over the Range of Design than ASD (β more uniform)

Calibration Summary
• LRFD & ASD Result in Same Strength Design for Wind Moment/Total Moment ~ 0.60
• High Mast Pole LRFD Strength ~ 10-15% Higher
• Mast Arm LRFD Strength ~5-8% Lower

Calibration Summary
• Risk Category has Significant Impact– High Mast Poles
• +10% or more for High Risk• -10% or more for Low Risk
– Mast Arm Poles• +5% or more for High Risk• -5% or more for Low Risk