Introduction - ST-HW · HWg-PDMS MANUAL HW group 2 / 15 Installation HWg-PDMS is very simple to...
15
1 / 15 www.HW-group.com Introduction HWg-PDMS is a Windows application that collects data from probes connected to IP sensor devices (Damocles, Poseidon, HWg-PWR, HWg-STE, HWg-Ares and more). The application consists of two parts. The first part allows you to display and configure device and sensor parameters. The second part collects information from the devices and stores it into an internal database. Data collection runs as a Windows system service and starts automatically when the computer is started. Data is periodically stored into an internal SQL database and can be automatically exported in the background to user-defined Excel reports (using the XML format). HWg-PDMS MANUAL Windows application for IP sensor data collection and MS Excel reporting LAN Network %RH HWg-PDMS °C Periodic data export to MS Excel templates °C Logged data graph overview Windows PC NT service
Transcript of Introduction - ST-HW · HWg-PDMS MANUAL HW group 2 / 15 Installation HWg-PDMS is very simple to...
HWg-PDMS MANUAL HW group
1 / 15 www.HW-group.com
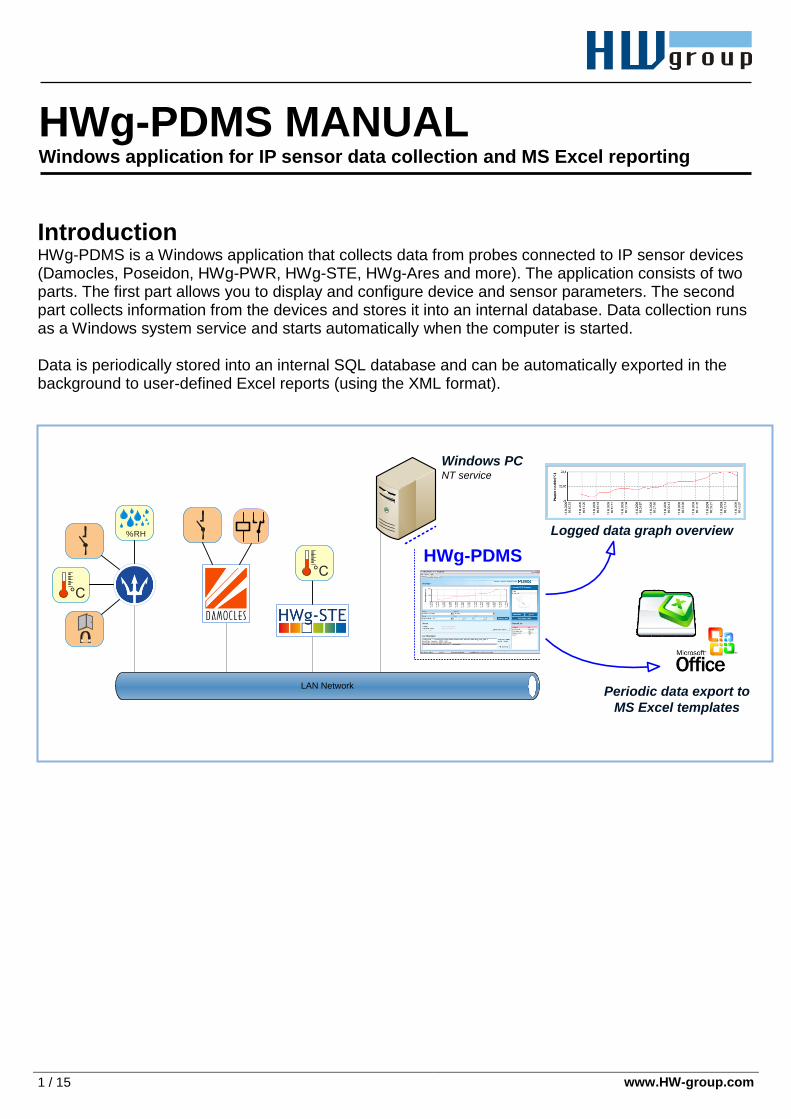
Introduction HWg-PDMS is a Windows application that collects data from probes connected to IP sensor devices (Damocles, Poseidon, HWg-PWR, HWg-STE, HWg-Ares and more). The application consists of two parts. The first part allows you to display and configure device and sensor parameters. The second part collects information from the devices and stores it into an internal database. Data collection runs as a Windows system service and starts automatically when the computer is started. Data is periodically stored into an internal SQL database and can be automatically exported in the background to user-defined Excel reports (using the XML format).
HWg-PDMS MANUAL
Windows application for IP sensor data collection and MS Excel reporting
LAN Network
%RH
HWg-PDMS
°C
Periodic data export to
MS Excel templates
°C
Logged data graph overview
Windows PCNT service
HWg-PDMS MANUAL HW group
2 / 15 www.HW-group.com
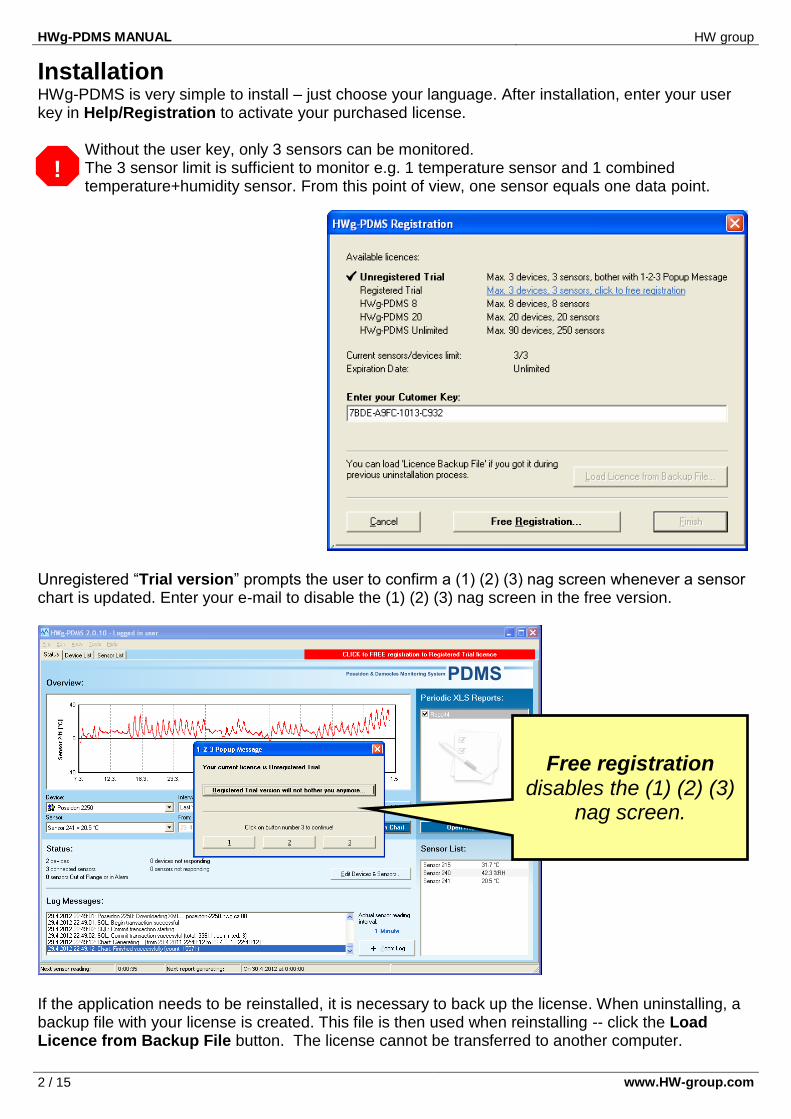
Installation HWg-PDMS is very simple to install – just choose your language. After installation, enter your user key in Help/Registration to activate your purchased license.
Without the user key, only 3 sensors can be monitored. The 3 sensor limit is sufficient to monitor e.g. 1 temperature sensor and 1 combined temperature+humidity sensor. From this point of view, one sensor equals one data point.
Unregistered “Trial version” prompts the user to confirm a (1) (2) (3) nag screen whenever a sensor chart is updated. Enter your e-mail to disable the (1) (2) (3) nag screen in the free version.
If the application needs to be reinstalled, it is necessary to back up the license. When uninstalling, a backup file with your license is created. This file is then used when reinstalling -- click the Load Licence from Backup File button. The license cannot be transferred to another computer.
!
Free registration disables the (1) (2) (3)
nag screen.
HWg-PDMS MANUAL HW group
3 / 15 www.HW-group.com
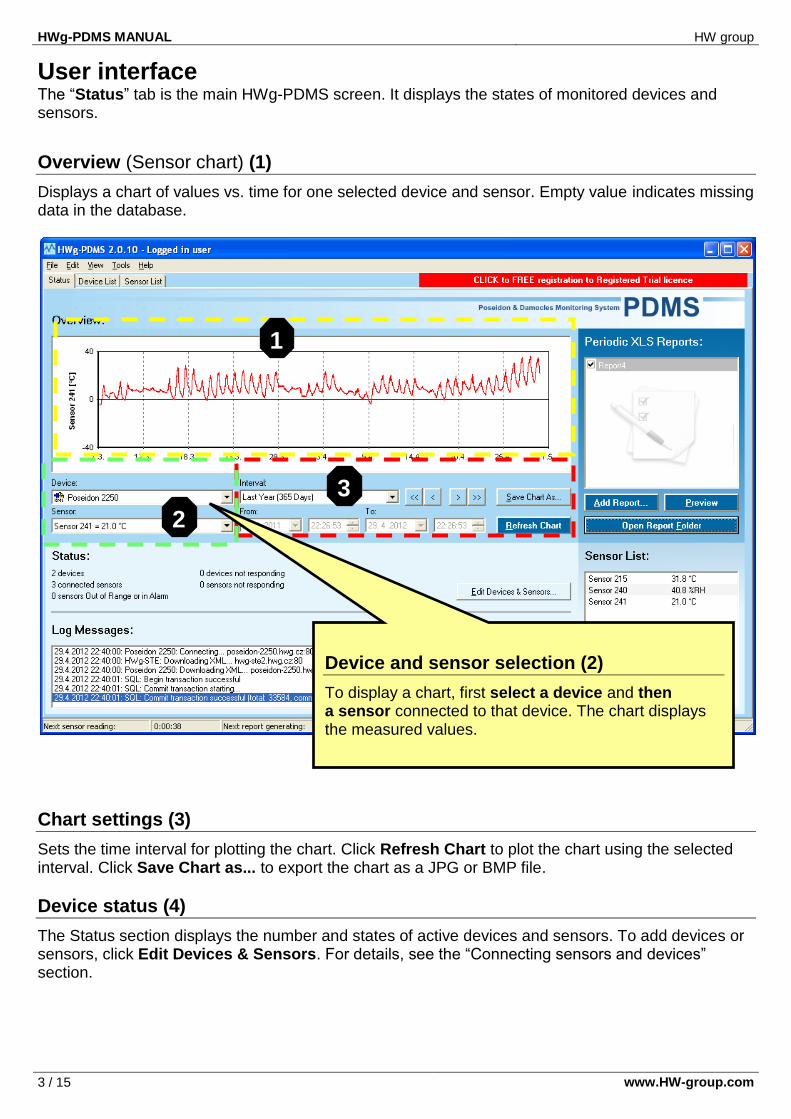
User interface The “Status” tab is the main HWg-PDMS screen. It displays the states of monitored devices and sensors.
Overview (Sensor chart) (1)
Displays a chart of values vs. time for one selected device and sensor. Empty value indicates missing data in the database.
Chart settings (3)
Sets the time interval for plotting the chart. Click Refresh Chart to plot the chart using the selected interval. Click Save Chart as... to export the chart as a JPG or BMP file.
Device status (4)
The Status section displays the number and states of active devices and sensors. To add devices or sensors, click Edit Devices & Sensors. For details, see the “Connecting sensors and devices” section.
3
2
1
Device and sensor selection (2)
To display a chart, first select a device and then a sensor connected to that device. The chart displays the measured values.
HWg-PDMS MANUAL HW group
4 / 15 www.HW-group.com
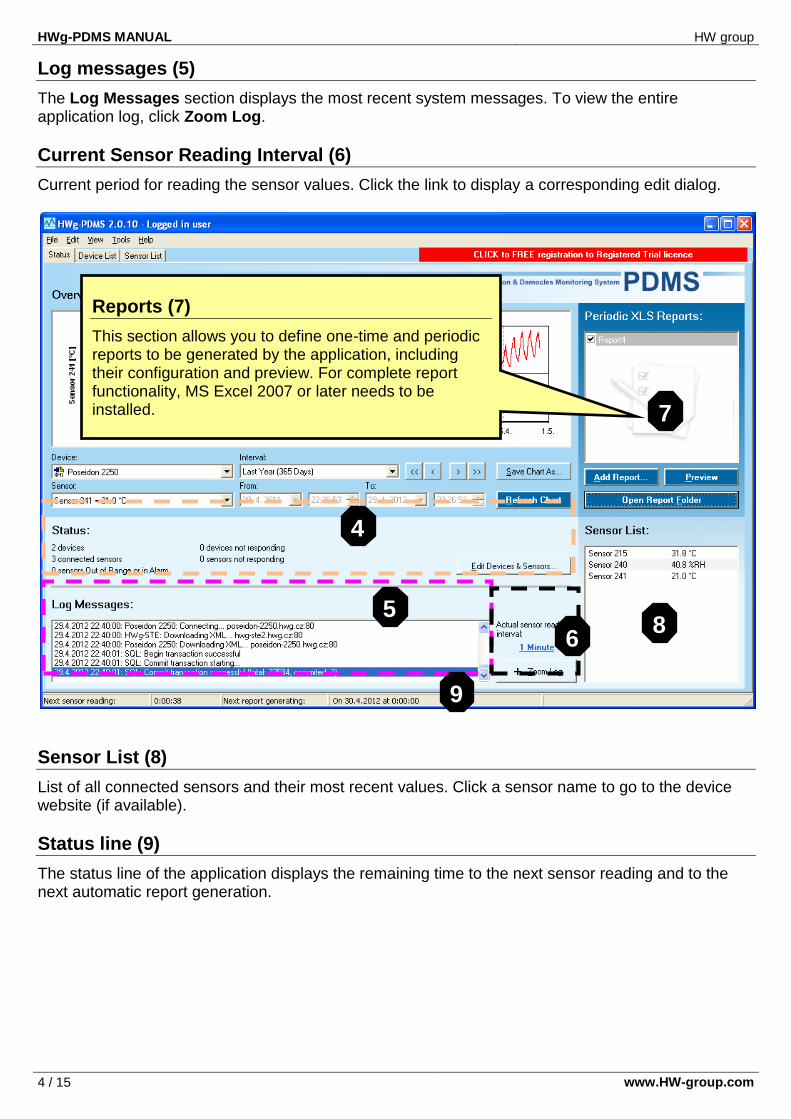
Log messages (5)
The Log Messages section displays the most recent system messages. To view the entire application log, click Zoom Log.
Current Sensor Reading Interval (6)
Current period for reading the sensor values. Click the link to display a corresponding edit dialog.
Sensor List (8)
List of all connected sensors and their most recent values. Click a sensor name to go to the device website (if available).
Status line (9)
The status line of the application displays the remaining time to the next sensor reading and to the next automatic report generation.
4
5
9
7
6 8
Reports (7)
This section allows you to define one-time and periodic reports to be generated by the application, including their configuration and preview. For complete report functionality, MS Excel 2007 or later needs to be installed.

HWg-PDMS MANUAL HW group
5 / 15 www.HW-group.com
Connecting sensors and devices
Use the Edit Devices and Sensors dialog (menu Edit or CTRL-E). To monitor sensors, devices must be first added to the list. When a device is found, a list of available sensors appears. Check the individual sensors to enable them (1). When the dialog is displayed, HWg-PDMS autodetects devices in the local network. Then, PDMS connects to the devices at specified addresses and to the configured POP3 server. To manually add a new device in a remote network, enter its address (URL or IP) in the corresponding field. After a device is added to the list, you can check the device to add all of its sensors.
1
HWg-STE is the selected device.
For this device, PDMS only displays sensor 215.

HWg-PDMS MANUAL HW group
6 / 15 www.HW-group.com
The number of monitored sensors is limited by the license type. Free Trial license of HWg-PDMS allows to monitor 3 sensors only.
For some devices, it is possible to read the values from the device log. Right-click the device in the “Device List” section.
!
Right-click the device to display this menu.
Downloads data from the device log to the internal database. Takes place automatically every few hours.

HWg-PDMS MANUAL HW group
7 / 15 www.HW-group.com
Your sensor does not have an accessible IP address? – use e-mail
If you want to use HTTP XML (polling) to connect a device, HWg-PDMS must be able to connect to the sensor IP address. This can be difficult if your IP sensor is in a server room behind a NAT (Network Address Translation) and you need to connect to this sensor remotely (e.g. from home). In this case, try to use e-mail to transfer data.
HWg-PDMS MANUAL HW group
8 / 15 www.HW-group.com
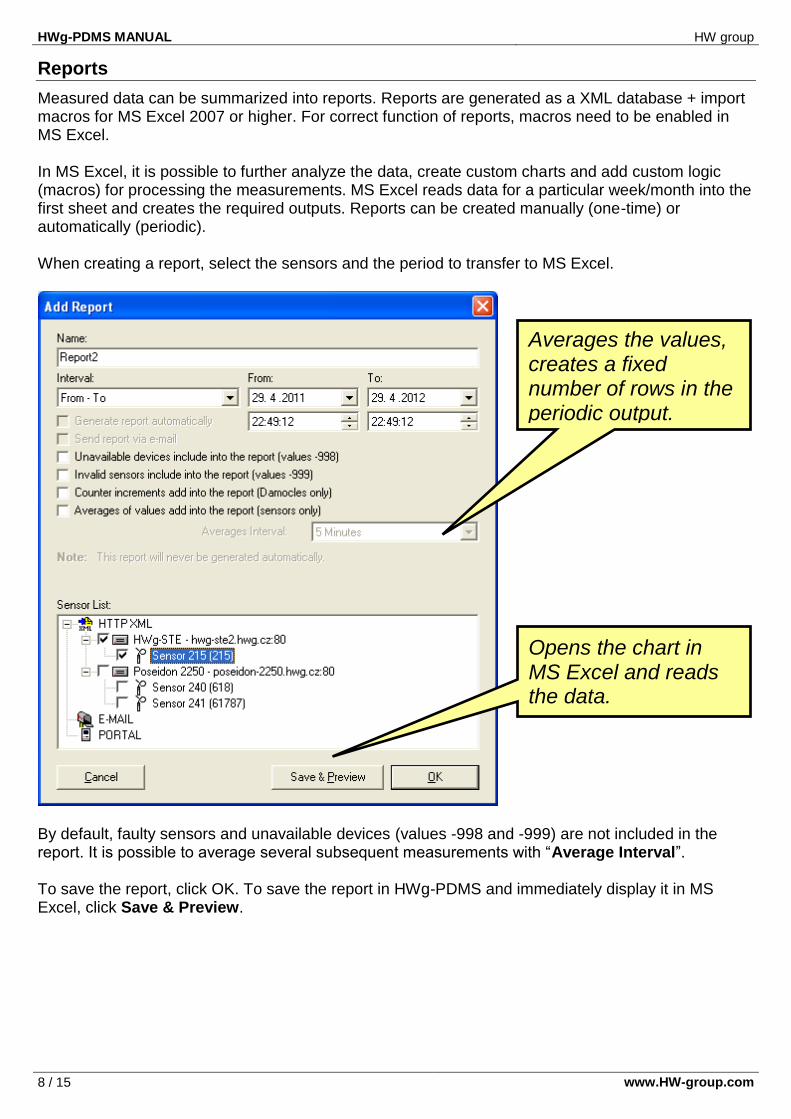
Reports
Measured data can be summarized into reports. Reports are generated as a XML database + import macros for MS Excel 2007 or higher. For correct function of reports, macros need to be enabled in MS Excel. In MS Excel, it is possible to further analyze the data, create custom charts and add custom logic (macros) for processing the measurements. MS Excel reads data for a particular week/month into the first sheet and creates the required outputs. Reports can be created manually (one-time) or automatically (periodic). When creating a report, select the sensors and the period to transfer to MS Excel.
By default, faulty sensors and unavailable devices (values -998 and -999) are not included in the report. It is possible to average several subsequent measurements with “Average Interval”. To save the report, click OK. To save the report in HWg-PDMS and immediately display it in MS Excel, click Save & Preview.
Opens the chart in MS Excel and reads the data.
Averages the values, creates a fixed number of rows in the periodic output.

HWg-PDMS MANUAL HW group
9 / 15 www.HW-group.com
Macros must be enabled in MS Excel. By default, three sheets are provided – Report, Graf - all sensors, and Graf - only first sensor.
The Report sheet contains all measured values from all sensors. Click Open XML to read the data (e.g. a weekly record) from a XML file to Excel. Retrieved values are automatically plotted at the Graf - all sensors and Graf - only first sensor sheets. To create a custom chart, click Add Graph. Here you can choose the sensors to include in the chart.
It can take a long time to import data consisting of tens of thousands of records (lines). It is therefore advisable to limit the size of reports, e.g. by averaging sensor values.
Users can add more sheets with custom data processing.
!

HWg-PDMS MANUAL HW group
10 / 15 www.HW-group.com
File menu - Global Settings
Authentication is required to access this menu. By default, you are logged in automatically, unless the password was changed in a special utility. In this case, you need to log in manually.
Global Settings – General
Configures the sensor polling period (1) and the folder for storing reports. You can also disable logging of messages to a log file.
1
!
HWg-PDMS MANUAL HW group
11 / 15 www.HW-group.com
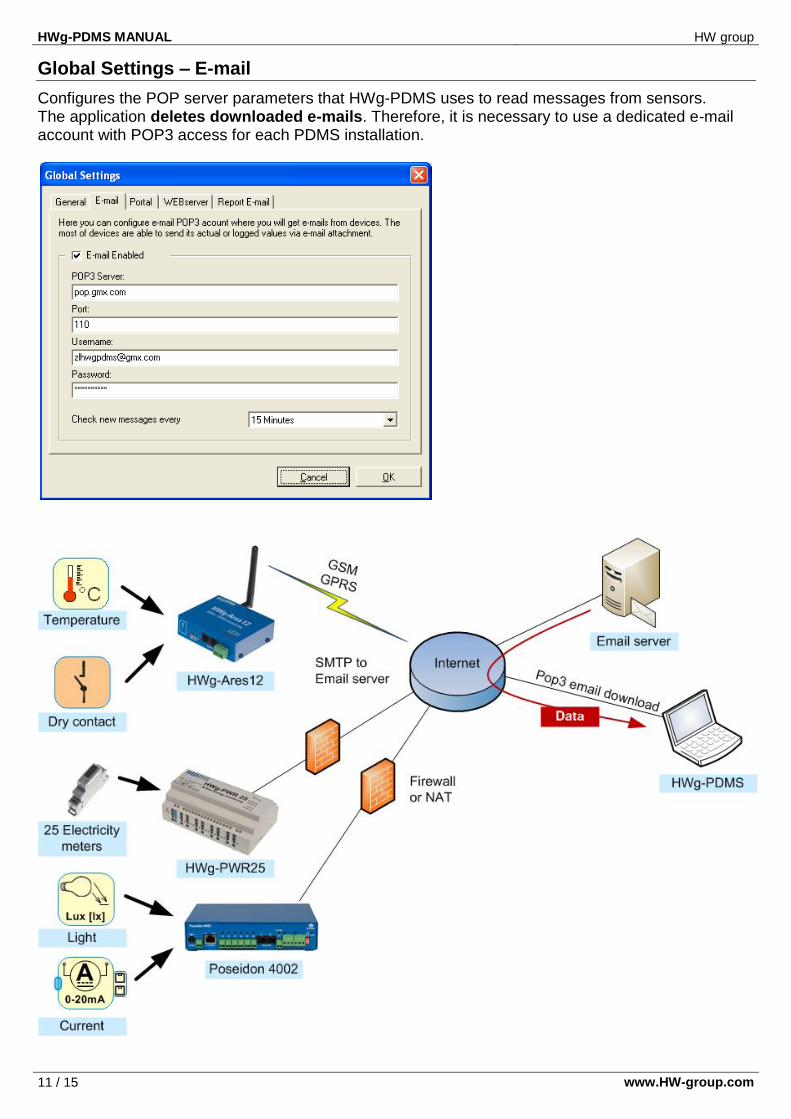
Global Settings – E-mail
Configures the POP server parameters that HWg-PDMS uses to read messages from sensors.
The application deletes downloaded e-mails. Therefore, it is necessary to use a dedicated e-mail account with POP3 access for each PDMS installation.
HWg-PDMS MANUAL HW group
12 / 15 www.HW-group.com
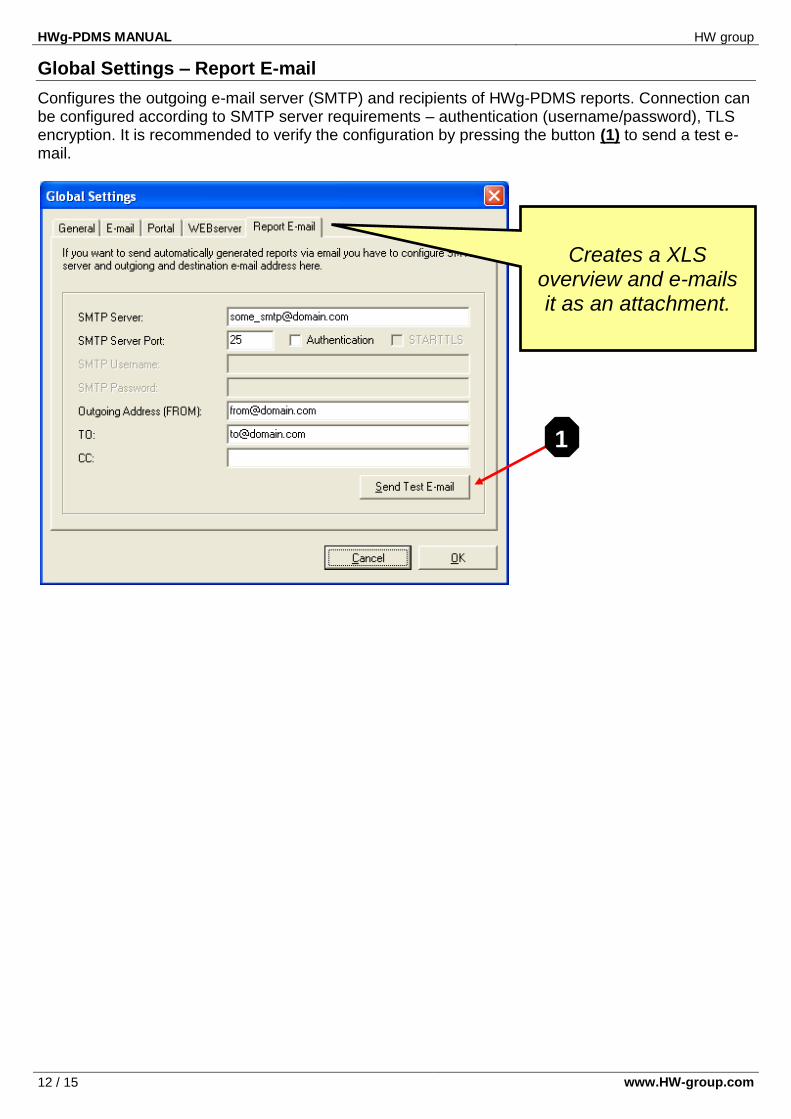
Global Settings – Report E-mail
Configures the outgoing e-mail server (SMTP) and recipients of HWg-PDMS reports. Connection can be configured according to SMTP server requirements – authentication (username/password), TLS encryption. It is recommended to verify the configuration by pressing the button (1) to send a test e-mail.
1
Creates a XLS overview and e-mails it as an attachment.
HWg-PDMS MANUAL HW group
13 / 15 www.HW-group.com
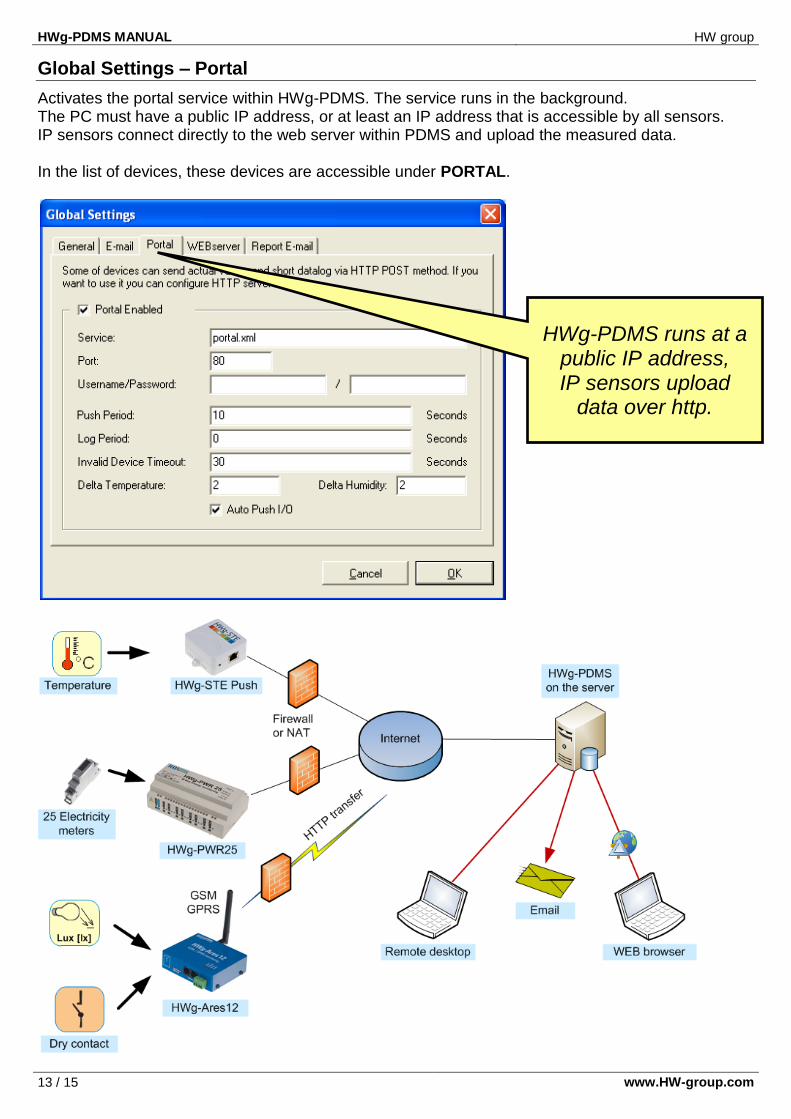
Global Settings – Portal
Activates the portal service within HWg-PDMS. The service runs in the background. The PC must have a public IP address, or at least an IP address that is accessible by all sensors. IP sensors connect directly to the web server within PDMS and upload the measured data. In the list of devices, these devices are accessible under PORTAL.
HWg-PDMS runs at a public IP address, IP sensors upload
data over http.

HWg-PDMS MANUAL HW group
14 / 15 www.HW-group.com
Global Settings – WEBserver
Creates a web server that displays current sensor states. The default port is 8080. If this port is already in use (e.g. for the proxy server in Windows 7), choose a free port, for instance 8282.
Changing the password
The “Login” sub menu verifies the user authorization for modifying the configuration – monitored devices/sensors, modifying reports and configuring other parameters. By default, no login is necessary because the application automatically uses the default password, “admin”.
To change the password, use the HWg_DCD_passwd.exe utility. It is located in the same directory as the HWg-PDMS_client.exe, by default C:\Program Files\HW-group\HWg-PDMS. After the password is changed, some functions require authentication. Unauthenticated users can change the displayed interval, update and export charts, view the log and generate content into existing report templates.
HWg-PDMS MANUAL HW group
15 / 15 www.HW-group.com
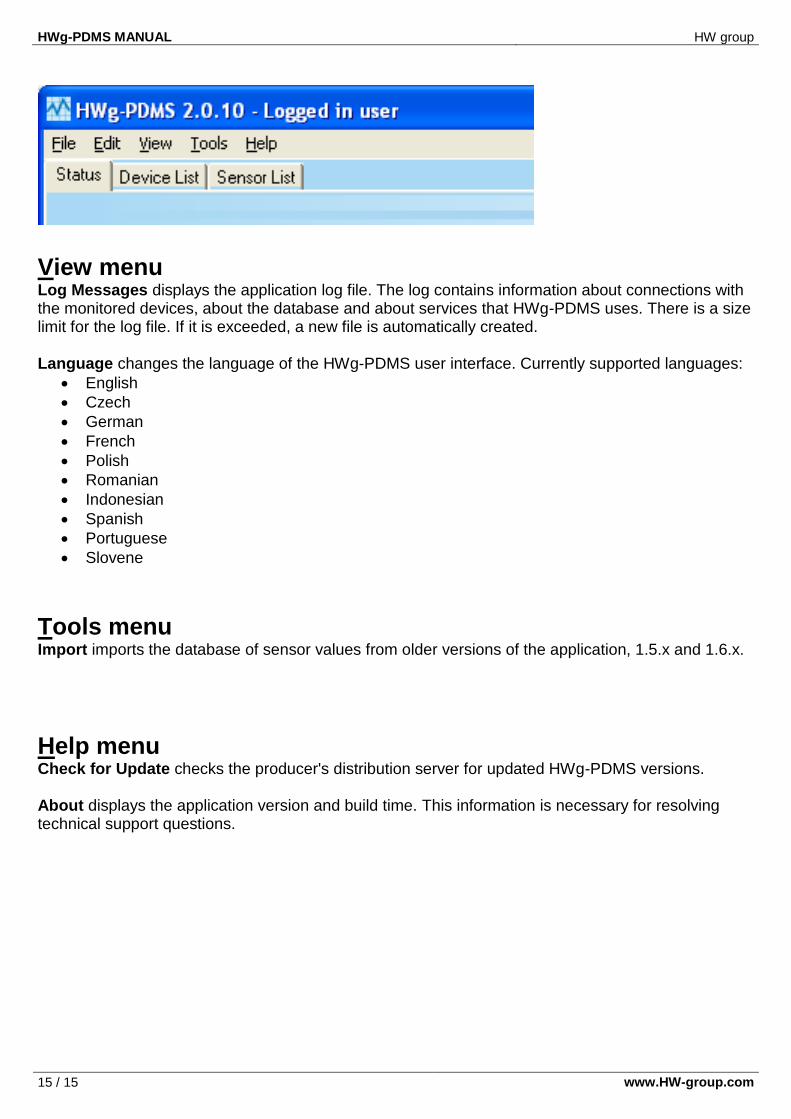
View menu Log Messages displays the application log file. The log contains information about connections with the monitored devices, about the database and about services that HWg-PDMS uses. There is a size limit for the log file. If it is exceeded, a new file is automatically created. Language changes the language of the HWg-PDMS user interface. Currently supported languages:
English
Czech
German
French
Polish
Romanian
Indonesian
Spanish
Portuguese
Slovene
Tools menu Import imports the database of sensor values from older versions of the application, 1.5.x and 1.6.x.
Help menu Check for Update checks the producer's distribution server for updated HWg-PDMS versions. About displays the application version and build time. This information is necessary for resolving technical support questions.