Introduction of NACE rev 2 in the Danish Environmental ... environmental taxes and subsidies are...
70
Introduction of NACE, rev. 2 in the Danish Accounts for Environmental Taxes and Subsidies by Thomas Olsen Statistics Denmark Ref. Ares(2012)173682 - 15/02/2012
-
Upload
phungtuyen -
Category
Documents
-
view
213 -
download
0
Transcript of Introduction of NACE rev 2 in the Danish Environmental ... environmental taxes and subsidies are...

Introduction of NACE, rev. 2 in the Danish Accounts for
Environmental Taxes and Subsidies
by
Thomas Olsen
Statistics Denmark
Ref. Ares(2012)173682 - 15/02/2012

Introduction of NACE, rev. 2 in the Danish Accounts for Environmental Taxes and Subsidies
Statistics Denmark
February 2012
Contact information:
Thomas Olsen
Senior Adviser
National Accounts - Environmental Accounts and Input-Output
Statistics Denmark
Sejroegade 11
DK-2100
Phone: +45 3917 3917
Direct: +45 3917 3828
E-mail: [email protected]

2
Preface
This report has benefited from funding by the European Commission, Eurostat, through grant agreement no.
50904.2010.004-2010.588. The grant agreement includes four reports. One entitled “Introduction of NACE, rev.2 in
the Danish Accounts for Environmental Taxes and Subsidies” together with the studies entitled “Introduction of NACE,
rev.2 in the Danish Air Emissions Accounts”, “Environmental Expenditure Accounts for Denmark 2008” and “Up to date
Input Output tables for Environmental Accounting and Analysis”.
The methods outlined in this report and the report on air emissions accounts mentioned above are in line with the
methods used for the introduction of NACE, rev. 2 in the Danish Energy Accounts, cf. the report “Introduction of
NACE, rev.2 in the Danish Energy Accounts”, which benefited from funding by the European Commission, Eurostat,
through grant agreement no. 50304.2009.001-2009.248. Therefore, several sections in this report are more or less
identical with sections found in the other two reports.
Further details on the report can be obtained by contacting the author.

3

4
Table of contents
1. SUMMARY ..................................................................................................................................... 6
2. INTRODUCTION ............................................................................................................................. 8
3. INTRODUCTION TO THE DANISH ENVIRONMENTAL TAXES AND SUBSIDIES ................................. 9
3.1. Data sources and methods ...................................................................................................... 11
3.1.1. Taxes and subsidies on products ...................................................................................................... 12
3.1.2. Taxes and subsidies on production ................................................................................................... 13
3.2. Modifying the system to contain information on every single tax and subsidy ..................... 13
3.2.1. Taxes and subsidies on products ...................................................................................................... 13
3.2.2. Taxes and subsidies on production ................................................................................................... 15
3.3. Tables with the Danish environmental taxes and subsidies (old industry classification) ....... 15
3.4. Revision policy ......................................................................................................................... 16
4. INDUSTRY CLASSIFICATIONS USED IN THE DANISH STATISTICS ................................................ 17
4.1. The old national accounts industry classification (was in use until 15 September 2011) ....... 18
4.2. The new national accounts industry classification .................................................................. 19
5. INTRODUCTION OF NACE REV. 2 IN THE ENVIRONMENTAL TAXES AND SUBSIDIES ................... 21
5.1. Relations between SUT, energy accounts and taxes and subsidies ........................................ 21
5.2. Features of the double-coded file ........................................................................................... 22
5.3. Conversion of the environmental taxes and subsides 1997 to 2006 and 2008 ........................ 23
5.4. Possible inadequacies caused by the applied method ............................................................ 24
5.5. Environmental taxes 2008 – NACE rev. 2 based classification ................................................ 24
6. REFERENCES ................................................................................................................................ 28
7. APPENDICES ................................................................................................................................ 29
7.1. Appendix: The old Danish national accounts industry classification ...................................... 29
7.2. Appendix: The new Danish national accounts industry classification ..................................... 33
7.3. Appendix: Danish total environmental taxes on production and imports .............................. 36
7.3.1. Appendix: Danish pollution1 taxes on production and imports ......................................................... 38
7.3.2. Appendix: Danish energy1 taxes on production and imports ............................................................ 40

5
7.3.3. Appendix: Danish transport taxes on production and imports ......................................................... 42
7.3.4. Appendix: Danish resource taxes on production and imports ........................................................... 44
7.4. Appendix: Danish total environmental subsidies on production and imports ........................ 46
7.4.1. Appendix: Danish pollution subsidies on production and imports .................................................... 48
7.4.2. Appendix: Danish energy subsidies on production and imports ....................................................... 50
7.4.3. Appendix: Danish transport subsidies on production and imports ................................................... 52
7.4.4. Appendix: Danish resource subsidies on production and imports ..................................................... 54
7.5. Appendix: Danish total environmental taxes, net on production and imports ....................... 56
7.5.1. Appendix: Danish pollution1 taxes, net on production and imports .................................................. 58
7.5.2. Appendix: Danish energy1 taxes, net on production and imports ..................................................... 60
7.5.3. Appendix: Danish transport taxes, net on production and imports .................................................. 62
7.5.4. Appendix: Danish resource taxes, net on production and imports ................................................... 64
7.6. Appendix: Danish CO2 and SO
2 taxes on production and imports ........................................... 66
7.6.1. Appendix: Danish CO2 taxes on production and imports .................................................................. 66
7.6.2. Appendix: Danish SO2 taxes on production and imports .................................................................. 68

Summary
6
1. Summary
The Danish environmental taxes and subsidies include information on taxes and
subsidies related to pollution, energy, transport and resources for the years 1997 to
2008.
The environmental taxes and subsidies are first of all compiled using information
from the Danish supply and use tables, which constitutes the basis for the Danish
national accounts as well as information on the tax revenues from the Public Finance
statistics. The taxes and the subsidies related to energy are also part of the Danish
monetary energy accounts.
Until 2006, in the general Danish statistical system, the economic activities were
classified by the Danish Industrial Classification of All Economic Activities 2003
(DB03), which is consistent with the NACE rev. 1.1 at the 4-digit level. The old
Danish national accounts industry classification, which was in use until 15 September
2011, was consistent with the DB03 and contained 130 industries.
With NACE, rev. 2, the Danish Industrial Classification of All Economic Activities 2007
(DB07) was introduced. For data with reference year 2007 and onwards, every
primary statistics published by Statistics Denmark have been based on this
classification. As a consequence of the DB07, a new national accounts industry
classification has been developed. At the most detailed level, this classification
contains 117 industries. The Danish national accounts and the Danish energy
accounts were published by this classification for the first time 15 September 2011.
The implementation of the new national accounts industry classification based on
NACE, rev. 2 in the Danish environmental taxes and subsidies is the main purpose of
this project. More specifically, the project deals with those environmental taxes and
subsidies, which in the national accounts is classified as taxes (or subsidies) on
products (D.21, D.31) or other taxes (or subsidies) on production (D.29, D.39).
It is important to be aware that the methods outlined very much reflect the Danish
situation and the Danish data sources. Therefore, the methods outlined might not be
directly applicable in other countries with another organisation of their data sources.
The report describes the overall process for the implementation of the new industry
classification as well as the methods and the data sources. The process and the
methods outlined are in line with the methods developed for the introduction of
NACE rev. 2 in the energy accounts and air emissions accounts. In addition, tables
showing the results are presented. One main difference between the old national accounts industry classification and the
new classification is that the new industry classification offers more detail on the
tertiary industries and less detail on the primary and secondary industries. It is important to be aware that going from the old industry classification to the new
industry classifications might affect the quality of the time series for what the
industries pay in taxes or receive in subsidies, which in Denmark goes back to 1997.
This is due to the fact that when using the conversion key based on the year 2007, for
the conversion of all years, which is the case in the conversion of the Danish energy
accounts, air emissions accounts and environmental taxes and subsidies, the relative
sizes between the industries might not be reflected correctly in a given historical year.
This uncertainty gets bigger the further back one goes compared to the year 2007.
However, when there is a direct link between the old and the new industries the
conversion is correct.

Summary
7
In the Danish system, only taxes on production and imports are broken down by
industries and households, meaning that we are not dealing with all taxes classified
as being environmentally related, cf. summary table 1 below. Summary table 2
contain information on the Danish environmental taxes on production and imports
broken down by a NACE, rev. 2 based industry classification.
Summary table 1 Total Danish environmental taxes
2000 2001 2002 2003 2004 2005 2006 2007 2008
Mill. DKK
1 Total Environmental taxes (=2+3) 68 416 69 789 73 722 72 954 82 274 92 380 100 692 99 212 99 383 2 Taxes on production and imports 56 975 58 124 61 309 60 521 66 102 69 960 72 528 72 701 68 332 2.1 Taxes on specific goods 55 364 56 353 59 357 58 632 63 974 68 266 70 732 70 829 66 422 2.2 Other production taxes 1 612 1 771 1 951 1 890 2 128 1 694 1 796 1 871 1 910 3 Taxes on income, wealth etc (3.1+3.2+3.3+3.4) 11 440 11 665 12 413 12 433 16 172 22 420 28 163 26 511 31 051 3.1 Polution taxes 0 0 0 0 0 0 0 0 0 3.2 Energy taxes 0 0 0 0 0 0 0 0 0 3.3 Transport taxes 5 485 5 884 6 174 6 262 6 338 7 137 7 570 7 886 8 049 3.3.1 Motor vehicle weight duties from households 5 318 5 634 5 992 6 127 6 206 6 999 7 425 7 735 7 895 3.3.2 Recycling fee on cars 167 250 182 135 131 138 145 151 154 3.4 Resource taxes 5 955 5 781 6 239 6 170 9 835 15 283 20 594 18 625 23 002 3.3.1 Tax on hydrocarbon 0 0 0 337 2 728 6 203 8 922 9 446 11 754 3.3.2 Corporation tax on hydrocarbon manufacturing 5 955 5 781 6 239 5 833 7 107 9 080 11 672 9 179 11 248
Summary table 2 Danish environmental taxes on production and imports 2008
Pollution taxes1
Energy taxes2
Transport taxes
Resource taxes
Total environmental
taxes
Mill. DKK
Total 3 331 36 791 24 143 4 066 68 332 Households 736 21 375 13 192 1 222 36 525 Other final demands 70 0 7 816 -1 7 885 Total industries 2 525 15 416 3 135 2 846 23 922 A Agriculture, forestry, fishing 351 902 133 2 1 387 B Mining and quarrying 1 26 4 2 522 2 553 C Manufacturing 508 2 211 258 58 3 035 D Electricity, gas and steam 23 85 14 0 122 E Water, sewerage and waste 497 353 73 2 925 F Construction 33 1 367 593 98 2 092 G Wholesale and retail trade 515 2 031 605 0 3 151 H Transportation 18 3 185 832 5 4 040 I Accommodation, food service 59 251 34 0 344 J Information and communication 40 451 68 1 560 K Financial and insurance 13 284 36 2 335 LA Real estate;rent.of non-res.b. 8 122 34 4 168 LB Dwellings 0 57 6 6 70 M Knowledge-based services 50 555 94 4 702 N Travel agent, cleaning, etc. 35 356 173 5 570 O Public adm., defence etc. 78 573 70 25 746 P Education 55 821 27 57 960 Q Human health; social work 212 1 284 38 43 1 578 R Arts and entertainment etc. 17 357 14 10 398 SA Other service activities 11 145 29 1 187 SB Households as employers 0 0 0 0 0
1 Exclusive of SO
2-taxes
2 Inclusive of SO
2-taxes

Introduction
8
2. Introduction
The purpose of this project is to implement a new industry classification based on
NACE, rev. 2 in the Danish accounts for environmental taxes and subsidies.
It is important to be aware that the methods outlined very much reflect the Danish
situation and the Danish data sources. Therefore, the methods outlined in this project
might not be directly applicable in other countries with another organisation of their
data sources. However, the methods outlined can be seen as a guide providing the
different steps and some of the aspects to bear in mind and as such, be used as a
source of inspiration.
Section 3 provides a brief introduction to the Danish environmental taxes and
subsidies and describes data sources, methods as well as results.
Section 4 is on the industry classifications used in the general Danish statistical
system as well as the Danish national accounts and hence, the energy accounts, the
air emissions accounts and the environmental taxes and subsidies. This section also
describes the relationship to the international industry classifications. The section
describes the old national accounts industry classification as well as the new industry
classification, which came into force 15 September 2011.
Section 5 is on the introduction of the new industry classification based on NACE, rev.
2 in the Danish accounts for environmental taxes and subsidies. The process and the
methods outlined are in line with the methods developed for the introduction of
NACE rev. 2 in the Danish energy accounts and the Danish air emissions accounts.
Finally, tables showing the results are presented.
More information as well as results from the Danish environmental taxes and
subsidies by Eurostat’s A64 industry classification is available in the appendices.
Purpose
Methods reflects the
Danish situation
Outline
Appendices

Introduction to the Danish Accounts for Environmental Taxes and Subsidies
9
3. Introduction to the Danish Environmental taxes and subsidies
Until 2010, Statistics Denmark published environmental taxes and subsidies for
Denmark annually as part of a general publication on environmental accounts. All
information about these taxes and subsidies was broken down by 130 industries and
final demand categories. The result was a set of tables based on which it could be
analysed, which industries and consumption groups that bear the various
environmental taxes or benefit from the subsidies.
The definition of environmental taxes used in our calculations is the definition
proposed by Eurostat cf. European Communities (2001):
A tax whose base is a physical unit (or a proxy of it) that has a proven specific negative
impact on the environment.
For subsidies, a similar definition is used as they can be seen as negative taxes. In
order to be an environmental subsidy it has to reduce the use of one or more physical
units that has proven specific negative impacts on the environment.
In line with Eurostat, Statistics Denmark divides environmental taxes into four
groups: Energy taxes, transport taxes, pollution taxes and resource taxes. Similarly,
environmental subsidies are divided into: Energy subsidies, transport subsidies,
pollution reducing subsidies and resource subsidies, European Communities (2001).
It is important to be aware that in Denmark, historically, the sulphur tax has been
grouped together with the energy taxes and not the pollution taxes, which is the norm
in the reporting to Eurostat.
Grouping of environmental taxes
Pollution taxes Energy taxes Duty on electric bulbs and fuses, etc. Of which environmental related energy taxes: Duty on certain retail containers Duty on CO
2
Duty on disposable tableware Duty on sulphur Duty on insecticides, herbicides, etc. Other energy taxes: Duty on Waste Duty on petrol Duty on CFC Duty on electricity Duty on carrier bags made of paper or plastic, etc. Duty on certain oil products Duty on nickel/cadmium batteries Duty on gas Duty on chlorinated solvents Duty on coal, etc. Duty on waste water Duty on natural gas Duty on PVC foil Duty on PVC and ftalat Duty on nitrogen Duty on lead accumulators Duty on special growth stimulants Duty on mineral phosphorus
Transport taxes Resource taxes Motor vehicle weight duty, from households Duty on extraction and import of raw materials Motor vehicle weight duty, from producers Duty on piped water Motor vehicle registration duty Duty on oil pipeline Aircraft registration duty, etc. Tax on hydrocarbon Income from sale of number-plates Corporation tax on hydrocarbon manufacturing Duty on tyres Duty on motor vehicle third-party liability insurance Passenger duty Road charges Recycling fee on cars Large yachts registration duty Duty on insurance on pleasure boats
Definition of environ-
mental taxes and subsidies
Four groups of
environmental taxes and
subsidies
Exemption
Box 1

Introduction to the Danish Accounts for Environmental Taxes and Subsidies
10
Compared to the usual boundary of the resource taxes, one could argue that the
resource taxes should also include the tax on hydrocarbon and the corporation tax on
hydrocarbon manufacturing as well, in addition to the duty on oil pipeline. These
taxes and duties related to the extraction of crude oil and natural gas in the Danish
part of the North Sea amounted to 2.2 bill. DKK in 1997 and 25.5 bill. DKK. in 2008.
Grouping of environmentally related subsidies
Pollution related subsidies Energy related subsidies Refuse disposal Production of electricity (based on renewables etc.) Compulsory set-aside premium Other subsidies from EU
1
Subsidy to fish-care Subsidy to environmental management Subsidy to industrial utilization of environmental technology
Transport related subsidies Resource related subsidies Public railways State forests Public bus transport Private railways Private bus transport
Following ESA 1995 taxes and subsidies on production are divided into two main
groups: Taxes and subsidies on products (D.21 and D.31) and other taxes and subsidies
on production (D.29 and D39). Taxes and subsidies on products are connected to
goods or services. The distribution of these taxes and subsidies by purchasing
industries and categories of final uses is made by examining how the connected goods
or services are distributed by users. Other taxes and subsidies on production do not
follow a product, but are levied on or granted to producers directly. These taxes and
subsidies are therefore only distributed by industry, and not by categories of final
uses.
Danish environmental subsidies in 2008 (DKK million)
Classification in national accounts
2008
Environmental subsidies, total 12 929
Pollution reducing subsidies 1 053 Refuse disposal Subsidies on products 567 Compulsory set-aside premium Other subsidies on production 0 Other subsidies from EU
1 Other subsidies on production 460
Subsidy to fish-care Other subsidies on production 26 Subsidy to environmental management Other subsidies on production 0 Subsidy to industrial utilization of environmental technology Other subsidies on production 0 Energy subsidies 313 Production of electricity (based on renewables etc.)
Subsidies on products 313
Transport subsidies 11 394 Public railways Subsidies on products 7 595 Public bus transport Subsidies on products 207 Private railways Other subsidies on production 1 Private bus transport Other subsidies on production 9 591 Resource subsidies 170 State forests Subsidies on products 170
Table 1 and 2 contain information on all environmental subsidies and taxes,
respectively. The type of each individual tax and subsidy is shown both in relations to
the classification in the national accounts and in relation to the categories of
environmental interest. In the Danish input-output tables and the Danish
environmental accounts focus is on taxes and subsidies on production. Therefore, the
transport tax, motor vehicle weight duty from households, which is regarded as a tax
on wealth, real property, etc., are not broken down by final demand categories.
Broader boundary for
resource taxes
Box 2
Table 1

Introduction to the Danish Accounts for Environmental Taxes and Subsidies
11
Danish environmental taxes in 2008 (DKK million)
Classification in national accounts
2008
Environmental taxes, total 99 383 Of which taxes on products Taxes on products 66 422 Of which other taxes on production Other taxes on production 1 910 Of which taxes on wealth, etc. Taxes on wealth, etc. 31 051
Pollution taxes 3 331 Duty on electric bulbs and fuses, etc. Taxes on products 178 Duty on certain retail containers Taxes on products 729 Duty on disposable tableware Taxes on products 129 Duty on insecticides, herbicides, etc. Taxes on products 570 Duty on Waste Taxes on products 1 113 Duty on CFC Taxes on products 57 Duty on carrier bags made of paper or plastic, etc. Taxes on products 211 Duty on nickel/cadmium batteries Taxes on products 12 Duty on chlorinated solvents Taxes on products 0 Duty on waste water Taxes on products 218 Duty on nitrogen Taxes on products 25 Duty on lead accumulators Taxes on products 0 Duty on special growth stimulants Taxes on products 0 Duty on PVC foil Taxes on products 13 Duty on PVC and ftalat Taxes on products 36 Duty on mineral phosphorus Taxes on products 39
Energy taxes 36 791
Of which environmental related energy taxes: 5 138 Duty on CO
2 Taxes on products 5 056
Duty on sulphur Taxes on products 82
Other energy taxes: 31 653 Duty on petrol Taxes on products 8 898 Duty on electricity Taxes on products 8 729 Duty on certain oil products Taxes on products 8 934 Duty on gas Taxes on products 0 Duty on coal, etc. Taxes on products 1 481 Duty on natural gas Taxes on products 3 610
Transport taxes 32 192 Motor vehicle weight duty, from households Taxes on wealth, real property, etc. 7 895 Motor vehicle weight duty, from producers Other taxes on production 1 910 Motor vehicle registration duty Taxes on products 19 099 Aircraft registration duty, etc. Taxes on products 0 Income from sale of number-plates Taxes on products 591 Duty on tyres Taxes on products 38 Duty on motor vehicle third-party liability insurance Taxes on products 1 976 Passenger duty Taxes on products 0 Road charges Taxes on products 412 Recycling fee on cars Taxes on wealth, real property, etc. 154 Large yachts registration duty Taxes on products 1 Duty on insurance on pleasure boats Taxes on products 119
Resource taxes 27 068 Duty on extraction and import of raw materials Taxes on products 184 Duty on piped water Taxes on products 1 372 Duty on oil pipeline Taxes on products 2 511 Tax on hydrocarbon Taxes on wealth, real property, etc. 11 754 Corporation tax on hydrocarbon manufacturing Taxes on wealth, real property, etc. 11 248
3.1. Data sources and methods
For making the tax and subsidies accounts and thus, the environmental tax and
subsidies accounts, a lot of sources are used. First of all, the tax administration system
from the central government tax authorities is used. The sources are compiled
Table 2

Introduction to the Danish Accounts for Environmental Taxes and Subsidies
12
following varying principles of registration. Therefore, some effort is made to
harmonize the information from the various sources, so that they are all in
accordance with the principles of the national accounts; e.g. recorded on an accrual
basis (this means that taxes should be recorded in the period when the obligation and
claims arise). Not until after this harmonization can the figures be used in the
national accounts.
The first information to put into the general database for taxes and subsidies is the
assessed tax revenue from every single tax and the amount given as subsidy on every
single type of subsidy. Then, taxes and subsidies on products have to be distributed by
products as one dimension and by users of the product as a second dimension i.e.
national accounts industries and different categories of final demand. Other taxes
and subsidies on production only have to be distributed by industry.
It is important to emphasize those taxes and subsidies related to environmental issues
are dealt with in the same way as any tax or subsidy on products or production
accounted for in the national accounts. The general methods are outlined below.
3.1.1. Taxes and subsidies on products
Taxes and subsidies on products are recorded in the Danish supply and use system, in
which the supply and use of approximately 2350 products are described. Taxes and
subsidies on products are, of course, only a part of this system. The general method
related to the breakdown of the taxes is in the Danish supply and use table is
described below.
First, an initial distribution of taxes and subsidies is made. In most cases, the
information only includes the products (but not the industry) to which a specific tax
or subsidy relates. This information typically comes from reading the law concerning
that specific tax. In addition to this the commodity statistics are used to estimate the
revenue from every single product on which the tax is levied. The estimation equation
used here is
iiiQTE ⋅= τ
where i present national accounts products, TE stands for estimates, τ presents
products tax rate and Q represents products quantities. In other words, the estimates
are typically something like tax rate times quantities.
In some cases more information is available, which makes it possible to distribute the
revenue from a specific tax and a specific product by industries and categories of final
use.
After having collected information on the distribution of all taxes and subsidies on
products, the information is aggregated. This means that information on the
individual types of taxes and subsidies is lost. Now, information exists about the total
net taxes on every single product. In addition, for every single product there is a
distribution by industry and categories of final use.
Finally, the aggregated data are entered in the general supply and use system. For
every product there is a supply and a distribution of uses at basic values. There is also
a distribution of uses at purchasers' value. In between the distribution of uses at basic
values and the distribution of uses at purchasers' values are the distributions of trade
margins and taxes on products, net.
At this moment supply is hardly ever equal to use for any product. Hence, the supply
and use system goes through a balancing process until supply equals use for each
product at basic prices. In this process the distribution of taxes, net can be changed
The revenue from every
single product on which
the tax is levied
Aggregation of
information
The balancing process

Introduction to the Danish Accounts for Environmental Taxes and Subsidies
13
within the industry dimension. Of course, the total for individual taxes and subsidies
is not changed.
The result is a balanced supply and use system with approximately 2350 products
where it is possible to see the tax revenue, net connected to each product distributed
by use, i.e. by industry and households etc. For each industry it is similarly possible to
see the tax, net paid distributed by products (on which the tax, net is placed).
What this standard system does not show are the individual taxes and subsidies.
3.1.2. Taxes and subsidies on production
Concerning other taxes and subsidies on production the situation is slightly less
complicated, because there is no product dimension to take into account. These taxes
and subsidies are only distributed by industries.
Several sources are used to distribute these taxes and subsidies. As for taxes and
subsidies on products, the result of the distribution system for other taxes and
subsidies on production is aggregated, i.e. information on individual taxes and
subsidies is lost. For every industry, however, the total tax, net paid can be seen.
3.2. Modifying the system to contain information on every single tax and subsidy
The above described system for taxes and subsidies on production only implicitly
contains information on the individual taxes and subsidies because of aggregation.
3.2.1. Taxes and subsidies on products
In principle, for taxes and subsidies on products the work that has to be done is to
repeat the balancing process of the supply and use system without aggregating taxes
and subsidies. Therefore, all information on distribution by product and, when
possible, also on distribution by industry, is collected again. But now the record
layout is extended to contain a code for taxes and subsidies.
Having the input data to the supply and use system in a convenient record layout, it
can now be confronted with the balanced supply and use system.
The first check to be done is to compare net taxes on every product in the input data
and in the balanced supply and use system. Differences are a result of the balancing
process. It is now necessary in each case to look carefully at what has been done in the
balancing process and to implement these changes in the input data. After this, there
is consistency in the product dimension.
As mentioned, for some taxes and subsidies complete information exists on both
product and industry distribution. This information is predetermined and is normally
not disturbed in the balancing process.
These predetermined taxes and subsidies are extracted from the balanced supply and
use system. The input data for those taxes and subsidies not predetermined can then,
after it is made consistent in the product dimension, be confronted with the similarly
reduced balanced supply and use system. It is then possible in the input data to make
a distribution by industry for each tax/subsidy and product combination using the
distribution from the reduced balanced supply and use system concerning the
product in question.
Balanced supply and use
system with approx. 2350
products
Other taxes and subsidies
are only distributed by
industries
The predetermined and
not- predetermined taxes
and subsidies

Introduction to the Danish Accounts for Environmental Taxes and Subsidies
14
The result is the input data being adjusted in a matrix with a type of tax/subsidy
dimension, a product dimension and an industry/household dimension. This matrix
is fully consistent with final national accounts figures.
Information on taxes and subsidies related to environmental issues can then be
derived from this matrix. The process is described below in the figure.
Harmonization process in connection to calculation of environmental taxes and subsidies
Taxes and subsidies on products Other taxes and subsidies on production
The information only includes the products (but not the
industry) to which a specific tax or subsidy relates
These taxes and subsidies are only distributed by
industries.
Estimation of the revenue from every single
product on which the tax is levied.
Information on the individual types of taxes and
subsidies is lost.
Aggregation
The Balancing proces
The result is a balanced supply and use system
where it is possible to see the tax revenue, net
connected to each product distributed by use,
where information abouth the individual taxes
and subsidies do not exist.
Information on the individual types of taxes and
subsidies is lost.
AggregationTh
e a
gg
reg
ate
d
data
are
en
tere
d
in
th
e g
en
era
l
sup
ply
an
d u
se
syst
em
The Balancing proces
The result is a balanced supply and use system
where it is possible to see the tax revenue, net
connected to each product distributed by use,
where information abouth the individual taxes
and subsidies do not exist.
The input data to the supply and use system
can now be confronted with the balanced
supply and use system. The predetermined
taxes and subsidies are extracted from the
balanced supply and use system. The input
data for not predetermined taxes and
subsidies can then be confronted with the
reduced balanced supply and use system.
It is then possible in the input data to make
a distribution by industry for each tax/subsidy
and product combination using the distribution
from the reduced balanced supply and use system.
The matrix with a type of tax/subsidy dimension, a product dimension and an
industry/household dimension.
The input data is balanced from the beginning.
All that has to be done is to make a code for
taxes and subsidies in the record layout and
to refrain from aggregating.
Th
e a
gg
reg
ate
d
data
are
en
tere
d
in
th
e g
en
era
l
sup
ply
an
d u
se
syst
em
Environmental taxes Other taxes Environmental subsidies Other subsidies
Pollution taxes
Energy taxes
Transport taxes
Resource taxes
Pollution subsidies
Energy subsidies
Transport subsidies
Resource subsidies
INP
UT
RE
SU
LT
SH
AR
MO
NIS
AT
ION
OF
TH
E IN
PU
TS

Introduction to the Danish Accounts for Environmental Taxes and Subsidies
15
3.2.2. Taxes and subsidies on production
For other taxes and subsidies on production, the task is easier because the input data
is balanced from the beginning. All that has to be done is to make a code for taxes and
subsidies in the record layout and to refrain from aggregating.
3.3. Tables with the Danish environmental taxes and subsidies (old industry classification)
Before the change of industry classification to the NACE, rev. 2, the above mentioned
work resulted in information on the distribution of every single tax and subsidy by
type of use (130 industries, 72 groups of consumption, etc.). In the tables below, the
taxes and subsidies are aggregated, into the four groups of environmental interest.
Table 3 Taxes on production and imports excl. of import duties (Mill. DKK) broken down by 8 industries and 2
groups of consumption. 2008
Pollution Energy Transport Resource Environ-mental
taxes, total
VAT Other taxes on
production
Taxes, total
mill. DKK
TOTAL 3 331 36 791 24 143 4 066 68 332 175 472 54 546 298 350
Other final demand 806 21 375 21 008 1 221 44 409 131 578 15 670 191 657 Consumption 736 21 375 13 192 1 222 36 525 94 757 13 382 144 664 Other final demand 70 0 7 816 -1 7 885 36 821 2 288 46 993
Industries, total 2 525 15 416 3 135 2 846 23 922 43 894 38 877 106 694
1 Agriculture, fishing and quarrying 371 998 163 2 531 4 063 112 3 289 7 464 2 Manufacturing 510 2 284 275 55 3 123 888 2 594 6 605 3 Electricity, gas and water supply 26 97 65 0 188 12 180 381 4 Construction 33 1 367 593 98 2 092 101 412 2 604 5 Wholesale and retail trade hotels, restaur. 577 2 299 648 0 3 524 1 277 3 029 7 830 6 Transport, storage and communication 31 3 428 851 6 4 316 4 321 1 103 9 741 7 Financial intermedi-ation, business act., 104 1 352 344 17 1 817 13 142 23 506 38 465 8 Public and personal services 872 3 591 195 140 4 799 24 041 4 764 33 604
Table 4 Subsidies on production broken down by 8 industries and 2 groups of consumption. 2008
Pollution Energy Transport Resource Environ. subsidies,
total
Other subsidies on
production
Subsidies, total
mill. DKK
TOTAL 1 053 313 11 394 170 12 929 32 131 45 060
Other final demand 11 163 5 120 116 5 410 902 6 312 Consumption 11 113 5 120 110 5 353 310 5 663 Other final demand -0 51 0 6 57 592 649
Industries, total 1 042 149 6 274 54 7 519 31 228 38 747
1 Agriculture, fishing and quarrying 258 13 1 788 0 2 060 6 157 8 217 2 Manufacturing 59 57 227 46 390 3 814 4 204 3 Electricity, gas and water supply 8 5 11 -0 24 107 131 4 Construction 6 2 13 1 23 1 107 1 130 5 Wholesale and retail trade hotels, restaur. 65 26 161 -0 252 3 705 3 958 6 Transport, storage and communication 69 11 1 338 -0 1 419 2 203 3 621 7 Financial intermedi-ation, business act., 271 10 1 409 -0 1 690 7 948 9 638 8 Public and personal services 304 24 1 326 6 1 661 6 188 7 849
When taxes and subsidies is taken together, cf. table 5, it can be seen that some
industries receive subsidies, net, as for example agriculture, fishing and quarrying,

Introduction to the Danish Accounts for Environmental Taxes and Subsidies
16
whereas others pay taxes, net, as for example public and personal services. In both
cases, however, environmental taxes and subsidies do not determine whether the
particular industry is a net recipient or payer. This is because the major part of total
taxes on production, net is other taxes and subsidies. This is shown in table 5.
Table 5 Taxes and subsidies on production less subsidies on production broken down by 8 industries and 2
groups of consumption. 2008
Pollution Energy Transport Resource Environ-mental
taxes, total
VAT Other taxes on
production
Taxes, total
mill. DKK
TOTAL 2 279 36 478 12 749 3 897 55 403 22 416 175 472 253 290
Other final demand 796 21 211 15 888 1 104 38 999 14 767 131 578 185 344 Consumption 726 21 262 8 072 1 112 31 171 13 072 94 757 139 000 Other final demand 70 -51 7 816 -7 7 828 1 695 36 821 46 344
Industries, total 1 483 15 267 -3.139 2 792 16 403 7 648 43 894 67 946
1 Agriculture, fishing and quarrying 113 985 -1.625 2 530 2 003 -2.868 112 -752 2 Manufacturing 450 2 227 47 9 2 733 -1.220 888 2 401 3 Electricity, gas and water supply 18 92 54 0 164 73 12 249 4 Construction 27 1 365 580 97 2 069 -695 101 1 474 5 Wholesale and retail trade hotels, restaur. 512 2 273 487 0 3 272 -676 1 277 3 872 6 Transport, storage and communication -38 3 417 -487 6 2 898 -1.099 4 321 6 120 7 Financial intermedi-ation, business act., -167 1 342 -1.064 17 127 15 558 13 142 28 827 8 Public and personal services 568 3 567 -1.131 134 3 138 -1.424 24 041 25 755
3.4. Revision policy
For the environmental taxes and subsidies, the general rule is to follow the revision
policy for the national accounts.
The general rule for the Danish national accounts and the energy accounts is that the
reference year minus two is considered final whereas the reference year and the
previous year are considered preliminary.
In the Danish national accounts, final years are only revised as part of bigger
revisions, which usually takes place only once each decade.
Revision policy

Danish industry classifications
17
4. Industry classifications used in the Danish statistics
Until 2006, in the general Danish statistical system, the economic activities were
classified by the Danish Industrial Classification of All Economic Activities 2003
(DB03). This classification was consistent with the NACE, rev. 1.1 at the 4-digit level.
With the introduction of the NACE, rev. 2, the Danish Industrial Classification of All
Economic Activities 2007 (DB07) was introduced. The work on developing DB07
began in 2005. From 2007 and onwards every statistics published by Statistics
Denmark have been based on this classification except for the national accounts, cf.
below.
DB07 is with a few exceptions fully consistent with the NACE and ISIC industry
classifications at the 4-digit level. However, at the most detailed level, DB07 has been
added another two digits to represent the Danish subdivisions. See the table below.
Relationship between Danish and International industry classifications
Classification Groups Code
ISIC rev. 3.1: UN’s former classification of economic activities
62 main groups 161 groups
298 sub-groups
first 2 digits first 3 digits first 4 digits
NACE rev. 1.1: EU’s former
classification of economic activities 62 main groups
224 groups 514 sub-groups
first 2 digits first 3 digits first 4 digits
DB03: The former Danish
classification of economic activities 61 main groups
222 groups 501 sub-groups
825 industries
first 2 digits first 3 digits first 4 digits
6 digits
ISIC rev. 4: UN’s classification of economic activities
21 main sectors 88 main groups
238 groups 419 sub-groups
1 letter first 2 digits first 3 digits first 4 digits
NACE rev. 2: EU’s classification of
economic activities 21 main sectors 88 main groups
272 groups 615 sub-groups
1 letter first 2 digits first 3 digits first 4 digits
DB07: The Danish classification of
economic activities 21 main sectors 88 main groups
272 groups 611 sub-groups
726 industries
1 letter first 2 digits first 3 digits first 4 digits
6 digits Source: Statistics Denmark (2002) and Statistics Denmark (2007).
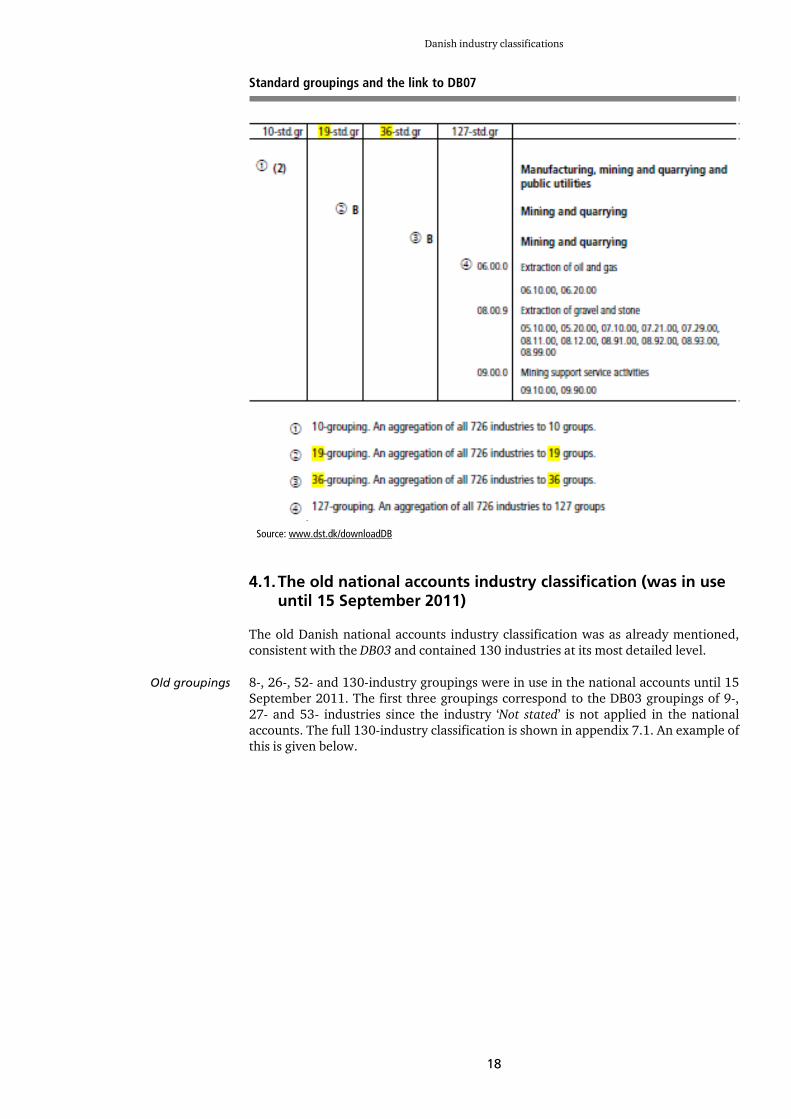
The 726 industries, which is the most detailed level in DB07, can be aggregated into
the aggregations used in the International industry classifications.
However, for the presentation of the Danish statistics published by Statistics
Denmark, the 726 industries are aggregated into four standard groupings reflecting
the features of the Danish economy. The four groupings comprise 10, 19, 36 and 127
groups respectively. An example is given below.
Industry classifications
used in the general Danish
statistical system
Groupings of DB07
Danish industry classifications
18
Standard groupings and the link to DB07
Source: www.dst.dk/downloadDB
4.1. The old national accounts industry classification (was in use until 15 September 2011)
The old Danish national accounts industry classification was as already mentioned,
consistent with the DB03 and contained 130 industries at its most detailed level.
8-, 26-, 52- and 130-industry groupings were in use in the national accounts until 15
September 2011. The first three groupings correspond to the DB03 groupings of 9-,
27- and 53- industries since the industry ‘Not stated’ is not applied in the national
accounts. The full 130-industry classification is shown in appendix 7.1. An example of
this is given below.
Old groupings

Danish industry classifications
19
Current national accounts industry classifications groupings and links to DB03
Source: Statistics Denmark (2011).
4.2. The new national accounts industry classification
As a consequence of the introduction of DB07, a new national accounts industry
classification has been developed. The Danish national accounts and the Danish
energy accounts were published by this classification for the first time 15 September
2011.
At the most detailed level, which is only used in the final version of the Danish
national accounts, this classification contains 117 industries. With that, the Danish
national accounts and the energy accounts as well as the air emissions accounts and
the information on environmental taxes and subsidies are going to be presented by
five groupings comprising 117-, 69-, 38-, 21- and 13-industries, respectively. The full
117-industry classification is shown in appendix 7.2. An example of the relationships
between the groupings is also given in appendix 7.2 and below.
New national accounts
classification
Industry classifications
used in the Danish
national accounts

Danish industry classifications
20
Relationships between new national accounts industry classification groupings
13 industries
21 industries
38 industries
69 industries
117 industries
Text
A A A Agriculture, forestry, fishing 1000 10000 Agriculture and horticulture 2000 20000 Forestry 3000 30000 Fishing B B B 6090 Mining and quarrying 60000 Extraction of oil and gas 80090 Extraction of gravel and stone 90000 Mining support service C C Manufacturing CA 10120 Manufacture of food, tobacco 100010 Production of meat 100020 Processing of fish 100030 Manufacture of dairy products 100040 Manufacture of bakery products 100050 Other manufacture of food 110000 Manufacture of beverages 120000 Manufact. of tobacco products CB 13150 Textiles and leather products 130000 Manufacture of textiles 140000 Manufacture of wearing apparel 150000 Manufacture of footwear etc. Source: Statistics Denmark (2011b)
The national accounts industry classification is consistent with the DB07 and thus
NACE, rev. 2. However, several subdivisions have been introduced in order to
account for the features of the Danish economy.
The 117-grouping is for most industries directly related to the DB07 grouping
comprising 127 industries. If the last digit in the 6-digit code is a zero then the first
five digits are identical with the DB07 127-grouping.
The groupings comprising 13 (named 10a3), 21 (named 19a2) and 38 (named 36a2)
industries are closely related to the 10-, 19- and 36-groupings of DB07 with a few
exceptions.
The 69-grouping is closely related to the 64-industry classification used for the
reporting of national accounts data to the EU.

Implementation of NACE, rev. 2 in the Danish Environmental Taxes and Subsidies
21
5. Introduction of NACE rev. 2 in the environmental taxes and subsidies
This section provides a brief description of the data sources and methods used in
order to be able to implement the new industry classification based on the NACE, rev.
2 in the Danish accounts for environmental taxes and subsidies. In reality, the
introduction of NACE rev. 2 in the environmental taxes and subsides heavily relies on
the work carried out in relation to the introduction of NACE rev. 2 in the supply and
use tables and the energy accounts, which constitute important data sources to the
environmental taxes and subsidies. Please see Olsen (2010) and Statistics Denmark
(2011).
The methods outlined describe the conversion of the historical years in the existing
time series. New reference years from 2008 and onwards will be based on the supply
and use tables and the energy accounts based on the new industry classification and
the methods outlined in section 3.
5.1. Relations between SUT, energy accounts and taxes and subsidies
In Denmark, the energy taxes and energy subsidies part of the environmental taxes
and subsidies are based directly on the information in the energy accounts. For other
types of environmental taxes and subsidies, the description of the environmental
taxes and subsidies is closely related to the description of the use of products in the
supply and use tables. The introduction of the industry classification based on the
NACE, rev. 2 in the accounts for environmental taxes and subsidies is thus very much
linked to the introduction of the new industry classification in the energy accounts
and the national accounts.
The Danish energy accounts are organised in such a way that they are directly
compatible with the national accounts at the most detailed level. However, in relation
to taxes and subsidies, the monetary energy accounts offer more detail, which can be
used in relation to the introduction of NACE, rev. 2 in the environmental taxes and
subsidies.
The supply and use tables (SUT) of the Danish national accounts contain
approximately 2350 products among which 25 energy products, which are, as already
mentioned, also described in the energy accounts. However, the 25 energy products
in the SUT is an aggregation of the 40 energy products accounted for in the energy
accounts. Furthermore, in the SUT, all types of taxes and subsidies related to a
product are grouped into one single figure. In the energy accounts, the information is
grouped into energy taxes, CO2 taxes and SO
2 taxes.
This very detailed level of information in the Danish national accounts is only
compiled as part of the final version of the national accounts, which is published with
a time lag of a little less than three years.
The implementation of the DB07 was carried out at the most detailed level in the
supply and use tables.
For more information on the introduction of NACE, rev. 2 in the Danish national
accounts, please see Statistics Denmark (2011).
The national accounts and the energy accounts will be fully based on primary
statistics based on DB07 for data with reference year 2008 and onwards.
Energy accounts and
supply and use tables plays
an important role
Close relationship with the
national accounts
Danish system of supply
and use tables
Implementation of NACE, rev. 2 in the Danish Environmental Taxes and Subsidies
22
Relationship between the primary statistics and the national accounts
2006 20082007 2009 2010 2011 2012
Primary statistics
Final
National Accounts
Energy Accounts
Old OldOld Old Old New New
200720082009
20082009
2010
200920102011
20062007
2008
200520062007
20042005
2006
200320042005
DB03
2005
Classification
Reference year
Old
2003
DB03
2006
DB03 DB07
2007
DB07
2008
DB07
2009
DB07
2010
DB07
2011
Old
2004
Old
2005
Old
2006
Old
2007
New
2008
New
2009
Classification
Reference year
Classification
Reference year
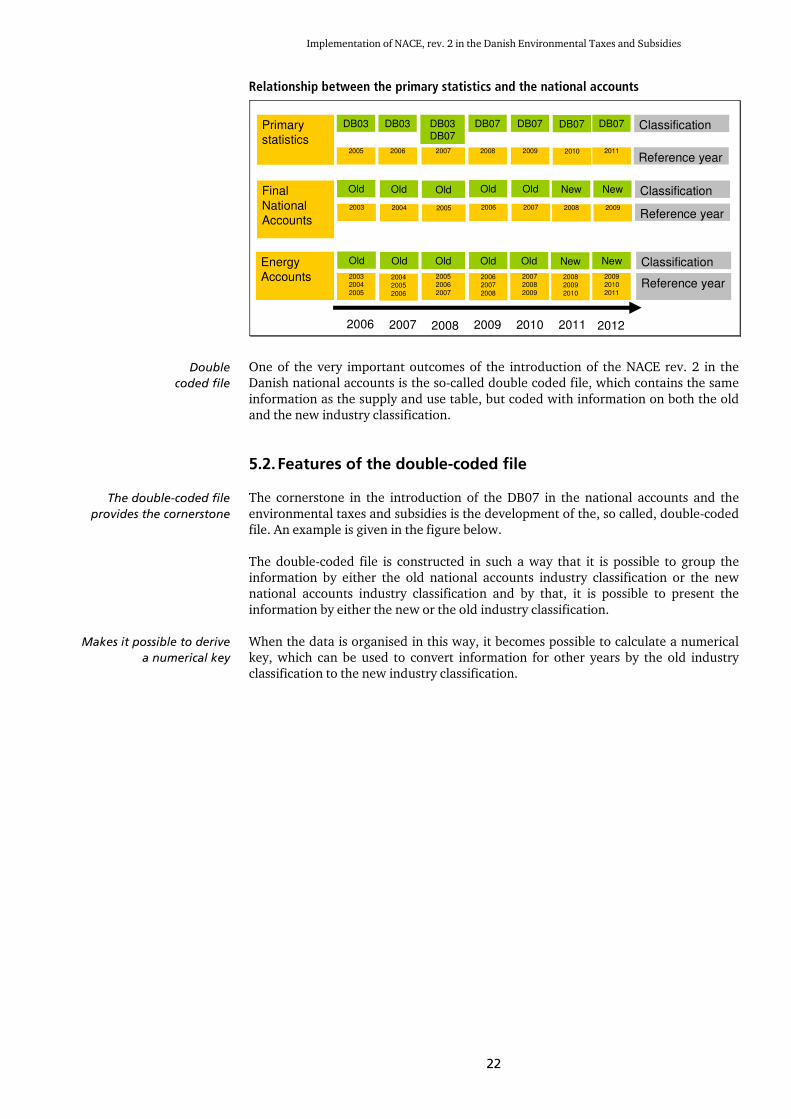
One of the very important outcomes of the introduction of the NACE rev. 2 in the
Danish national accounts is the so-called double coded file, which contains the same
information as the supply and use table, but coded with information on both the old
and the new industry classification.
5.2. Features of the double-coded file
The cornerstone in the introduction of the DB07 in the national accounts and the
environmental taxes and subsidies is the development of the, so called, double-coded
file. An example is given in the figure below.
The double-coded file is constructed in such a way that it is possible to group the
information by either the old national accounts industry classification or the new
national accounts industry classification and by that, it is possible to present the
information by either the new or the old industry classification.
When the data is organised in this way, it becomes possible to calculate a numerical
key, which can be used to convert information for other years by the old industry
classification to the new industry classification.
Double
coded file
The double-coded file
provides the cornerstone
Makes it possible to derive
a numerical key

Implementation of NACE, rev. 2 in the Danish Environmental Taxes and Subsidies
23
Example: Part of a double coded file for a single energy product
An example of the distribution key that can be derived from the double coded file is
given in the table below.
Example: Taxes related to natural gas - bridge between old and new classifications
Old National Accounts industry classification From
Old to
New
New National Accounts industry classification
Per cent 310000 Mfr. of other electrical machinery and app. 30 260010 Manufact. of computers, etc. 310000 Mfr. of other electrical machinery and app. 18 270010 Mfr. of motors, etc. 310000 Mfr. of other electrical machinery and app. 17 270020 Mfr. of wires, cables 310000 Mfr. of other electrical machinery and app. 15 270030 Manuf.of household appl. etc. 310000 Mfr. of other electrical machinery and app. 19 280010 Mfr. of engines etc. 310000 Mfr. of other electrical machinery and app. 1 330000 Repair, inst. of machinery etc Data by the old classification is converted to the new classification by multiplying with the percentage in the shaded
column.
5.3. Conversion of the environmental taxes and subsides 1997 to 2006 and 2008
For the taxes and subsidies on products, the conversion is based on the relationship
between the types of environmental taxes and subsides and the products to which
they are related. Given this relationship, a conversion key can be derived from the
double coded file for 2007.
For the taxes and subsidies on production, the conversion key is also derived from the
double coded file for 2007. However, the conversion key is in this case based on all
inputs in the industry and how this input relates to the new industries.
The environmental taxes and subsidies for every year between 1997 to 2006 and
2008 have been converted by multiplying the taxes and subsidies with the conversion
key related to the specific tax or subsidy.
2007 Double - coded file
Old national accounts industry New national accounts industry Old
code
New
code
Physical
quantities
Heating
values
Basic prices Trade
margins
Taxes
(Energy,
CO2, SO2)
VAT Market
prices
Agriculture Agriculture, forestry, fishing 011009 010000
Horticulture, orchards etc. Agriculture, forestry, fishing 011209 010000
Agricultural services; landscape gardeners etc. Agriculture, forestry, fishing 014001 010000
Agricultural services; landscape gardeners etc. Services to buildings,cleaning 014001 810000
Stadsgartnere, ikke-markedsm. Services to buildings,cleaning 014002 810000
Forestry Forestry 020000 020000
Fishing Fishing 050000 030000
Extr. of crude petroleum, natural gas etc. Extraction of oil and gas 110000 060000
Extr. of crude petroleum, natural gas etc. Mining support service 110000 090000
Extr. of gravel, clay, stone and salt etc. Extraction of gravel and stone 140009 080090
Production etc. of meat and meat products Production of meat 151000 100010
Processing etc. of fish and fish products Processing of fish 152000 100020
Processing etc. of fish and fish products Other manufacture of food 152000 100050
Processing etc. of fruit and vegetables Other manufacture of food 153000 100050
Mfr. of vegetable and animal oils and fats Other manufacture of food 154000 100050
Mfr. of dairy products Manufacture of dairy products 155000 100030
… … … …
… … … …
Monetary Energy AccountsPhysical Energy Accounts
Double coded file on physical
quantities based on primary
statistics.
Double coded information based on
numerical key derived from double
coded file.
Methods

Implementation of NACE, rev. 2 in the Danish Environmental Taxes and Subsidies
24
Illustration of the method applied to the conversion of specific reference years
5.4. Possible inadequacies caused by the applied method
It is important to be aware that going from the old industry classification to the new
industry classifications might affect the quality of the time series for the
environmental taxes and subsidies, which in Denmark goes back to 1997.
One possible shortcoming with the method outlined above, is that when using the
same conversion key for the conversion of all years, the relative sizes between the
industries might not be reflected correctly in a given historical year, e.g. Software
consultancy and supply cannot be said to have the same size relative to other
industries in 1997 as in 2007.
However, it is important to emphasize that this shortcoming is only relevant for
industries where there is no direct link between the former and the new industry
classification. It is of course important to be aware that this uncertainty gets bigger
the further back one goes compared to the year 2007.
5.5. Environmental taxes 2008 – NACE rev. 2 based classification
When we compare the most detailed level in the old national accounts industry
classification that is 130 industries, with the most detailed level in the new national
accounts industry classification that is the 117 industries, it is obvious that the new
industry classification offers more detail on the tertiary industries and less detail on
the primary and secondary industries than the old classification did. See appendix 7.1
and 7.2.
With that, when the focus is on environmental taxes and subsidies (and air emissions
and energy) the new industry classification offers less detailed information on
especially the manufacturing industries, whose activities have the biggest
environmental impact, whereas it offers more detailed information on the private and
public service industries, whose activities have a more limited environmental impact.
Conversion
affect quality
Shortcomings
Less detailed information
on primary and secondary
industries…
… means less detailed
information on the
manufacturing industries’
use of energy

Implementation of NACE, rev. 2 in the Danish Environmental Taxes and Subsidies
25
The environmental taxes classified by the new industry classification are shown
below in table 6. The industries shown in the table are equal to the 19a2-grouping of
the new industry classification.
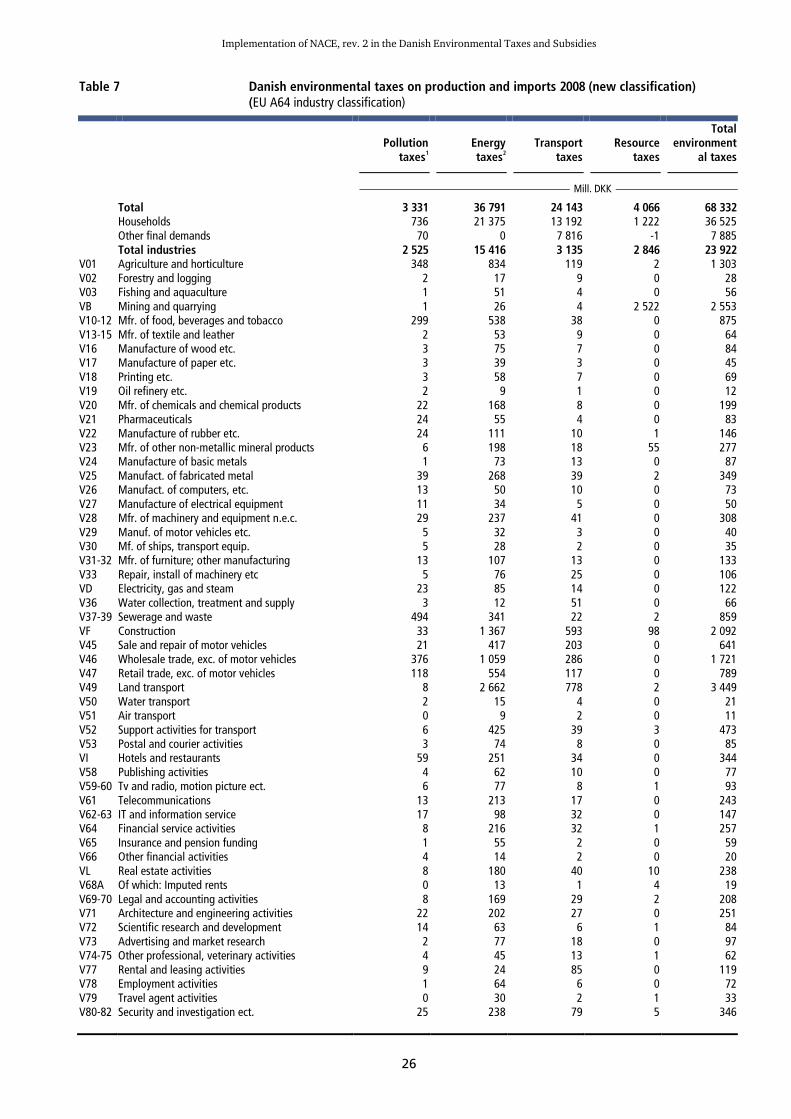
In table 7, the same information is shown but by the new industry classification used
for the reporting of national accounts data to Eurostat (A64).
Table 6. Danish environmental taxes on production and imports 2008 (NACE rev. 2 based class.)
Pollution taxes1
Energy taxes2
Transport taxes
Resource taxes
Total environmental
taxes
Mill. DKK
Total 3 331 36 791 24 143 4 066 68 332 Households 736 21 375 13 192 1 222 36 525 Other final demands 70 0 7 816 -1 7 885 Total industries 2 525 15 416 3 135 2 846 23 922 A Agriculture, forestry, fishing 351 902 133 2 1 387 B Mining and quarrying 1 26 4 2 522 2 553 C Manufacturing 508 2 211 258 58 3 035 D Electricity, gas and steam 23 85 14 0 122 E Water, sewerage and waste 497 353 73 2 925 F Construction 33 1 367 593 98 2 092 G Wholesale and retail trade 515 2 031 605 0 3 151 H Transportation 18 3 185 832 5 4 040 I Accommodation, food service 59 251 34 0 344 J Information and communication 40 451 68 1 560 K Financial and insurance 13 284 36 2 335 LA Real estate;rent.of non-res.b. 8 122 34 4 168 LB Dwellings 0 57 6 6 70 M Knowledge-based services 50 555 94 4 702 N Travel agent, cleaning, etc. 35 356 173 5 570 O Public adm., defence etc. 78 573 70 25 746 P Education 55 821 27 57 960 Q Human health; social work 212 1 284 38 43 1 578 R Arts and entertainment etc. 17 357 14 10 398 SA Other service activities 11 145 29 1 187 SB Households as employers 0 0 0 0 0
1 Exclusive of SO
2-taxes
2 Inclusive of SO
2-taxes
Results shown
in table 6 …
… and in
table 7
Implementation of NACE, rev. 2 in the Danish Environmental Taxes and Subsidies
26
Table 7 Danish environmental taxes on production and imports 2008 (new classification) (EU A64 industry classification)
Pollution
taxes1
Energy taxes
2
Transport
taxes
Resource
taxes
Total environment
al taxes
Mill. DKK
Total 3 331 36 791 24 143 4 066 68 332 Households 736 21 375 13 192 1 222 36 525 Other final demands 70 0 7 816 -1 7 885 Total industries 2 525 15 416 3 135 2 846 23 922 V01 Agriculture and horticulture 348 834 119 2 1 303 V02 Forestry and logging 2 17 9 0 28 V03 Fishing and aquaculture 1 51 4 0 56 VB Mining and quarrying 1 26 4 2 522 2 553 V10-12 Mfr. of food, beverages and tobacco 299 538 38 0 875 V13-15 Mfr. of textile and leather 2 53 9 0 64 V16 Manufacture of wood etc. 3 75 7 0 84 V17 Manufacture of paper etc. 3 39 3 0 45 V18 Printing etc. 3 58 7 0 69 V19 Oil refinery etc. 2 9 1 0 12 V20 Mfr. of chemicals and chemical products 22 168 8 0 199 V21 Pharmaceuticals 24 55 4 0 83 V22 Manufacture of rubber etc. 24 111 10 1 146 V23 Mfr. of other non-metallic mineral products 6 198 18 55 277 V24 Manufacture of basic metals 1 73 13 0 87 V25 Manufact. of fabricated metal 39 268 39 2 349 V26 Manufact. of computers, etc. 13 50 10 0 73 V27 Manufacture of electrical equipment 11 34 5 0 50 V28 Mfr. of machinery and equipment n.e.c. 29 237 41 0 308 V29 Manuf. of motor vehicles etc. 5 32 3 0 40 V30 Mf. of ships, transport equip. 5 28 2 0 35 V31-32 Mfr. of furniture; other manufacturing 13 107 13 0 133 V33 Repair, install of machinery etc 5 76 25 0 106 VD Electricity, gas and steam 23 85 14 0 122 V36 Water collection, treatment and supply 3 12 51 0 66 V37-39 Sewerage and waste 494 341 22 2 859 VF Construction 33 1 367 593 98 2 092 V45 Sale and repair of motor vehicles 21 417 203 0 641 V46 Wholesale trade, exc. of motor vehicles 376 1 059 286 0 1 721 V47 Retail trade, exc. of motor vehicles 118 554 117 0 789 V49 Land transport 8 2 662 778 2 3 449 V50 Water transport 2 15 4 0 21 V51 Air transport 0 9 2 0 11 V52 Support activities for transport 6 425 39 3 473 V53 Postal and courier activities 3 74 8 0 85 VI Hotels and restaurants 59 251 34 0 344 V58 Publishing activities 4 62 10 0 77 V59-60 Tv and radio, motion picture ect. 6 77 8 1 93 V61 Telecommunications 13 213 17 0 243 V62-63 IT and information service 17 98 32 0 147 V64 Financial service activities 8 216 32 1 257 V65 Insurance and pension funding 1 55 2 0 59 V66 Other financial activities 4 14 2 0 20 VL Real estate activities 8 180 40 10 238 V68A Of which: Imputed rents 0 13 1 4 19 V69-70 Legal and accounting activities 8 169 29 2 208 V71 Architecture and engineering activities 22 202 27 0 251 V72 Scientific research and development 14 63 6 1 84 V73 Advertising and market research 2 77 18 0 97 V74-75 Other professional, veterinary activities 4 45 13 1 62 V77 Rental and leasing activities 9 24 85 0 119 V78 Employment activities 1 64 6 0 72 V79 Travel agent activities 0 30 2 1 33 V80-82 Security and investigation ect. 25 238 79 5 346

Implementation of NACE, rev. 2 in the Danish Environmental Taxes and Subsidies
27
Pollution
taxes1
Energy taxes
2
Transport
taxes
Resource
taxes
Total environment
al taxes
Mill DKK
VO Public administration and defence 78 573 70 25 746 VP Education 55 821 27 57 960 V86 Human health activities 84 487 17 13 601 V87-88 Social work activities 128 797 22 30 977 V90-92 Creative, arts and entertainment activities 10 210 8 6 234 V93 Sports activities 7 147 5 4 164 V94 Activities of membership organisations 4 86 5 1 96 V95 Repair of personal goods 4 28 14 0 45 V96 Other personal service activities 3 31 11 0 45 VT Households as employers 0 0 0 0 0
1 Exclusive of SO
2-taxes
2 Inclusive of SO
2-taxes

References
28
6. References
ESA 1995: European System of Accounts 1995. Eurostat (1996).
European Commission (2001). Environmental Taxes – A statistical guide
Methods and nomenclatures.
Olsen, Thomas (2011): Introduction of NACE rev. 2 in the Danish Energy Accounts.
Statistics Denmark. European Commission, Eurostat – Unit E-3. Grant
agreement no. 50304.2009.001-2009.248
Olsen, Thomas (2012): Introduction of NACE rev. 2 in the Danish Air Emissions
Accounts. Statistics Denmark. European Commission, Eurostat – Unit E-3. Grant
agreement no. 50904.2010.004-2010.588
Statistics Denmark (2002): Danish Industrial Classification of All Economic Activities
2003. Publication in Danish.
Statistics Denmark (2007): Danish Industrial Classification of All Economic Activities
2007. Publication in Danish.
Statistics Denmark (2010d): Danish Environmental Accounts 2008. Publication in
Danish.
Statistics Denmark (2011): New industry classification based on NACE ver. 2 in the
Danish National Accounts. [Online] 31 January 2102. Available on the Internet:
<http://www.dst.dk/da/Statistik/dokumentation/~/media/
19E81364A68A4BC78212B43808C761E2.pdf>

Appendices
29
7. Appendices
7.1. Appendix: The old Danish national accounts industry classification
Groupings The old Danish national accounts industry classification (was in use until 15 September 2011)
8 26 52 130
1 Agriculture, fishing and quarrying
0109 Agriculture, horticulture and forestry
01109 011009 Agriculture
01129 011209 Marked gardening
01400 014000 Machine pools and landscape gardening
02000 020000 Forestry
0500 05000 050000 Fishing
1009 Mining and quarrying
11000 110000 Extr. of oil and natural gas
14009 140009 Extr. of gravel and clay etc.
2 Manufacturing
1509 15009 Mfr. of food, beverages and tobacco
151000 Production etc. of meat and meat products 152000 Processing and preserving of fish and fish products 153000 Processing and preserving of fruit and vegetables 154000 Mfr. of vegetable and animal oils and fats 155000 Mfr. of dairy products 156009 Mfr. of starch, chocolate and sugar products 158109 Mfr. of bread, cakes and biscuits 158120 Baker’s shops 158300 Manufacture of sugar 159000 Manufacture of beverages 160000 Manufacture of tobacco products
1709 17009 Mfr. of textiles and leather
170000 Mfr. of textiles 180000 Mfr. of wearing apparel 190000 Mfr. of leather and footwear
2009 Mfr. of wood products, printing and publ.
20000 200000 Mfr. of wood and wood products
21009 Mfr. of paper prod.; printing and publish.
210000 Mfr. of pulp, paper and paper products 221200 Publishing of newspapers 221309 Publishing activities, excluding newspapers 222009 Printing activities
2309 Mfr. of chemicals, plastic products etc.
23000 230000 Mfr. of refined petroleum products etc.
24000 Mfr. of chemicals
241109 Mfr. of industrial gases and inorganic basic chemicals
241209 Mfr. of dyes, pigments and organic basic chemicals
241500 Manufacture of fertilizers 241617 Mfr. of plastics and synthetic rubber 242000 Manufacture of pesticides and other
agro-chemical products 243000 Mfr. of paints, varnishes and similar coatings, printing ink and mastics 244000 Mfr. of pharmaceuticals etc. 245070 Mfr. of detergents and other chemical products

Appendices
30
Appendix 7.1, continued
Groupings The old Danish national accounts industry classification (was in use until 15 September 2011)
8 26 52 130
25000 Mfr. of rubber and plastic products
251122 Mfr. of rubber products and plastic packing goods etc. 252300 Mfr. of builders' ware of plastic 252400 Manufacture of other plastic products n.e.c.
2600 26000 Mfr. of other non-metallic mineral products
261126 Mfr. of glass and ceramic goods etc. 263053 Mfr. of cement, bricks, tiles, flags etc. 266080 Mfr. of concrete, cement, asphalt and rockwool products
2709 Mfr. of basic metals and fabr. metal prod.
27009 Mfr. and processing of basic metals
271000 Mfr. of basic iron and steel and of ferro alloys 272030 First processing of iron and steel 274000 Mfr. of basic non-ferrous metals 275000 Casting of metal products 281009 Mfr. of building materials of metal 286009 Mfr. of various metal products
29000 Mfr. of machinery and equipment
291000 Mfr. of marine engines and compressors 292000 Mfr. of ovens and cold-storage plants 293000 Mfr. of agricultural machinery 294009 Mfr. of machinery for industries 297000 Mfr. of domestic appliances
30009 Mfr. of electrical components
300000 Mfr. of office machinery and computers 310000 Mfr. of other electrical machinery and apparatus 320000 Mfr. of radio and communication equipment 330000 Mfr. of medical and optical instruments
35009 Mfr. of transport equipment
340000 Manufacture of motor vehicles etc. 351000 Building and repairing of ships and boats 352050 Mfr. of transport equipment
excl. ships, motor vehicles etc.
3600 36000 Mfr. of furniture; manufacturing n.e.c.
361000 Mfr. of furniture 362060 Mfr. of toys, gold and silver articles etc. 370000 Recycling of waste and scrap
3 4009 40009 Electricity, gas and water supply 401000 Production and distribution of electricity 402000 Manufacture and distribution of gas 403000 Steam and hot water supply 410000 Collection and distribution of water
4 4500 45000 Construction 450001 Construction of new buildings 450002 Repair and maintenance of buildings 450003 Civil engineering 450004 Construction materials for own-account repair

Appendices
31
Appendix 7.1, continued
Groupings The old Danish national accounts industry classification (was in use until 15 September 2011)
8 26 52 130
5 Wholesale and retail trade; hotels, restaurants
5000 50000 Sale and repair of motor vehicles, sale of auto. fuel
501009 Sale of motor vehicles and motorcycles 502000 Maintenance and repair of motor vehicles 505000 Retail sale of automotive fuel
5100 51000 510000 Wholesale except of motor vehicles
5200 Re. trade and repair work exc. of m. vehicles
52109 521090 Retail trade of food
52299 522990 Department stores
52300 523000 Re. sale of phar. goods, cosmetic art.
52419 524190 Re. sale of clothing and footwear
52449 524490 Other retail sale, repair work
5500 55000 Hotel and restaurants
551009 Hotels 553009 Restaurants
6 Transport, post and telecommunication
6009 Transport
60000 Land transport and transport via pipelines
601000 Transport via railways 602100 Other scheduled passenger land transport 602223 Taxi operation and coach services 602409 Freight transport by road and via pipelines
61000 610000 Water transport
62000 620000 Air transport
63000 Supporting transport activities
631130 Cargo handling, harbours etc., travel agencies 634000 Activities of other transport agencies
6400 64000 640000 Post and telecommunications
7 Finance and business activities
6509 Finance and insurance
65000 Finance
651000 Financial institutions 652000 Mortgage credit institutions
66000 Insurance
660102 Life insurance and pension funding 660300 Non-life insurance
67000 670000 Activities auxiliary to finance
7009 Letting and sale og real estate
70000 Real estate activities
701109 Real estate agents etc. 702009 Dwellings 702040 Letting of non-residential buildings
71000 710000 Renting of transport equipment and machinery

Appendices
32
Appendix 7.1, continued
Groupings The old Danish national accounts industry classification (was in use until 15 September 2011)
8 26 52 130
7209 Business activities
72000 Computer and related activities
721009 Computer activities exc. software consultancy and supply
722000 Software consultancy and supply
73000 Research and development
730001 Research and development (market) 730002 Research and development (other non-market)
74000 Consultancy and cleaning activities etc.
741100 Legal activities 741200 Accounting, book-keeping, auditing 742009 Consulting engineers, architects 744000 Advertising 747000 Building-cleaning activities 748009 Other business activities
8 Public and personal services
7500 75000 Public administration
751100 General (overall) public service activities 751209 Administration of public sectors
exc. for business 751300 Regulation of and contribution to more
efficient operation of business 752000 Defence, police and administration of justice
8000 80000 Education
801000 Primary education 802000 Secondary education 803000 Higher education 804001 Adult and other education (market) 804002 Adult and other education (other non-market)
8519 85109 Health care activities
851100 Hospital activities 851209 Medical, dental and veterinary activities
8539 Social institutions etc.
85319 853109 Social institutions etc. for children
85329 853209 Social institutions etc. for adults
9009 Associations, culture and refuse disposal
90000 Sewage and refuse disp. and similar act.
900010 Sewage removal and purifying plants 900020 Refuse collection and sanitation 900030 Refuse dumps and refuse disposal plants
91000 910000 Activities of membership organizations
92000 Recreational, cultural, sporting activities
920001 Recreational, cultural, sporting activities (market) 920002 Recreational, cultural, sporting activities
(other non-market)
93009 Other service activities
930009 Other service activities 950000 Private households with employed persons

Appendices
33
7.2. Appendix: The new Danish national accounts industry classification
Groupings DB07 New Danish national accounts industry classification
13 21 38 69 117 127-standard grp.
A A A Agriculture, forestry, fishing 01000 010000 01000 Agriculture and horticulture 02000 020000 02000 Forestry 03000 030000 03000 Fishing
B B B 06090 Mining and quarrying 060000 06000 Extraction of oil and gas 080090 08009 Extraction of gravel and stone 090000 09000 Mining support service
C C Manufacturing
CA 10120 Manufacture of food, tobacco 100010 10001 Production of meat 100020 10002 Processing of fish 100030 10003 Manufacture of dairy products 100040 10004 Manufacture of bakery products 100050 10005 Other manufacture of food 110000 11000 Manufacture of beverages 120000 12000 Manufact. of tobacco products
CB 13150 Textiles and leather products 130000 13000 Manufacture of textiles 140000 14000 Manufacture of wearing apparel 150000 15000 Manufacture of footwear etc.
CC Wood and paper products 16000 160000 16000 Manufacture of wood etc. 17000 170000 17000 Manufacture of paper etc. 18000 180000 18000 Printing etc.
CD 19000 190000 19000 Oil refinery etc.
CE 20000 Manufacture of chemicals 200010 20001 Manufacture of basic chemicals 200020 20002 Manufact. of paints, soap etc.
CF 21000 210000 21000 Pharmaceuticals
CG Manufacture of plastic, glass 22000 220000 22000 Manufacture of rubber etc. 23000 Manuf.of glass, concrete etc. 230010 23001 Manufacture of glass etc. 230020 23002 Manufacture of concrete etc.
CH Basic metals, metal products 24000 240000 24000 Manufacture of basic metals 25000 250000 25000 Manufact. of fabricated metal
CI 26000 Manufacture of electronics 260010 26001 Manufact. of computers, etc. 260020 26002 Manufact. of other electronics
CJ 27000 Electrical equipment 270010 27001 Manufacture of motors, etc. 270020 27002 Manufacture of wires, cables 270030 27003 Manuf.of household appl. etc.
CK 28000 Manufacture of machinery 280010 28001 Manufacture of engines etc. 280020 28002 Manufacture of other machinery
CL Transport equipment 29000 290000 29000 Manuf. of motor vehicles etc. 30000 300000 30000 Mf. of ships, transport equip.
CM Manufacture of furniture etc. 31320 Manuf.of furniture,other manuf 310000 31000 Manufacture of furniture 320010 32001 Manufact. of med. instruments 320020 32002 Manufacture of toys, etc. 33000 330000 33000 Repair, inst. of machinery etc

Appendices
34
Appendix 7.2, continued
Groupings DB07 New Danish national accounts industry classification
13 21 38 69 117 127-standard grp.
D-E Utility services
D D 35000 Electricity, gas and steam 350010 35001 Prod., distrib. of electricity 350020 35002 Manuf.and distribution of gas 350030 35003 Steam and hot water supply
E E Water, sewerage and waste 36000 360000 36000 Water collect.purification etc 37390 Sewerage,waste collection etc. 370000 37000 Sewerage 383900 38000 og 39000 Waste and materials
F F F 41430 Construction 410009 NR-Definition Construction of new buildings 420000 NR-Definition Civil engeneering 430003 NR-Definition Professional repair and maint. 430004 NR-Definition Own-account repair and maint.
G-I Trade and transport etc.
G G Wholesale and retail trade 45000 Sale, repair of motor vehicles 450010 45001 Sale of motor vehicles 450020 45002 Repair etc. of motor veh. etc. 46000 460000 46xxx Wholesale 47000 470000 47xxx Retail sale
H H Transportation 49000 Land transport, pipelines 490010 49001 Passenger rail transport etc. 490020 49002 Transp.by suburban trains etc. 490030 49003 Road and pipeline transport 50000 500000 50000 Water transport 51000 510000 51000 Air transport 52000 520000 52000 Support activities for transp. 53000 530000 53000 Postal and courier activities
I I 55560 Accommodation, food service 550000 55000 Hotels, similar accommodation 560000 56000 Restaurants
J J Information and communication
JA Publishing, tv and radio 58000 Publishing activities 580010 58001 Publishing 580020 58002 Publishing,computer games etc. 59600 Radio,TV.Movie,video,sound pub 590000 59000 Motion picture, tv and sound 600000 60000 Radio, television broadcasting
JB 61000 610000 61000 Telecommunications
JC 62630 IT and information service 620000 62000 Information technology service 630000 63000 Information service activities
K K K Financial and insurance 64000 Financial service activities 640010 64001 Monetary intermediation 640020 64002 Mortgage credit institutes etc 65000 650000 65000 Insurance and pension funding 66000 660000 66000 Other financial activities
LA LA LA Real estate;rent.of non-res.b. 68100 680010 68001 Buying, selling of real estate 68300 680030 68003 Renting, non-resid. buildings
LB LB LB Dwellings 68203 680023 68002, del Renting of resident. buildings 68204 680024 68002, del Owner-occupied dwellings

Appendices
35
Appendix 7.2, continued
Groupings DB07 New Danish national accounts industry classification
13 21 38 69 117 127-standard grp.
M-N Other business services
M Knowledge-based services
MA Consultancy etc. 69700 Legal, account.,cons.activit. 690010 69001 Legal activities 690020 69002 Accounting and bookkeeping 700000 70000 Business consultancy 71000 710000 71000 Architecture and engineering
MB Research and development 72001 720001 72000, del Research and developm.(market) 72002 720002 72000, del Research and dev. (non-market)
MC Advertising and other services 73000 730000 73000 Advertising, market research 74750 Oth.techn.serv.,veterinary act 740000 74000 Other technical business serv. 750000 75000 Veterinary activities
N N Travel agent, cleaning, etc. 77000 770000 77000 Rental and leasing activities 78000 780000 78000 Employment activities 79000 790000 79000 Travel agent activities 80820 Cleaning, other business serv. 800000 80000 Security and investigation 810000 81000 Services to buildings,cleaning 820000 82000 Other business services
O-Q Public adm., education, health
O O Public adm., defence etc. 84202 Public administration ect. 840010 84001 Public administration 840022 84002, del Defence,publ.order(non-market) 84101 840021 84002, del Rescue service ect. (market)
P P Education 85202 Education (non-market) 850010 85001 Primary education 850020 85002 Secondary education 850030 85003 Higher education 850042 85004, del Adult-,other educ.(non-market) 85101 850041 85004, del Adult-,other education(market)
Q Human health; social work
QA 86000 Human health activities 860010 86001 Hospital activities 860020 86002 Medical and dental practice
QB 87880 Residential care 870000 87000 Residential care activities 880000 88000 Social work without accommod.
R-S Arts, entertainm. oth.service
R R Arts and entertainment etc. 90920 Arts,entertainm.,other culture 900000 90000 Theatres, concerts, and arts 910001 91000, del Libraries, museums (market) 910002 91000, del Libraries, museums(non-market) 920000 92000 Gambling and betting 93000 Sports, amusement, recration 930011 93001, del Sports activities (market) 930012 93001, del Sports activities (non-market) 930020 93002 Amusement and recreation
SA SA Other service activities 94000 940000 94000 Activities of membership org. 95000 950000 95000 Repair of personal goods 96000 960000 96000 Other personal services
SB SB 97000 970000 97000 Households as employers
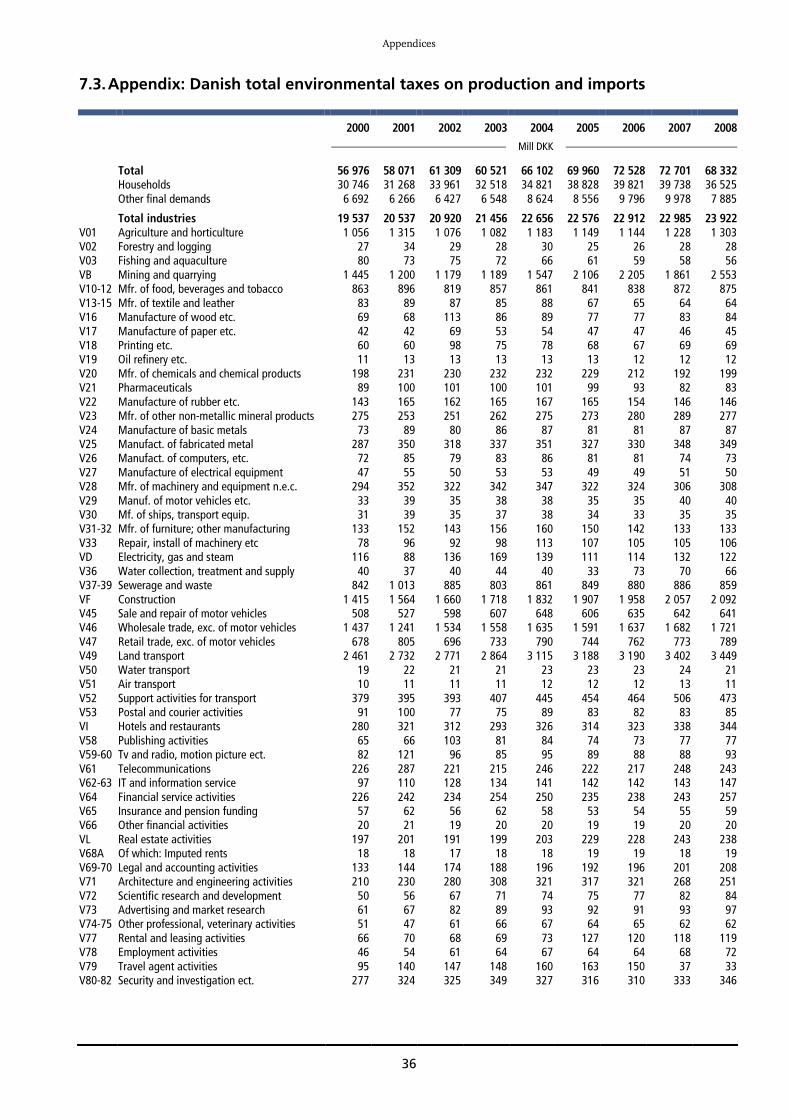
Appendices
36
7.3. Appendix: Danish total environmental taxes on production and imports
2000 2001 2002 2003 2004 2005 2006 2007 2008
Mill DKK
Total 56 976 58 071 61 309 60 521 66 102 69 960 72 528 72 701 68 332 Households 30 746 31 268 33 961 32 518 34 821 38 828 39 821 39 738 36 525 Other final demands 6 692 6 266 6 427 6 548 8 624 8 556 9 796 9 978 7 885
Total industries 19 537 20 537 20 920 21 456 22 656 22 576 22 912 22 985 23 922 V01 Agriculture and horticulture 1 056 1 315 1 076 1 082 1 183 1 149 1 144 1 228 1 303 V02 Forestry and logging 27 34 29 28 30 25 26 28 28 V03 Fishing and aquaculture 80 73 75 72 66 61 59 58 56 VB Mining and quarrying 1 445 1 200 1 179 1 189 1 547 2 106 2 205 1 861 2 553 V10-12 Mfr. of food, beverages and tobacco 863 896 819 857 861 841 838 872 875 V13-15 Mfr. of textile and leather 83 89 87 85 88 67 65 64 64 V16 Manufacture of wood etc. 69 68 113 86 89 77 77 83 84 V17 Manufacture of paper etc. 42 42 69 53 54 47 47 46 45 V18 Printing etc. 60 60 98 75 78 68 67 69 69 V19 Oil refinery etc. 11 13 13 13 13 13 12 12 12 V20 Mfr. of chemicals and chemical products 198 231 230 232 232 229 212 192 199 V21 Pharmaceuticals 89 100 101 100 101 99 93 82 83 V22 Manufacture of rubber etc. 143 165 162 165 167 165 154 146 146 V23 Mfr. of other non-metallic mineral products 275 253 251 262 275 273 280 289 277 V24 Manufacture of basic metals 73 89 80 86 87 81 81 87 87 V25 Manufact. of fabricated metal 287 350 318 337 351 327 330 348 349 V26 Manufact. of computers, etc. 72 85 79 83 86 81 81 74 73 V27 Manufacture of electrical equipment 47 55 50 53 53 49 49 51 50 V28 Mfr. of machinery and equipment n.e.c. 294 352 322 342 347 322 324 306 308 V29 Manuf. of motor vehicles etc. 33 39 35 38 38 35 35 40 40 V30 Mf. of ships, transport equip. 31 39 35 37 38 34 33 35 35 V31-32 Mfr. of furniture; other manufacturing 133 152 143 156 160 150 142 133 133 V33 Repair, install of machinery etc 78 96 92 98 113 107 105 105 106 VD Electricity, gas and steam 116 88 136 169 139 111 114 132 122 V36 Water collection, treatment and supply 40 37 40 44 40 33 73 70 66 V37-39 Sewerage and waste 842 1 013 885 803 861 849 880 886 859 VF Construction 1 415 1 564 1 660 1 718 1 832 1 907 1 958 2 057 2 092 V45 Sale and repair of motor vehicles 508 527 598 607 648 606 635 642 641 V46 Wholesale trade, exc. of motor vehicles 1 437 1 241 1 534 1 558 1 635 1 591 1 637 1 682 1 721 V47 Retail trade, exc. of motor vehicles 678 805 696 733 790 744 762 773 789 V49 Land transport 2 461 2 732 2 771 2 864 3 115 3 188 3 190 3 402 3 449 V50 Water transport 19 22 21 21 23 23 23 24 21 V51 Air transport 10 11 11 11 12 12 12 13 11 V52 Support activities for transport 379 395 393 407 445 454 464 506 473 V53 Postal and courier activities 91 100 77 75 89 83 82 83 85 VI Hotels and restaurants 280 321 312 293 326 314 323 338 344 V58 Publishing activities 65 66 103 81 84 74 73 77 77 V59-60 Tv and radio, motion picture ect. 82 121 96 85 95 89 88 88 93 V61 Telecommunications 226 287 221 215 246 222 217 248 243 V62-63 IT and information service 97 110 128 134 141 142 142 143 147 V64 Financial service activities 226 242 234 254 250 235 238 243 257 V65 Insurance and pension funding 57 62 56 62 58 53 54 55 59 V66 Other financial activities 20 21 19 20 20 19 19 20 20 VL Real estate activities 197 201 191 199 203 229 228 243 238 V68A Of which: Imputed rents 18 18 17 18 18 19 19 18 19 V69-70 Legal and accounting activities 133 144 174 188 196 192 196 201 208 V71 Architecture and engineering activities 210 230 280 308 321 317 321 268 251 V72 Scientific research and development 50 56 67 71 74 75 77 82 84 V73 Advertising and market research 61 67 82 89 93 92 91 93 97 V74-75 Other professional, veterinary activities 51 47 61 66 67 64 65 62 62 V77 Rental and leasing activities 66 70 68 69 73 127 120 118 119 V78 Employment activities 46 54 61 64 67 64 64 68 72 V79 Travel agent activities 95 140 147 148 160 163 150 37 33 V80-82 Security and investigation ect. 277 324 325 349 327 316 310 333 346

Appendices
37
Total environmental taxes, continued. 2000 2001 2002 2003 2004 2005 2006 2007 2008
Mill DKK
VO Public administration and defence 763 768 772 832 878 767 744 726 746 VP Education 1 008 1 095 999 1 082 1 020 916 946 943 960 V86 Human health activities 586 292 574 620 591 555 597 584 601 V87-88 Social work activities 928 727 1 060 1 140 1 073 979 998 980 977 V90-92 Creative, arts and entertainment activities 213 314 248 219 240 225 222 221 234 V93 Sports activities 147 219 173 152 167 157 155 154 164 V94 Activities of membership organisations 87 130 102 90 100 93 92 91 96 V95 Repair of personal goods 40 46 40 44 48 46 44 45 45 V96 Other personal service activities 40 56 45 40 47 43 43 45 45 VT Households as employers 0 0 0 0 0 0 0 0 0

Appendices
38
7.3.1. Appendix: Danish pollution1 taxes on production and imports
2000 2001 2002 2003 2004 2005 2006 2007 2008
Mill DKK
Total 2 873 2 928 3 064 2 866 2 935 3 048 3 162 3 339 3 331 Households 653 653 673 591 623 667 663 704 736 Other final demands 98 106 107 69 69 75 86 77 70
Total industries 2 123 2 169 2 284 2 207 2 244 2 307 2 413 2 558 2 525 V01 Agriculture and horticulture 282 236 231 232 251 277 249 291 348 V02 Forestry and logging 1 1 1 1 1 2 2 2 2 V03 Fishing and aquaculture 2 2 3 2 2 3 1 1 1 VB Mining and quarrying 2 1 1 1 1 1 1 1 1 V10-12 Mfr. of food, beverages and tobacco 356 319 288 303 285 268 274 298 299 V13-15 Mfr. of textile and leather 4 4 4 3 3 2 2 2 2 V16 Manufacture of wood etc. 2 2 2 3 3 3 2 3 3 V17 Manufacture of paper etc. 3 3 3 3 3 3 3 3 3 V18 Printing etc. 3 3 3 4 4 3 3 3 3 V19 Oil refinery etc. 2 2 2 2 2 1 2 2 2 V20 Mfr. of chemicals and chemical products 21 19 28 20 16 15 17 19 22 V21 Pharmaceuticals 23 23 26 22 21 20 22 24 24 V22 Manufacture of rubber etc. 24 24 27 23 22 21 23 24 24 V23 Mfr. of other non-metallic mineral products 6 8 7 6 6 6 6 6 6 V24 Manufacture of basic metals 1 1 1 1 1 1 1 1 1 V25 Manufact. of fabricated metal 35 42 44 44 47 46 45 44 39 V26 Manufact. of computers, etc. 12 14 14 14 14 14 14 13 13 V27 Manufacture of electrical equipment 10 11 11 11 11 10 10 12 11 V28 Mfr. of machinery and equipment n.e.c. 25 31 33 32 36 35 35 30 29 V29 Manuf. of motor vehicles etc. 4 5 5 5 5 5 5 5 5 V30 Mf. of ships, transport equip. 5 6 6 6 6 6 6 5 5 V31-32 Mfr. of furniture; other manufacturing 7 9 10 10 10 14 13 13 13 V33 Repair, install of machinery etc 5 6 6 7 6 7 6 5 5 VD Electricity, gas and steam 36 22 36 37 39 27 23 24 23 V36 Water collection, treatment and supply 5 3 5 5 5 4 3 3 3 V37-39 Sewerage and waste 508 505 488 454 474 487 525 544 494 VF Construction 15 43 42 40 38 41 37 36 33 V45 Sale and repair of motor vehicles 12 17 19 18 19 19 26 23 21 V46 Wholesale trade, exc. of motor vehicles 183 178 282 284 270 285 337 367 376 V47 Retail trade, exc. of motor vehicles 102 93 89 105 112 115 116 118 118 V49 Land transport 13 17 11 9 10 8 8 8 8 V50 Water transport 3 4 2 2 2 2 2 2 2 V51 Air transport 0 0 0 0 0 0 0 0 0 V52 Support activities for transport 10 13 8 7 8 6 6 6 6 V53 Postal and courier activities 1 2 2 1 1 2 3 4 3 VI Hotels and restaurants 42 60 63 48 45 48 54 59 59 V58 Publishing activities 3 4 4 4 4 4 4 4 4 V59-60 Tv and radio, motion picture ect. 6 7 6 5 6 6 7 7 6 V61 Telecommunications 4 14 13 12 12 13 14 14 13 V62-63 IT and information service 10 13 14 12 12 16 18 18 17 V64 Financial service activities 8 7 7 6 7 8 8 8 8 V65 Insurance and pension funding 1 1 1 1 1 1 1 1 1 V66 Other financial activities 5 4 4 4 4 4 5 5 4 VL Real estate activities 3 4 5 5 5 7 9 9 8 V68A Of which: Imputed rents 0 0 0 0 0 0 0 0 0 V69-70 Legal and accounting activities 4 6 6 5 6 7 8 8 8 V71 Architecture and engineering activities 12 17 18 15 16 20 22 24 22 V72 Scientific research and development 8 11 12 10 11 13 15 15 14 V73 Advertising and market research 1 1 1 1 1 2 2 2 2 V74-75 Other professional, veterinary activities 3 3 3 3 3 3 4 4 4 V77 Rental and leasing activities 4 5 5 6 6 8 10 10 9 V78 Employment activities 0 1 1 0 1 1 1 2 1 V79 Travel agent activities 0 0 0 0 0 0 0 0 0 V80-82 Security and investigation ect. 10 9 9 11 13 18 14 21 25

Appendices
39
Pollution taxes, continued. 2000 2001 2002 2003 2004 2005 2006 2007 2008
Mill DKK
VO Public administration and defence 72 85 89 83 86 80 82 84 78 VP Education 42 49 53 48 51 55 58 60 55 V86 Human health activities 48 62 71 66 69 76 87 90 84 V87-88 Social work activities 85 113 131 119 124 131 134 139 128 V90-92 Creative, arts and entertainment activities 11 11 11 11 10 10 11 11 10 V93 Sports activities 7 6 6 6 6 7 7 7 7 V94 Activities of membership organisations 4 4 4 4 4 4 4 4 4 V95 Repair of personal goods 4 4 3 4 5 5 4 4 4 V96 Other personal service activities 3 3 3 3 3 3 3 3 3 VT Households as employers 0 0 0 0 0 0 0 0 0
1 Exclusive of SO
2 taxes

Appendices
40
7.3.2. Appendix: Danish energy1 taxes on production and imports
2000 2001 2002 2003 2004 2005 2006 2007 2008
Mill DKK
Total 32 987 35 454 35 789 36 654 36 999 36 370 36 282 36 409 36 791 Households 20 110 21 751 22 104 22 370 22 303 22 110 21 763 21 386 21 375 Other final demands 0 0 0 0 0 0 0 0 0
Total industries 12 877 13 703 13 685 14 284 14 696 14 261 14 519 15 023 15 416 V01 Agriculture and horticulture 604 894 665 688 753 760 775 815 834 V02 Forestry and logging 13 19 14 15 15 16 16 17 17 V03 Fishing and aquaculture 70 63 66 64 58 53 54 53 51 VB Mining and quarrying 27 74 29 37 38 33 30 27 26 V10-12 Mfr. of food, beverages and tobacco 464 538 481 502 519 530 523 535 538 V13-15 Mfr. of textile and leather 67 75 70 69 70 55 54 53 53 V16 Manufacture of wood etc. 59 58 102 74 76 67 68 73 75 V17 Manufacture of paper etc. 36 35 61 45 46 40 41 39 39 V18 Printing etc. 49 49 85 62 64 56 57 59 58 V19 Oil refinery etc. 8 10 10 10 10 10 9 10 9 V20 Mfr. of chemicals and chemical products 166 201 190 201 204 201 185 164 168 V21 Pharmaceuticals 56 68 64 68 69 68 62 54 55 V22 Manufacture of rubber etc. 108 130 123 130 132 130 120 112 111 V23 Mfr. of other non-metallic mineral products 177 168 170 184 189 187 191 199 198 V24 Manufacture of basic metals 59 76 65 69 70 65 67 72 73 V25 Manufact. of fabricated metal 214 273 233 250 257 238 244 262 268 V26 Manufact. of computers, etc. 43 55 47 50 51 49 50 50 50 V27 Manufacture of electrical equipment 31 39 33 35 36 33 34 33 34 V28 Mfr. of machinery and equipment n.e.c. 222 277 239 256 251 234 239 234 237 V29 Manuf. of motor vehicles etc. 26 31 26 29 29 26 27 32 32 V30 Mf. of ships, transport equip. 23 30 25 27 27 25 25 27 28 V31-32 Mfr. of furniture; other manufacturing 111 128 117 131 133 122 115 106 107 V33 Repair, install of machinery etc 50 69 62 66 79 75 75 75 76 VD Electricity, gas and steam 74 59 96 128 96 80 77 94 85 V36 Water collection, treatment and supply 14 11 18 24 18 15 14 13 12 V37-39 Sewerage and waste 306 480 367 318 354 335 330 318 341 VF Construction 906 982 1 034 1 089 1 148 1 180 1 228 1 316 1 367 V45 Sale and repair of motor vehicles 330 320 361 375 391 385 394 410 417 V46 Wholesale trade, exc. of motor vehicles 958 776 928 954 1 012 987 1 000 1 029 1 059 V47 Retail trade, exc. of motor vehicles 462 593 484 508 546 513 527 538 554 V49 Land transport 2 001 1 953 1 952 2 045 2 195 2 244 2 346 2 540 2 662 V50 Water transport 13 12 12 13 14 14 15 18 15 V51 Air transport 8 8 8 8 9 9 10 10 9 V52 Support activities for transport 335 327 326 342 372 382 399 457 425 V53 Postal and courier activities 69 81 60 61 74 68 68 71 74 VI Hotels and restaurants 211 232 219 215 248 235 236 246 251 V58 Publishing activities 50 50 85 64 65 57 58 63 62 V59-60 Tv and radio, motion picture ect. 66 104 80 69 77 73 72 72 77 V61 Telecommunications 178 214 157 160 185 174 176 216 213 V62-63 IT and information service 59 67 78 87 90 87 89 93 98 V64 Financial service activities 190 210 198 218 210 193 197 202 216 V65 Insurance and pension funding 53 59 53 59 55 49 50 51 55 V66 Other financial activities 13 15 13 15 14 12 13 13 14 VL Real estate activities 169 171 160 166 168 168 169 184 180 V68A Of which: Imputed rents 15 15 14 14 14 14 14 13 13 V69-70 Legal and accounting activities 98 105 130 147 151 146 150 162 169 V71 Architecture and engineering activities 166 179 222 253 260 252 258 217 202 V72 Scientific research and development 35 38 47 54 55 54 55 60 63 V73 Advertising and market research 45 50 61 69 71 68 69 73 77 V74-75 Other professional, veterinary activities 34 29 41 46 45 44 45 44 45 V77 Rental and leasing activities 22 23 21 22 22 22 22 24 24 V78 Employment activities 41 49 54 58 60 57 57 60 64 V79 Travel agent activities 29 28 29 30 27 26 28 32 30 V80-82 Security and investigation ect. 183 228 221 246 212 207 213 228 238

Appendices
41
Energy taxes, continued. 2000 2001 2002 2003 2004 2005 2006 2007 2008
Mill DKK
VO Public administration and defence 544 512 513 560 586 557 534 545 573 VP Education 836 955 845 919 849 774 800 799 821 V86 Human health activities 497 197 470 519 485 448 478 464 487 V87-88 Social work activities 764 550 850 934 856 796 811 789 797 V90-92 Creative, arts and entertainment activities 183 288 219 189 210 199 196 196 210 V93 Sports activities 129 202 156 135 149 140 138 137 147 V94 Activities of membership organisations 75 118 90 78 86 82 81 81 86 V95 Repair of personal goods 23 27 22 24 26 26 26 27 28 V96 Other personal service activities 25 41 29 25 29 29 29 31 31 VT Households as employers 0 0 0 0 0 0 0 0 0
1 Inclusive of SO
2 taxes

Appendices
42
7.3.3. Appendix: Danish transport taxes on production and imports
2000 2001 2002 2003 2004 2005 2006 2007 2008
Mill DKK
Total 18 176 17 008 19 740 18 289 23 058 26 917 29 324 29 547 24 143 Households 8 846 7 591 9 895 8 320 10 635 14 833 16 159 16 424 13 192 Other final demands 6 595 6 160 6 318 6 476 8 552 8 474 9 712 9 903 7 816
Total industries 2 735 3 257 3 526 3 493 3 871 3 610 3 453 3 220 3 135 V01 Agriculture and horticulture 168 183 179 160 178 110 117 119 119 V02 Forestry and logging 13 14 13 12 13 8 9 9 9 V03 Fishing and aquaculture 8 8 7 6 7 5 4 4 4 VB Mining and quarrying 3 3 3 3 4 3 5 5 4 V10-12 Mfr. of food, beverages and tobacco 43 39 50 52 57 43 40 39 38 V13-15 Mfr. of textile and leather 12 11 14 14 15 10 10 9 9 V16 Manufacture of wood etc. 8 8 9 9 10 8 7 7 7 V17 Manufacture of paper etc. 4 4 4 4 5 4 3 3 3 V18 Printing etc. 8 8 9 9 10 8 7 7 7 V19 Oil refinery etc. 1 1 2 1 2 2 1 1 1 V20 Mfr. of chemicals and chemical products 10 10 12 11 12 12 9 8 8 V21 Pharmaceuticals 9 10 11 10 11 11 9 4 4 V22 Manufacture of rubber etc. 11 11 12 11 13 13 10 10 10 V23 Mfr. of other non-metallic mineral products 15 16 18 19 20 18 18 18 18 V24 Manufacture of basic metals 13 12 14 15 16 14 13 13 13 V25 Manufact. of fabricated metal 37 34 39 42 46 41 38 39 39 V26 Manufact. of computers, etc. 17 16 18 19 21 18 17 10 10 V27 Manufacture of electrical equipment 6 5 6 7 7 6 6 5 5 V28 Mfr. of machinery and equipment n.e.c. 48 44 51 54 60 53 50 41 41 V29 Manuf. of motor vehicles etc. 3 3 4 4 4 4 3 3 3 V30 Mf. of ships, transport equip. 4 3 4 4 5 4 3 2 2 V31-32 Mfr. of furniture; other manufacturing 15 15 16 15 17 15 15 13 13 V33 Repair, install of machinery etc 23 21 24 26 28 26 24 25 25 VD Electricity, gas and steam 5 6 4 4 4 4 14 14 14 V36 Water collection, treatment and supply 22 23 18 16 17 15 55 54 51 V37-39 Sewerage and waste 25 25 28 28 31 25 23 22 22 VF Construction 407 454 506 514 564 585 576 589 593 V45 Sale and repair of motor vehicles 166 190 217 215 239 202 215 209 203 V46 Wholesale trade, exc. of motor vehicles 296 286 324 320 353 318 300 286 286 V47 Retail trade, exc. of motor vehicles 114 118 123 120 132 116 118 117 117 V49 Land transport 444 760 806 808 908 935 835 852 778 V50 Water transport 3 6 6 6 7 7 6 4 4 V51 Air transport 1 2 3 3 3 3 3 2 2 V52 Support activities for transport 30 52 55 55 62 64 57 40 39 V53 Postal and courier activities 20 17 15 13 13 13 11 8 8 VI Hotels and restaurants 27 29 30 30 33 31 33 34 34 V58 Publishing activities 12 13 14 14 15 12 11 10 10 V59-60 Tv and radio, motion picture ect. 9 9 11 11 12 9 9 8 8 V61 Telecommunications 43 59 50 43 48 34 26 17 17 V62-63 IT and information service 28 30 36 35 39 39 35 32 32 V64 Financial service activities 26 24 28 28 31 33 31 31 32 V65 Insurance and pension funding 2 2 2 2 2 2 2 2 2 V66 Other financial activities 2 2 2 2 2 2 2 2 2 VL Real estate activities 19 21 20 20 22 44 40 39 40 V68A Of which: Imputed rents 1 1 1 1 1 1 1 1 1 V69-70 Legal and accounting activities 28 31 36 34 38 38 36 29 29 V71 Architecture and engineering activities 32 34 41 40 44 45 40 27 27 V72 Scientific research and development 5 6 7 7 8 8 7 6 6 V73 Advertising and market research 15 16 20 19 21 22 20 18 18 V74-75 Other professional, veterinary activities 13 14 16 16 17 16 15 13 13 V77 Rental and leasing activities 40 43 42 41 45 97 88 84 85 V78 Employment activities 5 5 6 6 6 6 6 6 6 V79 Travel agent activities 65 111 118 118 132 136 121 4 2 V80-82 Security and investigation ect. 79 84 92 89 98 86 78 79 79

Appendices
43
Transport taxes, continued. 2000 2001 2002 2003 2004 2005 2006 2007 2008
Mill DKK
VO Public administration and defence 136 164 162 158 173 104 103 72 70 VP Education 36 36 43 44 48 34 30 27 27 V86 Human health activities 19 21 21 20 22 19 18 17 17 V87-88 Social work activities 34 38 51 53 58 23 23 22 22 V90-92 Creative, arts and entertainment activities 10 10 12 12 13 10 9 9 8 V93 Sports activities 6 6 7 7 8 7 6 5 5 V94 Activities of membership organisations 6 6 7 7 8 6 6 5 5 V95 Repair of personal goods 14 15 15 15 17 15 14 14 14 V96 Other personal service activities 12 11 13 13 14 11 11 11 11 VT Households as employers 0 0 0 0 0 0 0 0 0

Appendices
44
7.3.4. Appendix: Danish resource taxes on production and imports
2000 2001 2002 2003 2004 2005 2006 2007 2008
Mill DKK
Total 2 940 2 681 2 716 2 712 3 109 3 625 3 760 3 406 4 066 Households 1 137 1 273 1 289 1 237 1 260 1 219 1 235 1 223 1 222 Other final demands 0 -0 2 3 3 7 -2 -2 -1
Total industries 1 803 1 408 1 425 1 472 1 845 2 399 2 527 2 184 2 846 V01 Agriculture and horticulture 2 1 1 1 1 2 2 2 2 V02 Forestry and logging 0 0 0 0 0 0 0 0 0 V03 Fishing and aquaculture 0 0 0 0 0 0 0 0 0 VB Mining and quarrying 1 413 1 123 1 146 1 149 1 505 2 069 2 170 1 829 2 522 V10-12 Mfr. of food, beverages and tobacco 0 0 0 0 0 0 0 0 0 V13-15 Mfr. of textile and leather 0 0 0 0 0 0 0 0 0 V16 Manufacture of wood etc. 0 0 0 0 0 0 0 0 0 V17 Manufacture of paper etc. 0 0 0 0 0 0 0 0 0 V18 Printing etc. 0 0 0 0 0 0 0 0 0 V19 Oil refinery etc. 0 0 0 0 0 0 0 0 0 V20 Mfr. of chemicals and chemical products 0 0 0 0 0 0 0 0 0 V21 Pharmaceuticals 0 0 0 0 0 0 0 0 0 V22 Manufacture of rubber etc. 1 0 0 0 0 1 1 1 1 V23 Mfr. of other non-metallic mineral products 76 61 56 54 60 62 65 65 55 V24 Manufacture of basic metals 0 0 0 0 0 0 0 0 0 V25 Manufact. of fabricated metal 2 2 1 1 1 2 3 3 2 V26 Manufact. of computers, etc. 0 0 0 0 0 0 0 0 0 V27 Manufacture of electrical equipment 0 0 0 0 0 0 0 0 0 V28 Mfr. of machinery and equipment n.e.c. 0 0 0 0 0 0 0 0 0 V29 Manuf. of motor vehicles etc. 0 0 0 0 0 0 0 0 0 V30 Mf. of ships, transport equip. 0 0 0 0 0 0 0 0 0 V31-32 Mfr. of furniture; other manufacturing 0 0 0 0 0 0 0 0 0 V33 Repair, install of machinery etc 0 0 0 0 0 0 0 0 0 VD Electricity, gas and steam 0 0 0 0 0 0 0 0 0 V36 Water collection, treatment and supply 0 0 0 0 0 0 0 0 0 V37-39 Sewerage and waste 3 2 2 2 2 2 2 2 2 VF Construction 88 85 78 76 83 102 118 117 98 V45 Sale and repair of motor vehicles 0 0 0 0 0 0 0 0 0 V46 Wholesale trade, exc. of motor vehicles 0 0 0 0 0 0 0 0 0 V47 Retail trade, exc. of motor vehicles 0 0 0 0 0 0 0 0 0 V49 Land transport 3 2 3 2 2 2 2 2 2 V50 Water transport 0 0 0 0 0 0 0 0 0 V51 Air transport 0 0 0 0 0 0 0 0 0 V52 Support activities for transport 4 4 4 3 3 3 3 3 3 V53 Postal and courier activities 0 0 0 0 0 0 0 0 0 VI Hotels and restaurants 0 0 0 0 0 0 0 0 0 V58 Publishing activities 0 0 0 0 0 0 0 0 0 V59-60 Tv and radio, motion picture ect. 1 1 0 1 1 1 1 1 1 V61 Telecommunications 1 1 1 1 1 1 1 0 0 V62-63 IT and information service 0 0 0 0 0 0 0 0 0 V64 Financial service activities 2 1 1 2 2 1 2 1 1 V65 Insurance and pension funding 1 0 0 1 1 0 0 0 0 V66 Other financial activities 0 0 0 0 0 0 0 0 0 VL Real estate activities 5 5 6 8 8 10 10 10 10 V68A Of which: Imputed rents 2 2 2 3 3 4 4 4 4 V69-70 Legal and accounting activities 2 2 2 1 1 2 2 2 2 V71 Architecture and engineering activities 0 0 0 0 0 0 0 0 0 V72 Scientific research and development 1 1 1 1 1 1 1 1 1 V73 Advertising and market research 0 0 0 0 0 0 0 0 0 V74-75 Other professional, veterinary activities 1 1 1 1 1 1 1 1 1 V77 Rental and leasing activities 0 0 0 0 0 0 0 0 0 V78 Employment activities 0 0 0 0 0 0 0 0 0 V79 Travel agent activities 1 1 1 1 1 1 1 1 1 V80-82 Security and investigation ect. 5 3 3 3 3 5 5 5 5

Appendices
45
Resource taxes, continued. 2000 2001 2002 2003 2004 2005 2006 2007 2008
Mill DKK
VO Public administration and defence 12 7 8 32 32 26 25 25 25 VP Education 94 54 58 71 72 55 58 57 57 V86 Human health activities 21 12 13 15 15 13 14 13 13 V87-88 Social work activities 45 27 28 35 35 28 30 30 30 V90-92 Creative, arts and entertainment activities 9 6 6 7 7 6 6 6 6 V93 Sports activities 6 4 4 4 5 4 4 4 4 V94 Activities of membership organisations 2 1 1 1 1 1 1 1 1 V95 Repair of personal goods 0 0 0 0 0 0 0 0 0 V96 Other personal service activities 0 0 0 0 0 0 0 0 0 VT Households as employers 0 0 0 0 0 0 0 0 0

Appendices
46
7.4. Appendix: Danish total environmental subsidies on production and imports
2000 2001 2002 2003 2004 2005 2006 2007 2008
Mill DKK
Total 10 014 10 400 10 155 10 813 11 126 11 563 12 117 12 432 12 929 Households 4 191 5 234 5 022 5 259 5 571 5 647 6 680 5 383 5 353 Other final demands 108 87 27 17 38 38 51 32 57
Total industries 5 715 5 079 5 106 5 536 5 517 5 878 5 386 7 018 7 519 V01 Agriculture and horticulture 599 660 587 742 744 642 773 1 748 1 987 V02 Forestry and logging 12 14 12 16 16 13 16 31 36 V03 Fishing and aquaculture 30 28 3 26 26 28 33 35 35 VB Mining and quarrying 6 6 5 5 6 5 5 4 5 V10-12 Mfr. of food, beverages and tobacco 65 68 62 62 75 98 69 73 78 V13-15 Mfr. of textile and leather 12 6 5 5 6 6 3 3 3 V16 Manufacture of wood etc. 112 80 68 60 48 31 24 47 44 V17 Manufacture of paper etc. 49 42 42 30 7 6 5 4 4 V18 Printing etc. 47 39 40 27 5 4 4 3 4 V19 Oil refinery etc. 2 2 2 1 2 2 2 2 2 V20 Mfr. of chemicals and chemical products 23 25 24 21 26 28 23 21 22 V21 Pharmaceuticals 32 37 34 38 41 40 30 28 29 V22 Manufacture of rubber etc. 15 16 13 12 16 16 14 13 14 V23 Mfr. of other non-metallic mineral products 18 21 15 13 18 21 18 18 18 V24 Manufacture of basic metals 6 5 3 2 4 5 5 4 5 V25 Manufact. of fabricated metal 20 20 16 15 19 22 18 17 18 V26 Manufact. of computers, etc. 14 15 12 13 14 16 13 12 12 V27 Manufacture of electrical equipment 7 7 5 6 6 7 6 5 5 V28 Mfr. of machinery and equipment n.e.c. 40 42 35 37 42 49 38 37 37 V29 Manuf. of motor vehicles etc. 4 4 3 3 3 4 3 3 4 V30 Mf. of ships, transport equip. 21 19 16 18 20 28 23 47 54 V31-32 Mfr. of furniture; other manufacturing 38 31 23 24 31 27 21 22 22 V33 Repair, install of machinery etc 6 5 5 6 6 7 6 6 6 VD Electricity, gas and steam 18 16 20 25 26 22 19 18 19 V36 Water collection, treatment and supply 7 5 7 10 10 5 5 5 5 V37-39 Sewerage and waste 35 31 56 25 11 17 17 15 16 VF Construction 29 28 19 21 22 19 21 22 23 V45 Sale and repair of motor vehicles 21 16 13 13 15 19 20 19 19 V46 Wholesale trade, exc. of motor vehicles 71 106 99 110 115 146 122 117 118 V47 Retail trade, exc. of motor vehicles 110 62 61 63 72 90 77 81 85 V49 Land transport 2 592 1 999 1 918 2 192 2 259 1 602 1 180 1 280 1 292 V50 Water transport 4 3 4 4 4 4 3 4 4 V51 Air transport 1 1 1 1 1 1 1 1 2 V52 Support activities for transport 24 18 19 17 19 18 17 17 17 V53 Postal and courier activities 39 16 16 16 16 35 40 10 12 VI Hotels and restaurants 23 22 16 16 19 27 26 26 27 V58 Publishing activities 41 36 36 29 13 15 13 10 10 V59-60 Tv and radio, motion picture ect. 64 69 84 79 66 125 128 285 323 V61 Telecommunications 95 89 90 87 98 127 120 34 39 V62-63 IT and information service 31 30 37 35 36 51 49 52 53 V64 Financial service activities 47 37 32 36 36 53 43 41 42 V65 Insurance and pension funding 8 6 5 6 6 8 7 10 11 V66 Other financial activities 5 4 4 4 4 6 6 6 6 VL Real estate activities 26 31 123 118 39 572 517 1 164 1 320 V68A Of which: Imputed rents 0 0 0 0 0 0 0 0 0 V69-70 Legal and accounting activities 18 18 21 20 21 27 29 33 35 V71 Architecture and engineering activities 35 34 43 42 42 60 59 61 62 V72 Scientific research and development 33 32 39 40 41 57 54 91 100 V73 Advertising and market research 8 7 8 9 9 13 11 11 11 V74-75 Other professional, veterinary activities 6 5 7 7 6 8 10 10 11 V77 Rental and leasing activities 2 2 5 5 2 31 28 27 27 V78 Employment activities 2 2 2 2 2 2 3 5 5 V79 Travel agent activities 127 98 94 107 111 78 56 55 54 V80-82 Security and investigation ect. 9 9 11 11 11 15 12 12 13

Appendices
47
Total environmental subsidies, continued. 2000 2001 2002 2003 2004 2005 2006 2007 2008
Mill DKK
VO Public administration and defence 148 119 102 111 111 121 126 136 137 VP Education 294 308 342 365 372 451 449 395 393 V86 Human health activities 64 77 101 93 96 141 159 115 122 V87-88 Social work activities 340 396 441 482 498 602 610 461 465 V90-92 Creative, arts and entertainment activities 59 60 75 55 43 70 67 66 66 V93 Sports activities 44 43 61 42 32 53 55 55 55 V94 Activities of membership organisations 44 47 51 46 43 69 69 68 67 V95 Repair of personal goods 5 3 4 4 4 6 4 4 4 V96 Other personal service activities 8 8 11 7 5 8 8 8 8 VT Households as employers 0 0 0 0 0 0 0 0 0

Appendices
48
7.4.1. Appendix: Danish pollution subsidies on production and imports
2000 2001 2002 2003 2004 2005 2006 2007 2008
Mill DKK
Total 858 933 996 1 217 1 078 854 927 1 108 1 053 Households 5 5 5 6 6 8 8 10 11 Other final demands 0 0 0 0 0 0 0 0 0
Total industries 853 928 991 1 210 1 072 846 919 1 098 1 042 V01 Agriculture and horticulture 575 639 570 731 724 198 230 264 226 V02 Forestry and logging 11 12 11 14 13 4 4 5 5 V03 Fishing and aquaculture 30 27 3 26 26 26 30 28 27 VB Mining and quarrying 0 0 0 0 0 0 0 0 0 V10-12 Mfr. of food, beverages and tobacco 2 0 1 0 0 16 14 18 18 V13-15 Mfr. of textile and leather 0 0 0 0 0 1 0 1 1 V16 Manufacture of wood etc. 1 0 0 0 0 1 1 1 1 V17 Manufacture of paper etc. 0 0 0 0 0 1 1 1 1 V18 Printing etc. 0 0 0 0 0 0 0 1 1 V19 Oil refinery etc. 0 0 0 0 0 0 0 0 0 V20 Mfr. of chemicals and chemical products 1 2 0 0 0 3 4 5 5 V21 Pharmaceuticals 0 1 0 0 0 1 2 2 2 V22 Manufacture of rubber etc. 1 1 0 0 0 2 2 2 3 V23 Mfr. of other non-metallic mineral products 0 0 0 0 0 2 2 3 3 V24 Manufacture of basic metals 1 0 0 0 0 1 1 1 1 V25 Manufact. of fabricated metal 1 0 0 0 0 2 2 3 3 V26 Manufact. of computers, etc. 1 0 0 0 0 1 1 2 2 V27 Manufacture of electrical equipment 0 0 0 0 0 1 1 1 1 V28 Mfr. of machinery and equipment n.e.c. 2 0 0 0 0 3 3 4 5 V29 Manuf. of motor vehicles etc. 0 0 0 0 0 1 1 1 1 V30 Mf. of ships, transport equip. 4 0 0 0 0 7 7 8 7 V31-32 Mfr. of furniture; other manufacturing 1 0 0 0 0 2 3 3 3 V33 Repair, install of machinery etc 0 0 0 0 0 1 1 1 1 VD Electricity, gas and steam 10 5 11 16 15 4 4 5 5 V36 Water collection, treatment and supply 5 3 6 8 8 2 2 3 3 V37-39 Sewerage and waste 0 0 1 1 0 2 2 2 2 VF Construction 4 4 4 5 5 4 5 6 6 V45 Sale and repair of motor vehicles 2 1 1 1 1 3 4 5 5 V46 Wholesale trade, exc. of motor vehicles 13 13 15 20 18 20 22 28 29 V47 Retail trade, exc. of motor vehicles 6 6 7 9 8 16 17 21 22 V49 Land transport 11 9 17 18 6 33 35 41 36 V50 Water transport 0 0 1 1 0 1 1 2 2 V51 Air transport 0 0 0 0 0 0 0 0 0 V52 Support activities for transport 1 1 2 2 1 4 4 5 5 V53 Postal and courier activities 1 1 1 1 1 2 3 5 5 VI Hotels and restaurants 3 2 2 3 3 6 7 9 9 V58 Publishing activities 1 0 1 1 1 2 2 3 3 V59-60 Tv and radio, motion picture ect. 6 6 19 19 8 36 40 46 40 V61 Telecommunications 6 5 6 7 6 14 16 19 20 V62-63 IT and information service 4 4 10 6 6 12 15 19 19 V64 Financial service activities 4 3 3 4 4 6 6 8 8 V65 Insurance and pension funding 1 1 1 1 1 1 1 2 2 V66 Other financial activities 2 1 1 2 2 3 3 4 4 VL Real estate activities 4 3 95 86 6 178 160 184 160 V68A Of which: Imputed rents 0 0 0 0 0 0 0 0 0 V69-70 Legal and accounting activities 3 4 6 4 4 6 9 11 11 V71 Architecture and engineering activities 6 7 15 10 9 18 22 28 30 V72 Scientific research and development 4 4 9 6 6 11 14 17 16 V73 Advertising and market research 0 0 1 1 1 2 2 2 2 V74-75 Other professional, veterinary activities 2 2 3 3 2 4 5 6 6 V77 Rental and leasing activities 0 0 3 3 0 6 5 7 7 V78 Employment activities 0 0 1 0 0 1 1 2 2 V79 Travel agent activities 0 0 0 0 0 0 1 1 1 V80-82 Security and investigation ect. 3 3 4 4 4 5 5 6 6

Appendices
49
Pollution subsidies, continued. 2000 2001 2002 2003 2004 2005 2006 2007 2008
Mill DKK
VO Public administration and defence 25 30 24 31 29 26 32 40 42 VP Education 25 36 36 45 42 25 25 32 33 V86 Human health activities 20 26 27 34 32 53 65 82 86 V87-88 Social work activities 45 61 62 79 75 53 59 74 78 V90-92 Creative, arts and entertainment activities 1 1 3 3 1 5 5 7 7 V93 Sports activities 1 1 2 2 1 4 4 5 5 V94 Activities of membership organisations 1 1 2 2 1 4 4 5 6 V95 Repair of personal goods 0 0 1 1 1 1 1 1 1 V96 Other personal service activities 0 0 1 1 0 1 1 2 2 VT Households as employers 0 0 0 0 0 0 0 0 0

Appendices
50
7.4.2. Appendix: Danish energy subsidies on production and imports
2000 2001 2002 2003 2004 2005 2006 2007 2008
Mill DKK
Total 710 587 561 233 267 244 277 229 313 Households 146 120 93 24 95 88 96 84 113 Other final demands 106 88 27 13 31 33 48 26 51
Total industries 458 378 442 196 141 123 133 119 149 V01 Agriculture and horticulture 17 13 10 2 11 10 11 10 12 V02 Forestry and logging 0 0 0 0 0 0 0 0 0 V03 Fishing and aquaculture 0 0 0 0 0 0 0 0 0 VB Mining and quarrying 1 1 0 0 1 0 0 0 1 V10-12 Mfr. of food, beverages and tobacco 20 17 11 2 13 12 12 11 14 V13-15 Mfr. of textile and leather 2 2 1 0 1 1 1 1 1 V16 Manufacture of wood etc. 49 41 42 27 2 2 2 1 2 V17 Manufacture of paper etc. 44 37 38 25 2 1 2 1 1 V18 Printing etc. 43 36 37 24 2 1 2 1 2 V19 Oil refinery etc. 1 1 1 0 1 1 1 1 1 V20 Mfr. of chemicals and chemical products 6 5 4 1 5 4 4 3 4 V21 Pharmaceuticals 3 2 2 0 2 2 2 2 3 V22 Manufacture of rubber etc. 6 5 4 1 5 4 4 3 4 V23 Mfr. of other non-metallic mineral products 7 6 4 1 5 4 4 4 5 V24 Manufacture of basic metals 4 4 2 1 3 2 3 2 3 V25 Manufact. of fabricated metal 6 5 3 1 4 3 3 3 4 V26 Manufact. of computers, etc. 2 1 1 0 1 1 1 1 1 V27 Manufacture of electrical equipment 1 1 1 0 1 1 1 1 1 V28 Mfr. of machinery and equipment n.e.c. 6 5 4 1 4 4 4 4 5 V29 Manuf. of motor vehicles etc. 1 1 0 0 1 0 1 1 1 V30 Mf. of ships, transport equip. 1 1 0 0 1 0 0 1 1 V31-32 Mfr. of furniture; other manufacturing 4 4 3 1 4 3 3 2 3 V33 Repair, install of machinery etc 1 1 0 0 0 0 0 0 1 VD Electricity, gas and steam 3 2 2 1 3 3 3 3 4 V36 Water collection, treatment and supply 1 1 1 0 1 1 1 1 1 V37-39 Sewerage and waste 28 23 48 16 2 2 2 2 2 VF Construction 2 2 2 1 2 2 2 2 2 V45 Sale and repair of motor vehicles 2 2 2 0 2 1 2 2 2 V46 Wholesale trade, exc. of motor vehicles 12 10 10 5 9 7 8 7 8 V47 Retail trade, exc. of motor vehicles 13 11 10 3 12 10 11 10 12 V49 Land transport 4 3 3 1 3 3 3 2 3 V50 Water transport 0 0 0 0 0 0 0 0 0 V51 Air transport 0 0 0 0 0 0 0 0 0 V52 Support activities for transport 6 5 5 2 4 4 4 4 5 V53 Postal and courier activities 0 0 0 0 0 0 0 0 0 VI Hotels and restaurants 5 4 3 1 4 4 4 4 4 V58 Publishing activities 30 25 26 17 1 1 1 1 1 V59-60 Tv and radio, motion picture ect. 9 8 16 5 1 1 1 1 1 V61 Telecommunications 2 2 2 0 2 2 2 2 3 V62-63 IT and information service 3 3 4 2 1 1 1 1 2 V64 Financial service activities 4 3 2 1 1 1 1 1 1 V65 Insurance and pension funding 1 1 1 0 0 0 0 0 0 V66 Other financial activities 0 0 0 0 0 0 0 0 0 VL Real estate activities 2 2 2 1 1 1 1 1 1 V68A Of which: Imputed rents 0 0 0 0 0 0 0 0 0 V69-70 Legal and accounting activities 2 1 1 1 1 1 1 1 1 V71 Architecture and engineering activities 3 2 2 1 1 1 1 1 1 V72 Scientific research and development 1 1 1 0 0 0 0 0 0 V73 Advertising and market research 1 1 1 1 1 1 1 1 1 V74-75 Other professional, veterinary activities 0 0 0 0 0 0 0 0 0 V77 Rental and leasing activities 1 0 0 0 0 0 0 0 0 V78 Employment activities 1 1 1 1 0 0 0 0 1 V79 Travel agent activities 0 0 0 0 0 0 0 0 0 V80-82 Security and investigation ect. 2 2 2 1 1 1 1 1 1

Appendices
51
Energy subsidies, continued. 2000 2001 2002 2003 2004 2005 2006 2007 2008
Mill DKK
VO Public administration and defence 8 6 5 3 2 2 2 2 3 VP Education 16 13 15 7 5 4 5 4 5 V86 Human health activities 5 4 4 2 3 3 3 3 3 V87-88 Social work activities 12 10 11 5 5 4 5 4 5 V90-92 Creative, arts and entertainment activities 21 17 36 12 2 1 1 1 2 V93 Sports activities 20 16 34 12 1 1 1 1 2 V94 Activities of membership organisations 8 6 13 4 1 1 1 0 1 V95 Repair of personal goods 0 0 0 0 0 0 0 0 0 V96 Other personal service activities 4 3 7 2 0 0 0 0 0 VT Households as employers 0 0 0 0 0 0 0 0 0

Appendices
52
7.4.3. Appendix: Danish transport subsidies on production and imports
2000 2001 2002 2003 2004 2005 2006 2007 2008
Mill DKK
Total 8 289 8 758 8 496 9 299 9 684 10 379 10 831 10 912 11 394 Households 3 967 5 035 4 855 5 205 5 434 5 502 6 523 5 169 5 120 Other final demands 0 0 0 0 0 0 0 0 0
Total industries 4 322 3 724 3 641 4 094 4 250 4 877 4 308 5 743 6 274 V01 Agriculture and horticulture 7 7 7 8 8 434 531 1 474 1 748 V02 Forestry and logging 2 1 1 2 2 9 11 26 30 V03 Fishing and aquaculture 0 0 0 0 0 2 2 6 7 VB Mining and quarrying 5 5 4 5 5 4 4 4 4 V10-12 Mfr. of food, beverages and tobacco 43 51 49 60 62 70 43 44 44 V13-15 Mfr. of textile and leather 10 4 4 5 5 4 2 2 2 V16 Manufacture of wood etc. 6 6 5 6 6 5 4 3 3 V17 Manufacture of paper etc. 4 5 4 5 5 4 3 2 2 V18 Printing etc. 3 3 3 3 3 2 2 1 1 V19 Oil refinery etc. 1 1 1 1 1 1 1 1 1 V20 Mfr. of chemicals and chemical products 16 18 20 20 21 21 15 13 13 V21 Pharmaceuticals 28 34 32 37 38 37 27 24 24 V22 Manufacture of rubber etc. 8 10 9 11 11 11 8 7 7 V23 Mfr. of other non-metallic mineral products 6 14 10 12 12 14 10 9 9 V24 Manufacture of basic metals 1 1 1 1 1 1 1 0 0 V25 Manufact. of fabricated metal 13 14 12 14 15 16 12 11 10 V26 Manufact. of computers, etc. 12 13 11 13 13 14 11 9 9 V27 Manufacture of electrical equipment 6 6 5 6 6 6 5 4 4 V28 Mfr. of machinery and equipment n.e.c. 32 37 31 36 38 42 31 29 28 V29 Manuf. of motor vehicles etc. 2 3 2 3 3 3 2 2 2 V30 Mf. of ships, transport equip. 16 18 16 18 19 21 15 39 46 V31-32 Mfr. of furniture; other manufacturing 18 20 16 19 20 17 12 11 11 V33 Repair, install of machinery etc 4 5 4 5 5 6 5 4 4 VD Electricity, gas and steam 5 8 7 8 8 15 11 10 10 V36 Water collection, treatment and supply 1 1 1 1 1 2 1 1 1 V37-39 Sewerage and waste 7 8 7 8 8 13 13 11 11 VF Construction 21 21 12 14 15 13 13 13 13 V45 Sale and repair of motor vehicles 18 13 10 11 12 15 14 13 13 V46 Wholesale trade, exc. of motor vehicles 46 84 73 86 89 119 93 83 82 V47 Retail trade, exc. of motor vehicles 92 45 43 51 52 65 49 50 51 V49 Land transport 2 576 1 987 1 898 2 173 2 250 1 566 1 142 1 236 1 252 V50 Water transport 4 3 3 3 3 2 2 2 2 V51 Air transport 1 1 1 1 1 1 1 1 1 V52 Support activities for transport 16 12 12 13 14 10 8 7 7 V53 Postal and courier activities 38 16 16 15 15 33 37 5 7 VI Hotels and restaurants 15 16 10 12 13 18 15 14 14 V58 Publishing activities 10 10 9 11 11 12 10 7 7 V59-60 Tv and radio, motion picture ect. 49 55 49 55 57 89 88 238 282 V61 Telecommunications 87 82 83 80 89 111 102 13 16 V62-63 IT and information service 24 22 24 27 29 38 33 32 31 V64 Financial service activities 40 31 26 31 32 46 36 32 32 V65 Insurance and pension funding 6 4 4 4 5 7 5 8 9 V66 Other financial activities 3 2 2 2 2 3 3 2 2 VL Real estate activities 19 25 26 31 32 393 356 979 1 160 V68A Of which: Imputed rents 0 0 0 0 0 0 0 0 0 V69-70 Legal and accounting activities 13 13 13 15 16 20 19 21 22 V71 Architecture and engineering activities 26 25 26 30 31 41 35 32 31 V72 Scientific research and development 29 27 29 33 35 46 39 74 84 V73 Advertising and market research 6 6 6 7 7 11 9 8 8 V74-75 Other professional, veterinary activities 4 3 3 4 4 5 4 4 4 V77 Rental and leasing activities 1 2 2 2 2 25 22 20 20 V78 Employment activities 1 1 1 1 1 1 1 2 2 V79 Travel agent activities 127 98 93 107 111 77 55 54 53 V80-82 Security and investigation ect. 5 4 5 6 6 9 6 6 6

Appendices
53
Transport subsidies, continued. 2000 2001 2002 2003 2004 2005 2006 2007 2008
Mill DKK
VO Public administration and defence 113 79 70 76 79 92 91 91 90 VP Education 252 258 290 313 325 421 419 358 353 V86 Human health activities 39 47 70 57 61 85 91 30 32 V87-88 Social work activities 281 323 366 397 417 543 545 381 380 V90-92 Creative, arts and entertainment activities 37 42 36 40 41 63 60 58 57 V93 Sports activities 24 26 25 29 30 48 49 49 48 V94 Activities of membership organisations 36 40 35 40 41 65 64 62 61 V95 Repair of personal goods 4 3 3 3 3 4 3 2 2 V96 Other personal service activities 4 4 3 4 4 6 6 6 6 VT Households as employers 0 0 0 0 0 0 0 0 0

Appendices
54
7.4.4. Appendix: Danish resource subsidies on production and imports
2000 2001 2002 2003 2004 2005 2006 2007 2008
Mill DKK
Total 157 122 102 64 96 87 82 184 170 Households 73 74 69 24 35 50 53 120 110 Other final demands 2 -1 0 5 7 5 3 6 6
Total industries 82 50 32 36 54 32 26 58 54 V01 Agriculture and horticulture 0 0 0 0 0 0 0 0 0 V02 Forestry and logging 0 1 0 1 1 0 0 0 0 V03 Fishing and aquaculture 0 0 0 0 0 0 0 0 0 VB Mining and quarrying 0 0 0 0 0 0 0 0 0 V10-12 Mfr. of food, beverages and tobacco 0 0 0 0 0 0 0 0 0 V13-15 Mfr. of textile and leather 0 0 0 0 0 0 0 0 0 V16 Manufacture of wood etc. 57 33 21 26 40 23 18 41 37 V17 Manufacture of paper etc. 0 0 0 0 0 0 0 0 0 V18 Printing etc. 0 0 0 0 0 0 0 0 0 V19 Oil refinery etc. 0 0 0 0 0 0 0 0 0 V20 Mfr. of chemicals and chemical products 0 0 0 0 0 0 0 0 0 V21 Pharmaceuticals 0 0 0 0 0 0 0 0 0 V22 Manufacture of rubber etc. 0 0 0 0 0 0 0 0 0 V23 Mfr. of other non-metallic mineral products 5 1 1 1 1 1 1 2 1 V24 Manufacture of basic metals 0 0 0 0 0 0 0 0 0 V725 Manufact. of fabricated metal 0 0 0 0 1 0 0 1 1 V26 Manufact. of computers, etc. 0 0 0 0 0 0 0 0 0 V27 Manufacture of electrical equipment 0 0 0 0 0 0 0 0 0 V28 Mfr. of machinery and equipment n.e.c. 0 0 0 0 0 0 0 0 0 V29 Manuf. of motor vehicles etc. 0 0 0 0 0 0 0 0 0 V30 Mf. of ships, transport equip. 0 0 0 0 0 0 0 0 0 V31-32 Mfr. of furniture; other manufacturing 14 7 4 5 7 4 3 7 6 V33 Repair, install of machinery etc 0 0 0 0 0 0 0 0 0 VD Electricity, gas and steam 0 0 0 0 0 0 0 0 0 V36 Water collection, treatment and supply 0 0 0 0 0 0 0 0 0 V37-39 Sewerage and waste 0 0 0 0 0 0 0 0 0 VF Construction 2 1 0 0 1 1 1 1 1 V45 Sale and repair of motor vehicles 0 0 0 0 0 0 0 0 0 V46 Wholesale trade, exc. of motor vehicles 0 0 0 0 0 0 0 0 0 V47 Retail trade, exc. of motor vehicles 0 0 0 0 0 0 0 0 0 V49 Land transport 0 0 0 0 0 0 0 0 0 V50 Water transport 0 0 0 0 0 0 0 0 0 V51 Air transport 0 0 0 0 0 0 0 0 0 V52 Support activities for transport 0 0 0 0 0 0 0 0 0 V53 Postal and courier activities 0 0 0 0 0 0 0 0 0 VI Hotels and restaurants 0 0 0 0 0 0 0 0 0 V58 Publishing activities 0 0 0 0 0 0 0 0 0 V59-60 Tv and radio, motion picture ect. 0 0 0 0 0 0 0 0 0 V61 Telecommunications 0 0 0 0 0 0 0 0 0 V62-63 IT and information service 0 0 0 0 0 0 0 0 0 V64 Financial service activities 0 0 0 0 0 0 0 0 0 V65 Insurance and pension funding 0 0 0 0 0 0 0 0 0 V66 Other financial activities 0 0 0 0 0 0 0 0 0 VL Real estate activities 0 0 0 0 0 0 0 0 0 V68A Of which: Imputed rents 0 0 0 0 0 0 0 0 0 V69-70 Legal and accounting activities 0 0 0 0 0 0 0 0 0 V71 Architecture and engineering activities 0 0 0 0 0 0 0 0 0 V72 Scientific research and development 0 0 0 0 0 0 0 0 0 V73 Advertising and market research 0 0 0 0 0 0 0 0 0 V74-75 Other professional, veterinary activities 0 0 0 0 0 0 0 0 0 V77 Rental and leasing activities 0 0 0 0 0 0 0 0 0 V78 Employment activities 0 0 0 0 0 0 0 0 0 V79 Travel agent activities 0 0 0 0 0 0 0 0 0 V80-82 Security and investigation ect. 0 0 0 0 0 0 0 0 0

Appendices
55
Resource subsidies, continued. 2000 2001 2002 2003 2004 2005 2006 2007 2008
Mill DKK
VO Public administration and defence 2 3 3 1 1 1 1 3 3 VP Education 1 1 1 0 0 0 0 1 1 V86 Human health activities 0 0 0 0 0 0 0 0 0 V87-88 Social work activities 2 2 2 1 1 1 1 2 2 V90-92 Creative, arts and entertainment activities 0 0 0 0 0 0 0 0 0 V93 Sports activities 0 0 0 0 0 0 0 0 0 V94 Activities of membership organisations 0 0 0 0 0 0 0 0 0 V95 Repair of personal goods 0 0 0 0 0 0 0 0 0 V96 Other personal service activities 0 0 0 0 0 0 0 0 0 VT Households as employers 0 0 0 0 0 0 0 0 0

Appendices
56
7.5. Appendix: Danish total environmental taxes, net on production and imports
2000 2001 2002 2003 2004 2005 2006 2007 2008
Mill DKK
Total 46 962 47 671 51 153 49 708 54 976 58 397 60 411 60 269 55 403 Households 26 556 26 034 28 939 27 259 29 251 33 181 33 140 34 355 31 171 Other final demands 6 584 6 179 6 400 6 530 8 586 8 517 9 745 9 946 7 828
Total industries 13 822 15 457 15 814 15 919 17 139 16 698 17 526 15 968 16 403 V01 Agriculture and horticulture 457 655 490 340 439 507 371 -520 -684 V02 Forestry and logging 15 20 17 13 14 12 11 -4 -7 V03 Fishing and aquaculture 50 46 72 46 40 33 26 24 21 VB Mining and quarrying 1 439 1 194 1 174 1 184 1 541 2 101 2 200 1 857 2 549 V10-12 Mfr. of food, beverages and tobacco 798 828 757 795 786 743 768 799 797 V13-15 Mfr. of textile and leather 71 84 82 80 82 61 62 61 61 V16 Manufacture of wood etc. -43 -12 45 26 41 46 53 36 40 V17 Manufacture of paper etc. -7 0 27 23 47 40 42 41 41 V18 Printing etc. 14 21 58 48 73 63 64 66 65 V19 Oil refinery etc. 9 11 11 12 11 11 10 10 10 V20 Mfr. of chemicals and chemical products 175 206 207 211 207 201 189 170 176 V21 Pharmaceuticals 57 63 67 62 60 59 63 53 54 V22 Manufacture of rubber etc. 128 149 149 153 151 149 140 133 132 V23 Mfr. of other non-metallic mineral products 257 232 236 249 258 251 262 272 259 V24 Manufacture of basic metals 67 84 77 84 83 76 77 83 82 V25 Manufact. of fabricated metal 268 330 303 322 332 305 312 331 331 V26 Manufact. of computers, etc. 58 70 67 70 72 64 68 62 61 V27 Manufacture of electrical equipment 39 48 45 47 47 42 44 46 45 V28 Mfr. of machinery and equipment n.e.c. 254 310 288 305 304 273 286 269 271 V29 Manuf. of motor vehicles etc. 30 36 32 35 35 31 32 36 36 V30 Mf. of ships, transport equip. 10 19 19 19 18 6 11 -13 -19 V31-32 Mfr. of furniture; other manufacturing 95 121 120 131 129 124 122 110 111 V33 Repair, install of machinery etc 73 90 87 93 107 101 99 100 101 VD Electricity, gas and steam 98 72 116 144 113 89 96 114 103 V36 Water collection, treatment and supply 33 32 33 35 30 28 68 66 61 V37-39 Sewerage and waste 807 981 830 778 850 832 864 871 843 VF Construction 1 386 1 536 1 641 1 697 1 810 1 888 1 938 2 035 2 069 V45 Sale and repair of motor vehicles 487 511 585 594 634 587 615 623 621 V46 Wholesale trade, exc. of motor vehicles 1 366 1 134 1 435 1 448 1 520 1 445 1 515 1 565 1 603 V47 Retail trade, exc. of motor vehicles 568 743 635 670 718 654 685 692 704 V49 Land transport -131 733 852 672 856 1 587 2 010 2 122 2 158 V50 Water transport 15 19 17 17 19 19 20 21 18 V51 Air transport 9 10 10 10 11 11 12 11 10 V52 Support activities for transport 355 377 374 390 426 436 448 489 455 V53 Postal and courier activities 51 84 60 59 74 48 42 73 74 VI Hotels and restaurants 257 299 296 277 307 287 297 312 317 V58 Publishing activities 24 31 67 52 71 59 61 67 66 V59-60 Tv and radio, motion picture ect. 18 52 12 5 29 -37 -40 -197 -230 V61 Telecommunications 131 198 131 127 149 95 97 213 205 V62-63 IT and information service 66 80 90 98 106 91 93 91 94 V64 Financial service activities 178 206 202 218 213 182 194 201 215 V65 Insurance and pension funding 49 56 51 56 52 45 47 44 47 V66 Other financial activities 15 17 16 16 15 13 14 13 14 VL Real estate activities 171 170 68 82 165 -343 -289 -921 -1 083 V68A Of which: Imputed rents 17 18 17 18 18 19 19 18 18 V69-70 Legal and accounting activities 115 126 153 168 175 165 168 168 173 V71 Architecture and engineering activities 175 196 237 267 279 257 262 207 189 V72 Scientific research and development 16 23 28 31 33 18 24 -9 -16 V73 Advertising and market research 53 60 73 81 84 79 80 82 86 V74-75 Other professional, veterinary activities 45 42 54 59 60 56 55 52 52 V77 Rental and leasing activities 64 68 63 64 71 96 92 92 92 V78 Employment activities 44 52 58 62 65 62 61 63 67 V79 Travel agent activities -32 41 53 41 49 86 94 -18 -21 V80-82 Security and investigation ect. 268 315 314 338 316 301 298 321 333

Appendices
57
Total environmental taxes, net, continued. 2000 2001 2002 2003 2004 2005 2006 2007 2008
Mill DKK
VO Public administration and defence 615 649 670 721 766 645 618 590 609 VP Education 714 787 657 717 648 466 496 548 567 V86 Human health activities 521 215 473 527 495 414 438 469 479 V87-88 Social work activities 589 332 619 658 575 377 389 518 513 V90-92 Creative, arts and entertainment activities 154 254 173 164 197 155 154 155 168 V93 Sports activities 103 176 112 110 135 104 100 98 109 V94 Activities of membership organisations 43 83 52 44 57 24 23 23 29 V95 Repair of personal goods 35 43 37 40 44 40 40 41 41 V96 Other personal service activities 32 48 33 33 42 35 35 37 37 VT Households as employers 0 0 0 0 0 0 0 0 0

Appendices
58
7.5.1. Appendix: Danish pollution1 taxes, net on production and imports
2000 2001 2002 2003 2004 2005 2006 2007 2008
Mill DKK
Total 2 015 1 995 2 067 1 650 1 857 2 195 2 235 2 231 2 279 Households 648 649 668 584 617 659 656 694 726 Other final demands 98 106 107 69 69 75 86 77 70
Total industries 1 270 1 241 1 293 997 1 171 1 461 1 493 1 460 1 483 V01 Agriculture and horticulture -293 -403 -339 -499 -473 79 19 27 122 V02 Forestry and logging -9 -10 -9 -12 -12 -2 -3 -3 -3 V03 Fishing and aquaculture -28 -25 0 -24 -23 -23 -29 -27 -26 VB Mining and quarrying 2 1 1 1 1 1 1 1 1 V10-12 Mfr. of food, beverages and tobacco 354 319 286 303 285 252 260 280 281 V13-15 Mfr. of textile and leather 4 4 4 3 3 2 1 1 1 V16 Manufacture of wood etc. 1 2 2 2 2 2 2 1 1 V17 Manufacture of paper etc. 2 3 3 3 3 2 2 2 2 V18 Printing etc. 2 3 3 3 3 3 3 3 3 V19 Oil refinery etc. 2 2 2 2 2 1 1 1 1 V20 Mfr. of chemicals and chemical products 20 17 28 20 16 12 13 14 17 V21 Pharmaceuticals 23 22 26 22 21 19 21 22 22 V22 Manufacture of rubber etc. 24 23 27 23 22 20 22 22 22 V23 Mfr. of other non-metallic mineral products 6 8 7 6 6 4 4 3 3 V24 Manufacture of basic metals 0 1 1 1 1 0 0 -0 -0 V25 Manufact. of fabricated metal 33 42 44 44 47 43 42 41 36 V26 Manufact. of computers, etc. 11 14 14 14 14 12 12 11 10 V27 Manufacture of electrical equipment 10 11 11 11 11 9 9 12 11 V28 Mfr. of machinery and equipment n.e.c. 23 31 33 32 36 32 32 26 25 V29 Manuf. of motor vehicles etc. 4 5 5 5 5 4 4 4 4 V30 Mf. of ships, transport equip. 1 6 6 6 6 -1 -1 -2 -2 V31-32 Mfr. of furniture; other manufacturing 5 8 10 9 10 11 10 11 10 V33 Repair, install of machinery etc 5 6 6 7 6 6 5 4 4 VD Electricity, gas and steam 27 17 25 21 24 23 19 19 18 V36 Water collection, treatment and supply -0 -0 -1 -4 -3 1 1 0 -0 V37-39 Sewerage and waste 508 505 488 453 473 486 523 542 492 VF Construction 11 39 38 35 33 37 32 30 27 V45 Sale and repair of motor vehicles 10 15 18 16 17 16 23 18 16 V46 Wholesale trade, exc. of motor vehicles 170 165 266 265 252 265 315 339 347 V47 Retail trade, exc. of motor vehicles 96 88 82 96 104 100 100 97 97 V49 Land transport 2 8 -7 -8 4 -25 -28 -33 -29 V50 Water transport 2 3 2 1 2 0 0 -0 -0 V51 Air transport 0 0 0 0 0 0 -0 -0 -0 V52 Support activities for transport 9 12 6 5 7 3 2 1 0 V53 Postal and courier activities -0 1 1 1 1 0 -0 -1 -1 VI Hotels and restaurants 39 57 61 45 43 43 47 50 50 V58 Publishing activities 2 3 3 3 3 2 2 2 1 V59-60 Tv and radio, motion picture ect. 0 0 -14 -14 -3 -30 -33 -39 -34 V61 Telecommunications -2 9 8 5 6 -1 -1 -5 -7 V62-63 IT and information service 6 8 4 5 6 4 3 -1 -3 V64 Financial service activities 5 4 4 3 3 2 2 0 -1 V65 Insurance and pension funding 0 0 0 -0 -0 -0 -1 -1 -1 V66 Other financial activities 3 3 2 2 2 2 2 1 1 VL Real estate activities -0 1 -90 -81 -1 -171 -151 -175 -152 V68A Of which: Imputed rents 0 0 0 0 0 0 0 0 0 V69-70 Legal and accounting activities 2 3 0 1 1 0 -1 -2 -3 V71 Architecture and engineering activities 6 10 3 5 7 2 0 -5 -8 V72 Scientific research and development 4 7 2 4 5 2 1 -1 -1 V73 Advertising and market research 0 1 0 0 1 0 0 -0 -1 V74-75 Other professional, veterinary activities 1 1 0 1 1 -0 -1 -2 -3 V77 Rental and leasing activities 4 5 2 3 6 2 4 3 2 V78 Employment activities 0 0 0 0 0 0 -0 -1 -1 V79 Travel agent activities 0 0 -0 -0 0 -0 -0 -1 -1 V80-82 Security and investigation ect. 7 6 5 7 9 13 9 16 19

Appendices
59
Pollution taxes, net, continued. 2000 2001 2002 2003 2004 2005 2006 2007 2008
Mill DKK
VO Public administration and defence 47 54 65 52 57 54 50 44 36 VP Education 17 13 17 4 9 29 33 28 22 V86 Human health activities 28 36 43 32 37 23 22 8 -2 V87-88 Social work activities 40 52 69 39 49 78 76 64 51 V90-92 Creative, arts and entertainment activities 10 10 8 8 9 5 5 4 3 V93 Sports activities 6 6 4 4 5 3 3 2 1 V94 Activities of membership organisations 3 3 2 2 3 0 -0 -1 -2 V95 Repair of personal goods 3 3 3 3 4 3 3 3 2 V96 Other personal service activities 3 3 2 2 2 2 2 2 2 VT Households as employers 0 0 0 0 0 0 0 0 0
1 Exclusive of SO
2 taxes

Appendices
60
7.5.2. Appendix: Danish energy1 taxes, net on production and imports
2000 2001 2002 2003 2004 2005 2006 2007 2008
Mill DKK
Total 32 277 34 867 35 228 36 421 36 732 36 126 36 005 36 181 36 478 Households 19 965 21 631 22 012 22 346 22 208 22 022 21 667 21 302 21 262 Other final demands -106 -88 -27 -13 -31 -33 -48 -26 -51
Total industries 12 418 13 325 13 243 14 087 14 555 14 138 14 386 14 904 15 267 V01 Agriculture and horticulture 587 881 655 686 742 750 764 805 822 V02 Forestry and logging 13 19 14 15 15 16 16 17 17 V03 Fishing and aquaculture 70 62 65 64 57 53 53 53 50 VB Mining and quarrying 26 73 29 37 37 33 29 27 25 V10-12 Mfr. of food, beverages and tobacco 444 521 469 499 506 518 511 524 523 V13-15 Mfr. of textile and leather 65 73 69 69 69 54 53 52 52 V16 Manufacture of wood etc. 10 17 60 47 74 65 66 72 73 V17 Manufacture of paper etc. -9 -2 23 20 44 39 39 38 38 V18 Printing etc. 6 13 48 38 62 55 56 57 57 V19 Oil refinery etc. 7 9 9 10 9 9 8 9 8 V20 Mfr. of chemicals and chemical products 160 196 186 200 199 197 181 161 164 V21 Pharmaceuticals 53 65 62 67 66 66 60 52 52 V22 Manufacture of rubber etc. 101 125 119 129 127 126 116 108 107 V23 Mfr. of other non-metallic mineral products 170 162 166 183 185 183 187 196 194 V24 Manufacture of basic metals 55 72 63 69 67 62 64 70 70 V25 Manufact. of fabricated metal 208 268 230 249 253 235 241 259 264 V26 Manufact. of computers, etc. 42 54 46 50 50 48 49 49 49 V27 Manufacture of electrical equipment 29 38 32 35 35 33 33 33 33 V28 Mfr. of machinery and equipment n.e.c. 215 272 235 255 247 231 236 230 233 V29 Manuf. of motor vehicles etc. 25 31 26 29 28 26 26 31 31 V30 Mf. of ships, transport equip. 22 29 25 27 26 24 24 27 27 V31-32 Mfr. of furniture; other manufacturing 107 124 115 130 129 119 112 104 105 V33 Repair, install of machinery etc 50 69 62 65 79 75 75 75 76 VD Electricity, gas and steam 71 57 94 127 93 78 74 92 81 V36 Water collection, treatment and supply 13 10 17 23 17 14 13 12 11 V37-39 Sewerage and waste 279 457 319 302 352 333 328 316 338 VF Construction 904 979 1 032 1 088 1 146 1 178 1 226 1 314 1 365 V45 Sale and repair of motor vehicles 328 318 359 374 389 384 392 409 416 V46 Wholesale trade, exc. of motor vehicles 946 767 918 949 1 003 980 992 1 022 1 052 V47 Retail trade, exc. of motor vehicles 449 583 474 505 535 503 516 528 542 V49 Land transport 1 997 1 949 1 948 2 043 2 192 2 241 2 343 2 538 2 659 V50 Water transport 12 12 12 13 14 14 15 18 15 V51 Air transport 8 8 8 8 9 9 10 10 9 V52 Support activities for transport 328 322 321 340 368 378 394 452 421 V53 Postal and courier activities 69 81 60 61 74 68 68 71 74 VI Hotels and restaurants 206 228 216 214 244 232 232 242 247 V58 Publishing activities 20 25 59 47 64 56 57 62 61 V59-60 Tv and radio, motion picture ect. 57 97 64 63 76 73 72 72 77 V61 Telecommunications 176 212 155 159 183 172 174 213 210 V62-63 IT and information service 56 64 74 85 89 86 88 91 96 V64 Financial service activities 186 206 195 217 209 192 196 201 214 V65 Insurance and pension funding 52 58 53 58 54 49 50 51 55 V66 Other financial activities 13 14 13 15 14 12 12 13 13 VL Real estate activities 167 169 158 165 167 167 168 184 179 V68A Of which: Imputed rents 15 15 14 14 14 14 14 13 13 V69-70 Legal and accounting activities 96 104 129 147 150 145 149 161 168 V71 Architecture and engineering activities 163 177 219 251 259 251 257 216 201 V72 Scientific research and development 35 38 47 53 55 53 55 59 62 V73 Advertising and market research 44 48 60 68 70 67 69 72 76 V74-75 Other professional, veterinary activities 33 29 40 46 45 44 45 44 44 V77 Rental and leasing activities 22 22 21 22 22 22 22 24 24 V78 Employment activities 40 48 53 57 60 56 57 60 63 V79 Travel agent activities 29 27 28 30 27 26 28 32 29 V80-82 Security and investigation ect. 181 226 219 245 211 206 212 227 237

Appendices
61
Energy taxes, net, continued. 2000 2001 2002 2003 2004 2005 2006 2007 2008
Mill DKK
VO Public administration and defence 536 506 508 557 584 555 532 543 570 VP Education 820 942 830 913 844 770 795 795 815 V86 Human health activities 492 193 467 518 482 445 475 461 483 V87-88 Social work activities 752 540 840 929 851 792 806 785 792 V90-92 Creative, arts and entertainment activities 162 270 183 177 209 198 195 194 208 V93 Sports activities 109 186 121 123 147 139 136 136 146 V94 Activities of membership organisations 67 112 77 73 86 81 80 80 85 V95 Repair of personal goods 22 27 22 24 26 26 26 27 27 V96 Other personal service activities 21 38 22 22 29 29 29 31 31 VT Households as employers 0 0 0 0 0 0 0 0 0
1 Inclusive of SO
2 taxes

Appendices
62
7.5.3. Appendix: Danish transport taxes, net on production and imports
2000 2001 2002 2003 2004 2005 2006 2007 2008
Mill DKK
Total 9 887 8 250 11 244 8 990 13 374 16 538 18 493 18 635 12 749 Households 4 879 2 556 5 040 3 115 5 201 9 331 9 636 11 255 8 072 Other final demands 6 595 6 160 6 318 6 476 8 552 8 474 9 712 9 903 7 816
Total industries -1 586 -467 -115 -601 -379 -1 268 -855 -2 522 -3 139 V01 Agriculture and horticulture 160 176 173 152 170 -324 -414 -1 355 -1 629 V02 Forestry and logging 11 12 12 10 12 -1 -2 -17 -21 V03 Fishing and aquaculture 8 8 6 6 6 3 1 -2 -3 VB Mining and quarrying -2 -3 -1 -2 -2 -1 1 1 1 V10-12 Mfr. of food, beverages and tobacco -0 -12 2 -8 -5 -27 -2 -5 -6 V13-15 Mfr. of textile and leather 2 7 9 9 10 6 8 8 7 V16 Manufacture of wood etc. 2 2 4 3 4 3 3 4 4 V17 Manufacture of paper etc. -1 -1 0 -1 -0 -1 0 1 1 V18 Printing etc. 5 6 7 6 7 6 5 6 6 V19 Oil refinery etc. 0 0 1 0 0 0 0 0 0 V20 Mfr. of chemicals and chemical products -6 -8 -8 -10 -9 -9 -5 -5 -5 V21 Pharmaceuticals -19 -24 -21 -27 -27 -25 -18 -20 -20 V22 Manufacture of rubber etc. 2 1 3 1 2 2 2 2 3 V23 Mfr. of other non-metallic mineral products 9 2 8 7 8 4 8 9 9 V24 Manufacture of basic metals 12 11 13 14 15 13 13 13 12 V25 Manufact. of fabricated metal 24 20 27 28 31 24 26 28 29 V26 Manufact. of computers, etc. 5 2 7 6 8 4 7 1 1 V27 Manufacture of electrical equipment 0 -0 1 1 2 0 1 2 2 V28 Mfr. of machinery and equipment n.e.c. 16 7 19 18 21 10 19 13 13 V29 Manuf. of motor vehicles etc. 1 0 1 1 1 1 1 1 1 V30 Mf. of ships, transport equip. -13 -15 -11 -14 -14 -17 -12 -37 -44 V31-32 Mfr. of furniture; other manufacturing -4 -5 -1 -3 -2 -2 3 2 3 V33 Repair, install of machinery etc 18 16 19 20 23 20 20 21 21 VD Electricity, gas and steam -0 -2 -3 -4 -4 -12 2 4 4 V36 Water collection, treatment and supply 21 22 17 15 16 13 54 53 50 V37-39 Sewerage and waste 18 17 21 20 23 12 11 11 11 VF Construction 386 433 493 499 549 572 563 575 580 V45 Sale and repair of motor vehicles 149 177 208 203 227 187 200 196 190 V46 Wholesale trade, exc. of motor vehicles 250 202 251 234 264 200 208 203 204 V47 Retail trade, exc. of motor vehicles 22 72 79 69 79 51 69 67 66 V49 Land transport -2 133 -1 227 -1 092 -1 365 -1 342 -631 -307 -385 -474 V50 Water transport -0 3 4 3 4 5 5 3 3 V51 Air transport 0 1 2 1 2 2 2 1 1 V52 Support activities for transport 14 39 43 41 48 53 49 33 32 V53 Postal and courier activities -18 2 -1 -2 -1 -20 -26 3 1 VI Hotels and restaurants 12 13 20 18 20 12 18 20 20 V58 Publishing activities 2 2 5 2 4 0 1 4 3 V59-60 Tv and radio, motion picture ect. -40 -45 -38 -45 -45 -79 -79 -230 -274 V61 Telecommunications -44 -24 -33 -37 -41 -77 -76 4 1 V62-63 IT and information service 4 7 12 8 10 1 2 0 1 V64 Financial service activities -14 -7 2 -3 -1 -14 -5 -1 0 V65 Insurance and pension funding -4 -3 -2 -3 -3 -4 -3 -6 -7 V66 Other financial activities -1 -1 -0 -1 -0 -1 -0 -0 -0 VL Real estate activities -0 -4 -6 -10 -9 -349 -316 -940 -1 120 V68A Of which: Imputed rents 1 1 1 1 1 1 1 1 1 V69-70 Legal and accounting activities 15 18 23 19 23 18 17 8 7 V71 Architecture and engineering activities 6 9 15 10 13 3 5 -5 -4 V72 Scientific research and development -23 -21 -22 -27 -27 -38 -32 -67 -78 V73 Advertising and market research 9 10 13 12 14 12 11 10 10 V74-75 Other professional, veterinary activities 10 11 13 12 14 12 10 9 9 V77 Rental and leasing activities 39 41 40 39 43 72 65 64 66 V78 Employment activities 4 4 5 5 5 5 5 4 4 V79 Travel agent activities -62 13 24 11 22 60 66 -50 -51 V80-82 Security and investigation ect. 74 80 87 83 92 77 72 73 73

Appendices
63
Transport taxes, net, continued. 2000 2001 2002 2003 2004 2005 2006 2007 2008
Mill DKK
VO Public administration and defence 23 85 92 81 94 11 12 -19 -19 VP Education -215 -222 -247 -270 -277 -388 -389 -331 -326 V86 Human health activities -20 -26 -50 -37 -39 -66 -73 -14 -15 V87-88 Social work activities -246 -285 -315 -344 -359 -520 -522 -358 -358 V90-92 Creative, arts and entertainment activities -27 -32 -24 -28 -27 -53 -51 -49 -48 V93 Sports activities -18 -19 -18 -21 -22 -41 -43 -44 -43 V94 Activities of membership organisations -29 -33 -28 -32 -33 -58 -58 -58 -56 V95 Repair of personal goods 10 12 13 12 14 11 12 12 12 V96 Other personal service activities 8 7 10 9 11 5 4 5 5 VT Households as employers 0 0 0 0 0 0 0 0 0

Appendices
64
7.5.4. Appendix: Danish resource taxes, net on production and imports
2000 2001 2002 2003 2004 2005 2006 2007 2008
Mill DKK
Total 2 783 2 559 2 614 2 648 3 013 3 538 3 679 3 222 3 897 Households 1 064 1 199 1 219 1 213 1 225 1 170 1 182 1 104 1 112 Other final demands -2 1 2 -2 -4 2 -5 -8 -7
Total industries 1 720 1 359 1 392 1 436 1 792 2 367 2 501 2 126 2 792 V01 Agriculture and horticulture 2 1 1 1 1 2 2 2 1 V02 Forestry and logging 0 -1 -0 -1 -1 -0 -0 -0 -0 V03 Fishing and aquaculture 0 0 0 0 0 0 0 0 0 VB Mining and quarrying 1 413 1 123 1 146 1 149 1 505 2 069 2 170 1 829 2 522 V10-12 Mfr. of food, beverages and tobacco 0 -0 -0 -0 -0 -0 -0 -0 -0 V13-15 Mfr. of textile and leather 0 0 0 0 0 0 0 0 0 V16 Manufacture of wood etc. -57 -33 -21 -26 -40 -23 -18 -41 -37 V17 Manufacture of paper etc. 0 0 0 0 0 0 0 0 0 V18 Printing etc. 0 0 0 0 0 0 0 0 0 V19 Oil refinery etc. 0 0 0 0 0 0 0 0 0 V20 Mfr. of chemicals and chemical products 0 0 0 0 0 0 0 0 0 V21 Pharmaceuticals 0 0 0 0 0 0 0 0 0 V22 Manufacture of rubber etc. 1 0 0 0 0 1 1 1 1 V23 Mfr. of other non-metallic mineral products 71 60 55 54 59 61 64 64 53 V24 Manufacture of basic metals 0 0 0 0 0 0 0 0 0 V25 Manufact. of fabricated metal 2 1 1 1 1 2 3 2 2 V26 Manufact. of computers, etc. 0 -0 -0 -0 -0 -0 -0 -0 -0 V27 Manufacture of electrical equipment 0 0 0 0 0 0 0 0 0 V28 Mfr. of machinery and equipment n.e.c. 0 0 0 0 0 0 0 0 0 V29 Manuf. of motor vehicles etc. 0 0 0 0 0 0 0 0 0 V30 Mf. of ships, transport equip. 0 0 0 0 0 0 0 0 0 V31-32 Mfr. of furniture; other manufacturing -14 -7 -4 -5 -7 -4 -3 -7 -6 V33 Repair, install of machinery etc -0 -0 -0 -0 -0 -0 -0 -0 -0 VD Electricity, gas and steam 0 0 0 0 0 0 0 0 0 V36 Water collection, treatment and supply 0 0 0 0 0 0 0 0 0 V37-39 Sewerage and waste 3 2 2 2 2 2 2 2 2 VF Construction 86 85 77 75 82 101 117 116 97 V45 Sale and repair of motor vehicles 0 0 0 0 0 0 0 0 0 V46 Wholesale trade, exc. of motor vehicles 0 0 0 0 0 0 0 0 0 V47 Retail trade, exc. of motor vehicles 0 0 0 0 0 0 0 0 0 V49 Land transport 3 2 3 2 2 2 2 2 2 V50 Water transport 0 0 0 0 0 0 0 0 0 V51 Air transport 0 0 0 0 0 0 0 0 0 V52 Support activities for transport 4 4 4 3 3 3 3 3 3 V53 Postal and courier activities 0 0 0 0 0 0 0 0 0 VI Hotels and restaurants 0 0 0 0 0 0 0 0 0 V58 Publishing activities 0 0 0 0 0 0 0 0 0 V59-60 Tv and radio, motion picture ect. 1 1 0 1 1 1 1 1 1 V61 Telecommunications 1 1 1 1 1 1 1 0 0 V62-63 IT and information service 0 0 0 0 0 0 0 0 0 V64 Financial service activities 2 1 1 2 2 1 2 1 1 V65 Insurance and pension funding 1 0 0 1 1 0 0 0 0 V66 Other financial activities 0 0 0 0 0 0 0 0 0 VL Real estate activities 5 5 6 8 8 10 10 10 10 V68A Of which: Imputed rents 2 2 2 3 3 4 4 4 4 V69-70 Legal and accounting activities 2 2 2 1 1 2 2 2 2 V71 Architecture and engineering activities 0 0 0 0 0 0 0 0 0 V72 Scientific research and development 1 1 1 1 1 1 1 1 1 V73 Advertising and market research 0 0 0 0 0 0 0 0 0 V74-75 Other professional, veterinary activities 1 1 1 1 1 1 1 1 1 V77 Rental and leasing activities 0 0 0 0 0 0 0 0 0 V78 Employment activities 0 0 0 0 0 0 0 0 0 V79 Travel agent activities 1 1 1 1 1 1 1 1 1 V80-82 Security and investigation ect. 5 3 3 3 3 5 5 5 5

Appendices
65
Resource taxes, net, continued. 2000 2001 2002 2003 2004 2005 2006 2007 2008
Mill DKK
VO Public administration and defence 10 4 5 31 31 24 24 22 22 VP Education 93 53 57 71 72 54 57 56 56 V86 Human health activities 21 12 13 15 15 13 13 13 13 V87-88 Social work activities 43 25 26 34 34 27 29 28 28 V90-92 Creative, arts and entertainment activities 9 6 6 7 6 6 6 6 6 V93 Sports activities 6 4 4 4 5 4 4 4 4 V94 Activities of membership organisations 2 1 1 1 1 1 1 1 1 V95 Repair of personal goods 0 0 0 0 0 0 0 0 0 V96 Other personal service activities 0 0 0 0 0 0 0 0 0 VT Households as employers 0 0 0 0 0 0 0 0 0

Appendices
66
7.6. Appendix: Danish CO2 and SO
2 taxes on production and imports
7.6.1. Appendix: Danish CO2 taxes on production and imports
2000 2001 2002 2003 2004 2005 2006 2007 2008
Mill DKK
Total 4 885 4 837 4 626 4 828 4 930 5 153 5 087 5 110 5 058 Households 2 020 1 981 1 945 1 983 2 008 2 399 2 337 2 320 2 266 Other final demands 0 0 0 0 0 0 0 0 0
Total industries 2 865 2 856 2 681 2 845 2 922 2 754 2 750 2 789 2 792 V01 Agriculture and horticulture 285 284 267 283 291 274 274 281 275 V02 Forestry and logging 4 4 4 4 4 4 4 4 4 V03 Fishing and aquaculture 43 43 40 43 44 41 41 40 38 VB Mining and quarrying 14 14 13 14 15 14 14 12 12 V10-12 Mfr. of food, beverages and tobacco 215 215 201 214 220 207 207 207 199 V13-15 Mfr. of textile and leather 17 17 16 16 17 16 16 16 15 V16 Manufacture of wood etc. 24 24 22 24 24 23 23 24 23 V17 Manufacture of paper etc. 16 16 15 16 16 15 15 14 14 V18 Printing etc. 22 22 21 22 23 21 21 23 22 V19 Oil refinery etc. 4 4 4 4 5 4 4 5 5 V20 Mfr. of chemicals and chemical products 52 52 49 52 53 50 50 46 44 V21 Pharmaceuticals 22 22 21 22 23 22 22 19 19 V22 Manufacture of rubber etc. 56 56 52 55 57 54 53 51 49 V23 Mfr. of other non-metallic mineral products 74 74 69 73 75 71 71 75 69 V24 Manufacture of basic metals 28 28 26 27 28 27 27 27 26 V25 Manufact. of fabricated metal 56 55 52 55 57 53 53 58 56 V26 Manufact. of computers, etc. 16 16 15 16 17 16 16 15 15 V27 Manufacture of electrical equipment 9 9 9 9 9 9 9 10 9 V28 Mfr. of machinery and equipment n.e.c. 66 65 61 65 67 63 63 65 63 V29 Manuf. of motor vehicles etc. 10 10 9 10 10 9 9 12 11 V30 Mf. of ships, transport equip. 9 9 8 9 9 9 9 9 9 V31-32 Mfr. of furniture; other manufacturing 45 45 42 45 46 44 43 35 34 V33 Repair, install of machinery etc 13 13 12 13 13 12 12 14 13 VD Electricity, gas and steam 4 4 4 4 4 4 4 5 4 V36 Water collection, treatment and supply 12 12 12 12 13 12 12 10 10 V37-39 Sewerage and waste 52 52 49 51 53 50 50 48 51 VF Construction 160 159 150 159 163 154 153 163 167 V45 Sale and repair of motor vehicles 55 54 51 54 56 52 52 55 53 V46 Wholesale trade, exc. of motor vehicles 179 179 168 178 183 172 172 171 169 V47 Retail trade, exc. of motor vehicles 168 168 157 167 171 162 161 159 160 V49 Land transport 236 235 221 234 240 227 226 252 248 V50 Water transport 2 2 2 2 2 2 2 2 2 V51 Air transport 2 2 2 2 2 2 2 2 1 V52 Support activities for transport 72 71 67 71 73 69 69 77 73 V53 Postal and courier activities 11 11 10 11 11 11 11 11 12 VI Hotels and restaurants 66 66 62 65 67 63 63 66 65 V58 Publishing activities 17 16 15 16 17 16 16 17 17 V59-60 Tv and radio, motion picture ect. 13 13 13 13 14 13 13 13 14 V61 Telecommunications 31 31 29 31 32 30 30 37 38 V62-63 IT and information service 22 22 20 22 22 21 21 23 25 V64 Financial service activities 29 29 27 28 29 28 27 27 31 V65 Insurance and pension funding 7 7 7 7 8 7 7 7 8 V66 Other financial activities 2 2 2 2 2 2 2 2 2 VL Real estate activities 22 22 21 22 23 21 21 24 23 V68A Of which: Imputed rents 2 2 2 2 2 2 2 1 1 V69-70 Legal and accounting activities 22 22 21 22 23 21 21 22 25 V71 Architecture and engineering activities 37 37 34 36 37 35 35 27 26 V72 Scientific research and development 8 8 8 8 8 8 8 8 9 V73 Advertising and market research 14 14 13 14 14 13 13 14 15 V74-75 Other professional, veterinary activities 7 7 6 7 7 7 7 6 7 V77 Rental and leasing activities 4 4 4 4 4 4 4 4 4 V78 Employment activities 10 10 10 10 11 10 10 10 11 V79 Travel agent activities 6 5 5 5 6 5 5 6 6 V80-82 Security and investigation ect. 35 34 32 34 35 33 33 35 37

Appendices
67
CO2 taxes, continued. 2000 2001 2002 2003 2004 2005 2006 2007 2008
Mill DKK
VO Public administration and defence 73 73 68 73 75 70 70 70 75 VP Education 118 117 110 117 120 113 113 108 117 V86 Human health activities 71 70 66 70 72 68 68 63 70 V87-88 Social work activities 118 118 110 117 120 113 113 106 112 V90-92 Creative, arts and entertainment activities 31 30 29 30 31 29 29 28 32 V93 Sports activities 26 26 24 26 26 25 25 24 27 V94 Activities of membership organisations 12 12 11 12 12 11 11 11 12 V95 Repair of personal goods 5 5 5 5 5 5 5 5 5 V96 Other personal service activities 6 6 6 6 6 6 6 6 6 VT Households as employers 0 0 0 0 0 0 0 0 0

Appendices
68
7.6.2. Appendix: Danish SO2 taxes on production and imports
2000 2001 2002 2003 2004 2005 2006 2007 2008
Mill DKK
Total 164 109 123 191 115 76 69 108 82 Households 44 18 22 34 28 19 17 32 24 Other final demands 0 0 0 0 0 0 0 0 0
Total industries 120 91 101 156 88 57 51 77 57 V01 Agriculture and horticulture 6 4 5 8 4 3 3 4 3 V02 Forestry and logging 0 0 0 0 0 0 0 0 0 V03 Fishing and aquaculture 2 1 2 2 1 1 1 1 1 VB Mining and quarrying 0 0 0 0 0 0 0 0 0 V10-12 Mfr. of food, beverages and tobacco 4 3 3 5 3 2 2 2 1 V13-15 Mfr. of textile and leather 0 0 0 0 0 0 0 0 0 V16 Manufacture of wood etc. 0 0 0 0 0 0 0 0 0 V17 Manufacture of paper etc. 0 0 0 0 0 0 0 0 0 V18 Printing etc. 0 0 0 0 0 0 0 0 0 V19 Oil refinery etc. 0 0 0 0 0 0 0 0 0 V20 Mfr. of chemicals and chemical products 1 1 1 1 1 1 0 0 0 V21 Pharmaceuticals 0 0 0 0 0 0 0 0 0 V22 Manufacture of rubber etc. 0 0 0 0 0 0 0 0 0 V23 Mfr. of other non-metallic mineral products 1 1 1 1 1 0 0 1 0 V24 Manufacture of basic metals 0 0 0 0 0 0 0 0 0 V25 Manufact. of fabricated metal 1 0 0 1 0 0 0 0 0 V26 Manufact. of computers, etc. 0 0 0 0 0 0 0 0 0 V27 Manufacture of electrical equipment 0 0 0 0 0 0 0 0 0 V28 Mfr. of machinery and equipment n.e.c. 1 0 1 1 0 0 0 0 0 V29 Manuf. of motor vehicles etc. 0 0 0 0 0 0 0 0 0 V30 Mf. of ships, transport equip. 0 0 0 0 0 0 0 0 0 V31-32 Mfr. of furniture; other manufacturing 0 0 0 0 0 0 0 0 0 V33 Repair, install of machinery etc 0 0 0 0 0 0 0 0 0 VD Electricity, gas and steam 72 55 61 94 53 34 31 45 34 V36 Water collection, treatment and supply 0 0 0 0 0 0 0 0 0 V37-39 Sewerage and waste 0 0 0 0 0 0 0 0 0 VF Construction 4 3 3 5 3 2 2 3 2 V45 Sale and repair of motor vehicles 1 0 1 1 0 0 0 0 0 V46 Wholesale trade, exc. of motor vehicles 2 1 1 2 1 1 1 1 1 V47 Retail trade, exc. of motor vehicles 0 0 0 1 0 0 0 0 0 V49 Land transport 7 5 6 9 5 3 3 5 4 V50 Water transport 13 9 11 16 9 6 5 8 6 V51 Air transport 0 0 0 0 0 0 0 0 0 V52 Support activities for transport 0 0 0 1 0 0 0 0 0 V53 Postal and courier activities 0 0 0 0 0 0 0 0 0 VI Hotels and restaurants 0 0 0 0 0 0 0 0 0 V58 Publishing activities 0 0 0 0 0 0 0 0 0 V59-60 Tv and radio, motion picture ect. 0 0 0 0 0 0 0 0 0 V61 Telecommunications 0 0 0 0 0 0 0 0 0 V62-63 IT and information service 0 0 0 0 0 0 0 0 0 V64 Financial service activities 0 0 0 0 0 0 0 0 0 V65 Insurance and pension funding 0 0 0 0 0 0 0 0 0 V66 Other financial activities 0 0 0 0 0 0 0 0 0 VL Real estate activities 0 0 0 0 0 0 0 0 0 V68A Of which: Imputed rents 0 0 0 0 0 0 0 0 0 V69-70 Legal and accounting activities 0 0 0 0 0 0 0 0 0 V71 Architecture and engineering activities 0 0 0 0 0 0 0 0 0 V72 Scientific research and development 0 0 0 0 0 0 0 0 0 V73 Advertising and market research 0 0 0 0 0 0 0 0 0 V74-75 Other professional, veterinary activities 0 0 0 0 0 0 0 0 0 V77 Rental and leasing activities 0 0 0 0 0 0 0 0 0 V78 Employment activities 0 0 0 0 0 0 0 0 0 V79 Travel agent activities 0 0 0 0 0 0 0 0 0 V80-82 Security and investigation ect. 1 0 1 1 0 0 0 0 0

Appendices
69
SO2 taxes, continued. 2000 2001 2002 2003 2004 2005 2006 2007 2008
Mill DKK
VO Public administration and defence 1 1 1 1 1 0 0 0 0 VP Education 1 0 1 1 0 0 0 0 0 V86 Human health activities 0 0 0 0 0 0 0 0 0 V87-88 Social work activities 1 0 1 1 0 0 0 0 0 V90-92 Creative, arts and entertainment activities 0 0 0 0 0 0 0 0 0 V93 Sports activities 0 0 0 0 0 0 0 0 0 V94 Activities of membership organisations 0 0 0 0 0 0 0 0 0 V95 Repair of personal goods 0 0 0 0 0 0 0 0 0 V96 Other personal service activities 0 0 0 0 0 0 0 0 0 VT Households as employers 0 0 0 0 0 0 0 0 0