Introduction North Eastern United States Deciduous mixed ForestsNorth Eastern United States...
23
Introduction Introduction • North Eastern United States North Eastern United States Deciduous mixed Forests Deciduous mixed Forests • Hubbard Brook Experimental Forest Hubbard Brook Experimental Forest • Calcium additions to acidic Hardwood Calcium additions to acidic Hardwood forests forests • Harvard Forest Harvard Forest • Effects of the increases in soil Effects of the increases in soil temperature temperature GEOG 4401/5401 Soils Geography Fall 2007 – Univ of Colorado, Boulder Jennifer Morse & Meghan Mariani
-
Upload
andrea-warner -
Category
Documents
-
view
216 -
download
1
Transcript of Introduction North Eastern United States Deciduous mixed ForestsNorth Eastern United States...

IntroductionIntroduction
• North Eastern United States Deciduous North Eastern United States Deciduous mixed Forestsmixed Forests• Hubbard Brook Experimental ForestHubbard Brook Experimental Forest
• Calcium additions to acidic Hardwood forestsCalcium additions to acidic Hardwood forests
• Harvard ForestHarvard Forest• Effects of the increases in soil temperatureEffects of the increases in soil temperature
GEOG 4401/5401 Soils GeographyFall 2007 – Univ of Colorado, Boulder
Jennifer Morse & Meghan Mariani

Hubbard Brook Hubbard Brook Experimental ForestExperimental Forest
Calcium additions to acidic Calcium additions to acidic hardwood forest soilshardwood forest soils

Basics:Basics:
•Established in 1955 by USDA Forest Service as a site for Hydrologic Research•Located in the White Mountain National Forest in Central New Hampshire• 3,317 Ha (1 ha= 10,000m2) bowl shaped valley with hilly terrain•“Ideal” for research due to impermeable bedrock and glacial till with welldefined water sheds

ClimateClimate
Continental & Highly VariableContinental & Highly Variable
Uniform Monthly Precipitation (1400 Uniform Monthly Precipitation (1400 mm/year)mm/year)
Snowpack from mid-December through mid-Snowpack from mid-December through mid-AprilApril
Temperature range of -9 degrees C through Temperature range of -9 degrees C through 18 degrees c18 degrees c
Growing season May 15Growing season May 15thth- September 15- September 15thth
ET of 500 mm/ year (estimated)ET of 500 mm/ year (estimated)

SOILSSOILS
Well-Drained SpodosolsWell-Drained Spodosols
Formed from glacial till with sandy loam Formed from glacial till with sandy loam texturestextures
pH < 4.5pH < 4.5
Relatively infertileRelatively infertile
Depth of soil to bedrock up to 2 meters Depth of soil to bedrock up to 2 meters (variable)(variable)
Depth to average C horizon is .6 meterDepth to average C horizon is .6 meter

VegetationVegetation
Second Growth ForestSecond Growth Forest
80-90% Deciduous Northern Hardwoods 80-90% Deciduous Northern Hardwoods (Including Sugar(Including Sugar
Maple and RedMaple and Red
Spruce)Spruce)
10-20% Conifers10-20% Conifers

Acid DepositionAcid DepositionAccelerated leaching of base Accelerated leaching of base
cations may have depleted cations may have depleted available calcium in HBEF soils by available calcium in HBEF soils by 50%50%
base saturation (cation base saturation (cation concentration as a percent of total concentration as a percent of total cation exchange capacity) below cation exchange capacity) below 20% may not be able to neutralize 20% may not be able to neutralize deposition of strong acidsdeposition of strong acids
Acidic deposition has altered Acidic deposition has altered podzolization podzolization
Increase in Al from may inhibit Increase in Al from may inhibit Ca+ uptake to plant rootsCa+ uptake to plant roots

Acid deposition & vegetationAcid deposition & vegetation
Depletion of Ca+ from soils may cause Ca+ nutrient interference Depletion of Ca+ from soils may cause Ca+ nutrient interference and Ca+ dependant cellular processes to decline, affecting and Ca+ dependant cellular processes to decline, affecting health of forests. (processes are not completely understood)health of forests. (processes are not completely understood)
Ca+ depleted soils increase vulnerability of Ca+ depleted soils increase vulnerability of Sugar Maple trees to insect infestation causing Sugar Maple trees to insect infestation causing dieback. (photos are from Ridgeway PA not dieback. (photos are from Ridgeway PA not HBEF)HBEF)

““Ideal” for researchIdeal” for researchImpermeable bedrock and glacial till combined with well defined, uniform Impermeable bedrock and glacial till combined with well defined, uniform watershed ecosystems allow for a “water tight” study of ecosystem process and watershed ecosystems allow for a “water tight” study of ecosystem process and manipulation with “relatively” complete water and element budgets.manipulation with “relatively” complete water and element budgets. 9 gauged watersheds with different controlled variables for research (clear-9 gauged watersheds with different controlled variables for research (clear-cutting, nutrient additions etc..)cutting, nutrient additions etc..)

Water Shed 1 ManipulationWater Shed 1 Manipulation 1999 addition of 1.2 metric tons of Calcium 1999 addition of 1.2 metric tons of Calcium per hectare in the form of Wallastonite per hectare in the form of Wallastonite (CaSiO3)(CaSiO3)Attempt to increase soil base saturation to Attempt to increase soil base saturation to levels prior to acidic deposition beginning in levels prior to acidic deposition beginning in 1950’s. ( From 10% to 19%)1950’s. ( From 10% to 19%)Ca/Sr ratios from wallastonite different from Ca/Sr ratios from wallastonite different from natural sources of Ca so uptake into natural sources of Ca so uptake into vegetation can be followedvegetation can be followed

Changes in vegetative Ca Changes in vegetative Ca concentration after wallastonite concentration after wallastonite
additionsadditions

Conclusions:Conclusions:Lysimeters indicate increased Lysimeters indicate increased Ca+ in soil water at Oa horizon Ca+ in soil water at Oa horizon (1999-2004) but not below.(1999-2004) but not below.
Analyzed foliage also show Analyzed foliage also show increased Ca+increased Ca+
Increase in Ca+ in root tissueIncrease in Ca+ in root tissue
pH increase in upper soil horizons pH increase in upper soil horizons by 2000 (5.45 in watershed 1 by 2000 (5.45 in watershed 1 compared to 4.29 in reference compared to 4.29 in reference watershed 6)watershed 6)
By 2004 increase in pH in lower By 2004 increase in pH in lower horizonshorizons
Stream Al concentrations Stream Al concentrations decrease by more than halfdecrease by more than half
Acid neutralizing capacity Acid neutralizing capacity doubleddoubled
Nitrogen cycle processes did Nitrogen cycle processes did not increasenot increase
Microbial activity did not Microbial activity did not increaseincrease
Incomplete understanding of Incomplete understanding of Ca+ additions and further Ca+ additions and further study still neededstudy still needed

CitationsCitations Overview Introduction http://www.hubbardbrook.org/ 11/05/07
Watersheds http://www.hubbardbrook.org/ 11/05/07
Site Description http://www.hubbardbrook.org/ 11/05/07
Driscoll, C.T., G.B. Lawrence, A.J. Bulger, T.J. Butler, C.S.Cronan, C. Eagar, K.F. Lambert, G.E. Likens, J.L. Stoddard, K.C.Weathers. 2001. Acid Rain Revisited: advances in scientificunderstanding since the passage of the 1970 and 1990 Clean AirAct Amendments. Hubbard Brook Research Foundation.Science Links™ Publication. Vol. 1, no.1.Driscoll, C.T., G.B. Lawrence, A.J. Bulger, T.J. Butler, C.S.Cronan, C. Eagar, K.F. Lambert, G.E. Likens, J.L. Stoddard, K.C.Weathers. Acidic Deposition in the North Eastern United States; sources And inputs, ecosystem effects and management strategies. Bioscience51(3) 180-198
AMANDA ASH DASCH1,*, JOEL D. BLUM1, CHRISTOPHER EAGAR2,TIMOTHY J. FAHEY3, CHARLES T. DRISCOLL4 and THOMAS G. SICCAMA5 The relative uptake of Ca and Sr into tree foliage using a whole-watershed calcium addition
Peter M. Groffman1 , Melany C. Fisk2, Charles T. Driscoll3, Gene E. Likens1, Timothy J. Fahey4, Christopher Eagar5 and Linda H. Pardo6 Calcium Additions and Microbial Nitrogen Cycle Processes in a Northern Hardwood Forest . Ecosystems: Volume 9, No 8 December 2006.

Harvard ForestHarvard Forest
Effects of climate change within Effects of climate change within Harvard Forest soilsHarvard Forest soils
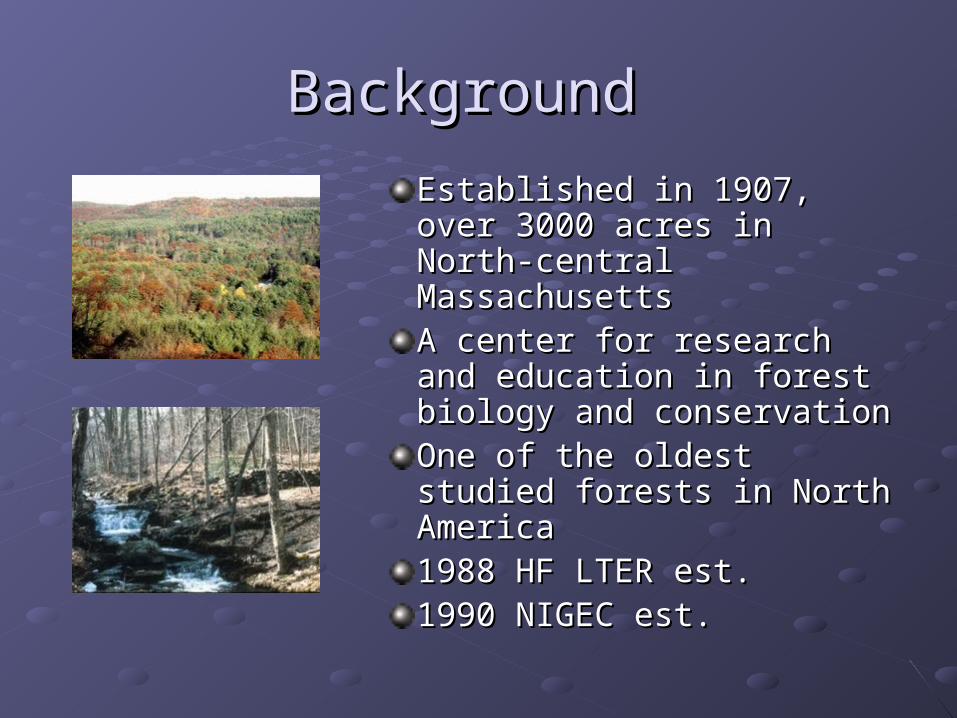
Background Background
Established in 1907, over Established in 1907, over 3000 acres in North-central 3000 acres in North-central MassachusettsMassachusettsA center for research and A center for research and education in forest biology education in forest biology and conservationand conservationOne of the oldest studied One of the oldest studied forests in North Americaforests in North America1988 HF LTER est. 1988 HF LTER est. 1990 NIGEC est.1990 NIGEC est.

Climate/PhysiographyClimate/Physiography
Temperate climate zone, cool Temperate climate zone, cool and moistand moistAnnual temperatures range from Annual temperatures range from -7 degrees C in January to 20 -7 degrees C in January to 20 degrees C in Julydegrees C in JulyAnnual mean precipitation is Annual mean precipitation is about 110cm throughout the about 110cm throughout the year.year.Elevations within the forest area Elevations within the forest area range from 220m to 410m above range from 220m to 410m above sea levelsea level
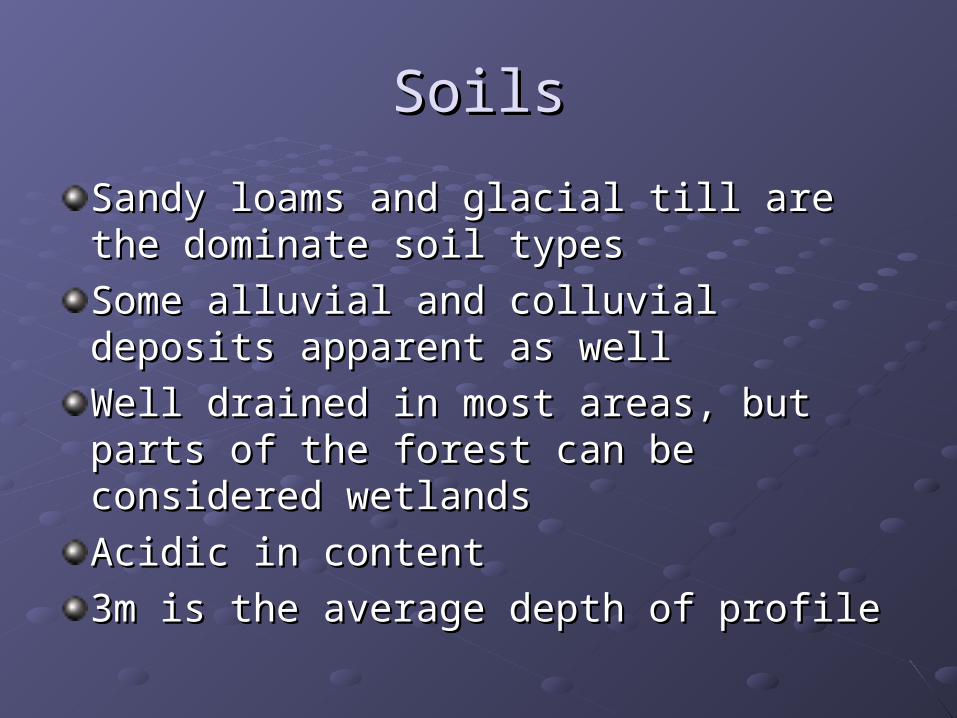
SoilsSoils
Sandy loams and glacial till are the Sandy loams and glacial till are the dominate soil typesdominate soil types
Some alluvial and colluvial deposits Some alluvial and colluvial deposits apparent as wellapparent as well
Well drained in most areas, but parts of Well drained in most areas, but parts of the forest can be considered wetlandsthe forest can be considered wetlands
Acidic in contentAcidic in content
3m is the average depth of profile3m is the average depth of profile
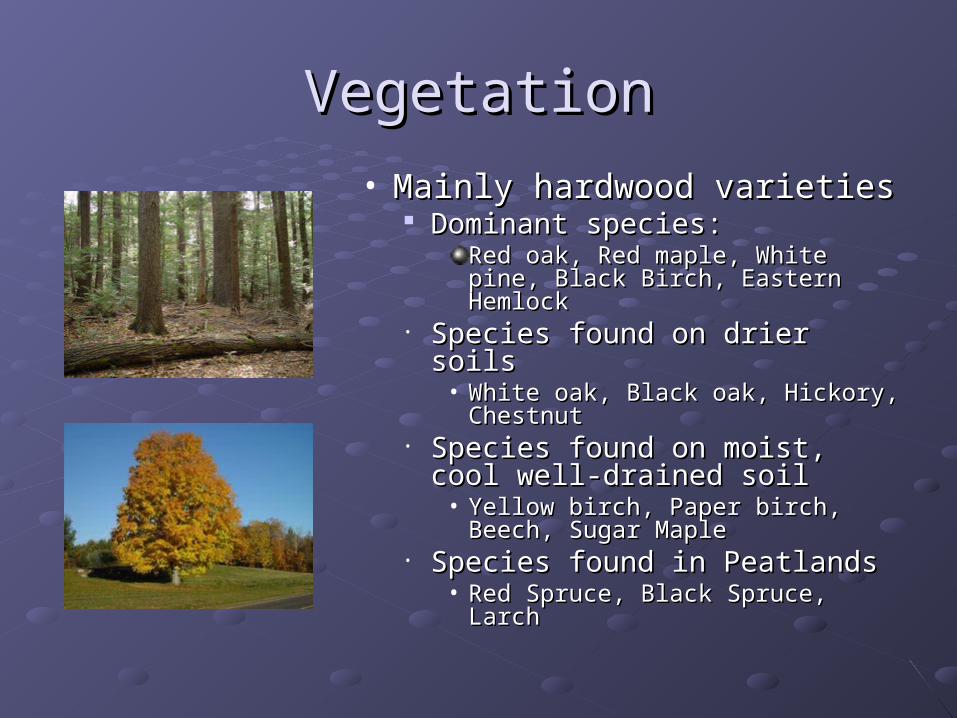
VegetationVegetation
• Mainly hardwood varietiesMainly hardwood varieties Dominant species:Dominant species:
Red oak, Red maple, White pine, Red oak, Red maple, White pine, Black Birch, Eastern HemlockBlack Birch, Eastern Hemlock
• Species found on drier soilsSpecies found on drier soils• White oak, Black oak, Hickory, White oak, Black oak, Hickory,
ChestnutChestnut• Species found on moist, cool Species found on moist, cool
well-drained soilwell-drained soil• Yellow birch, Paper birch, Beech, Yellow birch, Paper birch, Beech,
Sugar MapleSugar Maple• Species found in PeatlandsSpecies found in Peatlands
• Red Spruce, Black Spruce, LarchRed Spruce, Black Spruce, Larch

Experiment Location/PurposeExperiment Location/Purpose
Soil warming experimentSoil warming experimentProspect Hill in 1991-ongoingProspect Hill in 1991-ongoing
Located in an even aged mixed hardwood Located in an even aged mixed hardwood forest, roughly 365 m above sea levelforest, roughly 365 m above sea level
• How 5 deg C temp. increase effect soil How 5 deg C temp. increase effect soil processes fundamental to the global processes fundamental to the global cycling of C and Ncycling of C and N
• Testing forest response to global Testing forest response to global warming with an emphasis on soil warming with an emphasis on soil processes such as decomposition, processes such as decomposition, trace gas fluxes that could alter trace gas fluxes that could alter ecosystem function.ecosystem function.

Experiment ProcessExperiment Process
• Different 6x6m plots Different 6x6m plots consist of:consist of:
• heated plots with heated plots with heated cables buried heated cables buried 10cm deep 20cm apart10cm deep 20cm apart
• Disturbance control Disturbance control plots with cables but no plots with cables but no heatheat
• Control plots, no cablesControl plots, no cables

MeasurementsMeasurements
Traces gases like CO2, N20, Traces gases like CO2, N20, and CH4 were taken in the and CH4 were taken in the early morning (coldest part of early morning (coldest part of the day) and late evening the day) and late evening (warmest part of the day) (warmest part of the day)
As well as N mineralization, As well as N mineralization, soil moisture, and soil soil moisture, and soil chemistrychemistry

Results/ConclusionResults/ConclusionWithin the first 4-5 yrs. 5 degree C of warming resulted in Within the first 4-5 yrs. 5 degree C of warming resulted in a loss of about 11% of the stored C in the top 60cm of a loss of about 11% of the stored C in the top 60cm of soil, after that warming did not have much of an effectsoil, after that warming did not have much of an effect
• Accelerated soil N cycle which can assist in plant carbon Accelerated soil N cycle which can assist in plant carbon storage (also within earlier yrs.)storage (also within earlier yrs.)
• Soil disturbance from heating cables did not seem to Soil disturbance from heating cables did not seem to effect the soil temp and little to no effects on moistureeffect the soil temp and little to no effects on moisture
• warming seems to stimulate the decay of a soil carbon warming seems to stimulate the decay of a soil carbon pool, as well as increase the availability of inorganic pool, as well as increase the availability of inorganic nitrogen to plants. nitrogen to plants.
• Experimentation still taking place today, with the addition Experimentation still taking place today, with the addition of larger plots (30x30m)of larger plots (30x30m)
• Seems that time is still needed to see how things like Seems that time is still needed to see how things like growth in vegetation are truly affectedgrowth in vegetation are truly affected

Citations Citations
http://www.nsf.gov/awardsearch/showAward.do?http://www.nsf.gov/awardsearch/showAward.do?AwardNumber=0080592AwardNumber=0080592-Berntson, G. M. and F. A. Bazzaz. 1998. -Berntson, G. M. and F. A. Bazzaz. 1998. Regenerating temperate forest microcosms in Regenerating temperate forest microcosms in elevated CO2: species composition, elevated CO2: species composition, belowground growth and nitrogen cycling. belowground growth and nitrogen cycling. Oecologia 113: 115-125.Oecologia 113: 115-125.Compton, J. E., R. D. Boone, G. Motzkin, and D. Compton, J. E., R. D. Boone, G. Motzkin, and D. R. Foster. 1998. Soil carbon and nitrogen in a R. Foster. 1998. Soil carbon and nitrogen in a pine-oak sand plain in central Massachusetts: pine-oak sand plain in central Massachusetts: role of vegetation and land-use history. role of vegetation and land-use history. Oecologia 116: 536-542.Oecologia 116: 536-542.