Introduction - Erasmus University Rotterdam€¦ · Web viewWorld Cup, specifically the ... I...
90
Erasmus University Rotterdam Erasmus School of Economics Master Thesis Entrepreneurship and Strategy Economics The Economic Impact of Hosting the 2010 FIFA World Cup by South Africa: Is hosting the FIFA World Cup worth bribing for? Supervisor: dr. T.L.P.R. Peeters Student: Rinse Luidinga Student number: 358596 Date: 19 August 2015 Abstract Hosting the FIFA World Cup is considered to be a valuable investment by the countries that bid for the sport mega-event. The economic impact of hosting the event is considered to be positive. This thesis 1
Transcript of Introduction - Erasmus University Rotterdam€¦ · Web viewWorld Cup, specifically the ... I...
Erasmus University Rotterdam
Erasmus School of Economics
Master Thesis Entrepreneurship and Strategy Economics
The Economic Impact of Hosting the 2010 FIFA World Cup by South Africa:
Is hosting the FIFA World Cup worth bribing for?
Supervisor: dr. T.L.P.R. Peeters
Student: Rinse Luidinga
Student number: 358596
Date: 19 August 2015
Abstract
Hosting the FIFA World Cup is considered to be a valuable investment by the countries that bid for the
sport mega-event. The economic impact of hosting the event is considered to be positive. This thesis
examines two economic aspects that are affected by hosting the 2010 FIFA World Cup by South Africa.
The estimated models find increased tourism during as well as after the event. During the World Cup
203,949 additional tourists travelled to South Africa. The legacy effects of the World Cup estimate that
345,484 additional tourists travelled to South Africa post-event. However, the expenditures of these
additional tourists will not accumulate to the large investment for the event. The Random Effects model
of the effects of the 2010 FIFA World Cup on South Africa’s international trade show a significant
increase of South Africa’s exports both during as well as after the event. South Africa’s imports increased
significantly in the years following the event. 1
Table of contents
Introduction....................................................................................................................................................2
Literature review............................................................................................................................................9
Data..............................................................................................................................................................21
Methodology................................................................................................................................................29
Results..........................................................................................................................................................30
Discussion....................................................................................................................................................46
Executive Summary.....................................................................................................................................48
Limitations and future research...................................................................................................................49
References....................................................................................................................................................50
2

Introduction
Hosting sport events is often considered to be a valuable investment, but the long-term effects of hosting
such events are often neglected. This research is focused on the legacy effects of hosting the FIFA1 World
Cup, specifically the World Cup hosted by South Africa. Governments are eager to be appointed as host
in the so-called sport mega-events. Besides the Olympics, the World Cup for football is categorized as
such. The number of candidates for hosting the FIFA World Cups shows the interest of countries in being
the organizer of the sport mega-event. The country will be the center of sporting fans attention for two
months. The economic benefits associated with hosting the World Cup manifest primarily in increased
tourism. A second effect of being the host could be increased international trade. But to what extent is
hosting the World Cup economic viable? Is hosting the World Cup a “sure-win” or is it an expensive
mistake? Is the event even worth bribing for?
Background
The first FIFA World Cup was held in 1930 and only received bids for hosting the events from the places
where the sport was most popular: Europe and Latin America. It took forty years before countries from
other places started competing for the hosting-gig. Japan was the one that tried to get the event in 1970,
but had to leave the event to Mexico. Sixteen years later, the United States and Canada started bidding,
but again it was Mexico that was appointed as the host. 1994 was the first time that a country (the United
States) hosted the event other than countries from Europe or Latin America. Asia hosted event in 2002,
when South Korea and Japan were appointed as host countries. After South Africa (the first African bid)
came in second after the voting round in 2006, FIFA decided that the 2010 FIFA World Cup should be
held in an African country (FIFA, 2004).
Africa is considered the poorest continent of the world, meaning that hosting a sport mega-event is far
from achievable for many of its countries. The five countries that bid on hosting the event are therefore
several of the richer countries in Africa: Egypt, Libya, Morocco, Tunisia and South Africa. Libya and
Tunisia had to withdraw their bids after the FIFA made clear that co-hosting was not allowed. The FIFA
Executive committee (24 members) voted for a hosting country on May 15 th 2004. South Africa was
granted the event with 14 votes over 10 votes for Morocco and zero votes for Egypt. Local hero, Nelson
Mandela flew all the way to Zurich to witness the appointment ceremony and showed a widespread smile
while FIFA president Joseph S. Blatter announced South Africa as 2010’s World Cup host. “We accept
1 The international governing institution of football (soccer): The Fédération Internationale de Football Association3
with humility and without arrogance,” Mandela had said (FIFA, 2004). This statement alone reveals the
government’s attitude for hosting the event.
The first consideration that one would make when considering potential hosts for the FIFA World Cup is
their ability of financing the event. South Africa had shown a steady growth of GDP the two years
preceding the appointment of the World Cup in 2004 (see graph 1). The other competing candidates had
lower GDP (estimated in US Dollars) compared to South Africa.
Graph 1: GDP (Current US$) of the three candidates of the 2010 FIFA World Cup
Their ability to finance the event would possibly make South Africa the most viable host for the event,
but the FIFA Executive committee also assesses other aspects. This is where the reasons why South
Africa is chosen as a host country gets a bit alarming. When looking at the report that FIFA put out on the
considerations of their candidates, Morocco turns out to be at least as viable a candidate as South Africa
(see table 1 on the next page) (FIFA, 2004). South Africa excels in its effort to build the stadiums and the
factors of general country infrastructure, according to the FIFA inspection group. Notable is the fact that
South Africa ranks lowest for important factors like Safety and Security, Ticket Policy and Budget.
Morocco is the only candidate that has a sufficient budget for the event. However, it has the lowest
number of potential stadiums. The only two aspects were Egypt fell short on compared to the other
candidates are the number of stadiums and budget for hosting the World Cup. Remarkably, it is the only
country that has a descent ticket policy, meaning that it does not need revision.
This report on the considerations for choosing the host country for the 2010 FIFA World Cup therefore
cannot give conclusive arguments for why South Africa is chosen over Morocco. The question arises
what gave South Africa the slight edge in the end. The public opinion tends to speculate about corruptive
behavior around FIFA’s higher executives. The following section will address this issue.
Table 1: Formatted results of FIFA Inspection Group for the 2010 FIFA World Cup
4

South Africa Morocco Egypt
Country Commitment
Government Commitment + + + +
Public Enthusiasm + +/- +
Football
Stadiums 13 9 10
- Ready
- Under renovation
- To be renovated
- Under Construction
- To be Build
3
-
5
-
5
-
-
3
2
4
-
1
2
3
4
Stadiums not build if not appointed the World Cup 1 (at least) 3 2
Training facilities + + - +
Standard of national football + + ++
General Country Infrastructure
Transportation + +/- +/-
Telecommunications + +/- +/-
Hotels + + +
Safety and security - + +
Medical centers + - +/-
Finance
Budget for the 2010 FIFA World Cup - + -
Ticketing - - +
Corruption and Bidding for FIFA World Cup
5

Regretfully, the bidding schemes of FIFA concerning the hosts of World Cups have been subject to
corruption accusations. First the bidding round on the appointment of Qatar as host was accused of being
corrupted by FIFA Executives receiving bribes. In 2015, South Africa was also accused of bribing FIFA
to be 2010’s host. The research conducted in this thesis is focused on the economic impact of hosting the
World Cup and not how the event got appointed. However, the subjects are intertwined on such a high
level, that this section will address some of the accusations.
The US general-attorney, dedicated to the case of FIFA’s corruptions, claims that bribes were paid in
order to influence the appointment of the 2010’s World Cup, according to the Financial Times (Scannell,
Aglionby, Moore, & Garrahan, 2015). Former football executive Austin “Jack” Warner is the
whistleblower on the scandal surrounding FIFA. “Not even death will stop the avalanche that is coming,”
he has said (Schipani, Aglionby, & Moore, 2015). The estimated value of the bribe by the media is $
10,000,000. South Africa is believed to have donated the money generously to support football in the
Caribbean (Harding, 2015). The bribe is relatively small compared the billion dollar costs of the event,
but for the sake of argument, the alleged payments will be taken into account when calculating the costs
of the World Cup.
The only nice aspect of the accusation of FIFA’s corruption in appointing the FIFA World Cup host is
that it underlines the fact that countries want to host a World Cup. The candidate countries are clearly
convinced that hosting a WC will be beneficiary for their country. They believe that being the host of the
World Cup will support their economic development. The following section will further explain the
reasoning of host-countries on bidding for the mega-event.
Organizers’ reasons for hosting sport events
A large amount of countries bid for hosting a World Cup, but what are their reasons behind the decision
to bid for the event. Bidding countries speak out their expectations on economic and social benefits
regarding to being the host of a mega-sport event in the media. Meanwhile, the bidding process is often
viewed as a competition amongst countries. Prestige is therefore one of the main motives. However,
another trend is visible over the last decade. Developing countries are competing along with the
developed countries. Apparently, hosting a sport event is experienced as a successful development
strategy. This strategy can also be attributed as a motivation for South Africa, which is part of the BRICS
(Brazil, Russia, India, China, South Africa) countries. These countries, which are characterized by their
emerging economies, are especially present on the bidding processes of sport mega-events. After the 2010
FIFA World Cup in South Africa, Brazil has taken on the 2014 FIFA World Cup, as well as the 2016
6

Olympic Games. Russia hosted the Winter Olympics in 2014 and is appointed as the host for the FIFA
World Cup 2018. India has yet to host a mega-event, but the country hosted the Commonwealth Games in
2010, which is considered as a major-event. China was granted the Olympics in 2008 and has won the
bidding round for the 2022 Winter Olympics. The trend of emerging economies putting themselves in the
spotlight of sport enthusiasts is clearly observable.
Another motive is not economic or social, but rather sport-related. The sports results of national teams
can be poor. For instance, South Africa was ranked 38 th in the FIFA World Ranking by the end of 2004
(FIFA, 2015). They did not qualify for the 2006 World Cup in Germany. This is unacceptable for a nation
where football is one of the most popular sports. The situation for South Africa was even worse, because
they also did not qualify for the event in 1998 and 2002. Hosting the World Cup ensures the national
teams of competing and thus might be their only way into the event.
FIFA’s promised benefits of hosting the FIFA World Cup
FIFA’s perspective on the benefits of hosting the World Cup is mainly economic. They advertizes their
FIFA World Cup as the most popular sporting event in the world. They advocate that all member
associations have the potential for hosting any of FIFA’s World Cups2. FIFA promotes its events as a
catalyst for new and improved facilities to support the development of national football. They ensure
higher quality of development programs for the country’s elite game, talent identification and grassroots.
Furthermore, FIFA is assuring the bid countries more cooperation with stakeholders and media, as well as
an increase in civic pride (FIFA, 2015). Basically, FIFA is promoting economic benefits and social
benefits. The last two benefits are even more far-fetched. FIFA will help break down the social barriers to
participation and high performance of women and young people. Secondly, they will use successful
players as role models to encourage other (emerging) football players and health (FIFA, 2015). FIFA is
thus convinced that hosting one of their events only yields benefits for the organizer. They call winning
the bid the ultimate goal. Interestingly, regarding this thesis is the following statement by FIFA, which
catches FIFA ensuring economic benefits both during the event as in the long run. “The sustainable
benefits generated for the host member association and country - well before, during and long after the
event.”
Research Structure
2 Beside the FIFA World Cup, FIFA organizes other World Cups, including FIFA Women’s World Cup, FIFA U-20 World Cup, FIFA U-20 Women’s World Cup, FIFA U-17 World Cup, FIFA U-17 Women’s World Cup, FIFA Beach Soccer World Cup and FIFA Futsal World Cup.
7

There are papers estimating predictions for the South Africa World Cup, but there is not an extensive
research base on post-event literature. The objective of this thesis is to give a conclusive outcome on what
the economic impact for South Africa is by hosting the world’s biggest football event, the FIFA World
Cup. What is the economic impact of hosting the 2010 FIFA World Cup for South Africa? More
specifically, the research analyses whether South Africa has made a mistake or not in hosting the 2010
FIFA World Cup when looking at increased tourism and increases in international trade, that can be
specifically contributed to the World Cup. The panel data enables a research based on individual
regression for every country. Therefore, I have chosen to use a method described by Pesaran and Smith,
which looks at the significance of the coefficients of all the different regressions (Pesaran & Smith,
1995). This method is used for the tourism models. Additionally, the research will cover the effect of
hosting the World Cup on South Africa’s exports and imports. The export and import data is bilateral.
These models are estimated using Random Effects models and Fixed Effects models. The most efficient
model between these two estimation methods is chosen by conducting a Hausman Test. The Pesaran-
Smith method could not be used for this analysis, because the bilateral exports and bilateral imports are
measured annually. The dataset therefore does not have enough time periods for the Pesaran-Smith
method to give accurate results. In both cases, the World Cup is analyzed by incorporating specific
dummies to indicate the time period during the 2010 FIFA World Cup. Another dummy called legacy is
constructed to capture the period after the World Cup, which gives an insight in the lasting effects of the
World Cup.
The findings in this thesis suggest that South Africa enjoys additional tourism due to organizing the FIFA
World Cup. This effect is observed both during the event as well after the event. Differences in arrivals
between foreigners of participating countries and from non-participating countries are only observed
during the World Cup. The international trade models show increased exports by South Africa both
during as post-event. The country’s imports only increased significantly after the World Cup.
The following section will give a detailed summary of the literature on sport mega-events and their
economic impact. It will also describe what a mega-event actually is. Additionally, the predictions of the
2010 FIFA World Cup on additional tourism and costs are presented. After the literature review, the data
used in the analysis will be described. Following is the methodology section that will show which
assumptions are made while constructing the tourism models and international trade models. The results
are found in the following section, separated in a section for the tourism models and another section for
the international trade models. The results will be assessed in the discussion section, followed by the
executive summary. Finally, the limitations and proposals for future research are reported.
8

Literature review
The following section is devoted to the effect of sporting events on economic factors. Firstly, the
difference between a normal sport event and a sport mega-event will be defined. Secondly, the predictions
by the Grant Thornton Consultancy are presented. Furthermore, this section will give an insight in the
existing literature on sport mega-event and in particular the literature on FIFA World Cups. The
hypotheses are also described in this section.
What is the difference between a Sport Event and a Sport Mega-Event?
The FIFA World Cup is commonly considered as a sport mega-event. What distinguishes normal sport
events from sport mega-event is essentially the size of the event (Müller, 2015). According to Müller,
there are four dimensions which should be taken into account when analyzing the size of an event. He
created a scoring matrix that looks at these dimensions and grants points to three different ranges in which
these dimensions can be classified (see table 1 and table 2 in the Appendix). When the points are summed
up, the result shows whether the event is classified as a major event, mega-event or giga-event. Firstly, he
looks at the visitor attractiveness, by which he means the visitors to the actual event. South Africa’s
World Cup sold 3.1 million tickets, which falls into the highest category of Müller’s scoring matrix (3
points). The second dimension is that of mediated reach. This dimension captures the spectators that did
not go through the trouble of heading over to the event, but rather stayed home and enjoyed the event
through various media. The scoring matrix shows that any value of broadcast rights exceeding $ 2 billion
will be classified as the highest rank in this particular dimension. The value of the broadcasting rights for
the 2010s World Cup are estimated to be $ 2.4 billion (3 points). The third dimension focuses on the costs
accompanied by hosting an event. Total costs exceeding $ 10 billion are considered as extreme, while
total costs that exceed $ 5 billion are second-rated. The FIFA World Cup finds itself in the second
category with an estimated total cost of $ 5.5 billion (2 points). Lastly, Müller looked at the costs of urban
transformation. Governing bodies like IOC3 and FIFA require their hosting countries to invest in
reconstruction of infrastructures and the urban environment. He looks at the amount invested in capital to
grant a score to this dimension. The $ 5.0 billion invested in capital for the South Africa World Cup listed
them in the second category (2 points). The result of adding up the points leads to the conclusion that
South Africa´s 2010 FIFA World Cup is considered as a mega-event (10 points). Interestingly, the
Olympic Summer Games in London, back in 2012, is considered as a giga-event (11 points), according to
the Muller’s scoring matrix, where it is widely acknowlegded as a mega-event. An example of a major-
event will be the Commonwealth Games of Delhi (2010) and the Super Bowl (2011), which score 6 3 International Olympic Committee
9

points and 1 point respectively (Müller, 2015). The line between classifying an event as a mega-event is
inconsistent and vague throughout the literature, that is why I decided to use this classification system.
Predictions of Tourism during the 2010 FIFA World Cup
Countries could base their decision on bidding for any mega-event on their personal motives and beliefs.
However, they usually take on consultancies to estimate the benefits they could gain from being the host.
The predictions for the 2010 FIFA World Cup were made by the Grant Thornton Consultancy. The
literature on mega-event is skeptic about the predictions made by these consultancies, because
consultancy bureaus are found to display the numbers about tourism as more promising than they later
turn out to be (Bond & Cottle, 2011). Table 2 shows Granth Thornton´s predictions in 2007 and 2010
(Saunders, 2010). Their estimated actual values are from 2011 (Grant Thornton, 2011).
Table 2: Predictions economic impact of foreign tourism by Grant Thornton
2007 2010 (April) 2011
Visitors 483,000 373,000 309,554
Average expenditure
by visitor in South
Africa
R 22,000
($ 3,123)
R 30,200
($ 4,125)
R 11,800
($ 1,625)
Total Expenditures of
foreign visitors (Rand)R 10,626,000,000 R 11,264,600,000 R 3,652,737,200
Total Expenditures of
foreign visitors ($)4$ 1,508,225,622 $ 1,538,622,928 $ 503,053,400
The figures in the table show that the predictions are higher before the event compared to after the event.
The Grant Thornton Consultancy even found that the expenditures by foreign tourists were only one third
of what was predicted the year before (R 11.2 bn. in 2010 and R 3.6 bn. in 2011). The total expenditures
even went down more than one third of originally predicted. Grant Thornton estimated the total foreign
visitors at 373.000 in April 2010, but estimated the actual values on 309,554 visitors (Grant Thornton,
2011). These estimations will be compared to the estimations made in the results section of this thesis.
4 Exchange rate of 2007 (R 1 = $0.141937288), 2010 (R 1 = $0.13658922) and 2011 (R 1 = $0.137719571) are used respectively. These are the exchange rates retrieved from the World Bank.
10

Costs of hosting the 2010 FIFA World Cup
The Grant Thornton Consultancy estimated the total costs of the 2010 FIFA World Cup at R 40 bn.
($5.51 bn.5). They call it well-spent money, which they motivate by acknowledging necessary
improvements to infrastructure, contribution to national GDP, generating of national pride, increased
tourism and improving perceptions of South Africa all over the world. They estimate the total economic
impact on R 18 bn. ($2.49 bn.) (Grant Thornton, 2011). This investment must thus be earned through
increased tourism and increased international trade.
Economic impact of hosting sport events
The following section will be about the literature that studied FIFA World Cups. The main question
throughout the literature always comes down to whether hosting a sport event as large as the FIFA World
Cup yields economic benefits for the host country.
Besides the FIFA World Cup, there are many sport events which can be bid on. World cups held for any
kind of sport usually fall under the category of major sport-event, as described by Muller’s score matrix
(Müller, 2015). The effects of these events on the hosting regions are not easy to research, according to
Jones who conducted a study on the impacts of the 1999 Rugby World Cup (RWC99). The event was
held in Cardiff, Wales. RWC99 was predicted to gross $ 1.3 billion world-wide and would stimulate 1.7
million additional tourists to Wales. On top of that, 3 billion people would be enjoying the event via
television. However, his study finds that it is very uncertain whether any profit is accrued by the events
(Jones, 2001).
Another study looked at three relatively small sport events on Hawaii. They find similar numbers of net
arrivals for the Honolulu marathon, the Ironman Triathlon and the Pro Bowl, respectively 2,183 to 6,519
net arrivals, 1,880 to 3,583 net arrivals and 5,596 to 6,726. The effects of each of these on the number of
arrivals do not differ much, especially not between the Honolulu marathon and the Pro Bowl. Interesting
is the fact that Hawaii’s government spends nearly two thirds of its sport tourism budget on the Pro Bowl,
while spending significantly less on the Honolulu Marathon (Baumann, Matheson, & Muroi, 2009). The
more expensive sport event does not need to be the most effective one. Hosting the World Cup is a very
expensive investment, on which the government takes the risk of not earning their money back. This
study finds that cheaper solution may have similar impacts on tourism. One could argue that the return for
the cheaper events is relatively higher.
5 The exchange rate of Rand to US Dollar of 2011 is used (R 1 = $0.137719571).11

The two studies discussed above are on much smaller scale than that of the FIFA World Cup. They might
be on sport events, but could be not representative for a sport mega-event. Only one type of sport event
could be compared to the likes of the FIFA World Cups and that are the Olympic Games.
A study on the 1988 Summer Olympic Games in Korea found significant increases in tourism during the
event as well as after the event. Remarkably, the greatest increase in tourism is observed the year
following the prestigious event. However, the researchers find that the increase in tourism is not
permanent and thus diminishes over time. The economic benefit flowing from the additional tourists for
Korea is estimated to be $1.3 billion (Kang & Perdue, 1994).
Researchers Rose and Spiegel studied the effects associated with the Olympic Games in the time period
between 1950 and 2006. They find that the economic benefits are rarely large or even negative.
Furthermore, they argue that non-economic benefits which are often addressed are difficult to verify. Still,
countries are fiercely competing to be the host of the next Olympic Games. The researchers found an
explanation for this and called it the Olympic Effect. They advocate that the economic benefits are not
found in increased tourism, but rather in increased trade. A country’s openness will increase after hosting
the games. This increase in openness is argued to be permanent. Their findings indicate that trade is 20%
higher for host countries (Rose & Spiegel, 2011).
A study on the Olympic Games of Barcelona in 1992 finds that the economic benefits are the urban
transformation and changes in economic structure. The researcher finds that capitalization has grown, the
quality of the service sector has increased and Barcelona has been more internationalized after the event
(Brunet, 1995). Researchers Essex and Chalkley come to similar conclusions. They reckon that the mere
size of the Olympic Games is bound to leave a physical imprint on their host cities. These urban changes
endure well beyond the event (Essex & Chalkley, 2010).
These modifications of the urban environment can be seen as another argument that even without
economic benefit flowing from increased tourism and increased trade, hosting a mega-event is not all
money down the drain. However, researcher Pillay and Bass found contradictory results for the 2010
FIFA World Cup. They argue that urban development will not take off as expected as result of the World
Cup. They even argue that inequality will be intensified by hosting the World Cup. Hosting the World
Cup would not have any effects on infrastructural, service and facilities provision (Pillay & Bass, 2008).
These finding will render the argument of benefits in the form of urban transformation as obsolete. 12

Tourism
When researchers talk about economic impact of sport mega-events, they usually are talking about the
amount of tourism generated by the event. As stated before, it is one of the primary motives for countries
to start bidding on sport events. These tourists spend additional money that would not have been spent in
absent of the event, meaning that increasing the number of tourists almost by definition is an economic
benefit. The following section will discuss the literature that studies the effect of a sport event on national
tourism.
Firstly, researchers should be cautious when measuring tourism, because researchers should take into
account the different types of tourists. The actual demand of tourism are the people that would travel to
their destination regardless of any circumstances. In our case, these are the travelers that would have gone
and are still going to South Africa regardless if the World Cup is being held. The type of tourists that this
study is more interested in is those who can be categorized under potential demand. These visitors will
only travel to the destination when they are motivated to go, e.g. the FIFA World Cup is being held there.
These visitors specifically are the result of hosting the World Cup and thus the research is aiming to
measure the magnitude of this particular group. The following two types are more problematic for
researchers when measuring tourism. One of which is the type of tourists who flow from deterred
demand. These tourists wished to have gone during the World Cup, but are deterred by the event. These
tourists might decide to go to South Africa after the event, but should not be contributed to the long-term
effects of the World Cup. This crowding out effect is also referred to as tourism displacement. Lastly, an
important type of tourists are the ones that would have gone anyway, but now reschedule their trip to
coincide the event. These tourists can be considered as additional tourists during the event, but you will
be missing them in other periods. When these tourists are attributed to the effects, a deceptive image will
be described. The researcher Burgan and Mules are warning other researchers for precisely this problem
of different types of tourists. Another concern that they point out concerns measuring the amount of
expenditures that would not have occurred in the absence of a sporting event. An event like the World
Cup requires a lot of investments of the government body in, for instance, public infrastructure and
provision of services. These are not the expenditures that researches should want to measure as result of
hosting the mega-sport event. The two researchers even go as far as to encourage other researches to
assume the expenditures within the region of where the event is held to be zero. This conservative
approach will leave only the expenditures outside the region, which according to them can be realistically
13

treated as new expenditures, attributable to the event (Burgan & Mules, 1992). These problems of
measurements for both tourism and expenditures are taken into account in this research.
The rich literature on sport events shows a positive effect on tourism during the event. Research on the
2002 FIFA World Cup in South Korea shows that 57.7% of the tourists have especially travelled to South
Korea because of the World Cup. Besides, the tourists are spending 1.8 times as much as normal leisure
tourists (Lee & Taylor, 2005). Specifically for the South Africa 2010 FIFA World Cup, an increase of
tourism is found during the event. However, researchers note that studies ex-ante the event were too
optimistic (Spronk & Fourie, 2010) (Fourie & Santana-Gallego, The invisible hand of Thierry Henry:
How World Cup qualification influences host country tourists arrivals, 2015). Other researchers even
show that predictions made before the event imply that non-SADC visitors had cost the South African
government $13,000 extra (Peeters, Matheson, & Szymanski, 2014). The short term impacts of sporting
events might be overestimated by consultancies. Du Plessis and Maennig warn countries for precisely this
(Du Plessis & Maening, 2011).
Yet, several factors can influence the magnitude of the increasing tourism. The amount of newly obtained
tourists depends on the type of mega-event and whether the event is held in the off-season or peak-season.
Events held in the off-season show a higher increase of tourism than prior predicted, while events in the
peak-season show a decline in predicted tourism, according to the research by Fourie and Santana-
Gallego (Fourie & Santana-Gallego, The impact of mega-sport events on tourist arrivals, 2011). Tourism
displacement could very well be the reason behind these results. The tourists that were planning to go the
destination where the event is held decide not to, because of the event. Tourism is subject to seasonality
effects, meaning that the crowding out effect is less severe in the off-season. The 2010 FIFA World Cup
was held from the 11th of June until the 11th of July, which is the peak-season of South Africa’s tourism.
The increased tourism during the event could therefore be less than it would have been if the event had
been held in the off-season.
The research conducted by Peeters, Matheson and Szymanski is devoted to the effect of hosting the
World Cup by South Africa on the increase of tourism during the event. Their results show an additional
294,804 arrivals of non-SADC tourists to South Africa in 2010. This is an increase of 12% in the number
of tourists. They specifically focus on tourists of non-SADC, because visitors from SADC countries tend
to be migrant workers and therefore not the spending-type tourists. They find little seasonal patterns in the
arrivals of SADC tourists, which indicate that this is a correct assumption. The additional tourists
estimated by them are much lower than expected and reported for the event. When they spread out their
costs over these additional visitors, it will mean that every visitor, whose visit can contributed to the 14

World Cup, should spend $ 13.229 in order to equalize South Africa’s incomes with their expenses
(Peeters, Matheson, & Szymanski, 2014). They used total costs of $ 3.9 billion for the entire event, which
is calculated by Saunders in 2011. The average amount estimated for a tourist to spend while on vacation
is unknown, meaning that it remains questionable whether they spend an average of $ 13.229.
Du Plessis and Maennig find similar down tuning results. Their results are sobering compared to the
predictions prior to the South Africa World Cup. The additional tourists are estimated to range between
90,000 and 108,000 (Du Plessis & Maennig, 2011). These estimations are even less than the estimations
by Peeters et al.
The following hypothesis is constructed to confirm these previous findings on increased tourism during
the FIFA World Cup.
1a: Hosting the 2010 FIFA World Cup had a positive effect on tourism in South Africa during the event.
The literature on mega-events shows a steeper increase of tourists from participating countries than from
non-participating countries (Fourie & Santana-Gallego, The impact of mega-sport events on tourist
arrivals, 2011). Which countries qualify for the tournament drastically influences the arrivals of the host
country (Fourie & Santana-Gallego, The invisible hand of Thierry Henry: How World Cup qualification
influences host country tourists arrivals, 2015). Even though not surprising, this does bring some
considerations for the countries that are considering hosting a mega-event. When a country wants to
promote itself to countries that they do not receive much tourism from, they might need to bid to different
types of events. The effect on tourism specifically from participating countries will be tested in this study.
1b: Foreigners from participating countries of the 2010 FIFA World Cup visit South Africa more
compared to foreigners of non-participants during the event.
However, the effects of hosting the World Cup on tourism during the event has been widely studied and
confirmed, literature regarding the long-term effects of FIFA World Cup is scarce in comparison. The
literature is calling the long-term effects the legacy of the World Cup (Preuss, 2007). The same definition
is used throughout this thesis. Preuss emphasizes in his research that, what he calls, the six event
structures are decisive in whether long-term effects on tourism will arise after the event is over. The six
event structures he defines are infrastructure, knowledge, image, emotions, networks, culture. He studied
the 2006 FIFA World Cup in Germany to get to his findings. He finds that infrastructure needs to be
permanent after the event for the long-term effects to develop. He also argues that due to the World Cup,
100.000 Germans gained knowledge skilled which would be valuable in servicing tourists. The event
15

structure he constructed around image is about the positive view of the world on Germany after the event.
The more positive the image, the more likely that additional tourists arrive in the following years. His
fourth event structure regards emotions. He argues that the football World Cup is an emotional event,
whereby the pride of hosting the prestigious event plays an important role. The emotional aftermath on
the Germans would leave them with an even more positive national identification. The fifth event
structure regards the newly obtained networks when organizing an event like the World Cup. These
networks with the FIFA, media, politicians and tourism industry can yield positive influence on future
tourism. Lastly, he addresses a structure around culture. Hosting the 2006 FIFA World Cup would have
transmitted the cultural values and products of Germany to the world. A positive and relatable cultural
image will attract additional tourists (Preuss, 2007).
The research of Peeters, Matheson and Szymanski only control partly for the long-term effects of the
World Cup on the arrivals. They control for the long-term effects by including a dummy for after the
event, but do not interpret the results associated with the dummy. Their data covered a time period from
2001 to 2010, which means that the entire long-term effects of the World Cup could not have been
observed.
The previously discussed research on the Korean Olympics of 1988 did find some persisting increase of
tourism after the event (Kang & Perdue, 1994). Fourie and Santana-Gallego studied the legacy effects of
FIFA World Cups, but found no significant results for tourism post-event in their 2011 paper. They
reason that the effect might not be measured accurately, because of the strong increase in tourism in the
pre-event years. The event-specific tourism growth is therefore already from a high base (Fourie &
Santana-Gallego, The impact of mega-sport events on tourist arrivals, 2011).
The same researchers published a paper in 2015 that examines the long-term effects of the World Cup on
tourism inflows. They acknowledge that the legacy effects of the World Cup are often neglected in the
literature. They find positive effects of the World Cup on tourism both during as after the event. They
argue that the tourism growth is higher for non-traditional countries compared to traditional countries,
meaning that tourists from countries that already went to South Africa pre-event show less growth in
tourists numbers (Fourie & Santana-Gallego, The invisible hand of Thierry Henry: How World Cup
qualification influences host country tourists arrivals, 2015). Their research does not exactly estimate the
number of additional tourists travelling to South Africa after the event. The following hypothesis will be
tested regarding these legacy effects of the 2010 FIFA World Cup and an estimation of the additional
16

tourists will follow. Hypothesis 1d will be tested to see whether a similar difference can be observed
between participants and non-participants as is expected for the tourism during the World Cup.
1c: Hosting the 2010 FIFA World Cup has had a positive effect on tourism in South Africa in the long
run.
1d: Foreigners from participating countries of the 2010 FIFA World Cup visit South Africa more
compared to foreigners of non-participants after the event has passed.
In all cases, described above, there is a clear indication that hosting a mega-event in the form of a World
Cup will lead to increased tourism both during as after the event. However, it is questionable if the
benefits exceed the costs. According to Solberg and Preuss, many host regions invest substantial amounts
while organizing mega-events like the FIFA World Cup, e.g. sport facilities and public infrastructure. But
the question remains whether the benefits exceed the costs of the event (Solberg & Preuss, 2007). The
two researchers studying the 2002 FIFA World Cup held in South Korea find the same overestimation of
the effects before the event compared to after the event (Lee & Taylor, 2005). Several other researchers
find this distinctive overestimation of the predictions before the event (Peeters, Matheson, & Szymanski,
2014) (Fourie & Santana-Gallego, The impact of mega-sport events on tourist arrivals, 2011). In the end,
we want to know whether it is a smart move to host a mega-event like the 2010 FIFA World Cup.
Therefore, when looking exclusively at the expenditures of tourists, will hosting be profitable? The
following hypothesis is constructed to test this:
1e: The costs of hosting the 2010 FIFA World Cup by South Africa does not exceed the expenditures by
tourists that can solely be attributed to the event.
The hypotheses will be tested by means of a regression analysis following a method described by Pesaran
and Smith (Pesaran & Smith, 1995).
International Trade
The FIFA 2010 World Cup in South Africa is considered to have enjoyed unprecedented media coverage.
The attention drawn to South Africa might trigger potential investors. Businesses seeking for locations for
their FDI could be more likely to choose South Africa as a candidate.
There has not been a study conducting on the effect of the South Africa World Cup on its exports and
imports. Let alone, the long-term effects on exports and imports. However, there have been studies on the
17

general economic impact of hosting the World Cup by South Africa. Two researchers from the University
of Pretoria, South Africa, found optimistic results back in 2005. According to their estimations, hosting
the World Cup will most definitely yield beneficial effects on macroeconomic variables, e.g. GDP and
employment (Bohlmann & Van Heerden, 2005).
One might argue that hosting a normal sporting-event compared to a mega-sport event is a cheaper way to
get similar results (Baumann, Matheson, & Muroi, 2009). However, an aspect of the World Cup that the
smaller scaled sport event does not have, is the size of world-wide attention. The media spends substantial
valuable time on the FIFA World Cup. The mega-events will therefore come under the attention of not
only sport enthusiasts, but also non-sport fans. The hosting country would like to target the sport fans to
increase potential tourism during and after the event. The others would be targeted as potential tourists
after the event. Another reason why a host-country would like to step into the spotlight is to encourage
potential investors to invest in their country. Putting your country on the business world map could very
well be an important motive.
The effect of sport events on trade is studied by looking at Olympic Games (Rose & Spiegel, 2011).
However, it remains the question whether this so-called Olympic Effect also applies on FIFA World
Cups.
Bohlman is sure that a similar effect will be measured for the FIFA 2010 World Cup. He states that if
South Africa shows political and economic stability, the country could become the first choice for future
investors. He points to the 1992 Olympic Games in Barcelona and the increase in international trade
there. However, he acknowledges that the geographical location of Barcelona might be favorable to that
of South Africa (Bohlmann, 2006). Other researchers point out that the stage provided by hosting the
FIFA World Cup can be used to advertise local products to global audiences. Hence, they expect the
export of the hosting country to increase during and post-event (Lee & Taylor, 2005).
These studies only reason on why organizing the FIFA World Cup would lead to increased global trade
for the host country. A detailed empirical study on the subject has not been done yet. The following two
hypotheses are constructed to test the effect of the 2010 World Cup on South Africa’s trade.
2a: Hosting the 2010 FIFA World Cup has had a positive effect on the exports of South Africa.
2b: Hosting the 2010 FIFA World Cup has had a positive effect on the imports of South Africa.
These hypotheses will be tested using the same method as for the tourism effects. The models are
estimated using Random Effects and Fixed Effects models.18

Happiness
The economic effects of the WC are well studied and seem to show mixed positive effects for the hosting
party. But finding an economic loss at the end of the balance, doesn´t have to mean that hosting the event
was a waste of money. The event could have other effects, which are not purely economic. The social
aspect of hosting sporting-events is one of happiness of the host-country’s citizens.
Nonetheless, wielding in the bid for the WC was received with mixed emotions by the citizens. The
country still suffers from a lot of poverty and great gap between the rich and the poor. South Africa is
ranked 6th based on GDP per capita from 2011 in Africa (World Bank, 2014), which is considered as the
poorest continent.
The so called “feel-good” factor of hosting a mega-sport event has two sides to the story. Organizers
proclaim that the happiness of the citizens increases during and after the country hosted a mega-sport
event. However, academic economists have been suspicious to believe in this effect. Kavestos and
Szymanski looked at twelve European countries and acquired the life satisfaction data on these countries.
Their research covers three mega-sporting events, namely the Olympic Games, FIFA World cups and
UEFA European Championships. The researchers separate the effects of before and after the events,
splitting their estimations in announcements effects and legacy effects. Their results on the sporting
events involving football events are particular interesting. They find significant short-term increases of
reported life satisfaction from the citizens of countries who hosted World Cups. This finding would be in
line with the hypothesis formulated above. However, they mention that in these countries, football is the
dominant sport (Kavetsos & Szymanski, 2009). But the same goes for South Africa, where football is one
of the most popular sports besides cricket and rugby.
The graph on the next page shows the average happiness from South Africans as retrieved from the World
Database of Happiness (see graph 2). An increase can be observed after the announcement of hosting the
World Cup in 2004. The increase persists until 2009, but already in 2012 a decrease of average happiness
is visible.
Graph 2: Average Happiness in South Africa (Veenhoven, 2015)
19

The subjectiveness of happiness makes it a hard variable to measure. Therefore, contributing the entire
increase (and later on decrease) of the average happiness to hosting the World Cup is near to impossible.
However, if the increase in happiness would be contributed to being the host-country, the WC can be
considered as an expensive way to satisfy a country’s citizens. Szymanski finds that selling your
government on hosting a sport event on economic arguments are hard, as the profits are found to be small.
He argues that spending tax money on hosting a sport event can be considered as a type of public
consumption, as a reward for the city’s citizens. He acknowledges the fact that spending the tax-payers
money on such an event could very well not be accepted by the tax-payers, but he offers the argument as
a way to justify bidding for a sport event (Szymanksi, 2002). Chalip argues in a similar fashion that
researchers are staring themselves blind on the economic impact of sport events, while social values of
sporting events are neglected. Hosting a sport event can empower community action, adress social issues
and offer networks to the locals (Chalip, 2006).
This section emphasizes the importance of social impact of sport events like the FIFA World Cup. Even
when the economic impact lacks the nessary arguments for promoters to convince their regional
governments to host an event, the social aspect can work as a decisive argument.
20

Data
Descriptive statistics of the datasets
The following section will in detail describe the data used for the analysis. The data is mostly retrieved
from the World Bank, UNCTAD and Statistics of South Africa. The time span of the dataset is from 2001
up to and including 2013. The observations are monthly, meaning that the each country has 156
observations (t=156). This range is assessed by looking at the data availability on tourism in South Africa.
The legacy effects of the 2010 FIFA World Cup therefore are measured as the three consecutive years
following the event. The international trade models use 13 time periods, because the bilateral exports and
bilateral imports variables are measured annually.
Models on tourism
The dataset has been divided into three subgroups based on several country-specific characteristics. A
summary of all the countries included in the different datasets is showed in table 3. How many micro-
countries, participants and SADC members each dataset contains is also showed in this table. One of the
dataset includes all the countries in the world, only excluding countries based on data unavailability. This
dataset includes 160 countries from all over the world. The tourism model and international trade model
will both be using this dataset. 135 of these countries are non-participants to the 2010 FIFA World Cup,
while the remaining 25 countries did participate. This means that 7 countries that did participate are not
included in the models, because of data unavailability of these countries.
The following datasets are especially constructed to avoid biased estimation by excluding countries that
do not account for a large part of either number of arrivals or are relatively small business partners of
South Africa. The countries with less than 100 arrivals in South Africa per month have been excluded
from this dataset in the tourism model. These countries are relatively small and are therefore not the main
target for South Africa to gain their increased tourism. This particular dataset consists of 47 small
countries, 27 medium countries and 12 large countries6. This leaves us a total of 86 countries in the
second dataset.
Table 3: Countries included in each different dataset used for the tourism models
6 Countries are categorized based on the number of tourists travelling to South Africa on average per month. Micro < 100 average arrivals; Small between 100 and 1,000 arrivals; Medium between 1,000 and 10,000 and Large is 10,000+ average arrivals.
21

World Non-Micro Non-SADC Non-Micro &
Non-SADC
Total 160 86 148 74
Micro 74 0 74 0
Small 47 47 46 46
Medium 27 27 23 23
Large 12 12 5 5
Participants 25 23 25 23
Non-Participants 135 63 123 51
SADC 12 12 0 0
Non-SADC 148 74 148 74
The third subgroup of dataset looks at the non-SADC countries. Arrivals from SADC countries cannot be
sufficiently defined as a migrant worker or leisure tourist. As we are only interested in the latter, we look
separately at these non-SADC countries. This dataset consists of 148 countries. 12 SADC members are
thus included in the world dataset. This dataset is not only used for the tourism model, but also for the
international trade model. The reasoning behind using this dataset is that South Africa will use the World
Cup to advertise themselves to the world instead of the SADC members, which they already have trade
agreements with.
The fourth dataset corrects for both the distortion of micro-countries and SADC members. Both of these
subgroups are excluded from the dataset, leaving 74 countries for the tourism model.
Below the functional form of the regression analysis is shown. The following section will explain the
variables used in the analysis.
ln (arrivals )=α+ βi X ¿+γ i M ¿+δ i E ¿+ηi S¿+ε¿
22
The dependent variable used in the regressions is based on the number of arrivals in South Africa. The
data is retrieved from the institution Statistics of South Africa, which keeps track of national statistics
(Statistics South Arica, 2014). Their reports on tourism show the number of foreigners visiting South
Africa by land, air and sea. South Africa’s immigration offices collect the data, making it data that covers
the entire nation. The number of tourists is expressed by country and monthly, which makes the data
suitable for a panel analysis. The data on arrivals had to be adjusted due to a change of definition in
arrivals by the Statistics SA. The statistics preceding 2009 included tourists that visited SA and left on the
same day. These same-day-visitors were aggregated and expressed separately for the following years
(2009-2013). The average percentage of same-day-visitors by country before the change in definition is
used to correct for this. Thus, the same-day-visitors, estimated using previous findings, were added to the
numbers of arrivals after 2008. The variable is in logs to approximate normality. The number of arrivals
could be zero in the dataset and this is corrected for when transforming the variable.
The variables included in the regression can be categorized in the following sections: Main explanatory
variables related to the World Cup (X it), seasonality effects (Mit), economic effects (Eit) and sport event
effects (Sit). The following section will give a detailed summary of all the included explanatory and
control variables.
One of the explanatory variables (X ¿) is a dummy variable that takes the value of one for the month June
during the 2010 FIFA World Cup. Another dummy is constructed to indicate the month July 2010. These
variables will test hypothesis 1a. A specific dummy variable is included in all the datasets, but is not
included in the models. This variable takes the value 1 if the country participated and a 0 if the country is
a non-participant. This variable is used when testing hypothesis 1b.
Another main explanatory variable is called legacy (Preuss, 2007). The variable shows a value of one
after the 2010 World Cup and a zero otherwise. The 2010 South Africa World Cup was held in June and
July, meaning that this legacy effect start from August 2010. 41 observations are analyzed post-event.
This variable will examined when testing hypothesis 1c.
Again, the variable that indicates whether a country is a participant or a non-participant is used to test the
different legacy effects and examine hypothesis 1d.
Seasonality effects (M ¿)
Tourism might be the variable that is most affected by seasonality effects. There are two types of
seasonality effects at work while looking at tourism. One of the effects is called the natural effect, which
23

depicts that tourists are motivated by nature phenomena resulting from the destination’s climate and true
season of the year. A variable of time is included to control for these seasonal fluctuations of arrivals. The
second one is institutional seasonality, which is associated with the cultural values of the tourist’s home-
country. An example of this is the fixed public holiday, which is set by the national government (Butler,
2001). These effects will be captured by controlling for time linearly (t=1 to t=156) and seasonally by
including month dummies.
Economic effects (E¿)
Tourism depends closely on economic aspects of relating countries. Therefore, a control variable for GDP
per capita based on purchasing power parity (PPP) is used (World Bank, 2015). GDP per capita from the
home-country is not only important because traveling abroad is expensive, but also because tourist
services will be greater in numbers and quality in these country. Countries with high GDP per capita also
tend to have better infrastructures, which makes travelling abroad more accessible (Gil-Pareja, Llorca-
Vivero, & Martinez-Serrano, 2007). The gross GDP is converted to the international dollar. GDP is
included in the models as a logarithm. The exchange rate might also be a decisive feature when looking at
tourism. Favorable exchange rates decrease the prices for tourists, encouraging them to visit the countries
where their money is worth the most. The model includes exchange rates between the Rand of South
Africa and the Local Currency Unit (LCU). These exchange rates are retrieved from the World Bank
(World Bank, 2015)7.
Another economic control variable added in the model is bilateral exports. This variable is not commonly
used in the literature, but might add additional control power. The countries where South Africa exports
the most to could have closer business ties with the country. Therefore the citizens are more exposed to
South Africa, increasing the probability of choosing South Africa as vacation destination. The data on the
bilateral exports between South Africa and home-countries is retrieved from the UNCTAD8. The variable
is included in logarithm form.
Sport event effects (S¿)
Besides football, there are two other major sports being played in South Africa. One of them is cricket.
National teams play against each other while on tour in their own or another country, usually followed by
a large group of national supporters. The second major sport is rugby, which is also highly popular in a
7 Several European countries adopted the Euro during the time period of this analysis. The exchange rates are correctly accordingly. Slovenia (2007), Cyprus (2008), Malta (2008), Slovak Republic (2009), Estonia (2011).
8 United Nations Conference on Trade and Development24
select group of other countries. These two sports also generate tourism by sport fans travelling to South
Africa. This sport-affiliated tourism will be taken into account by using dummy variables that will take on
the value one whenever a major sport match between countries is held in South Africa. The dummy
variables on both sports are accumulated to the dummy variable anglosport. Additionally, a dummy
variable is dedicated to the confederation cup. The Confederation Cup is football event that always takes
place the year before the World Cup in the host-country. The winning countries of continental
championships are competing against each other for confederation cup9.
Models on International Trade
The same datasets are used in modeling the analysis on exports and imports with only slight differences in
the definition of a micro-country. The models using the world dataset and the Non-SADC dataset are
exactly the same as used for the tourism models. Non-SADC countries are examined separately, because
an international event as the World Cup might be one of the only opportunities for South Africa to reach
out to these countries. The SADC members already have the trade agreements with South Africa and
therefore should not be the target of this effect.
Micro countries for the export models are defined as countries to which South Africa exports for less than
$ 2000 annually. Using this definition, 130 countries are left in this dataset. The international trade model
for imports of South Africa excludes countries that export for less than $ 2000 worth of goods to South
Africa. This dataset consists of 113 countries. These countries are excluded to avoid biased estimations.
For example, when the export to a micro-countries increases by $ 2000 worth of goods, the model will
estimate an increase of 100% in exports for this country, while the absolute values of the increase is not
very high. Results like these will reflect inaccurate effects. Table 4 shows the specifics on the countries
included in the datasets that correct for micro-countries.
Ultimately, the two subgroups are examined simultaneously. This dataset excludes the 12 SADC
countries from the original dataset as well as the specifically defined micro-countries. The last dataset
consists of 118 countries for the export model and 101 for the import model.
Table 4: Countries included in different datasets used for the trade models
9 The countries that participated for the Confederation Cup of 2009 are: South Africa (Host country); Italy (World Champion 2006), United States; Brazil; Iraq; Egypt; Spain and New-Zealand.
25

Non-Micro
(exports)
Non-Micro
(Imports)
Non-Micro &
Non-SADC
(exports)
Non-Micro &
Non-SADC
(imports)
Total 130 113 118 101
Micro 0 0 0 0
Non-Micro 130 113 118 101
Participants 24 24 24 24
Non-Participants 106 89 94 77
SADC 12 12 0 0
Non-SADC 118 101 118 101
The same variables are used, but used for different reasons. The dependent variables in the international
trade models are bilateral exports and bilateral imports. The logarithm is taken from both dependent
variables, while taking into regard that the logarithm of zero does not exist.
The equations below show the functional form of both international trade models.
ln ( Bilateral Exports )=α+ βi X¿+ηi E¿+θi C¿+ε¿
ln ( Bilateral Imports )=α+ βi X ¿+ηi E ¿+θi C¿+ε¿
The explanatory variables (X ¿) in these models are different compared to the tourism models, because the
bilateral exports and imports are measured annually. Therefore, the dummy indicating an effect during the
event takes the value 1 in the year of the event (2010) and 0 otherwise. The legacy effects are also
constructed annually. This adjustment means that the dataset only consists of 13 time-periods, which
includes 3 time periods after the event (2011, 2012 and 2013). These models include an interaction term
that is 1 for participating countries in the year 2010 and 0 otherwise (wc2010year_part).
Economic effects (E¿)
26

Similarly to the tourism models, the economic effects are taking into account when controlling for these
models. GDP per capita (PPP) is controlled for. Countries with higher incomes are more likely to import
products from South Africa and are more likely to be able to export towards South Africa. The logarithm
is taken from this control variable. Favorable exchange rate will be even more present in this model as it
lowers the prices of the goods. Besides these effects, the bilateral imports are controlled for in the export
model and vice versa. The logarithm is taken from these control variables.
Country-specific effects (C ¿)
This regression analysis controls for several country specific effects. Firstly, dummy variables are added
to indicate whether the tourist’s country of origin is a member of the OECD. The OECD is an
international organization that stimulates economic progress and world trade. Even though South Africa
is not a member of the OECD, it remains relevant whether South Africa’s tourists are travelling from
member countries (Fourie & Santana-Gallego, The Determinants of African Tourism, 2011). South Africa
is viewed as key partner of the OECD members. The council of the OECD adopted a resolution in 2007
to enhance co-operation between members and South Africa (OECD, 2015). The list of members of the
OECD is found on their website (OECD, 2015)10.
Other country-specific dummies that are used include whether the country of origin is in Western Europe,
the former Soviet Union or member from the SADC. These dummies relate the countries that have
economic bonds with each other. Western Europe is bounded by the European Union. The former Soviet
Union still have economic ties in the Eurasian Economic Union. These control variables are added,
because similar results for countries within these treaties are expected due to economic bonds and
geographical proximity amongst them. The SADC is the Southern African Development Community.
South Africa is also member to this economic treaty11. The economic ties between these countries also
enable migrant workers to cross the borders. As mentioned above, a separate dataset was constructed to
rule-out the migrant workers in the variable of arrivals. A subgroup of geographical variables is also
included in this effect. Whether tourists are from South America or from Africa is controlled for by
control dummies. Also a dummy is constructed on whether home-countries of the tourists are English-
speaking (anglo), which is a primary language in South Africa.
10 Chili, Estonia, Israel and Slovenia have only become members of the OECD in 2010 and are included accordingly.
11 Besides South Africa, the member states of SADC are Angola, Botswana, Democratic Republic of Congo, Lesotho, Madagascar, Malawi, Mauritius, Mozambique, Namibia, Seychelles, Swaziland, United Republic of Tanzania, Zambia and Zimbabwe.
27
Furthermore, a country-specific variable is included for the distance between capital cities of country of
origin and South Africa. The distance is measured in kilometers. The distances are found using the
distance calculator from GlobeFeed (GlobeFeed, 2015). Longer travelling time to the destination is
commonly experienced as displeasing. Therefore distance is controlled for.
Dummies are included to indicate whether the tourists share a common language spoken in SA.
Languages spoken in SA include Swazi, Dutch and English. The latter are based on historical ties
between the countries. These historical ties are also included the regression using a dummy for colonial
ties. Whether the countries of origin and SA have common borders also influences the amount of tourists
from these countries, which might not be captured by the variable distance. A dummy is included
accordingly.
Methodology
Tourism Models
28
The software used for the estimations is Stata. Similar to the regression analysis of Peeters et al., I follow
the regression model as posed by Pesaran and Smith. They show that panel data constructed in the
particular manner as this dataset, shows the best results when separate regressions are estimated. This
means that different coefficients apply for every country in the dataset. The estimation method only
works with significantly high number of observations (N) and time periods (Pesaran & Smith, 1995).
A collinearity problem arose when bilateral exports and bilateral imports were both included in the
models (correlation of 0.8514). Therefore, only bilateral exports has been included in the tourism models.
The tourism model uses White Standard Errors to avoid problems with heteroskedasticity. The
logarithmic transformations are primarily included for easy interpretation in percentage changes rather
than absolute changes. The dataset has a sufficient number of observations to comply with the central
limit theorem that states that the variables will be approximately normally distributed. The fact that the
logarithm of zero does not exist is taking into account when transforming the variables. Finally, the
Dickey-Fuller test with trend on stationarity only did not reject one country (Belarus). This country is
therefore excluded in the models.
International Trade models
The method described by Pesaran and Smith could not be applied to the models concerning international
trade. This method can only be used when sufficient number of time periods and observations are present
in the dataset. The data on bilateral exports and bilateral imports are annually, which means that there are
13 time periods (2001-2013). Therefore, the Fixed Effects model and Random Effects model are the most
suitable alternatives. A Hausman test is conducted to decide which specific to use for every separate
dataset. The Hausman test only rejects the null-hypothesis for the second model of the import models,
which excludes micro-countries. The Random Effect model is this case will be inconsistent. A Fixed
Effects model is estimated for this dataset. However, this type of model does not allow for time-invariant
variables, meaning that the explanatory variables that indicate the effect during and after the World Cup
could not be examined in this model. The interaction term on participating countries could be assessed in
this model. All other international trade models are estimated using Random Effects. The models correct
for heteroskedasticity by using robust standard errors. Normality is approached by including the
logarithmic form for the relevant variables.
Results
29
Table 5 shows a formatted table on the results of the t-tests and the means of all the coefficients regarding
tourism models 1, 2, 3 and 4. The actual p-values of the t-tests can be found in the Appendix (see table 3,
4, 5 and 6 in Appendix). Model 1 uses the world dataset. Model 2 uses a dataset that excludes micro-
countries. Model 3 uses the dataset that excludes SADC countries. Finally, model 4 uses a dataset that
excludes both micro-countries as well as SADC countries.
Table 5: Results of the Pesaran-Smith tourism models
Coefficients Model 1(mean)
Model 2(mean)
Model 3 (mean)
Model 4 (mean)
Explanatory variables
wc2010june 0.8075*** 0.6723*** 0.8652*** 0.7660***
wc2010july 0.3420*** 0.2472*** 0.3699*** 0.2874***
legacy 0.0301 0.0557* 0.0311 0.0618**
constant 1.8524* 3.4647* 1.6279 3.4892**
Seasonality effects
t 0.0023** 0.0049*** 0.0013 0.0032***
month dummies varies Varies varies varies
Economic effects ln_GDP 0.0053** 0.0048* 0.0050** 0.0040
ln_bilateralexports 0.0531* 0.0094 0.0759*** 0.0480
exchangeratelcurand -21.3911 0.6065 -23.1347 0.6865
Sport event effects
anglosport 0.0311 0.0075 0.0336 0.0086
confedcup 0.0178* 0.0151* 0.0192* 0.0175*
* p < .1, ** p < .05, *** p < .01
Model 1: World tourism model
The first model that is estimated uses the dataset of all the countries in the world from which data was
available. This dataset consists of 161 countries. However, the observations of Belarus are dropped from
the dataset, because the Dickey-Fuller Test including trend could not be rejected at a 5% significance-
level. This stationarity problem occurred in all of the dataset and therefore Belarus is excluded from all
the analyses. This still left a large dataset of 160 countries for the world dataset.
30

The t-tests show whether the coefficients, which are estimated for every separate country, are
significantly different from zero. Firstly, the dummy that takes the value of one during the month of June
when the 2010 FIFA World Cup was held (wc2010june) is significant at 1% (p=0.000). The mean of all
the coefficients is 0.8075, indicating an overall positive effect of the World Cup. Model 1 also estimates a
positive significant effect for the second month in which the World Cup was held. The effect for July
2010 is significant at 1% and has a mean of 0.3420 over all the coefficients. The histograms show the
distribution of the coefficients for the months June and July of 2010. These histograms show that most of
the coefficients indicating the months of the World Cup are positive.
Histograms on the distribution of the coefficients of wc2010june and wc2010july (World)
The results from this model find evidence to support hypothesis 1a (hosting the 2010 FIFA World Cup
had a positive effect on tourism in South Africa during the event). The second hypothesis on the tourism
models is about the effect of the World Cup on arrivals from participating countries during the event.
Table 6 shows the results of a t-test on the differences between participating countries and non-
participants.
31

Table 6: Results of t-test on the difference between coefficients for participants and non-
participants (World)
Mean June P-value June
(two-sided)
Mean July P-value July
(two-sided)
Non-participants 0.7398 0.0258 0.3596 0.4101
Participants 1.1725 0.2474
The difference between arrivals from participants and non-participants is significant at 5% for June 2010.
This had to be expected as most of the games of the 2010 FIFA World Cup are played in June. Besides,
all participating countries were still in the tournament in June, while in July only the quarter finals, semi-
finals and final was played. There are no significant differences found between participants and non-
participants travelling to South Africa in July 2010.
Thus, the model shows promising results concerning the arrivals during the event. However, the aspect
that is less addressed in the literature involves the long-term effects of the World Cup. The legacy effect
of the World Cup on arrivals is not significant in the world model at 10% (p=0.3160). Therefore the
model rejects hypothesis 1c, which depicts an increase in long-term arrivals that can be contributed to the
World Cup. Hypothesis 1d is rejected as well for model 1. When the long-term effects are not significant,
the difference of the legacy effects for participants and non-participants cannot be examined.
The control variables in the model showed mixed results concerning their significance. The time variable
(t) is significant at 5% (p=0.0310), but a few of the month variables showed insignificant results. The
economic control variable of GDP is positive and significant at 5% (p=0.0144). Remarkably, the control
variables of bilateral exports is significant at 10% (p=0.0858), even though this control variables is not
commonly used in the literature. The control variable of the exchange rate does not show significance at
10%. Lastly, anglosport of the control variables concerning the other sport-events does not show
significant results. The variable indicating the confederation cup does however show positive significant
results at 10% (p=0.0964).
32

Model 2: Tourism model excluding micro countries
Model 2 uses a dataset that excludes micro countries, which are the countries that account for a relatively
small part of South Africa’s tourism (less than 100 visitors per month). Excluding these countries leaves a
dataset of 86 countries. The histograms of the explanatory variables of June 2010 and July 2010 are
shown below. These histograms are shown to examine hypothesis 1a. Table 5 shows the results of model
2 (also see table 4 in Appendix).
Histograms on the distribution of the coefficients of wc2010june and wc2010july (Non-Micro
countries)
The distribution of the coefficients of both explanatory variables already indicates a positive effect of
these variables on the number of arrivals. The t-tests show that the coefficients of both variables are
significantly different from zero at 1% (p=0.000; p=0.000). Again, the observed effect is larger for June
2010 compared to July 2010 (means of 0.6723 for June 2010 over 0.2472 for July 2010). The result is
that, according to this model, hypothesis 1a will not be rejected. The World Cup has had a significant
positive effect on tourism for countries that at least have 100 tourists going to South Africa each month.
Unlike in the world model, here I do find a significant positive effect of the long-term effects of the
World Cup on arrivals. The legacy effects are significant at 5%. The histogram shows the distribution of
the coefficients for the legacy effects. The mean of the coefficients of the legacy effects is 0.0557.
Therefore, hypothesis 1c is not rejected for this model. Hosting the World Cup by South Africa has had a
positive long-term effect on tourism.
33

Histogram on the distribution of the coefficients of legacy (Non-Micro countries)
Now that both effects during the World Cup and post-event are found to be significant, we can examine
whether the more foreigners are travelling from countries that participated in the 2010 FIFA World Cup.
Table 7 shows the results of a t-test on the differences between the coefficients for all the explanatory
variables.
Table 7: Results of t-test on the difference between coefficients for participants and non-
participants (Non-Micro countries)
Mean June P-value
June
Mean July P-value
July
Mean
Legacy
P-value
Legacy
Non-
participants
0.4700 0.000 0.2391 0.7708 0.0531 0.8622
Participants 1.226 0.2693 0.0628
Only a significance difference between the coefficients is found for the dummy of June 2010 at 1%. This
finding is in line with hypothesis 1b. However, there is no evidence to support hypothesis 1d. The legacy
effects are thus no driven by visitors from past participants, according to this model.
The control variables all seem to function in the same way as in the first model with only few exceptions.
The control variable of time is significant at 1% (p=0.0009). The month dummies differ in significance. 34
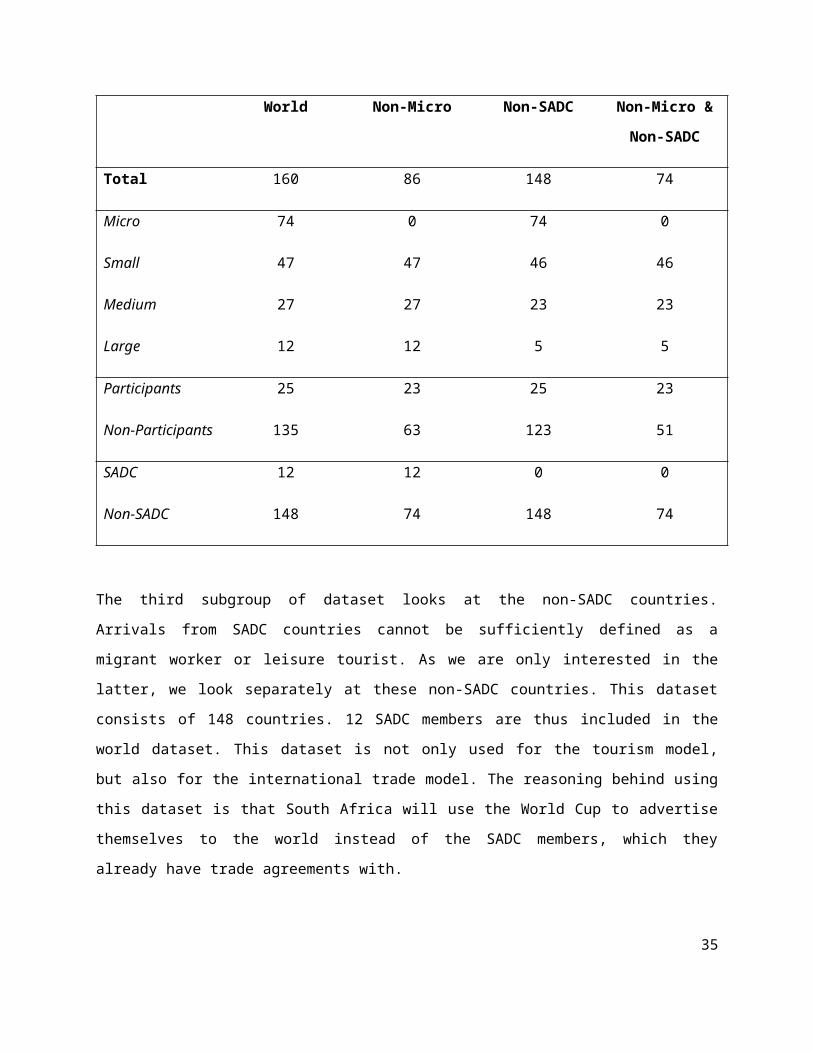
Only GDP per capita (PPP) is significant (at 10%) of all the economic effects controlled for. The variable
that captures the cricket and rugby events (anglosport) is insignificant at 10% (p = 0.7158). The variable
that captures the effects of confederation cup in 2009 is still significant, but at a 10% significance level (p
= 0.0730).
Model 3: Tourism model for Non-SADC countries
Model 3 only takes into account the countries that are not members of the SADC. The reason for
choosing this particular subgroup is that the SADC countries account for many migrant workers travelling
across member countries. Including the arrivals of these countries could therefore show misleading
results, because these migrant workers are not the tourists that spend their money in South Africa. Table 5
shows the results of model 2. The p-values of all the t-tests can be found in the Appendix (see table 5 in
Appendix). Again, the histograms of the coefficients for the explanatory variables are shown below
Histograms on the distribution of the coefficients of wc2010june and wc2010july (Non-SADC)
The results of t-test show significant effects on
tourism during the World cup for both months at a
1% significance level (p=0.0000; p=0.0000). The
means of the coefficients are positive for both
months. And again, the effect of June on the number
of arrivals is stronger than that of July (means of
0.8652 over 0.3699). Hypotheses 1a will not be
rejected based on these results.
The models does not support hypothesis 1c, because
the legacy effects are not significant on a 10% significance level (p= 0.3342). Thus, hypothesis 1d will not
Table 8: Results of t-test on the difference between coefficients for participants and non-
participants (Non-SADC)
Mean June P-value June Mean July P-value July
35

(two-sided) (two-sided)
Non-participants 0.8027 0.0615 0.3964 0.2934
Participants 1.1724 0.2474
A t-test on the differences between the coefficients from participating and non-participating countries is
conducted to examine hypothesis 1b. Similar results are found as in the previous models. The difference
between participants and non-participants on the number of arrivals in June is significant at 10%. More
foreigners came from participating countries in that month compared to foreigners from non-participating
countries. However, this difference is not significant for July 2010. These results confirm hypothesis 1b.
Model 3 is the first model in which the control variable for time is not significant. Only the control
variable for exchange rate is insignificant, regarding the economic effects. GDP per capita (PPP) shows a
positive effect and is significant at 5% (p=0.0273). Bilateral exports also seem to positively affect tourism
coming from the country to which South Africa exports. This effect is positive at 1% (p=0.0040).
Regarding the sport event control variables, only the dummy for the confederation cup shows a
significant result. The effect is significant at 10% (p=0.0965).
Model 4: Tourism model for Non-SADC countries and excluding micro countries
This final dataset that is used in the analysis combines the two previous models. The results from these
models are the most reliable as the micro countries are excluded to prevent distorted coefficients and the
SADC countries are excluded to avoid migrant workers from biasing the estimations. The results are
again shown in table 5. The p-values of the t-tests can be found in the Appendix (see table 6 in
Appendix).
The two explanatory variables that indicate the effect during the World Cup are positive and significant at
1%. Again, these results show a larger effect for the month of June 2010 compared to July 2010 (mean of
0.7660 for June 2010 over 0.2874 for July 2010).
The positive effect of the World Cup on tourism during the event is also easily observed in the histograms
below. Hypothesis 1a will not be rejected, according to model 4. The histogram on the coefficients of the
36

legacy effects is again well balanced. However, the overall legacy effect is positive and significant at 5%
in model 4 (p=0.0257).
Histograms on the distribution of the coefficients of wc2010june, wc2010july and legacy
(Non-Micro & non-SADC)
The results of the effects on participants also show
similar results compared to the previous models. Table
9 shows the results from the t-tests on the differences
in coefficients between participants and non-
participants. The difference between the coefficients
for both groups is significant at 1% with a higher mean
for the coefficients of the participant countries in June
2010. The difference is not significant for July 2010 or the legacy effects. The models thus provide
evidence to support hypothesis 1b, but again no evidence is found to support hypothesis 1d.
Table 9: Results of t-test on the difference between coefficients for participants and non-
participants (Tourism Model excluding micro countries & SADC)
Mean June P-value
June
Mean July P-value
July
Mean
Legacy
P-value
Legacy
37

Non-
participants
0.5583 0.0003 0.2956 0.8115 0.0613 0.9800
Participants 1.2264 0.2693 0.0628
Several month dummies are not significant in this final model. None of the economic control variables are
significant. Lastly, anglosport is again not significant for this model, as it was in all previous models.
Comparing the four models on tourism
Table 10 compares the evidence found in all four different models for the hypotheses as stated in the
literature review part of this thesis. The hypotheses are as follows. Hypothesis 1a depicts a positive effect
on tourism during the World Cup. Hypothesis 1b states that more visitors will travel from participating
home-countries compared to non-participants during the event. Hypothesis 1c depicts that a positive
effect on tourism will occur post-event and hypothesis 1d states that there will differences in tourism
between participating countries and non-participating countries in the long-term.
All the models find evidence for additional tourism to South Africa during the 2010 FIFA World Cup.
Hypothesis 1a is therefore clearly supported as was expected. These results are in line with the results of
previous research (Peeters, Matheson, & Szymanski, 2014) (Du Plessis & Maening, 2011). More
interesting is the evidence found for the second hypothesis, even though this is moderately expected.
During the event, more tourists came from participating countries compared to non-participating
countries. However, this effect was not significant for July 2010, when only the quarter finals, semi-finals
and final was held. This left only 8 participating countries still in the tournament compared to 32
participating countries in June. The models excluding micro-countries show evidence for the legacy
effects of the World Cup. According to these models, hosting the 2010 FIFA World Cup has had a
positive effect on tourism for the years exceeding the event. There is no evidence found for the hypothesis
that states that the post-event additional tourists are mainly coming from countries that have participated
in the 2010 FIFA World Cup.
Table 10: Evidence for tourism hypotheses
Models Hypothesis 1a(during WC)
Hypothesis 1b(during WC participants)
Hypothesis 1c(legacy)
Hypothesis 1d(legacy
participants)
38

World Not reject Not reject Reject -
Excluding Micro countries
Not reject Not reject Not reject Reject
Non-SADC Not reject Not reject Reject -
Non-SADC and excluding micro countries
Not reject Not reject Not reject Reject
Additional tourists
Now that we have found conclusive outcome of the effect of the World Cup on tourism both during the
event as well as post-event, the number of additional tourists will be estimated based on these datasets. In
the end, we want to know how many additional tourists have travelled to South Africa that would not
have in absent of the 2010 FIFA World Cup. Table 11 shows the number of additional tourists that solely
visited South Africa, because the World Cup was hosted there.
Models 1 and 3 did not show significance for the legacy effects. The total additional tourists are therefore
not calculated for these models. The estimations for the months June and July for these models do show
significant increases in the number of tourists.
Model 2 shows that South Africa was visited by 246,408 tourists in the months June and July of 2010,
because of the World Cup. The legacy effects suggest that 804,218 tourists travelled to South Africa, even
after the event has passed. 1,050,627 tourists is the total of additional tourists that visited South Africa
that can be contributed to the World Cup for model 2. However, the models where SADC countries are
included show higher results for additional tourism. The migrant workers from these countries thus make
up a significant amount of these estimations.
Table 11: Additional tourists for every different dataset
World
(arrivals)
Non-Micro
countries
Non-SADC
(arrivals)
Non-Micro and
Non-SADC
39

(arrivals) (arrivals)
Additional tourists
during event (June)
185,449 180,018 167,859 162,429
Additional tourists
during event (July)
67,957 66,390 43,086 41,520
Additional tourists
post-event
Insignificant 804,218 Insignificant 345,484
Total additional
tourists
- 1,050,627 - 549,433
Model 4 excludes for the micro countries and the SADC countries. Estimations based on this model are
thus most reliable. The model estimations that 167,429 tourists travelled to South Africa in June 2010 that
would not travelled there if the World Cup had been absent. Only 41,520 travelled there in July for the
same reason. The years exceeding the event also brought additional tourists to the country. According to
the estimations 345,484 tourists travelled to South Africa, who would not have gone there in absence of
the World Cup. This gives us a total of 549,433 tourists making their way to South Africa that can be
contributed to hosting the World Cup.
Value for money
Again, the most reliable estimations are gained from the non-micro and non-SADC dataset. The estimated
additional tourists during the event caused by hosting the 2010 FIFA World Cup are 203,949. The latest
predictions by Grant Thornton estimated 309,554 tourists travelling to South Africa during the event,
which are supposed to spend an average of $ 1,625 (Grant Thornton, 2011). Their predictions are thus
overestimating the effect of the World Cup during the event. The difference between the estimations from
the models and those of Grant Thornton is 105,605 tourists, which is quite a large difference. Using the
same average expenditure, this will give us an overestimation of $ 171,608,125 by Grant Thornton.
The costs of the event are estimated by Grant Thornton to be around $ 5.51 billion. On top of this, South
Africa allegedly bribed FIFA officials for 10 million dollars. This leaves a total of costs due to the World
Cup of around $ 5.52 billion. The economic impact of the additional tourists during the event will only
40

account for a total of expenditures in South Africa’s economy of $ 331,417,125. This does not even come
close to the costs. Even when we take into account the expenditures done by the additional tourists after
the event, the total expenditures of the additional tourists only cumulates to $ 892,282,625. Thus, the
costs will not be covered by the expenditures of additional tourists. This means that hypothesis 1e will be
rejected.
The only way South Africa could salvage this problem is by earning their money back through different
channels. The following section looks at the effect of the World Cup on South Africa’s international
trade.
International trade models
Hosting the 2010 FIFA World Cup could also affect the international trade of South Africa rather than
only influence South Africa’s tourism. The following models examine the effects of the World Cup on
bilateral exports and bilateral imports. Firstly, we will take a look at the models which take bilateral
exports as dependent variables. Table 12 is a formatted table of the results. The table shows the results of
the explanatory variables for each of the export models separated for the different datasets. The Hausman
tests on all the export models do not reject the null-hypothesis that Random Effects is consistent.
Therefore only the Random Effects results are shown as it is more efficient than the Fixed effects models.
A more detailed table, which includes all the control variables, can be found in the Appendix (see table 7
in Appendix).
The first export model on the world dataset shows a significant positive result for additional exports of
South Africa in the year 2010, when the World Cup was held. However, the effect is only significant at a
10% significance level. It shows that due to the World Cup South Africa’s exports increased by 4.7% in
2010, ceteris paribus. The model shows a significant legacy effect of the World Cup on South Africa’s
exports at 1%. This results show that due to the World Cup SA’s exports increased by 21.1%, ceteris
paribus. Remarkably, the interaction term between the year 2010 and whether a country was participant in
the World Cup shows a significant positive effect at 1%. According to these results, export from South
Africa to participating countries went up by 58.7% in 2010, ceteris paribus.
Table 12: Results of the international trade model on South Africa’s exports
41
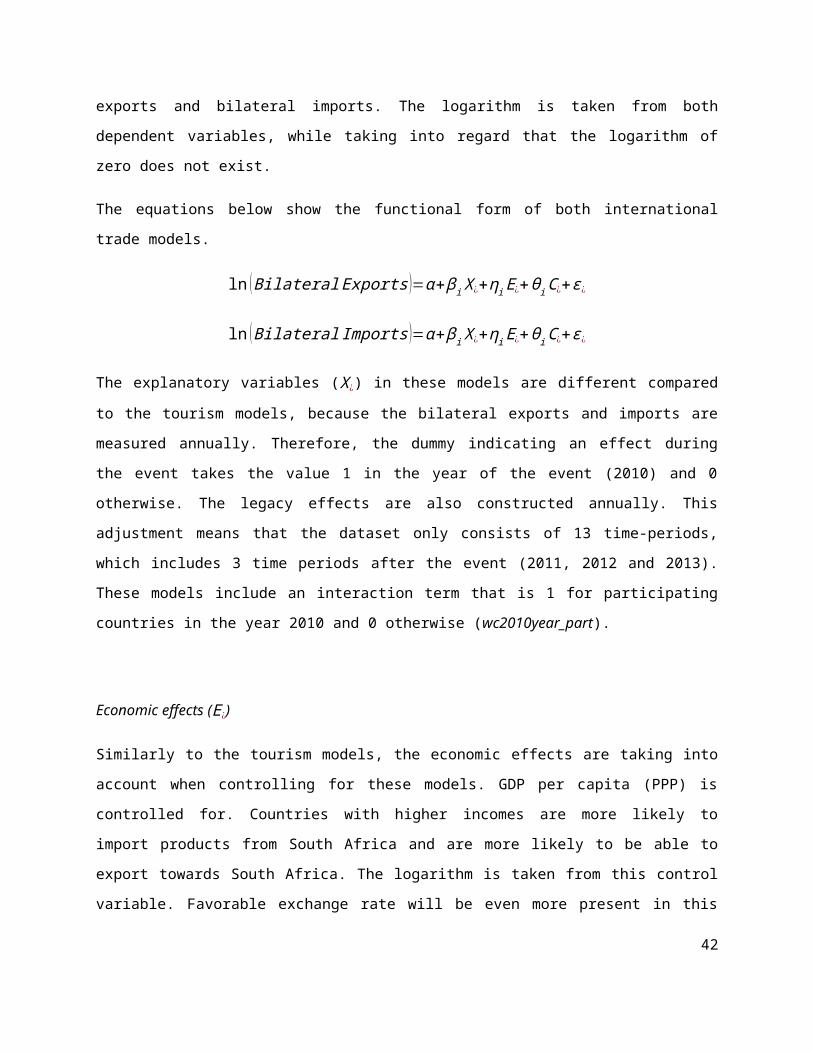
World Non-Micro Non-SADC Non-Micro & Non-SADC
Random Effects Random Effects Random Effects Random Effects(ln_bilateralexports) (ln_bilateralexports) (ln_bilateralexports) (ln_bilateralexports)
wc2010year 0.04677* 0.18858*** 0.17657*** 0.24593***
(0.02840) (0.04113) (0.03848) (0.04575)
legacy_years 0.21061*** 0.24820*** 0.25989*** 0.30211***
(0.03014) (0.04108) (0.03627) (0.04473)
wc2010year_part 0.58717*** 0.48692*** 0.44703*** 0.41197***
country-specific effects YES YES YES YES
economic effects YES YES YES YES
Constant 5.92252*** 6.38884*** 5.66969*** 6.09146***
(0.23241) (0.21096) (0.22353) (0.20373)
Observations 1685 1397 1573 1288Standard errors in parentheses* p < .1, ** p < .05, *** p < .01
Similar results are found when excluding the micro countries (based on the exports of South Africa).
Again, the exports of South Africa increase significantly during the year of the World Cup. South Africa
enjoyed an increase of 18.9% of its exports because of the World Cup, ceteris paribus. The effect is
significant at 1%. An effect of 24.8% increase in South Africa’s exports post-event is found to be
significant at 1%, ceteris paribus. This model also shows a positive significant effect during the event for
participating countries. The exports to participating countries increased by 48.7% during the year of the
World Cup, ceteris paribus. This effect is significant at 1%.
The model that excludes SADC members shows significant results for all the explanatory variables at 1%.
South Africa’s increased by 17.7% in 2010, ceteris paribus, and increased by 26.0% in the years
following the event, ceteris paribus. The exports to participating countries increased as well with 44.7%,
ceteris paribus.
Finally, the model that excludes both micro-countries as well as SADC members shows some interesting
results. The model shows a positive significant effect on South Africa’s exports during the year when the
World Cup was hosted. South Africa’s exports increased by 24.6% in 2010, ceteris paribus. The effect is
42

significant at 1%. This model also shows that the country’s exports increased by 30.2% in the years
exceeding the event, ceteris paribus. The legacy effect is even significant at 1%. This model also finds
significant results for increased exports to participating countries during the year of the event. Exports to
these specific countries increased by 41.2% because of the World Cup, ceteris paribus. This effect is also
significant at 1%.
The models show overwhelming evidence that exports have increased, because of South Africa hosting
the 2010 FIFA World Cup. The effects transcend the year of the event. Hypothesis 2a has been tested by
these models. Hosting the 2010 FIFA World Cup has had a positive effect on the exports of South Africa.
This hypothesis cannot be rejected by the findings.
The following models have the dependent variable of bilateral imports, meaning South Africa’s imports
from specific countries. Again, the same differentiation of datasets is used. Table 13 shows the formatted
results focusing on the explanatory variables.
The second model in which micro-countries are excluded is now based on South Africa’s imports.
Countries from which South Africa imports less than $ 2000 of trade goods from are excluded. The
Hausman test rejected the null-hypothesis for this particular dataset. The Random Effect model will
therefore be inconsistent for this model. Therefore a Fixed Effects model is estimated.
The effects of the World Cup on South Africa’s imports show less significant results compared to the
models of South Africa’s exports. However, this had to be expected. Hosting the World Cup could
advertize South Africa as an import opportunity. That South Africa suddenly starts importing more during
the World Cup is not a reason for hosting the World Cup.
The RE model of the world database shows no significant results for increased imports that can be
contributed to hosting the World Cup. Also the Fixed Effects model based on non-micro countries shows
no significant results on South Africa’s imports for any of the explanatory variables.
43

Table 13: Results of the international trade model on South Africa’s imports
World Non-Micro Non-SADC Non-Micro & Non-SADC
Random Effects (ln_bilateralimports)
Fixed Effects (ln_bilateralimports)
Random Effects (ln_bilateralimports)
Random Effects (ln_bilateralimports)
wc2010year 0.07323 - -0.13230** 0.05805(0.07395) (0.05288) (0.04675)
legacy_years 0.04915 - -0.08119* 0.24656***
(0.06494) (0.04685) (0.04980)
wc2010year_part
-0.01594 -0.03921 0.08581* 0.02672
(0.06978) (0.03038) (0.04560) (0.03735)
wc2010year 0.07323 - -0.13230** 0.05805(0.07395) (0.05288) (0.04675)
country-specific effects YES YES YES YES
economic effects YES YES YES YES
Constant -1.07843*** 3.75907*** -1.60665*** 2.94764***
(0.38233) (0.32813) (0.37181) (0.32083)
Observations 1685 1072 1573 976Standard errors in parentheses* p < .1, ** p < .05, *** p < .01
Interestingly, the model excluding SADC members shows significance on all the explanatory variables.
However, the signs of the effect of the World Cup (during and on the long-term) on South Africa’s
imports are negative. The results of this model suggest that because of the World Cup, South Africa
started to import less from non-SADC countries. Additionally, the model shows that imports from
participating countries increased by 8.6% due to the World Cup, ceteris paribus. The effect is significant
at 10%.
The last model shows a significant positive effect in the following years of the event on South Africa’s
imports. The results show a 24.7% increase in South Africa’s imports in the years following the event,
ceteris paribus, that can be contributed to hosting the World Cup. The effect is significant at 1%. A
possible explanation behind this result could be that the event enabled new networks to be made between
businesses. The export models showed significant results for increased exports. These new business ties 44

could have led to the increase in import. The other explanatory variables in this model show no
significant results.
The models show mixed results of the effect of the world cup on South Africa’s imports, both during the
year of the sporting event and post-event. There is no conclusive outcome to reject or accept hypothesis
2b: Hosting the 2010 FIFA World Cup has had a positive effect on the imports of South Africa.
45

Discussion
The research done in this thesis shows several positive effects that benefit South Africa’s economy by
being the host of the 2010 FIFA World Cup. The number of additional tourists during the event is
estimated to be 203,949. This number shows that the predictions on additional tourists prior to the World
Cup are overestimating the effect. These findings correspond with the literature regarding overestimations
of the tourism predictions in the short term (Du Plessis & Maening, 2011). However, the findings in this
thesis are even lower than the predicted values of Peeters et al., who found an estimated effect during the
2010 FIFA World Cup of 294,804 additional tourists (Peeters, Matheson, & Szymanski, 2014). Yet, the
estimations of the models are higher than those of Du Plessis and Maening, who estimate additional
tourists between 90,000 and 108,000 (Du Plessis & Maening, 2011).
The models also show that the additional tourists travelling to South Africa in July are lower compared to
June. The reason behind this could be that most of the World Cup was held in June. Whoever wants to
visit the World Cup will probably be going in this month, when still all the countries are participating.
The legacy effects are also found to be significant. According to Preuss, this effect will only be positive
whenever a country has the necessary event structures (infrastructure, knowledge, image, emotions,
networks and culture) (Preuss, 2007). The World Cup has had positive influences on infrastructure,
knowledge and networks. Also the cultural values are widely covered by the media. But then again, a lot
of media attention went to the serious poverty issues in South Africa. The event structures that might be
lacking for South Africa are thus those of image and emotions. The negative messages of the media might
have harmed the national image of South Africa and could result in less tourism in the years exceeding
the event. Although, these structures might be compromised in the case of South Africa, still the legacy
effects are significant. This means that in order for a country to enjoy the legacy effect of a World Cup on
national tourism, one should focus on the improving infrastructure, establishing network, transmitting
cultural values and acquiring knowledge. Then again, the legacy effect might have been higher when also
the image event structure and emotions event structure are portrayed positively.
That tourists from participating countries travelled to South Africa during the event had to be expected.
This effect is also observed and significant. However, unlike the findings of Fourie & Santana-Gallego in
2015, the models do not find significant differences between these groups post-event. Foreigners from
participating countries do not significantly differ from non-participants in travelling to South Africa after
the event. This could mean that the tourists that went during the World Cup did not visit South Africa
46

again in the following years, taking into account that during the event participating tourists did travel
more to South Africa.
The additional tourists that are found to travel to South Africa due to the event do not nearly cover the
costs of the event. South Africa would have been better off investing the money in the economy rather
than trying to indirectly earn their money back through additional tourism. However, tourism increases is
not the only benefit gained from hosting the World Cup. The models on international trade find increased
exports for South Africa both during the event as well as after the event, which could in the long-run earn
the money back that South Africa has invested. That the effect is already noticeable during the event
could be due to business relations made prior to the event. This finding can be compared with the results
found in the research on the 1992 Olympic Games. The researchers found an increase in international
trade for Barcelona after the event (Bohlmann, 2006). That the legacy effects also apply for a country’s
export was expected by Lee & Taylor in 2005, but they did not examine the effect themselves (Lee &
Taylor, 2005).
The only significant effect found for the final import model is the long-term effect of the World Cup. That
South Africa does not import more during the event seems logical. It is them who try to advertize
themselves to the world, not the other way around. Regarding the significant legacy effects, they could be
significant because of newly forged business ties during the event. When a country imports a lot from
South Africa, the relation between these countries could strengthen and thus more will be imported from
this business partner by South Africa.
Overall, investing billions of dollars in a World Cup should still be considered as a risky investment.
Earning the investment back indirectly through tourism does not seem to work. Also the increase in
international trade will not generate enough cash flows if the growth cannot be persisted over the years
following the event. It might be better for a government to invest the money directly in their own
economy by creating employment, improving infrastructure, spending it on education and national health
care. These economic factors are commonly considered to positively affect the economy in the long run.
A large prestigious sport mega-event might be more sensational, but gambling with the money of
taxpayers is not something that governments should be applauding. Getting appointed as host through
bribery is definitely not advised.
47

Executive Summary
The results from the tourism models show that there is in fact a positive effect of hosting the World Cup
on tourism during the event. When examining the countries which account for higher than 100 visitors on
average each month and excluding the SADC countries, the model estimates 162,429 additional tourists
for June 2010. The model estimates 41,520 additional tourists for July 2010. The total effect on tourism
during the event is thus 203,949. Hypothesis 1a is therefore not rejected. The difference between
foreigners from participating countries and non-participating countries is also found to be significant. For
that reason, hypothesis 1b is also not rejected.
The long-term effect of the 2010 FIFA World Cup on tourism is also found to be significant for this
specific set of countries. The estimated effect accounts for 345,484 additional tourists in the years
exceeding the event. Hypothesis 1c is thus not rejected. The distinction between participating countries
and non-participating countries is not significant concerning the legacy effects. Hypothesis 1d is rejected
as a result.
When the economic impact of the event is assessed, I find that the gains from additional tourism do not
cover the investment. Hypothesis 1e is therefore rejected. The costs of $ 5.5 billion are substantially
higher than the gains from tourism estimated to be $ 0.9 billion.
The international trade models show that exports during the event increased by 24.9%, when micro-
countries and SADC countries are excluded. The effect is significant at a 1% significance level. Also the
legacy effects are found to be significant at 1%. Overall, South Africa’s exports increased by 30.2% in the
years 2011, 2012 and 2013. Hypothesis 2a is therefore not rejected. The effects of the World Cup on
South Africa’s imports are only significant for the years after the event, when excluding micro-countries
and SADC countries. South Africa’s imports increased by 24.7% in the years following the event.
Hypothesis 2b is not rejected as a result.
48
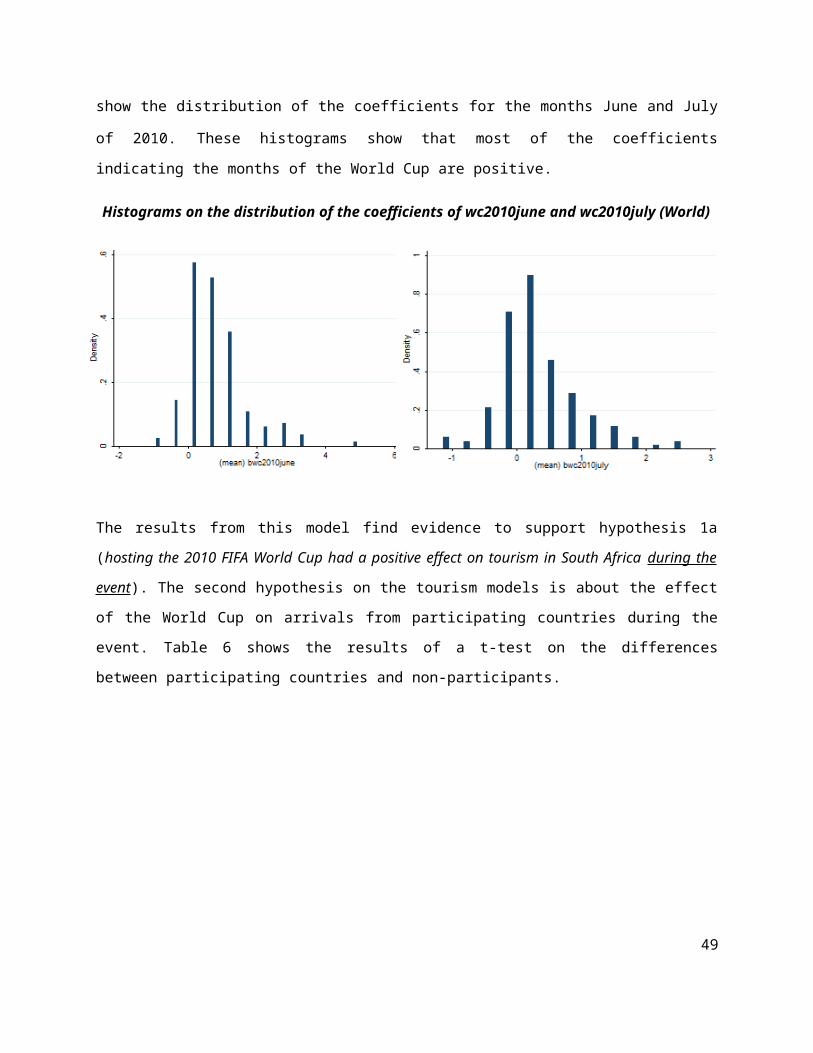
Limitations and future research
There are several aspects that could influence tourism and trade that are not taken into account in this
thesis. Firstly, the legacy effects most likely extent the period studied in this thesis. This research only
studies the three years following the event. It would be interesting to see if the additional tourism persists
for the following years. Additionally, I propose another research structure where the legacy effects are
measured for each following years separately. Such a research structure would enable the researcher to
examine the possibly diminishing nature of the long-term effects, which researchers found when
examining the Seoul Olympics of 1988 (Kang & Perdue, 1994).
Furthermore, several variables should have been included because they influence decisions of travel
destinations, but are not included due to data unavailability. There are individual factors that might play a
decisive role in determining a holiday destination (education, age, gender, religion, income, employment,
health, mobility). These individual characteristics are however hard to examine on a great scale, but the
ideal model will take these into account. Another factor that could have been included and that might be
less difficult to measure concerns the prices of travelling to South Africa. The average hotel prices in
South Africa could have been included in the model. Other variables could be accessibility of the country,
attractions of the country, tourism advertizing expenditures by the country and political stability of the
country.
Another proposal for future research is not so much linked to tourism nor international trade, but to
national happiness. The World Cup is often referred to as an expensive party. Even when the economic
impact turns out to be negative, the social impact of the event could make the investment worthwhile. A
research structure that uses a dependent variable of average happiness could examine whether a World
Cup is actually increasing national happiness.
49

References
Baumann, R., Matheson, V., & Muroi, C. (2009). Bowling in Hawaii: Examining the Effectiveness of Sport-Based Tourism Strategies. Journal of Sport Economics , 107-123.
Bohlmann. (2006). Predicting the Economic Impact of the 2010 World Cup on South Africa. International Journal of Sport Management and Marketing , 383-396.
Bohlmann, H., & Van Heerden, J. (2005). The impact of hosting a major sport event on the South African economy. Journal of Tourism , 595-603.
Bond, P., & Cottle, E. (2011). Economic promises and pitfalls of South Africa's World Cup.
Burgan, B., & Mules, T. (1992). Economic Impact of Sporting Events. Annals of Tourism Research , 700-710.
Butler, R. (2001). Seasonality in Tourism: Issues and implications. London: Pergamon.
Chalip, L. (2006). Towards Social Leverage of Sport Events. Journal of Sport and Tourism , 109-127.
Du Plessis, S., & Maening, W. (2011). The 2010 FIFA World Cup high-frequency data economics: Effects on international tourism and awareness for South Africa. Development Southern Africa , 349-365.
Essex, S., & Chalkley, B. (2010). Olympic Games: catalyst of urban change. Leisure Studies , 187-206.
FIFA. (2015, July 21). Benefits of bidding for and hosting FIFA's other World Cup events. Retrieved July 21, 2015, from fifa.com: http://www.fifa.com/governance/competition-organisation/benefits-of-bidding.html
FIFA. (2015, Juli 20). Bidding for FIFA's Other World Cups. Retrieved Juli 20, 2015, from fifa.com: http://www.fifa.com/governance/competition-organisation/introduction.html
FIFA. (2015, July 9). FIFA Ranking Table: FIFA Ranking (Dec, 2004) - Rank:1 to Rank:49. Retrieved July 22, 2015, from fifaranking.net: http://en.fifaranking.net/ranking/?d=2004-12-20&rnkp=1
FIFA. (2004). Inspection Group: Report for the 2010 FIFA World Cup. Zurich: FIFA.
Fourie, J., & Santana-Gallego, M. (2011). The Determinants of African Tourism. Working Paper , 1-19.
Fourie, J., & Santana-Gallego, M. (2011). The impact of mega-sport events on tourist arrivals. Tourism Management , 1364-1370.
Fourie, J., & Santana-Gallego, M. (2015). The invisible hand of Thierry Henry: How World Cup qualification influences host country tourists arrivals. Journal of Sport Economics , 1-17.
Gil-Pareja, S., Llorca-Vivero, R., & Martinez-Serrano, J. (2007). The impact of embassies and consulates on tourism. Tourism Management , 355-360.
50

GlobeFeed. (2015, July 26). Distance Calculator World. Retrieved July 27, 2015, from distancecalculator.globefeed.com: http://distancecalculator.globefeed.com/World_Distance_Calculator.asp
Grant Thornton. (2011, June 9). World Cup 2011 Data. Retrieved July 28, 2015, from www.gt.co.za: http://www.gt.co.za/files/gt_worldcup_2011_data.pdf
Harding, A. (2015, June 9). South Africa nerves unsettled amid World Cup bribe scandal. Retrieved July 10, 2015, from BBC: http://www.bbc.com/news/world-africa-33064477
Jones, C. (2001). Mega-events and Host-region Impacts: Determining the True Worth of the 1999 Rugby World Cup. International Journal of Tourism Research , 241-251.
Kang, Y., & Perdue, R. (1994). Long-term impact of a mega-event on international tourism to the host-country: a conceptual model and the case of the 1988 Seoul Olympics. Journal of International Consumer Marketing , 205-225.
Kavetsos, G., & Szymanski, S. (2009). National well-being and international sports events. Journal of Economic Psychology , 158-171.
Lee, C., & Taylor, T. (2005). Critical reflections on the economic impact assessment of a mega-event: the case of 2002 FIFA World Cup. Tourism Management , 595-603.
Müller, M. (2015). What makes an event a mega-event? Definitions and sizes. Leisure Studies , 1-16.
OECD. (2015). List of OECD Member countries - Ratification of the convention on the OECD. Retrieved July 5, 2015, from OECD: http://www.oecd.org/about/membersandpartners/list-oecd-member-countries.htm
OECD. (2015). Members and partners. Retrieved July 3, 2015, from OECD: http://www.oecd.org/about/membersandpartners/
Peeters, T., Matheson, V., & Szymanski, S. (2014). Tourism and the 2010 World Cup: Lessons for Developing Countries. Journal of African Economies , 1-31.
Pesaran, M., & Smith, R. (1995). Estimating long-run relationships from dynamic heterogeneous panels. Journal of Econometrics , 79-113.
Pillay, U., & Bass, O. (2008). Mega-events as a Response to Poverty Reduction: The 2010 FIFA World Cup and its Urban Development Implications. Urban Forum , 329-346.
Preuss, H. (2007). FIFA World Cup 2006 and its legacy on tourism. Trends and Issues in Global Tourism , 83-102.
Rose, A. K., & Spiegel, M. M. (2011). The Olympic Effect. The Economic Journal , 652-677.
Saunders, G. (2010, April 21). Grant Thornton: Updated economic impact of the 2010 FIFA World Cup. Retrieved July 28, 2015, from www.gt.co.za:
51
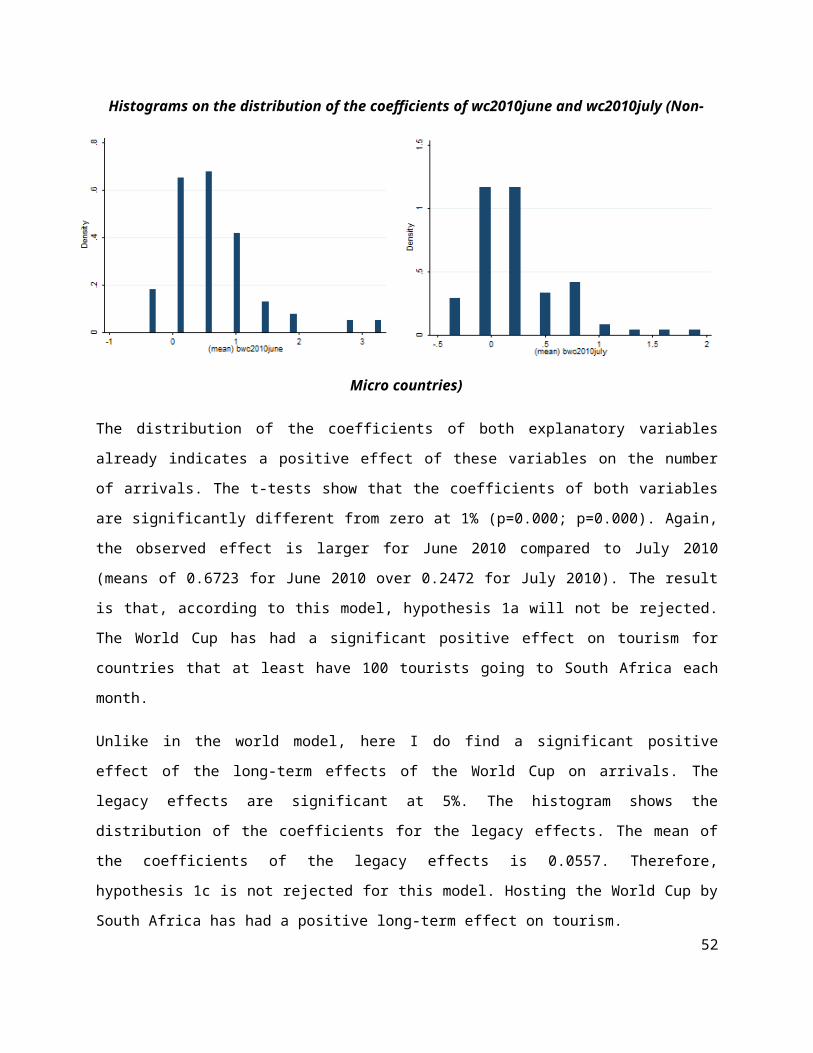
http://www.gt.co.za/files/grant_thornton_updated_2010_economic_impact_210410.pdf
Scannell, K., Aglionby, J., Moore, M., & Garrahan, M. (2015, May 27). US indicts 14 over 'rampant' Fifa corruption. Financial Times , p. 1.
Schipani, A., Aglionby, J., & Moore, M. (2015, June 4). Fifa scandal: Warner accuses Blatter of meddling in Trinidad poll. Financial Times , p. 1.
Solberg, H., & Preuss, H. (2007). Major Sport Events and Long-Term Tourism Impacts. Journal of Sport Management , 213-234.
Spronk, K., & Fourie, J. (2010). South Africa mega-events and their impact on tourism. Stellenbosch Economic Working Papers , 1-38.
Statistics South Arica. (2014). Tourism. Pretoria: Statistics South Africa.
Szymanksi, S. (2002). The Economic Impact of the World Cup. World Economics , 169-177.
Veenhoven, R. (2015, July 23). World Database of Happiness. Retrieved July 23, 2015, from worlddatabaseofhappiness.eur.nl: http://worlddatabaseofhappiness.eur.nl/hap_nat/nat_fp.php?mode=8&ranks=1
World Bank. (2014). GDP (current US$). Retrieved August 2, 2015, from Data World Bank: http://data.worldbank.org/indicator/NY.GDP.MKTP.CD
World Bank. (2015). GDP per capita, PPP (current international $). Retrieved August 1, 2015, from Data World Bank: http://data.worldbank.org/indicator/NY.GDP.PCAP.PP.CD
World Bank. (2015). Official exchange rate (LCU per US$, period average). Retrieved July 20, 2015, from Data World Bank: http://data.worldbank.org/indicator/PA.NUS.FCRF
Appendix
52

Table 1: Scoring Matrix for event classes by Müller (Müller, 2015)
Size Visitor attractiveness Number of tickets sold
Mediated reach
Value of broadcast rights
Cost Total cost
Transformation
Capital Investment
XXL (3 points) > 3 million > $ 2 billion > $ 10 billion > $ 10 billion
XL (2 points) > 1 million > $ 1 billion > $ 5 billion > $ 5 billion
L (1 point) > 0.5 million > $ 0.1 billion > $ 1 billion > $ 1 billion
Table 2: Appointed event classes by final score (Müller, 2015)
Event Class Total Points
Giga-event 11-12 points
Mega-event 7-10 points
Major-event 1-6 points
Table 3: Significance and means of the coefficients (Tourism Model 1: World)
53

Coefficients Mean Significance T-test(p-value)
Explanatory variables wc2010june 0.8075*** 0.000
wc2010july 0.3420*** 0.000
legacy 0.0301 0.3160
constant 1.8524* 0.0765
Seasonality effects t 0.0023** 0.0310
month dummies varies 1%: jan; feb; mar; apr; may; jun; sep5%: jul10%: novInsign.: aug; oct
Economic effects ln_GDP 0.0053** 0.0144
ln_bilateralexports 0.0531* 0.0858
exchangeratelcurand -21.3911 0.5459
Sport event effects anglosport 0.0311 0.2261
confedcup 0.0178* 0.0964
* p < .1, ** p < .05, *** p < .01
54

Table 4: Significance and means of the coefficients (Tourism Model 2: excluding micro)
Coefficients Mean Significance T-test(p-value)
Explanatory variables wc2010june 0.6723*** 0.0000
wc2010july 0.2472*** 0.0000
legacy 0.0557* 0.0257
constant 3.4647* 0.0146
Seasonality effects t 0.0049*** 0.0009
month dummies Varies 1%: jan; feb; apr; may; jun; jul; sep5%: mar;10%: aug;Insign.: oct; nov
Economic effects ln_GDP 0.0048* 0.0781
ln_bilateralexports 0.0094 0.8342
exchangeratelcurand 0.6065 0.9200
Sport event effects anglosport 0.0075 0.7158
confedcup 0.0151* 0.0730
* p < .1, ** p < .05, *** p < .01
55

Table 5: Significance and means of the coefficients (Tourism Model 3: excluding SADC)
Coefficients Mean Significance T-test(p-value)
Explanatory variables wc2010june 0.8652*** 0.0000
wc2010july 0.3699*** 0.0000
legacy 0.0311 0.3342
constant 1.6279 0.1302
Seasonality effects t 0.0013 0.1637
month dummies varies 1%: jan; feb; mar; apr; may; jun5%: jul; sep; novInsign.: aug; oct
Economic effects ln_GDP 0.0050** 0.0273
ln_bilateralexports 0.0759*** 0.0040
exchangeratelcurand -23.1347 0.5459
Sport event effects anglosport 0.0336 0.2239
confedcup 0.0192* 0.0965
* p < .1, ** p < .05, *** p < .01
56
Table 6: Significance and means of the coefficients (Tourism Model 4: excluding micro countries & SADC)
Coefficients Mean Significance T-test (p-value)
Explanatory variables wc2010june 0.7660*** 0.0000
wc2010july 0.2874*** 0.0000
legacy 0.0618** 0.0257
constant 3.4892** 0.0285
Seasonality effects t 0.0032*** 0.0006
month dummies varies 1%: jan; feb; apr; may; jun; jul; sep5%: marInsign.: aug; oct; nov
Economic effects ln_GDP 0.0040 0.1613
ln_bilateralexports 0.0480 0.1385
exchangeratelcurand 0.6865 0.9218
Sport event effects anglosport 0.0086 0.7095
confedcup 0.0175* 0.0730
* p < .1, ** p < .05, *** p < .01
57

Table 7: Results of International Trade model on bilateral exports of South Africa
Random Effect Models World Non-Micro Non-SADC Non-Micro & Non-SADC
ln_bilateralexports ln_bilateralexports ln_bilateralexports ln_bilateralexportswc2010year 0.04677* 0.18858*** 0.17657*** 0.24593***
(0.02840) (0.04113) (0.03848) (0.04575)
legacy_years 0.21061*** 0.24820*** 0.25989*** 0.30211***
(0.03014) (0.04108) (0.03627) (0.04473)
wc2010year_part 0.58717*** 0.48692*** 0.44703*** 0.41197***
(0.04061) (0.03367) (0.04963) (0.03469)
ln_bilateralimports 0.53651*** 0.41960*** 0.55477*** 0.44175***
(0.00593) (0.00927) (0.00862) (0.00924)
ln_gdp -0.00016 -0.00014 -0.00006 -0.00001(0.00013) (0.00013) (0.00012) (0.00014)
exchangeratelcurand 0.00025*** 0.00026*** 0.00026*** 0.00031***
(0.00008) (0.00009) (0.00008) (0.00009)
oecd 0.98623*** 0.87200*** 0.93730*** 0.83276***
(0.06108) (0.07737) (0.05875) (0.07755)
westeurope -0.48541*** -0.64727*** -0.44380*** -0.59567***
(0.07484) (0.08060) (0.07541) (0.08948)
soviet -0.63708*** -1.15263*** -0.61671*** -1.13005***
(0.10189) (0.07063) (0.10370) (0.07383)
anglo 0.34026*** -0.18458* 0.25704*** -0.24936**
(0.08093) (0.10333) (0.08322) (0.10258)
southamerica -0.55413*** -0.98275*** -0.55098*** -0.96394***
(0.11985) (0.09361) (0.12009) (0.10016)
sadc 0.72075*** 1.33210*** - -(0.13112) (0.11310)
africa 0.87085*** 0.60269*** 0.88202*** 0.62291***
(0.10599) (0.08705) (0.10550) (0.08909)
distance -0.00011*** 0.00003*** -0.00011*** 0.00003***
(0.00001) (0.00001) (0.00001) (0.00001)
colonial 1.43163*** 1.74434*** 1.35180*** 1.65274***
(0.06277) (0.05792) (0.06976) (0.06118)
comlanguage 0.11666** 0.24616*** 0.22784*** 0.35470***
(0.05238) (0.05193) (0.06529) (0.05921)
comborder -1.48592** -0.71984* - -(0.58377) (0.37647)
58
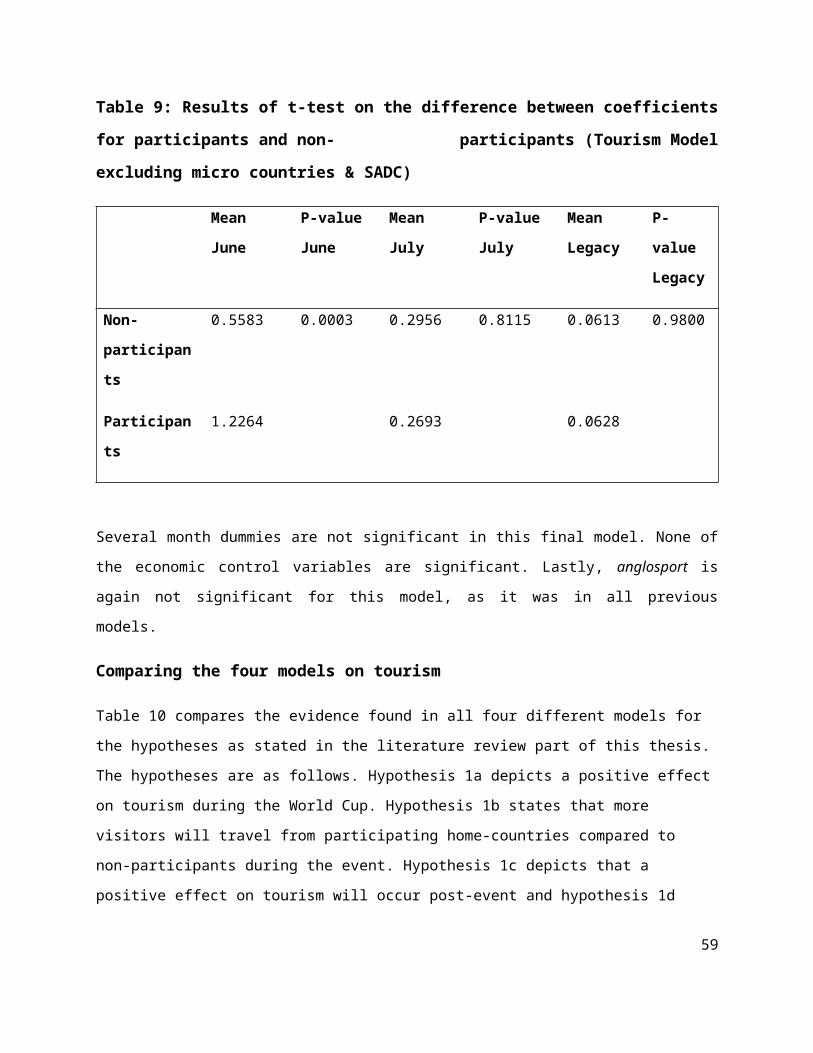
Constant 5.92252*** 6.38884*** 5.66969*** 6.09146***
(0.09282) (0.08645) (0.09629) (0.07114)Observations 1685 1397 1573 1288
Standard errors in parentheses; * p < .1, ** p < .05, *** p < .01Table 8: Results of International Trade model on bilateral imports of South Africa
World Non-Micro Non-SADC Non-Micro & Non-SADC
Random Effects ln_bilateralimports
Fixed Effects ln_bilateralimports
Random Effects ln_bilateralimports
Random Effects ln_bilateralimports
wc2010year 0.07323 - -0.13230** 0.05805(0.07395) (0.05288) (0.04675)
legacy_years 0.04915 - -0.08119* 0.24656***
(0.06494) (0.04685) (0.04980)
wc2010year_part -0.01594 -0.03921 0.08581* 0.02672(0.06978) (0.03038) (0.04560) (0.03735)
ln_bilateralexports 1.04990*** 0.69722*** 1.09918*** 0.77132***
(0.02791) (0.01880) (0.01603) (0.01184)
ln_gdp -0.00028 -0.00002 -0.00039** -0.00019**
(0.00020) (0.00008) (0.00020) (0.00010)
exchangeratelcurand -0.00011 0.00009 -0.00018 0.00004(0.00012) (0.00009) (0.00011) (0.00010)
oecd 0.74904*** 0.53403*** 0.55384*** 0.31105***
(0.10388) (0.11325) (0.07177) (0.10831)
westeurope 0.09727 -0.45812*** 0.10497 -0.40582***
(0.12316) (0.08413) (0.12225) (0.07618)
soviet 0.38580** -0.47868*** 0.43195*** -0.33338***
(0.15472) (0.06679) (0.14853) (0.06922)
anglo 0.58836*** 0.16616* 0.55962*** 0.32931***
(0.13493) (0.08242) (0.12742) (0.07169)
southamerica 0.53714*** -0.43409*** 0.57244*** -0.27632**
(0.14647) (0.10835) (0.15156) (0.12100)
sadc 0.56543** -0.15922 - -(0.26224) (0.18508)
africa -2.10120*** -1.85656*** -2.01707*** -1.68271***
(0.17559) (0.09551) (0.17225) (0.09701)
distance -0.00001 0.00000 0.00001 0.00001**
(0.00001) (0.00001) (0.00001) (0.00001)
colonial -0.96325*** -0.04369 -0.99284*** -0.05251(0.11930) (0.07200) (0.10969) (0.07003)
comlanguage -0.34147*** -0.03653 -0.46393*** -0.35649***
(0.09033) (0.05132) (0.10757) (0.07142)
comborder 0.94945 2.14075*** - -59
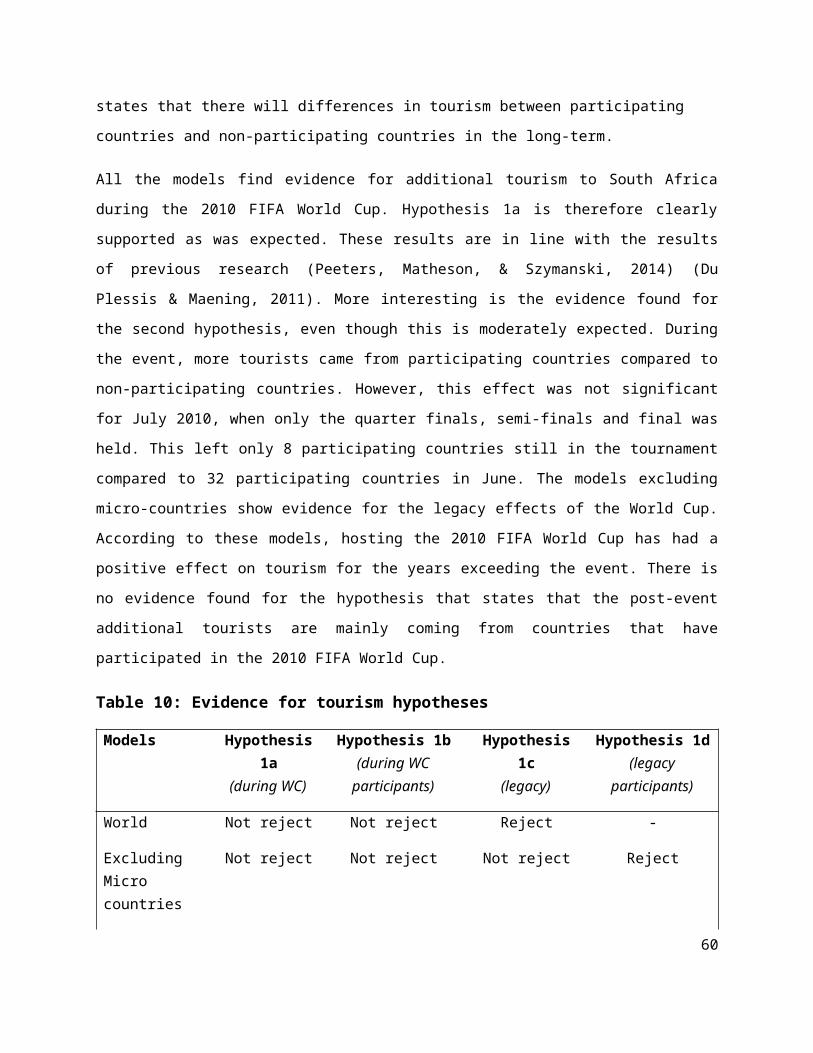
(0.71302) (0.35977)
Constant -1.07843*** 3.75907*** -1.60665*** 2.94764***
(0.36592) (0.21751) (0.26411) (0.15201)Observations 1685 1072 1573 976
Standard errors in parentheses; * p < .1, ** p < .05, *** p < .01
60