Introduction - eml.berkeley.edubhhall/papers/GhoshHaalandHall08_Debian.pdf · five versions of...
23
Ghosh, Haaland, and Hall May 2008 1 Which firms participate in open source software development? A study using data from Debian Rishab Ghosh, 1 Kirsten Haaland, 2 and Bronwyn H Hall 3 May 2008 1. Introduction 4 This paper is currently about facts rather than hypotheses. We are curious to understand which firms participate in Free/Libre/Open Source Software 5 development, and from which sectors they come, by size, region, and industry. To this end, we collected a dataset based on all the signed code in the five versions of Debian from 2.0 to 3.1 (aka hamm, sarge, woody, potato, and slink), which were released during the years 1998-2005. The data included the name of the code contributor (committer 6 ), from which we identified the type of contributor (firm, individual, foundation, etc.). Approximately 1000 firms worldwide contributed to at least one of the five versions. To the data on firm contributions, we added information from Hoovers on the size, region, and industry distribution of firms worldwide. The latter data allow us to present our results on firm participation as probabilities of participation. That is, we can ask questions such as “do SMEs participate more or less given their share in the industry or in the economy?” The raw Debian data from which our data come consists of the names and version numbers of projects, the lines of code contributed by each entity that signed code in those projects, and 1 UNU-MERIT. 2 UNU-MERIT. 3 Corresponding author: UC Berkeley, University of Maastricht, NBER, and IFS, [email protected]. 4 This is a very preliminary draft prepared for the Druid Fundamental on Open Source, to be held in Copenhagen, June 17, 2008. We would like to acknowledge the work done with collecting the raw data by the Libre Software Research Group at Rey Juan Carlos Carlos University on which this paper builds and from which we have benefitted greatly. The third author thanks the Centre for Advanced Studies, Oslo, Norway for hospitality while this draft was being written. 5 In this paper we refer to the single phenomenon known by the various terms “libre software”, “free software” and “open source software” as Free/Libre/Open Source Software (or FLOSS). 6 Anyone can see the source code of FLOSS software, but a smaller group is allowed to modify the code. A committer is someone that belongs to the group allowed to make changes to the code.
Transcript of Introduction - eml.berkeley.edubhhall/papers/GhoshHaalandHall08_Debian.pdf · five versions of...
Ghosh, Haaland, and Hall May 2008
1
Which firms participate in open source software development? A study using data from Debian
Rishab Ghosh,1 Kirsten Haaland,2 and Bronwyn H Hall3 May 2008
1. Introduction4
This paper is currently about facts rather than hypotheses. We are curious to understand which firms
participate in Free/Libre/Open Source Software5 development, and from which sectors they come,
by size, region, and industry. To this end, we collected a dataset based on all the signed code in the
five versions of Debian from 2.0 to 3.1 (aka hamm, sarge, woody, potato, and slink), which were
released during the years 1998-2005. The data included the name of the code contributor
(committer6), from which we identified the type of contributor (firm, individual, foundation, etc.).
Approximately 1000 firms worldwide contributed to at least one of the five versions. To the data on
firm contributions, we added information from Hoovers on the size, region, and industry
distribution of firms worldwide. The latter data allow us to present our results on firm participation
as probabilities of participation. That is, we can ask questions such as “do SMEs participate more or
less given their share in the industry or in the economy?”
The raw Debian data from which our data come consists of the names and version numbers of
projects, the lines of code contributed by each entity that signed code in those projects, and
1 UNU-MERIT.
2 UNU-MERIT.
3 Corresponding author: UC Berkeley, University of Maastricht, NBER, and IFS, [email protected].
4 This is a very preliminary draft prepared for the Druid Fundamental on Open Source, to be held in Copenhagen, June 17, 2008. We would like to acknowledge the work done with collecting the raw data by the Libre Software Research Group at Rey Juan Carlos Carlos University on which this paper builds and from which we have benefitted greatly. The third author thanks the Centre for Advanced Studies, Oslo, Norway for hospitality while this draft was being written.
5 In this paper we refer to the single phenomenon known by the various terms “libre software”, “free software” and “open source software” as Free/Libre/Open Source Software (or FLOSS).
6 Anyone can see the source code of FLOSS software, but a smaller group is allowed to modify the code. A committer is someone that belongs to the group allowed to make changes to the code.
Ghosh, Haaland, and Hall May 2008
2
indications of situations where a code contribution serves for more than one project. Contributors
can be individuals, firms, university groups, or various kinds of open source coalitions. We focus in
this paper on the firms, who account for about 15-20 per cent of contributions. We also give some
overall statistics on the other entities’ contributions in order to place the firms in context.
The paper is organized as follows: we begin with a description of Debian and the projects it
contains. This is followed by a discussion of how the data were constructed and an overview of the
contributor shares in each Debian version. Section 4 contains the heart of our analysis, a detailed
look at the types of firms contribution to Debian, and the pattern of their contributions. Section 5
concludes.
2. The Debian open source database
The following brief description of the Debian repository comes from the Debian website:7
“The Debian Project is an association of individuals who have made common cause
to create a free operating system. This operating system that we have created is called
Debian GNU/Linux, or simply Debian for short.
An operating system is the set of basic programs and utilities that make your
computer run. At the core of an operating system is the kernel. The kernel is the
most fundamental program on the computer and does all the basic housekeeping
and lets you start other programs.
...... Debian GNU/Linux provides more than a pure OS: it comes with over 18733
packages, precompiled software bundled up in a nice format for easy installation on
your machine.
The Debian distribution is a widely used Linux distribution, and it is also the largest distribution of
FLOSS software in terms of number of packages and lines of code (Amor et. al. 2005). Debian is a
7 www.debian.org, accessed March 2008.
Ghosh, Haaland, and Hall May 2008
3
general purpose distribution, and was one of the first Linux distributions when it was released to the
public in 1993.8 Debian supports a larger number of hardware platforms than any other
distributions; including Intel x86, ARM, PPC, Sparc32 and Alpha. Debian is also recognized to be a
stabile and mature distribution, and many other distributions, such as Ubuntu and Knoppix, are
based on Debian.9
In principle anyone can integrate and install their own selection of open source software. However,
to make it all work seamlessly together with respect to the issues of stability, robustness and security
(or simply to make it work at all!), has lead to a preference for installing and using a distribution
where all this has already been done. Most ‘normal users’ do not have special needs, nor the
necessary technical skill to compile their own distribution. Thus Debian provides a good
representation of general purpose open source software, which is the scope of this study. It does not
represent embedded software or specialized software as such, since this type of software is typically
note integrated into a general purpose distribution. There do exist other distributions with a
narrower scope, such as Red Hat Enterprise Linux, which is targeted at business work stations,
servers, and mainframe computers. However, this distribution has a monetary cost, as compared to
Debian which can be downloaded freely from the Internet.
Debian is collated, quality checked and maintained by the Debian Project, currently run by 1290
individuals.10 The international team adapt and package everything into one distribution, develop
tools specific for Debian, and provide and maintain all the infrastructure that makes the Debian
distribution possible. Debian includes the GNU/Linux operating system and a majority of all stable
FLOSS applications and tools, amounting to close to 250 million lines of source code. The
individual packages range a lot in size and scope, from small drivers, to the largest and better known
packages such as the following:
• openoffice.org – office application suite
• kernel-source-2.6.8 – the stabil kernel at the heart of the distribution
8 For a comparison of Linux distributions, see http://en.wikipedia.org/wiki/Comparison_of_Linux_distributions
9 See List of Linux distributions http://en.wikipedia.org/wiki/List_of_Linux_distributions
10 The data has been retrieved from the Debian Developers Database 9 May 2008, available at: http://db.debian.org/
Ghosh, Haaland, and Hall May 2008
4
• mozilla (firefox) – a web browser
• gcc-3.4 – compiler collection
• xfree86 – An X window implementation, including graphics server and basic programs.
• gimp – Image manipulation program
The composition of a distribution changes over time, sometimes multiple versions of the same
package is included, and after a while old packages which were included in an earlier release may be
removed and not supported anymore. Thus, the number of lines of code (SLOC, or source lines of
code) is a stock measure of the total lines of code in a given release. Further, code is often re-used in
different packages in the same release, which is also part of the whole idea of open source. However,
if the code is written once, and used in ten different files, for some of the analysis it is useful to
count this only once, since the effort of writing it is incurred only once. Therefore, it is useful to
look at SLOC counts that have been adjusted for code re-use.
The data on Debian used in this paper was collected by a research group at Universidad Rey Juan
Carlos, Spain. For the methodology and more detail on how the raw data was collected, see Amor et.
al. (2005a), Amor et al (2005b), or refer to their website which is dedicated to collecting information
on Debian releases.11 It is also important to note that the methodology used in this paper for
determining whether a contributor is a firm does not simply identify them as e-mail addresses ending
on .com, because this is not a reliable measure for the identification of commercial actors.12
3. Contributors to Debian
The software packages included in any given Debian distribution are written and contributed by a
variety of actors. The contributions have been grouped into six categories: individual authors, firms,
foundations, development groups, universities and unknown. Only 1.6% of the code is on average
unsigned, meaning most of the code can be traced back to who contributed the code. The incentives
for signing code are well known, including recognition of work and improved job opportunities
11 The website http://libresoft.dat.escet.urjc.es/debian-counting/ collects results and research related to the counting of Debian code.
12 For example, it is impossible to distinguish whether an e-mail address ending with gmail.com actually is a contribution from an employee at Google, or from an individual who has an account there.

Ghosh, Haaland, and Hall May 2008
5
amongst others. It is also important for firms to be recognized for their work, build a reputation,
and interact with the community. A firm would also be interested in claiming ownership of their
copyrights, even though they choose to license it under an open source licence. If a firm spends time
and effort to contribute, it makes sense for them to make sure their efforts are being recognized
(Harhoff et al. 2004). Some firms even have specified guidelines and policies for the employees who
work on FLOSS as part of their job, and require signing of the code so that it is attributed to the
company.
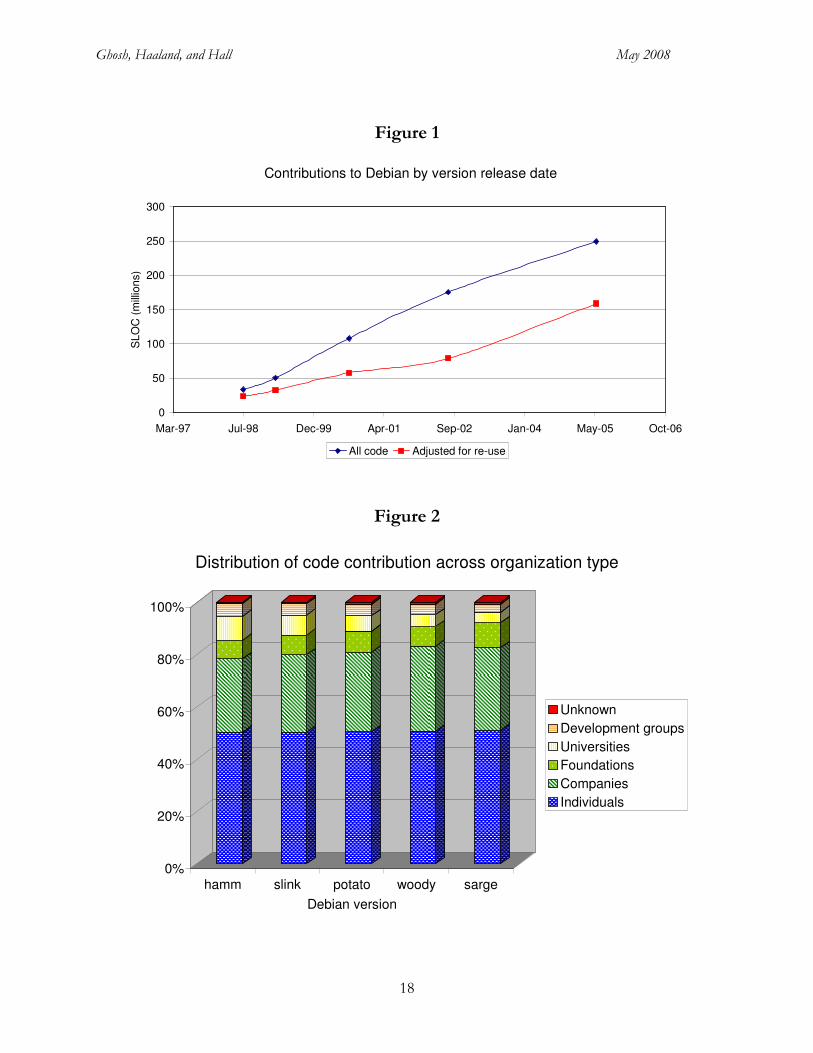
Figure 1 shows the growth in the size of Debian releases over time, both adjusted and not adjusted
for code reuse. Note that the time between releases in the beginning is shorter, around one year,
while later it is around three years. This is a general trend observed in any software project; as the
project grows and matures the time interval between releases increases. Secondly, the overall growth
of the code, within the time span of the data, appears to exhibit linear growth in all the code, while
possibly a bit more exponential growth rate when adjusting for code re-use.
Table 1 contains summary statistics for the five Debian versions considered in this paper, versions
2.0, 2.1, 2.2, 3.0, and 3.1. The top panel shows the total lines of code in each release (SLOC), both
raw and adjusted for code re-use, along with the shares contributed by firms. The bottom panel
shows all the other contributors along with the firms: the largest group are individuals, who
contribute over half the code in each release. Firms are second, and they are followed by universities,
various open source consortia, and foundations. The share of the contributions attributed to firms is
increasing with time, and at a faster rate when adjusting for code re-use, rising from 14 per cent for
version 2.0 to 19 per cent for version 3.1.13
Figure 2 shows the distribution of code contribution by individuals, firms, universities, and other
groups visually. The main changes are the growing role of companies and “foundations” and the
shrinking role of universities and development groups, but overall share are relatively stable between
1998 and 2005.
13 For about two per cent of the SLOC, we were unable to clearly identify the type of contributor and those are shown as “unknown” in the table. This two per cent is in addition to the 1.6 per cent of unsigned code, for a total of 3.6 per cent of code whose contributor type is unknown.

Ghosh, Haaland, and Hall May 2008
6
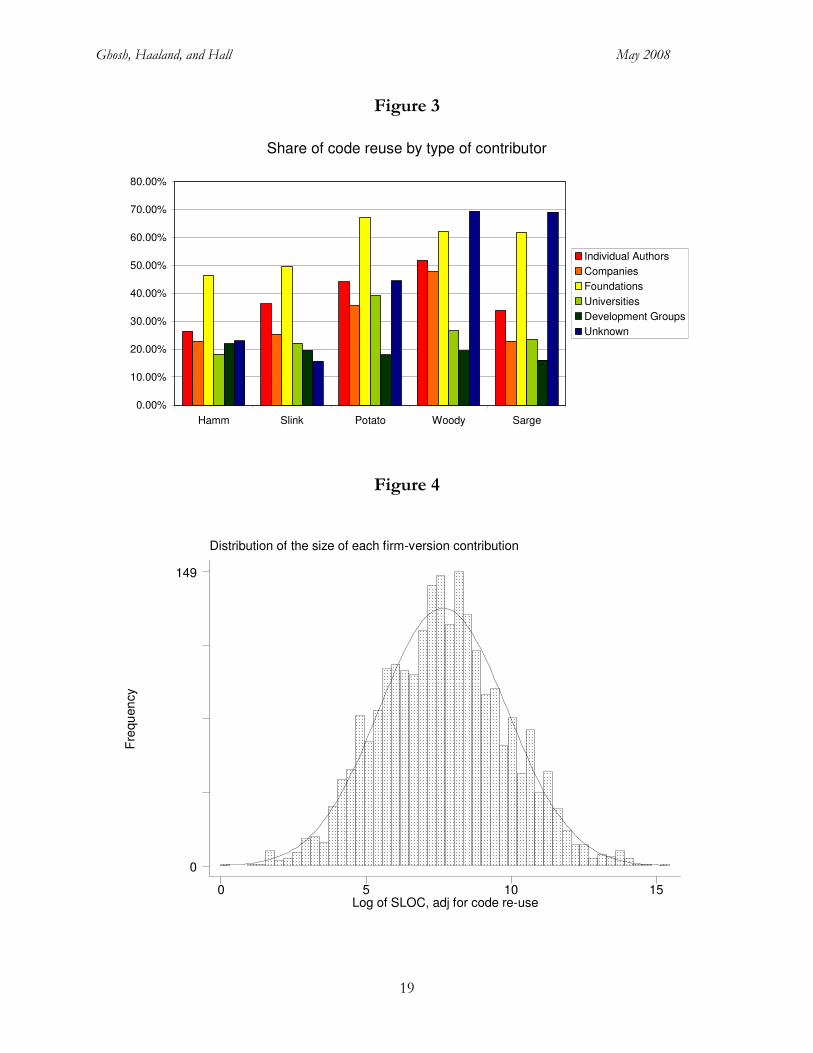
Figure 3 displays the rate of code reuse within the various classifications of contributors, where code
re-use is defined as follows:
_
1_
SLOC nondbl
SLOC total− (0.1)
Re-use by companies is consistently lower than re-use by individuals, and re-use by foundations
consistently much higher. This could mean that the code contributed by firms is of a less general
purpose nature than what foundations supply. As an example, we found a number of cases where a
hardware firm commits the drivers for their hardware. On the other hand, this could also mean that
firms make more original contributions or write new code, whereas individuals are more likely to
rewrite or use what is already there.
Notice that the unknown and unsigned part of the code has a very high degree of reuse, most likely
due to the fact that some basic files have been duplicated and included in many packages. This is
further confirmed when investigating the ratio of duplicate files. Therefore the omission of
unknown and unsigned lines of code from our analysis does not cause any concern.
Our firm data is thus a restricted subset of the total data, and the firms are operating and interacting
in an environment with other actors, other firms and possibly competitors. The further analysis
focuses on the firms, since we are trying to understand the firm involvement and activity. It is
anyway important to keep in mind that the firms are operating in a more diverse overall
environment. We also compared the geographic distribution of project leaders with the geographic
distribution of contributing firms and found important differences; this discussion is deferred until
later in the paper, after the more detailed description of the firm data.
4. Classifying firms contributing to Debian
The goal of this project was to collect information on the size, location, and sector of the firms that
contribute to Debian, starting with only their names (which sometimes give a suggestion of their
location as well). In the case of public firms, we were also able to collect short time series of their
accounting information such as profits, market value, and so forth. As sources for these data, we
used the Hoovers database, Beuro van Dijk’s Amadeus database, and the Compustat S&P annual

Ghosh, Haaland, and Hall May 2008
7
industrial file.14,15 Needless to say, the collection of these data was the most time-consuming part of
the project.
The firms identified in Debian corresponded to 1132 unique stem names, of which about 700 firms
were successfully matched with the Hoovers database.16 The procedure for matching the firms were
as follows: The firm names identified in Debian was manually searched in the online Hoovers
database. If there were multiple entries with any given firm name, or it was at all unclear whether it
was a correct match, additional information was sought from the source code, and the firms were
searched on the web using Google. In most cases, we were able to identify the firm uniquely; the
remainder were tagged as unknown.
The various entries in Hoovers contain different amount/depth of information, depending on the
size of the firms/availability and the sources from which Hoovers compiles the data. The entries are
categorized as comprehensive, in-depth, and basic; most of the records in the database are in-depth.
Comprehensive means that extra financial information is available, which was the case for about
200-300 of the matched firms, typically the larger firms. For North America only there were also
some firms with only basic information that was not downloadable, which meant they were very
small private (micro) firms. Of approximately 15.5 million North American records, only 1.5 million
were downloadable, whereas for Europe, the total number of records available was 1.2 million, all
downloadable. Some North American firms were matched to the non-downloadable data, and 35
European firms were matched with Amadeus but not with Hoovers. Overall this means some
caution is necessary when analyzing the micro firms in the sample.
14 The Amadeus database contains information on approximately 8 million European firms, including a number of small firms.
15 The Hoovers database is a proprietary database containing information on firms of all sizes worldwide, drawn from a variety of sources, including public accounting records and credit-rating agencies. It is available online at http://www.hoovers.com/
16 A stem name is the name of the company standardized and without various tags such as corp, ltd, gmbh, etc. Closer examination of the names revealed some that could be combined and some that were not firms, resulting in a final sample of 982 firms.

Ghosh, Haaland, and Hall May 2008
8
The above procedure matched slightly over half of the firms with Hoovers and about 30 European
micro firms with Amadeus. We then searched the internet using Google for information on the
remaining unmatched firms, about 500 in total. The source code was sometimes consulted for
additional clues and information, and with thorough searching we managed to classify most of the
firms and to re-categorized about 100 of the entries as individuals, development groups, or
foundations. This left only 22 contributors (less than one per cent) unclassified. Considerable
amounts of time were spent cross-checking to ensure that the match was correct, as when matching
the firms with Hoovers. By examing the firms’ websites using Google, we were able to classify the
firms by employment category, industry, and country, and to establish whether a firm had gone out
of business. Very occasionally the web-site indicated the exact number of employees, and sometimes
their NAICS code. Further, it was relatively easy to recognize whether a firm was large or micro.
The most difficult part was to distinguish between small and medium sized firms, and in some
instances between micro and small.
The resulting data consist of 982 firms, for 937 of which we have identified the region, industry, and
size class.17 Unfortunately, due to the way the data have been collected, we are not able to use the
EU definition for size categories18 but instead have used the following:
Number of Employees Firm size category
< 10 Micro
10 to 19 Small (1)
21 to 100 Small (2)
101 to 500 Medium
> 500 Large
However, because in many cases our size coding was fairly approximate (based on incomplete
information from a website), the most reliable categorization is probably coarser: micro/SME/large.
17 41 firms are missing size, 18 are missing sector, and 15 are missing region.
18 SME definition overview available at htp://ec.europa.eu/enterprise/enterprise_policy/sme_definition/index_en.htm
Ghosh, Haaland, and Hall May 2008
9
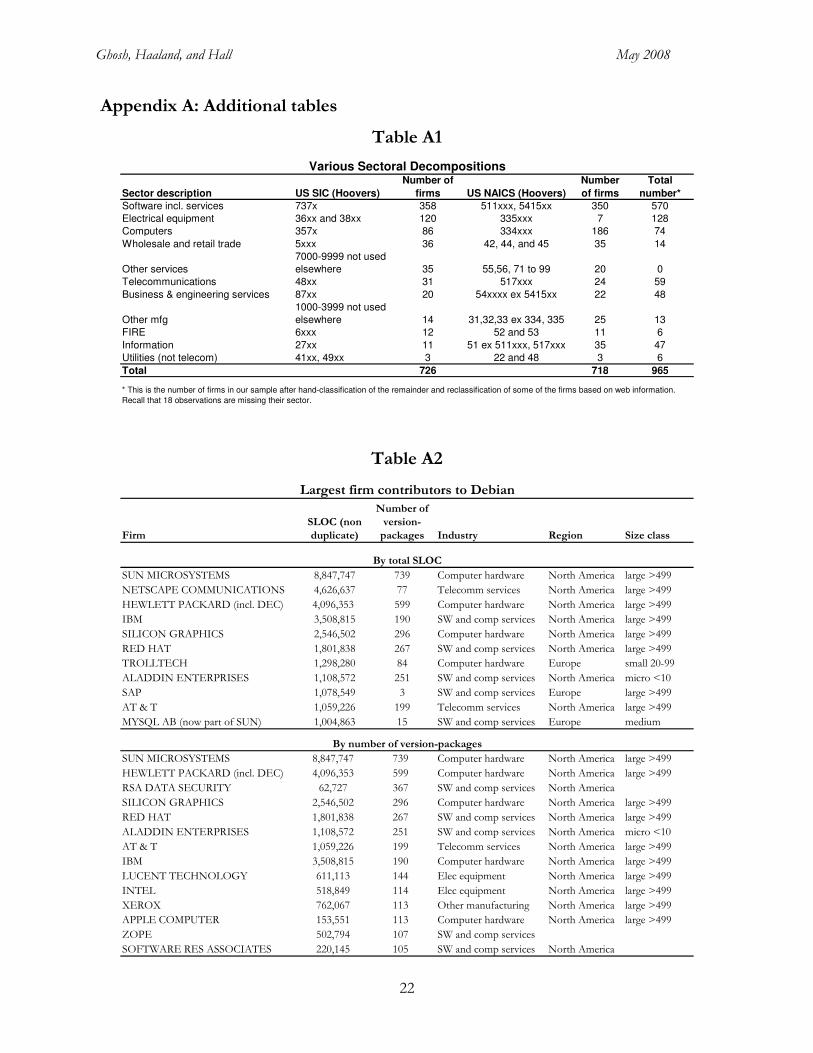
We used the following list of industry categories, of which only the first five make significant
contributions to open source:19
Software
Electrical equipment
Computers
Telecommunications
Information
Wholesale and retail trade
Other services
Telecommunications
Business & engineering services
Other mfg
FIRE
Utilities
Finally, we collapsed the data on geographic (country) location of the firm into six geographical
regions: Africa and the Middle East, Asia, Europe, Latin America, North America, and Oceania
(Australia and New Zealand).
5. The firm data
As discussed above, the top panel of Table 1 shows the total lines of code in each version of
Debian, the amount after adjusting for code re-use, and the share of each contributed by firms, as
identified by us from the signature/copyright notices in the code. Table 2 shows the number of
firms contributing to each version, and the size of their contributions. In general, the average,
median, and maximum size of the contributions has been increasing over time. The single largest
contribution was open office 1.1.3, made by Sun Microsystems (3,394,917 lines of code adjusted for
re-use, to sarge) and the next largest contribution was mozilla M18, from Netscape
Communications (1,567,644 lines of code adjusted for re-use, to potato).20 The difference between
19 See Table A1 in Appendix A for a list of the SIC and NAICS codes that define these sectors.
20 It may seem odd that this contribution did not appear in later versions; however, it was replaced by mozilla_firefox in sarge, which was a somewhat smaller set of code.
Ghosh, Haaland, and Hall May 2008
10
the mean size of a contribution and the median size shows that the distribution of contributions is
very skew. Figure 4 shows that the distribution of the logarithm of contribution size is
approximately normal, which accounts for the skewness.21
Need to describe the collapse of packages
Tables 3a and 3b look at the relationship between firms and package-versions in two ways: Table 3a
shows the number of packages that each firm contributes to and Table 3b shows a distribution of
the number of firms contributing to each package. Both distributions are similarly skew in various
ways: half of the firms contribute to only one package and 7 contribute to more than 100. However,
these 7 account for 37 per cent of the code contributed. They include a number of very large North
American firms, such as Sun, Hewlett-Packard, IBM, Intel, etc. Details are given in Table A2 of
Appendix A.
In Table 3b, we can see that 59 per cent of the package-versions have only one firm contributing,
whereas 3 packages have more than 100 firms contributing. All of these latter packages are a part of
the operating system kernel. Note that the median amount of non-duplicated code contributed by
firms to these 10 package-versions is zero, suggesting that many of them are contributing a small
piece of standardized code in several places, probably code related to their own products.
Next we turn to the question of which type of firm is likely to contribute to Debian. To address this
question, we collected data on the worldwide universe of firms contained in the Hoovers database.
The process of collecting these data is described in Appendix B. For all these firms, we have
information on their geographical location, industry, and size. Tables 4, 5, and 6 present
distributions of the population, the firms in our sample (Debian contributors), the number of
packages to which they contribute, and the total lines of SLOC. Table 4 presents the size
distribution, Table 5 the regional distribution, and Table 6 the industry distribution. Corresponding
to these tables are Figures 5, 6, and 7, which give a visual idea of the distributions.
21 The superimposed curve is a normal distribution with the mean and standard deviation of the underlying data.
Ghosh, Haaland, and Hall May 2008
11
Table 4 and Figure 5 show that although large firms are only about 2 per cent of the population and
20 per cent of our sample, they contribute 65 per cent of the non-duplicate code. This not terribly
surprising result is counterbalanced by the finding that firms with fewer than 10 employees are
disproportionately represented in our sample in comparison to SMEs of all sizes.
Table 5 and Figure 6 show the regional distributions of the same variables, along with the regional
distribution of the Debian project leaders. The striking thing about these numbers is the relative
concentration of project leadership among Europeans, in contrast to the source of the code from
firms, which is largely North American. It is quite likely that this reflects the relative strength of US
firms in the software sector. In a later section of the paper we try to look at whether European
software firms are more likely to contribute, controlling for their far fewer numbers and smaller
sizes. We also note that there is effectively no code contribution from Africa and the Middle East
and Latin America, and we will therefore drop these regions from the subsequent analysis.
Finally Table 6 and Figure 7 show the industry distributions. Not surprisingly, the population looks
entirely different from the sample, being dominated by firms in other manufacturing industries,
wholesale and retail trade, business and engineering services, and FIRE (Financial, Insurnce, and
Real Estate). Only four sectors contribute significant amounts of SLOC to Debian: Software and
computing services, Computer hardware, Electrical equipment, and Telecommunications services.
Together, these sectors account for over 96 per cent of the code contributed by firms to Debian.
In order to control for variations in size and industry distribution across regions (and therefore
different expectations about software production in the various cells), we ran a simple grouped
probability regression of the log share of firms on Debian on a set of dummies for region, industry,
and size. The regression was the following:
0
2 2 2
#log ( ) (sec ) ( )
#
R S Eijk
i j k ijk
i j kijk
DebianD region i D tor j D size k
Hooverα α β γ ε
= = =
= + = + = + = +
∑ ∑ ∑ (2)
Where #Debian and #Hoover mean the number of firms in the ith region, jth sector, and kth size
class on Debian and Hoovers respectively. The left-out dummy categories were North America,
software, and large, which implies that most of the coefficients in the regression should be negative,

Ghosh, Haaland, and Hall May 2008
12
since this was one of the largest categories. The results of this regression are presented in Table 7.
Because the individual cells vary greatly in the number of firms on which they are based, the
disturbance is expected to be very heteroskedastic. Therefore we present both unweighted and
weighted regressions, where the weights are the number of Debian firms or the number of Hoovers
firms. Either one might be expected to be proportional to the precision with which the dependent
variable is measured, and therefore appropriate as a weight.
Table 7 shows that firms in Asia are far less likely to contribute to Debian given their sectoral and
size distributions, whereas firms in Europe are about as likely to contribute as North American
firms. Given the small sample size, we can say little about Oceania. With the exception of electrical
equipment and telecommunications services, all sectors are much less likely to contribute than the
software and computing services sector. It is notable that once we control for firm size, the
computer hardware sector is much less likely to contribute, which was not true in the raw data. The
size results are the least stable across the different weighting schemes, but on the whole large firms
are more likely to contribute than small or medium-sized firms.22
The conclusion from this preliminary investigation is that the contributions are distributed as we
might have expected, with the majority coming from large U.S. computer hardware and software
firms, and a sizable amount from smaller firms in both the U.S. and Europe. An interesting fact was
that North American and European firms had about the same propensity to contribute once we
controlled for the differences in size and industry distributions between the two continents.
6. Conclusions
It is far too soon to draw strong conclusions from this work. Rather, we will use this concluding
section to discuss some more qualitative things we have learned and to suggest where we are going
with these data.
First, some suggestive patterns emerged in our search for these firm on Google, that might indicate
subsequent lines of research. We found a number of hardware-producing firms, such as modem
22 We suspect that some of the instability may be due to our difficulties establishing firm size, especially for non-U.S. firms. A revision of the paper will look more closely at the size question.
Ghosh, Haaland, and Hall May 2008
13
manufacturers that had contributed smaller amounts of code, which suggests that they were ensuring
that their products would work with Linux installations. We also observed a large number of cases
where the code had been contributed by a firm which had been merged or acquired around the same
time (e.g., Dec, which was acquired by Compaq and then Hewlett-Packard). We do not have exact
dates for this sequence at this time, but it seems worth investigating the extent to which firms
offload their code to Debian to avoid having to support it in the future. Is this an exit strategy? 23
As to the immediate future, our next step is to use the data we have obtained on non-contributing
firms to produce a more nuanced analysis of the firms that choose to participate in open source. In
addition, we intend to explore the connectedness of the firms, by looking at which projects they
contribute to and who the other contributors to these projects are. If we are able to identify the
types of software in a reliable way (kernel, drivers, applications, etc), there are a number of
interesting areas that might be explored to give a more complete picture of the commercial portion
of the open source software sector.
23 For an example, see http://www.eudora.com/ Qualcomm Inc., the creator of Eudora, a successful email package, wanted to exit the software support business and is in the process of creating an open source version that works with mozilla software.

Ghosh, Haaland, and Hall May 2008
14
References
Amor, J. J., Robles, G., Gonzalez-Barahona, J. M., 2004, Measuring Woody: The size of Debian 3.0,
available online at: http://arxiv.org/pdf/cs/0506067
Amor, J. J. Robles, G., Gonzalez-Barahona, J. M., Herraiz, I., 2005a, Measuring Libre Software Using
Debian 3.1. (Sarge) as a Case Study: Preliminary results. UPGRADE: The European Journal for
Informatics Professionals, Vol. VI, No 3, pp 13-16. Available online at: http://www.upgrade-
cepis.org/issues/2005/3/up6-3Amor.pdf
Amor, J. J., Robles, G., Gonzalez-Barahona, J. M., Herraiz, I., 2005b, From Pigs to Stripes: A travel
through Debian, available online at: http://herraiz.org/papers/paper_debconf05.pdf
Bessen, J.E., 2002. Open Source Software: Free Provision of Complex Public Goods. Research on
Innovation website.
Blind, K., Edler, J., Nack, R., 2001. Micro- and Macro-economic Implications of the Patentability of
Software Innovations. Intellectual Property Rights in Information Technologies between
Innovation and Competition. Fraunhofer Institute and Max Planck Institute,
Karlsruhe/Munich.
Chiao, B.H.-F., 2003. An Economic Theory of Free and Open Source Software: A Tour from
Lighthouse to Chinese-style Socialism. New York University, New York.
Cohen, W. M. and D. A. Levinthal, 1989. Innovation and Learning: The Two Faces of R&D.
Economic Journal 99, 569-96.
Cole, R.E., Lee, G.K., 2002. THE LINUX Kernel Development: an Evolutionary Model of
Knowledge Creation. Haas School, UC Berkeley, Berkeley.
Dahlander, L., 2007. Penguin in a new suit: a tale of how de novo entrants emerged to harness free
and open source software communities. Industrial and Corporate Change 16, 913-943.
Dalle, J.-M., David, P.A., 2003. The Allocation of Software Development Resources in ‘Open
Source’ Production Mode. Université Paris VI & IMRI-Université Paris Dauphine, Stanford
University & Oxford Internet-Institute.
Ghosh, Haaland, and Hall May 2008
15
Dalle, J.-M., David, P.A., Ghosh, R.A., Steinmueller, W.E., 2004. Advancing Economic Research on
the Free and Open Source Software Mode of Production. In: Wynants M & Cornelis J (eds.)
Building our Digital Future: Future Economic, Social & Cultural Scenarios Based On Open Standards.
Vrjie Universiteit Brussels (VUB) Press, Brussels, Belgium.
David, P.A., Rullani, F., 2006. Microdynamics of Free and Open Source Software Development:
Lurking, laboring and launching new projects on SourceForge. In: SIEPR Discussion Paper
No. 0605, Stanford, CA.
Fosfuri, A., Giarratana, M.S., Luzzi, A., 2005. Firm Assets and Investments in Open Source
Software Products. DRUID Working Paper No. 05-10, Copenhagen, Denmark.
Ghosh, R., et al. 2006. Study on the Economic impact of open source software on innovation and
the competitiveness of the Information and Communication technologies (ICT) sector in
the EU, available online at: http://www.flossimpact.eu
Giuri, P., Ploner, M., Rullani, F., Torrisi, S., 2005. Skills, Division of Labor and Performance in
Collective Inventions: Evidence from Open Source Software. Scuola Superiore Sant'anna
and University of Bologna.
Gonzales-Barahona, J., et. al. 2001, Counting Potatoes: the size of Debian 2.2, available at:
http://people.debian.org/~jgb/debian-counting/counting-potatoes.pdf
Harhoff, D., Henkel, J., von Hippel, E., 2003. Profiting from voluntary information spillovers: How
users benefit by freely revealing their innovations. Research Policy.
Henkel, J., 2004. The Jukebox Mode of Innovation – a Model of Commercial Open Source
Development. LMU, Munich.
Iannacci, F., 2002. The Economics of Open-Source Networks. London School of Economics,
London, UK.
Kogut, B., Metiu, A., 2001. Open Source Software Development and Distributed Innovation. Oxford
Review of Economic Policy 17, 248-264.
Koski, H., 2007. Private-collective software business models: coordination and commercialization
via licensing. The Research Institute of the Finnish Economy (ETLA), Helsinki, Finland.
Kuan, J., 2002. Open Source Software as Lead User’s Make or Buy Decision: A Study of Open and
Closed Source Quality. Stanford University, Stanford, CA.

Ghosh, Haaland, and Hall May 2008
16
Lakhani, K., von Hippel, E., 2000. How Open Source software works:“Free” user-to-user assistance.
MIT, Cambridge, MA.
Lerner, J., Tirole, J., 2002. The Scope of Open Source Licensing. National Bureau of Economic
Research Working Paper, Cambridge, MA.
Lerner, J., Tirole, J., 2002. Some Simple Economics of Open Source. Journal of Industrial Economics L,
197-234.
Lerner, J., Tirole, J., 2004. The Economics of Technology Sharing: Open Source and Beyond.
Harvard Business School, Cambridge, MA.
Myatt, D.P., Wallace, C., 2002. Equilibrium Selection and Public-Good Provision: The Development
of Open Source Software. Oxford Review of Economic Policy 18, 446-461.
Nelson, R.R., 2002. The Market Economy, and the Republic of Science. New York
Nosko, C., Layne-Farrar, A., Swartz, D.G., 2005. Open Source and Proprietary Software: The Search
for a Profitable Middle-Ground. LECG, Chicago, IL.
Nuvolari, A., 2001. Open Source Software Development: Some Historical Perspectives. 2001 ETIC
Conference, Strasbourg.
Polanski, A., 2007. Is the General Public License a Rational Choice? Journal of Industrial Economics LV,
691-715.
Rosenberg, N. 1990. Why Do Companies Do Basic Research with Their Own Money? Research Policy.
Sachewald, F., 2002. Intellectual Property Rights in the Global Digital Economy: Too Weak or Too
Strong? IFRI, Paris.
Sauer, R.M., 2007. Why develop open-source software? The role of non-pecuniary benefits,
monetary rewards, and open-source licence type. Oxford Review of Economic Policy 23, 605-619.
Schankerman, M., Belenzon, S., 2007. Innovation in Open Source Software: The Impact of
Motivation, Reciprocity and Reputation. NBER Lunchtime Productivity Seminar,
Cambridge, MA.
Schmidt, K., Schnitzer, M., 2003. Public Subsidies for Open Source? Some Economic Policy Issues
of the Software Market. CEPR, London.
Ghosh, Haaland, and Hall May 2008
17
Somaya, D., 2001. Incentives, Organizational Choices and Transactional Challenges in Software
Production. University of Maryland, College Park, MD.
Steinmueller, W.E., Foray, D., 2003. On the Economics of R&D and Technological Collaborations -
Insights and Results from the Project Colline. Economics of Innovation and New Technology 12,
77-91.
Tuomi, I., 2004. Industrial Structure and Policy Choice: Notes on the Evolution of Semiconductors
and Open Source. Joint Research Centre, Institute for Prospective Technological Studies,
European Commission, Seville?
von Hippel, E., von Krogh, G., 2003. Open Source Software and the Private-Collective Innovation
Model: Issues for Organization Science. Organization Science, forthcoming.
Ghosh, Haaland, and Hall May 2008
18
Figure 1
Contributions to Debian by version release date
0
50
100
150
200
250
300
Mar-97 Jul-98 Dec-99 Apr-01 Sep-02 Jan-04 May-05 Oct-06
SLO
C (
mill
ion
s)
All code Adjusted for re-use
Figure 2
0%
20%
40%
60%
80%
100%
hamm slink potato woody sarge
Debian version
Distribution of code contribution across organization type
Unknown
Development groups
Universities
Foundations
Companies
Individuals
Ghosh, Haaland, and Hall May 2008
19
Figure 3
Share of code reuse by type of contributor
0.00%
10.00%
20.00%
30.00%
40.00%
50.00%
60.00%
70.00%
80.00%
Hamm Slink Potato Woody Sarge
Individual Authors
Companies
Foundations
Universities
Development Groups
Unknown
Figure 4
Distribution of the size of each firm-version contribution
Fre
qu
en
cy
Log of SLOC, adj for code re-use0 5 10 15
0
149

Ghosh, Haaland, and Hall May 2008
20
Figure 5
Size distribution of firms and contributions
0%
10%
20%
30%
40%
50%
60%
70%
80%
90%
100%
Number of firms on
Hoovers**
Number of sample
firms
Number of package-
versions
Total SLOC
contributions
Large
Medium
Small 21-99
Small 11-20
Micro
Size unknown
Figure 6
Geographic distribution of firms and contributions
0%
10%
20%
30%
40%
50%
60%
70%
80%
90%
100%
Number of project
leaders
Number of firms Number of
package-versions
Total SLOC
contributions
Oceania
North America
Latin America
Europe
Asia
Africa & Middle East
Unknown

Ghosh, Haaland, and Hall May 2008
21
Figure 7
Industry distribution of firms and contributions
0%
10%
20%
30%
40%
50%
60%
70%
80%
90%
100%
Number of firms on
Hoovers**
Number of sample
firms
Number of
package-versions
Total SLOC
contributions
Utilities
FIRE
Trade
Bus&eng services
Information
Other mfg
Elec equip
Telecomm
Computers
Software
Size unknown
Ghosh, Haaland, and Hall May 2008
22
Appendix A: Additional tables
Table A1
Sector description US SIC (Hoovers)
Number of
firms US NAICS (Hoovers)
Number
of firms
Total
number*
Software incl. services 737x 358 511xxx, 5415xx 350 570
Electrical equipment 36xx and 38xx 120 335xxx 7 128
Computers 357x 86 334xxx 186 74
Wholesale and retail trade 5xxx 36 42, 44, and 45 35 14
Other services
7000-9999 not used
elsewhere 35 55,56, 71 to 99 20 0
Telecommunications 48xx 31 517xxx 24 59
Business & engineering services 87xx 20 54xxxx ex 5415xx 22 48
Other mfg
1000-3999 not used
elsewhere 14 31,32,33 ex 334, 335 25 13
FIRE 6xxx 12 52 and 53 11 6
Information 27xx 11 51 ex 511xxx, 517xxx 35 47
Utilities (not telecom) 41xx, 49xx 3 22 and 48 3 6
Total 726 718 965
Various Sectoral Decompositions
* This is the number of firms in our sample after hand-classification of the remainder and reclassification of some of the firms based on web information.
Recall that 18 observations are missing their sector.
Table A2
Firm
SLOC (non
duplicate)
Number of
version-
packages Industry Region Size class
SUN MICROSYSTEMS 8,847,747 739 Computer hardware North America large >499
NETSCAPE COMMUNICATIONS 4,626,637 77 Telecomm services North America large >499
HEWLETT PACKARD (incl. DEC) 4,096,353 599 Computer hardware North America large >499
IBM 3,508,815 190 SW and comp services North America large >499
SILICON GRAPHICS 2,546,502 296 Computer hardware North America large >499
RED HAT 1,801,838 267 SW and comp services North America large >499
TROLLTECH 1,298,280 84 Computer hardware Europe small 20-99
ALADDIN ENTERPRISES 1,108,572 251 SW and comp services North America micro <10
SAP 1,078,549 3 SW and comp services Europe large >499
AT & T 1,059,226 199 Telecomm services North America large >499
MYSQL AB (now part of SUN) 1,004,863 15 SW and comp services Europe medium
SUN MICROSYSTEMS 8,847,747 739 Computer hardware North America large >499
HEWLETT PACKARD (incl. DEC) 4,096,353 599 Computer hardware North America large >499
RSA DATA SECURITY 62,727 367 SW and comp services North America
SILICON GRAPHICS 2,546,502 296 Computer hardware North America large >499
RED HAT 1,801,838 267 SW and comp services North America large >499
ALADDIN ENTERPRISES 1,108,572 251 SW and comp services North America micro <10
AT & T 1,059,226 199 Telecomm services North America large >499
IBM 3,508,815 190 Computer hardware North America large >499
LUCENT TECHNOLOGY 611,113 144 Elec equipment North America large >499
INTEL 518,849 114 Elec equipment North America large >499
XEROX 762,067 113 Other manufacturing North America large >499
APPLE COMPUTER 153,551 113 Computer hardware North America large >499
ZOPE 502,794 107 SW and comp services
SOFTWARE RES ASSOCIATES 220,145 105 SW and comp services North America
By total SLOC
By number of version-packages
Largest firm contributors to Debian
Ghosh, Haaland, and Hall May 2008
23
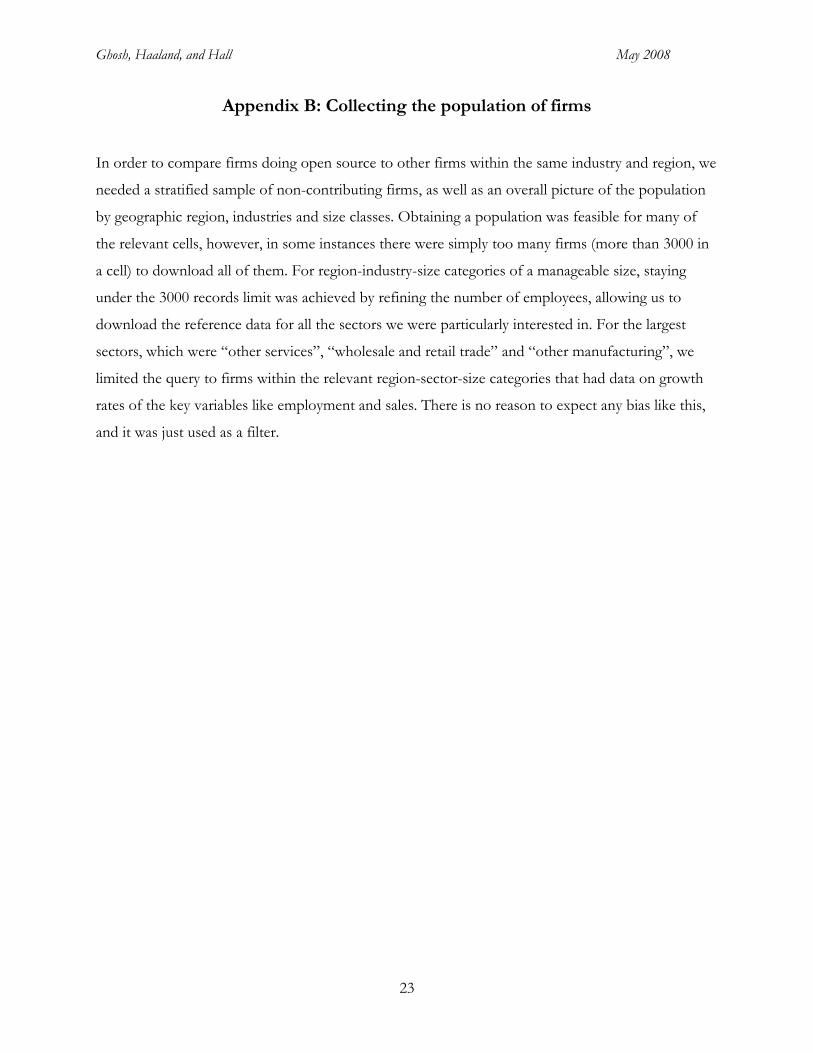
Appendix B: Collecting the population of firms
In order to compare firms doing open source to other firms within the same industry and region, we
needed a stratified sample of non-contributing firms, as well as an overall picture of the population
by geographic region, industries and size classes. Obtaining a population was feasible for many of
the relevant cells, however, in some instances there were simply too many firms (more than 3000 in
a cell) to download all of them. For region-industry-size categories of a manageable size, staying
under the 3000 records limit was achieved by refining the number of employees, allowing us to
download the reference data for all the sectors we were particularly interested in. For the largest
sectors, which were “other services”, “wholesale and retail trade” and “other manufacturing”, we
limited the query to firms within the relevant region-sector-size categories that had data on growth
rates of the key variables like employment and sales. There is no reason to expect any bias like this,
and it was just used as a filter.