Introduction: Aims and scopes
25
Using the ONS Longitudinal Study and the 1958 British Birth Cohort Study to research occupational sex segregation in the 1990s Dr. Daniel Guinea-Martin, CSIC (formerly at ONS) Uptap Conference, March 2008 University of Leeds
-
Upload
heather-mendoza -
Category
Documents
-
view
49 -
download
0
description
Using the ONS Longitudinal Study and the 1958 British Birth Cohort Study to research occupational sex segregation in the 1990s Dr. Daniel Guinea-Martin, CSIC (formerly at ONS) Uptap Conference, March 2008 University of Leeds. Introduction: Aims and scopes. Methodological aims: - PowerPoint PPT Presentation
Transcript of Introduction: Aims and scopes

Using the ONS Longitudinal Study and the 1958 British Birth Cohort Study to research occupational sex segregation in the 1990s
Dr. Daniel Guinea-Martin, CSIC (formerly at ONS)
Uptap Conference, March 2008University of Leeds

Introduction: Aims and scopes
• Methodological aims:
– To assess the effect of attrition on representativenes
– To assess ‘founding’ assumption
• Substantive scope: To study occupational sex segregation / occupational mobility in the 1990s
Occupational sex segregation
• The tendency for different groups in the population (women and men, ethnic groups, full- and part-timers) to work in different occupations from each other across the entire spectrum of occupations under analysis
(Blackburn and Jarman 2005: 2)
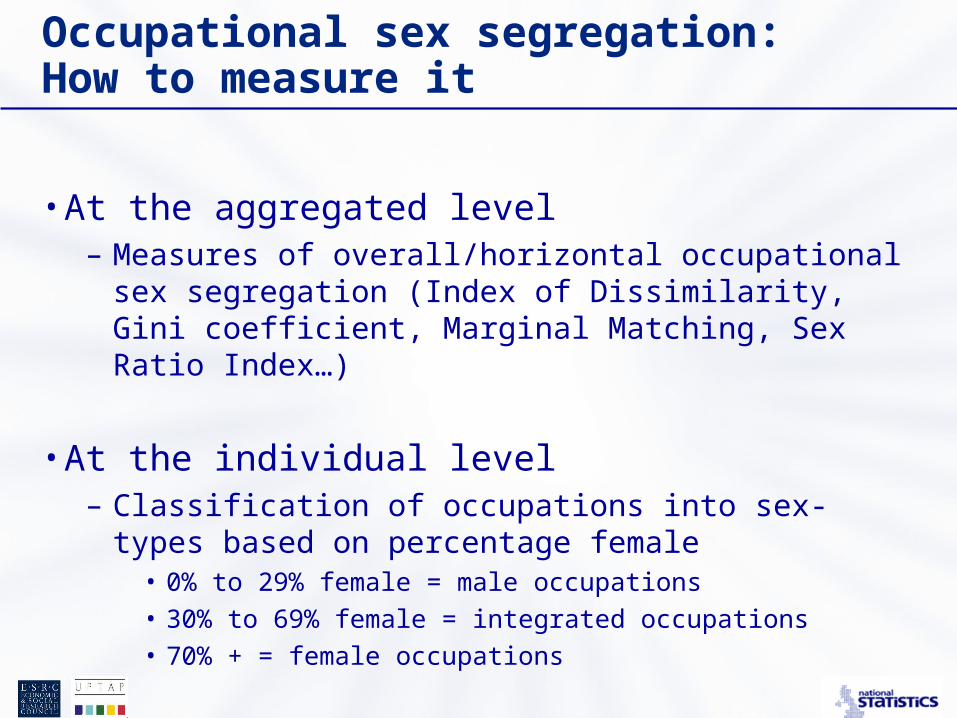
Occupational sex segregation: How to measure it
• At the aggregated level – Measures of overall/horizontal occupational sex
segregation (Index of Dissimilarity, Gini coefficient, Marginal Matching, Sex Ratio Index…)
• At the individual level– Classification of occupations into sex-types based on
percentage female• 0% to 29% female = male occupations• 30% to 69% female = integrated occupations• 70% + = female occupations

Making the LS and NCDS data comparable
• Understanding characteristics and extent of attrition
• Drawing a cohort born in the late 50s from the LS
• Comparing statistics
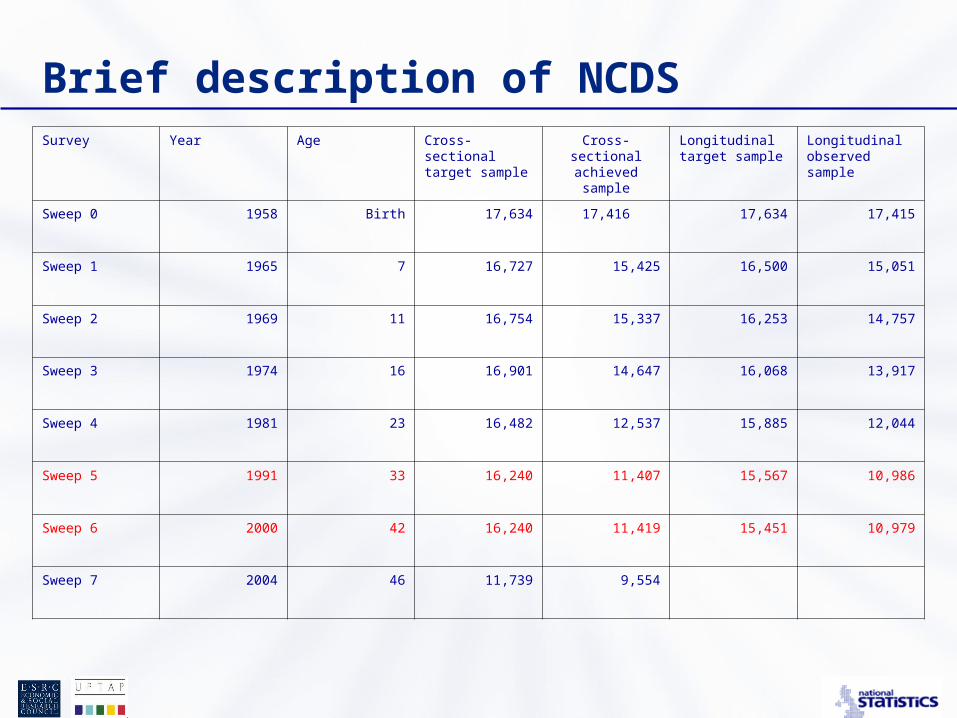
Brief description of NCDSSurvey Year Age Cross-sectional
target sampleCross-sectional achieved sample
Longitudinal target sample
Longitudinal observed sample
Sweep 0 1958 Birth 17,634 17,416 17,634 17,415
Sweep 1 1965 7 16,727 15,425 16,500 15,051
Sweep 2 1969 11 16,754 15,337 16,253 14,757
Sweep 3 1974 16 16,901 14,647 16,068 13,917
Sweep 4 1981 23 16,482 12,537 15,885 12,044
Sweep 5 1991 33 16,240 11,407 15,567 10,986
Sweep 6 2000 42 16,240 11,419 15,451 10,979
Sweep 7 2004 46 11,739 9,554
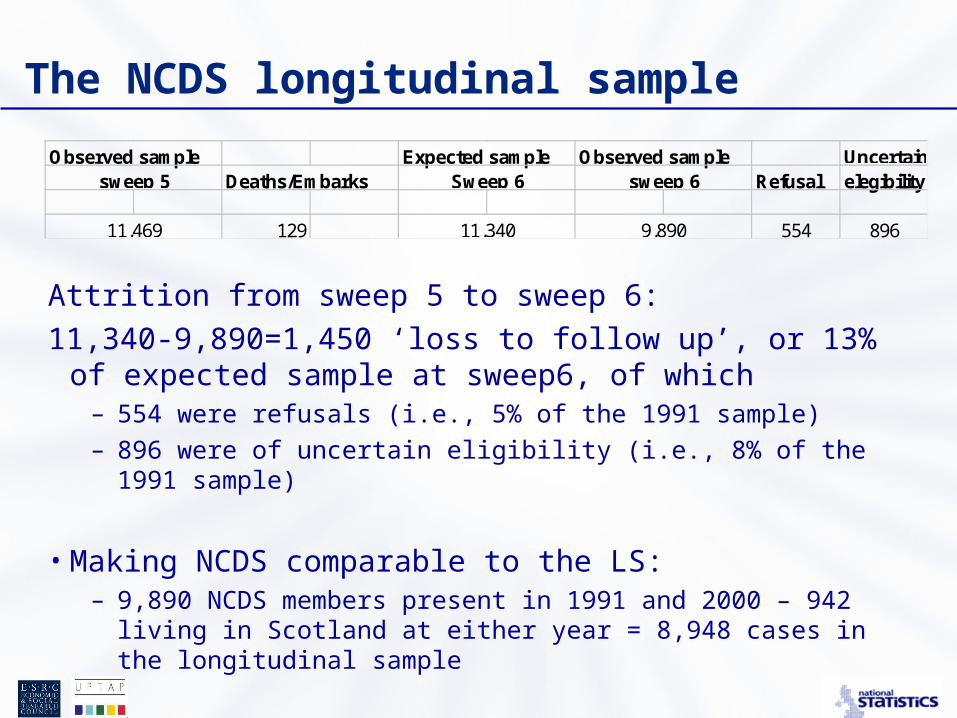
Observed sample Expected sample Observed sample Uncertain Deaths/Embarks Refusal elegibility
129 554 896
sweep 5
11,469
Sweep 6
11,340
sweep 6
9,890
Attrition from sweep 5 to sweep 6:
11,340-9,890=1,450 ‘loss to follow up’, or 13% of expected sample at sweep6, of which
– 554 were refusals (i.e., 5% of the 1991 sample)– 896 were of uncertain eligibility (i.e., 8% of the 1991 sample)
• Making NCDS comparable to the LS:– 9,890 NCDS members present in 1991 and 2000 – 942 living in
Scotland at either year = 8,948 cases in the longitudinal sample
The NCDS longitudinal sample
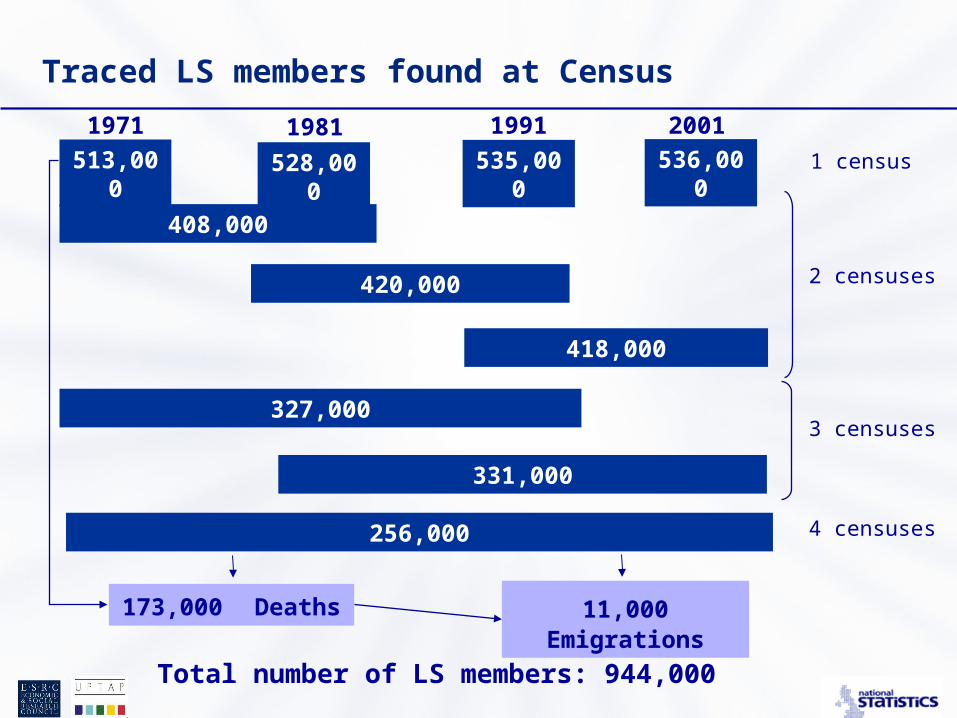
Traced LS members found at Census
536,000528,000 535,000513,000
1971 20011981 1991
256,000
408,000
420,000
418,000
327,000
331,000
173,000 Deaths 11,000 Emigrations
Total number of LS members: 944,000
1 census
2 censuses
3 censuses
4 censuses

LS-based cohort
• LS cohort (excluding people who immigrated to England and Wales aged 16 or older):
– LS members born in 1957/58/59 (LS50s): 18,878
• ‘Loss-to-follow-up’ in LS50s: 11% from 1991 to 2001 (2,343 individuals) vs. 13% in the NCDS from 1991 to 2000
• But by 2000 the NCDS cohort had suffered attrition across 6 time points and the 2000 sample retained 66% of the original 1958 sample
• Instead, the LS50s sample in 2001 contains 89% per cent of the original 1991 sample
• Also, ‘refusal’ is not a cause for loss to follow up in the LS

Economic activity 1991
Graph 1: Economic activity. A comparison of the NCDS and the LS50s cohorts (1991)
0.7
0.3
1.5
0.4
0.7
0.6
2.0
0.6
0.9
0.8
0.7
1.8
74.9
16.3
5.1
71.6
16.0
7.4
32.5
28.9
7.2
1.7
27.2
30.4
26.7
4.7
2.9
32.1
0.0 10.0 20.0 30.0 40.0 50.0 60.0 70.0 80.0 90.0 100.0
Full time
Part time
Self empl.
Unempl.
Student
Sick
Housewife
NCDS men (n=4326) LS50s men (n=9201) NCDS women (n=4613) LS50s women (n=9672)

Academic qualifications 1991-2000/1
Graph 3: Percertage of NCDS and LS50s members with academic qualifications (1991-2000/1)
20.8
16.0
16.6
14.8
20.5
13.5
13.9
9.9
0.0 5.0 10.0 15.0 20.0 25.0
1991
2000/1
NCDS men LS50s men NCDS women LS50s women

Economic activity in 1991 and 2000/1
NCDS men LS50s men NCDS women
LS50s women
col % n col % n col % n col % n Work- work
87.5 3,765 82.6 7,144 59.4 2,736 53.8 4,898
Work- not in work
4.6 198 6.3 544 9.5 435 8.7 789
Not in work-work
4.5 194 5.9 513 20.6 949 22.8 2,078
Not in work-not in work
3.3 133 5.2 452 10.5 461 14.6 1,330
Total 4,290 8,653 4,581 9,095
Sources: Authors’ analysis: ONS Longitudinal Study and NCDS
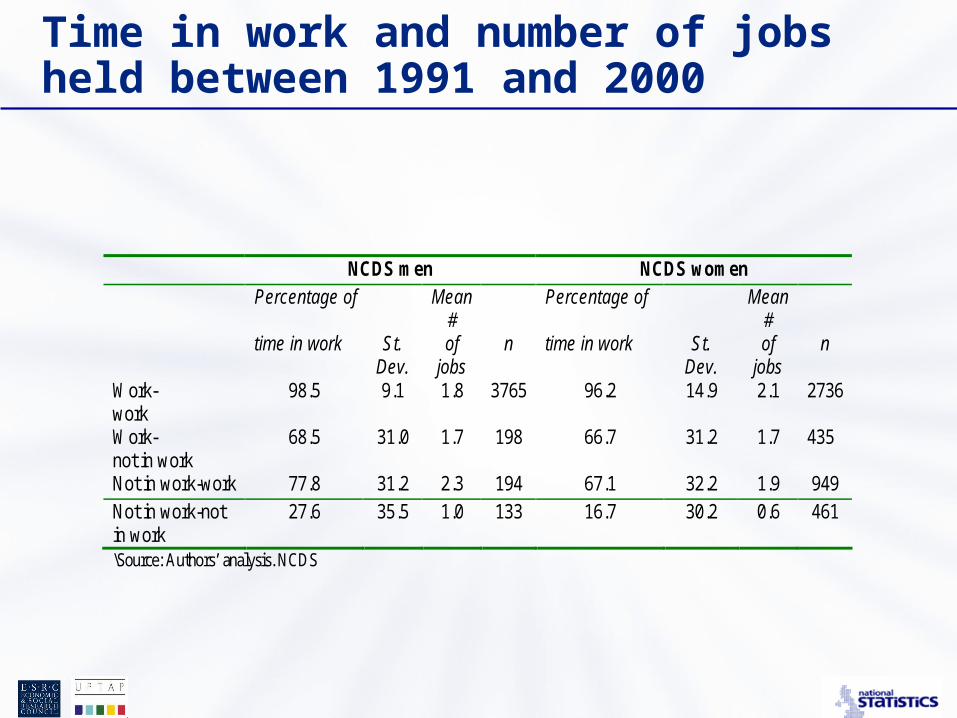
Time in work and number of jobs held between 1991 and 2000
NCDS men NCDS women Percentage of Mean
# Percentage of Mean
#
time in work St. Dev.
of jobs
n time in work St. Dev.
of jobs
n
Work- work
98.5 9.1 1.8 3765 96.2 14.9 2.1 2736
Work- not in work
68.5 31.0 1.7 198 66.7 31.2 1.7 435
Not in work-work 77.8 31.2 2.3 194 67.1 32.2 1.9 949 Not in work-not in work
27.6 35.5 1.0 133 16.7 30.2 0.6 461
\Source: Authors’ analysis. NCDS
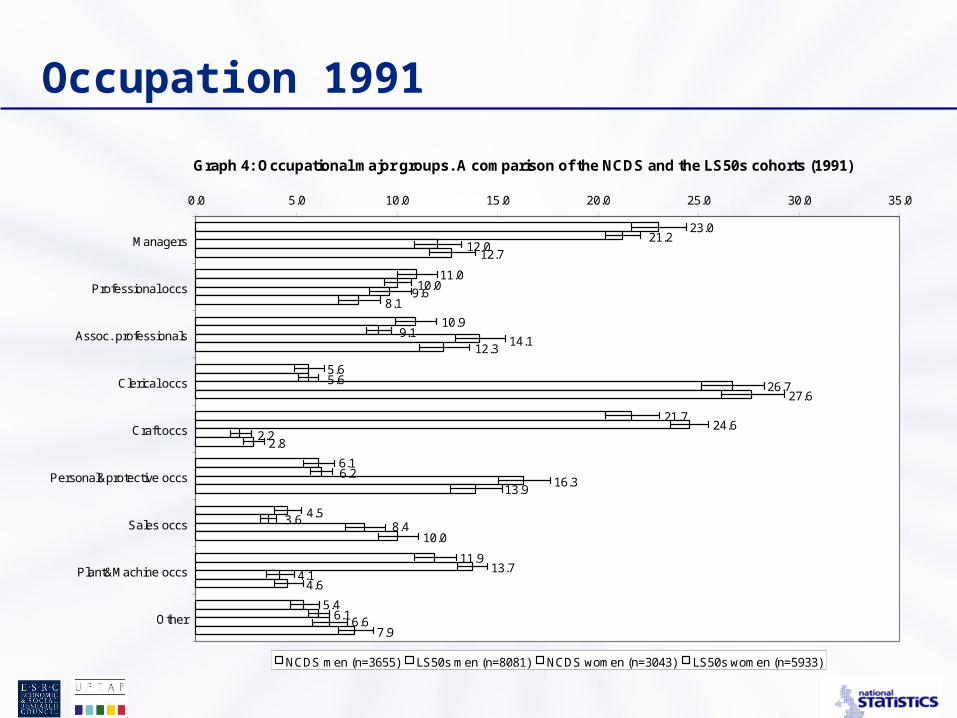
Occupation 1991
Graph 4: Occupational major groups. A comparison of the NCDS and the LS50s cohorts (1991)
5.4
11.9
4.5
6.1
21.7
5.6
10.9
11.0
23.0
6.1
13.7
3.6
6.2
24.6
5.6
9.1
10.0
21.2
6.6
4.1
8.4
16.3
2.2
26.7
14.1
9.6
12.0
7.9
4.6
10.0
13.9
2.8
27.6
12.3
8.1
12.7
0.0 5.0 10.0 15.0 20.0 25.0 30.0 35.0
Managers
Professional occs
Assoc. professionals
Clerical occs
Craft occs
Personal&protective occs
Sales occs
Plant&Machine occs
Other
NCDS men (n=3655) LS50s men (n=8081) NCDS women (n=3043) LS50s women (n=5933)
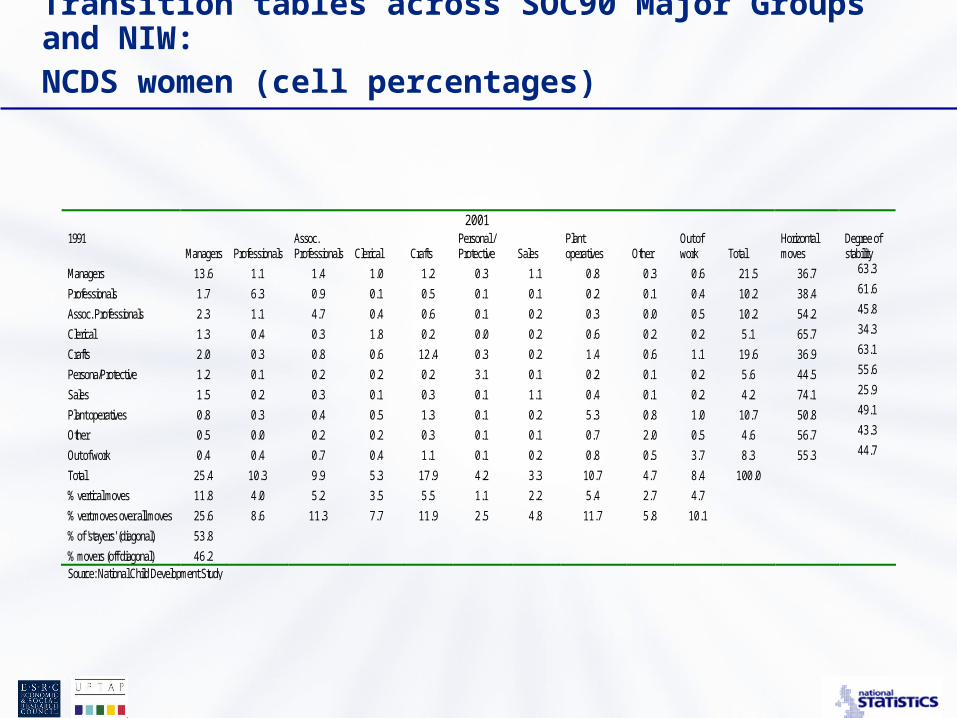
Transition tables across SOC90 Major Groups and NIW:NCDS women (cell percentages)
2001 1991
Managers Professionals Assoc. Professionals Clerical Crafts
Personal / Protective Sales
Plant operatives Other
Out of work Total
Horizontal moves
Degree of stability
Managers 13.6 1.1 1.4 1.0 1.2 0.3 1.1 0.8 0.3 0.6 21.5 36.7 63.3
Professionals 1.7 6.3 0.9 0.1 0.5 0.1 0.1 0.2 0.1 0.4 10.2 38.4 61.6
Assoc. Professionals 2.3 1.1 4.7 0.4 0.6 0.1 0.2 0.3 0.0 0.5 10.2 54.2 45.8
Clerical 1.3 0.4 0.3 1.8 0.2 0.0 0.2 0.6 0.2 0.2 5.1 65.7 34.3
Crafts 2.0 0.3 0.8 0.6 12.4 0.3 0.2 1.4 0.6 1.1 19.6 36.9 63.1
Persona/Protective 1.2 0.1 0.2 0.2 0.2 3.1 0.1 0.2 0.1 0.2 5.6 44.5 55.6
Sales 1.5 0.2 0.3 0.1 0.3 0.1 1.1 0.4 0.1 0.2 4.2 74.1 25.9
Plant operatives 0.8 0.3 0.4 0.5 1.3 0.1 0.2 5.3 0.8 1.0 10.7 50.8 49.1
Other 0.5 0.0 0.2 0.2 0.3 0.1 0.1 0.7 2.0 0.5 4.6 56.7 43.3
Out of work 0.4 0.4 0.7 0.4 1.1 0.1 0.2 0.8 0.5 3.7 8.3 55.3 44.7
Total 25.4 10.3 9.9 5.3 17.9 4.2 3.3 10.7 4.7 8.4 100.0
% vertical moves 11.8 4.0 5.2 3.5 5.5 1.1 2.2 5.4 2.7 4.7
% vert.moves over all moves 25.6 8.6 11.3 7.7 11.9 2.5 4.8 11.7 5.8 10.1
% of 'stayers' (diagonal) 53.8
% movers (off diagonal) 46.2 Source: National Child Development Study

Loglinear modelling of transition tables (men)
Models G2 DF P 1) Main effects 13825.77 180 0 [O] [D] [S] 2) Cond. Independence 207.1784 99 0 [O D] [S] 4) All 2-way 118.6197 81 0.003 [O D] [O S] [D S] 5) Saturated model 0 0 1 [O D S]
Notation: O = Origin (9 SOC90 major groups + not in work) D = Destination (9 SOC90 major groups + not in work) S = Data source (LS50s/NCDS)

Transitions with greatest effect in the lack of fit of Model 2 (St.Residual>=|1.96|)
Transitions with more NCDS menand fewer LS50s men than expected
Transitions with more NCDS womenand fewer LS50s women than expected
Managers to Managers Professionals to Professionals
Associated Professionals to Associated Professionals
Associated Professionals to Associated Professionals
Personal to Personal
Transitions with fewer NCDS men Transitions with fewer NCDS womenand more LS50s women than expected
None
and more LS50s men than expected
Non-work to:
Personal
Nonwork
Notes: Only transitions with n>=50 in each dataset are includedSources: Authors’ analysis. ONS Longitudinal Study and NCDS
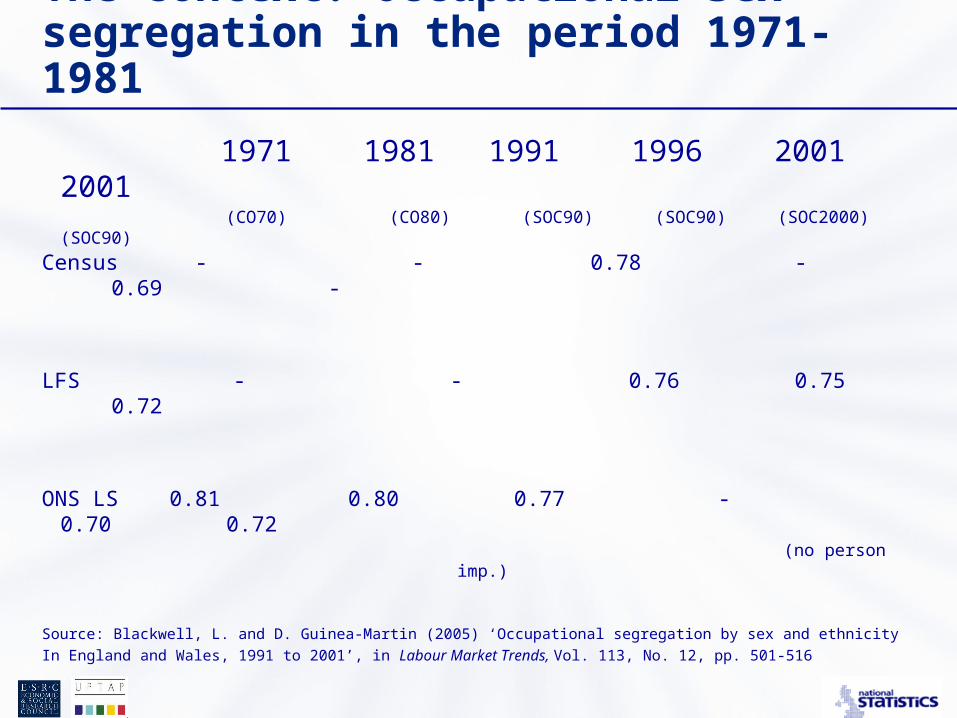
The context: Occupational sex segregation in the period 1971-1981
1971 1981 1991 1996 2001 2001 (CO70) (CO80) (SOC90) (SOC90) (SOC2000) (SOC90)
Census - - 0.78 - 0.69 -
LFS - - 0.76 0.75 0.72
ONS LS 0.81 0.80 0.77 - 0.70 0.72 (no person imp.)
Source: Blackwell, L. and D. Guinea-Martin (2005) ‘Occupational segregation by sex and ethnicity
In England and Wales, 1991 to 2001’, in Labour Market Trends, Vol. 113, No. 12, pp. 501-516

Occupational sex segregation in the NCDS & LS50s
1991 2000/1
Gini ID Gini ID Change
Gini Change
ID
NCDS 0.78
(0.76-0.79) 0.61
(0.59-0.63) 0.77
(0.76-0.79) 0.60
(0.58-0.62) -0.01 -0.01
LS50s 0.76
(0.75-0.77) 0.60
(0.58-0.61) 0.75
(0.74-0.76) 0.58
(0.57-0.59) -0.01 -0.02
Notes: Indices based on the 77 minor groups of SOC90, but coefficients standardized to 200 occupations (using the formulae presented in Blackburn and Jarman, 2005) Sources: Authors’ analysis. ONS Longitudinal Study and NCDS
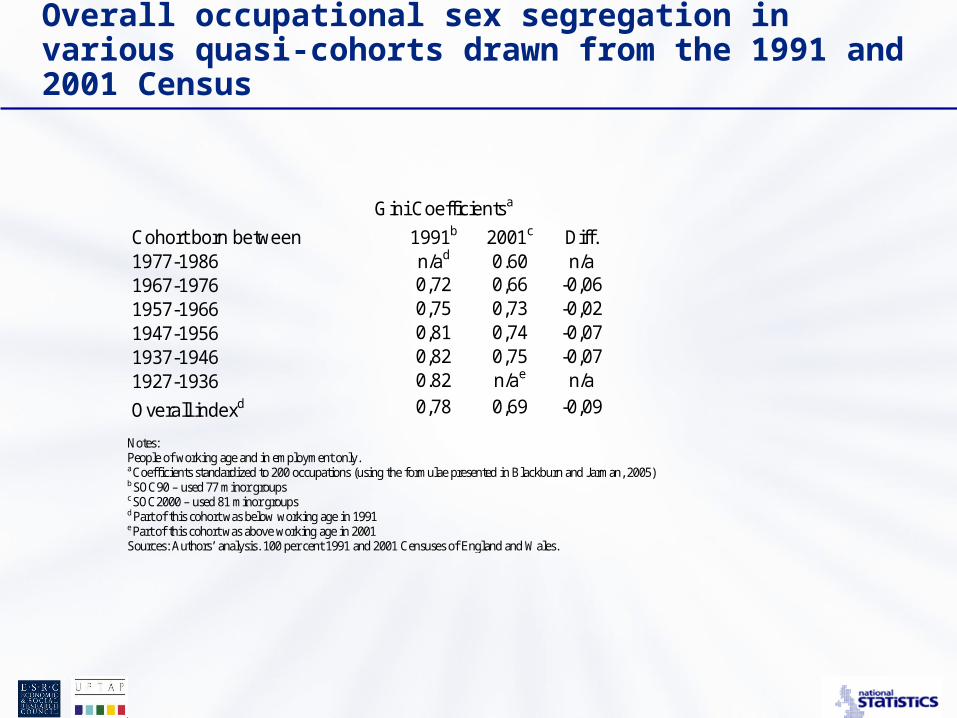
Overall occupational sex segregation in various quasi-cohorts drawn from the 1991 and 2001 Census
Gini Coefficientsa
Cohort born between 1991b 2001c Diff. 1977-1986 n/ad 0.60 n/a 1967-1976 0,72 0,66 -0,06 1957-1966 0,75 0,73 -0,02 1947-1956 0,81 0,74 -0,07 1937-1946 0,82 0,75 -0,07 1927-1936 0.82 n/ae n/a
Overall indexd 0,78 0,69 -0,09 Notes: People of working age and in employment only. a Coefficients standardized to 200 occupations (using the formulae presented in Blackburn and Jarman, 2005) b SOC90 – used 77 minor groups c SOC2000 – used 81 minor groups d Part of this cohort was below working age in 1991 e Part of this cohort was above working age in 2001 Sources: Authors’ analysis. 100 per cent 1991 and 2001 Censuses of England and Wales.

Occupational movers and stayers
NCDS LS50s Men Women All Men Women All
Mover 62.9 69.0 65.5 60.8 67.5 63.5 Stayer 37.1 31.0 34.5 39.2 32.5 36.5 Total 100 100 100 100 100 100
Notes: People of working age and in employment only. Sources: Authors’ analysis. ONS Longitudinal Study and NCDS.

Transitions across sex-typed occupations (occupational movers only)
Male transitions across sex-typed occupations (cell percentages)
NCDS LS50s 2001 sex types 2001 sex types
1991 Sex types Male Integrated Female Total Male Integrated Female Total Male 51.9 13.3 3.3 68.5 55.5 12.0 4.1 71.6 Integrated 13.6 8.1 2.3 23.9 11.6 6.6 2.3 20.5 Female 3.5 2.9 1.2 7.6 3.8 2.8 1.4 7.9 Total 68.9 24.3 6.8 100 70.8 21.4 7.8 100 Notes: Data based on occupational movers in employment both years only. Occupations classified into sex-types on the basis of one lookup table with percentage female derived from one 10 per cent sample of the 1991 Census (Hakim 1998). Sources: Authors’ analysis. ONS Longitudinal Study and NCDS
Female transition across sex-typed occupations (cell percentages)
NCDS LS50s 2001 sex types 2001 sex types
1991 Sex types Male Integrated Female Total Male Integrated Female Total Male 3.3 4.2 4.4 11.8 4.8 4.3 4.7 13.9 Integrated 3.7 11.2 13.6 28.5 4.9 9.0 13.3 27.1 Female 5.5 15.8 38.4 59.7 7.4 14.9 36.7 59.0 Total 12.6 31.1 56.3 100 17.1 28.2 54.7 100 Notes: Data based on occupational movers in employment both years only. Occupations classified into sex-types on the basis of one lookup table with percentage female derived from one 10 per cent sample of the 1991 Census (Hakim 1998).

All female transitions across sex-typed occupations and non-work
Notes: All members of the LS50s longitudinal sample (1991-2001) included. Occupations classified into sex-types on the basis of one lookup table with percentage female derived from one 10 per cent sample of the 1991 Census (Hakim 1998). Sources: Authors’ analysis. ONS Longitudinal Study and NCDS
Female transitions across sex-typed occupations and non-work (cell percentages)
NCDS LS50s
2001 sex types 2001 sex types
1991 Sex types Male Integrated Female Nonwork Total Marginal diff. Male Integrated Female Nonwork Total Marginal
diff. Male 3.1 1.7 1.7 1.3 7.8 0.4 3.4 1.6 1.7 1.1 7.8 2.0 Integrated 1.5 8.9 5.4 2.4 18.2 3.7 1.8 7.4 4.8 2.4 16.3 2.5 Female 2.2 6.3 27.9 5.6 42.0 7.7 2.7 5.4 25.0 5.2 38.3 9.8 Nonwork 1.4 5.0 14.7 10.8 31.9 -11.8 1.9 4.5 16.5 14.7 37.7 -14.2 Total 8.2 21.9 49.7 20.1 100 9.7 18.9 48.0 23.4 100
Notes: All members of the LS50s longitudinal sample (1991-2001) included. Occupations classified into sex-types on the basis of one lookup table with percentage female derived from one 10 per cent sample of the 1991 Census (Hakim 1998). Sources: Authors’ analysis. ONS Longitudinal Study and NCDS
Male transitions across sex-typed occupations and non-work (cell percentages)
NCDS LS50s
2001 sex types 2001 sex types
1991 Sex types Male Integrated Female Nonwork Total Marginal diff. Male Integrated Female Nonwork Total Marginal
diff. Male 53.9 7.1 1.8 3.5 66.3 -0.1 52.9 6.0 2.1 4.5 65.4 -0.7 Integrated 7.3 10.4 1.2 0.8 19.7 0.2 5.8 8.9 1.1 1.3 17.1 0.2 Female 1.8 1.6 2.2 0.3 5.9 -0.2 1.9 1.4 2.6 0.5 6.4 0.1 Nonwork 3.3 0.8 0.6 3.5 8.1 0.0 4.2 1.1 0.7 5.3 11.2 0.4 Total 66.2 19.9 5.7 8.2 100 64.7 17.3 6.5 11.5 100
Conclusions - Methodological findings
• NCDS and LS50s largely similar BUT• But attrition means that the NCDS sample for 1991-2000
slightly over-represents members with higher educational attainments.
• However, the percentage of individuals who remained in the same occ. group is very similar.
• Also similar results in terms of occ. segregation: the slight decline for this cohort is due to the move of women in continuous employment towards sex-atypical occupations.
• Future work will use NCDS employment histories to look at individuals’ stability and transitions in sex-typed occupations depending on:
– The sex-type of occupations– Individuals’ characteristics (sex, education, marital status, children,
etc.) – The characteristics of individuals’ careers: continuous,interrupted…