Introduction 6.2 Methodology 6.2.1 Statistical Analysis 6.2.2 Financial Analysis...
55
166 6 : Capital Budgeting and Selected Variables 6.1 Introduction 6.2 Methodology 6.2.1 Statistical Analysis 6.2.2 Financial Analysis 6.3 Conclusion
Transcript of Introduction 6.2 Methodology 6.2.1 Statistical Analysis 6.2.2 Financial Analysis...

166
6 : Capita l Budget ing and Selected Variables
6.1
Introduction
6.2 Methodology
6.2.1 Statistical Analysis
6.2.2 Financial Analysis
6.3 Conclusion
167
Chapter 6 : Capital Budgeting and Selected Variables
6.1 Introduction:
The objective of the data analysis of the companies hereafter is to measure the extent of
relationship the investment decisions in plant and machinery of the company and sales
have in explaining the variation in its operating income.
6.2 Methodology:
6.2.1 Statistical Analysis:
A linear regression analysis1 of the financial data of the company for the last five years
(for some companies four years and for one company three years due to unavailability of
data) has been carried out using a statistical SPSS program.
To understand the significance of capital budgeting decisions, operating income of the
firm has been used as dependent variable to develop a best possible regression model with
Plant and Machinery (P&M) and Sales as independent variables. These variables have
been selected since capital budgeting practices are maximum used for investment in plant
and machinery. Thus the researcher has attempted to use a linear regression model, to
understand how these variables are significant in explaining the variation in the operating
income of the company.
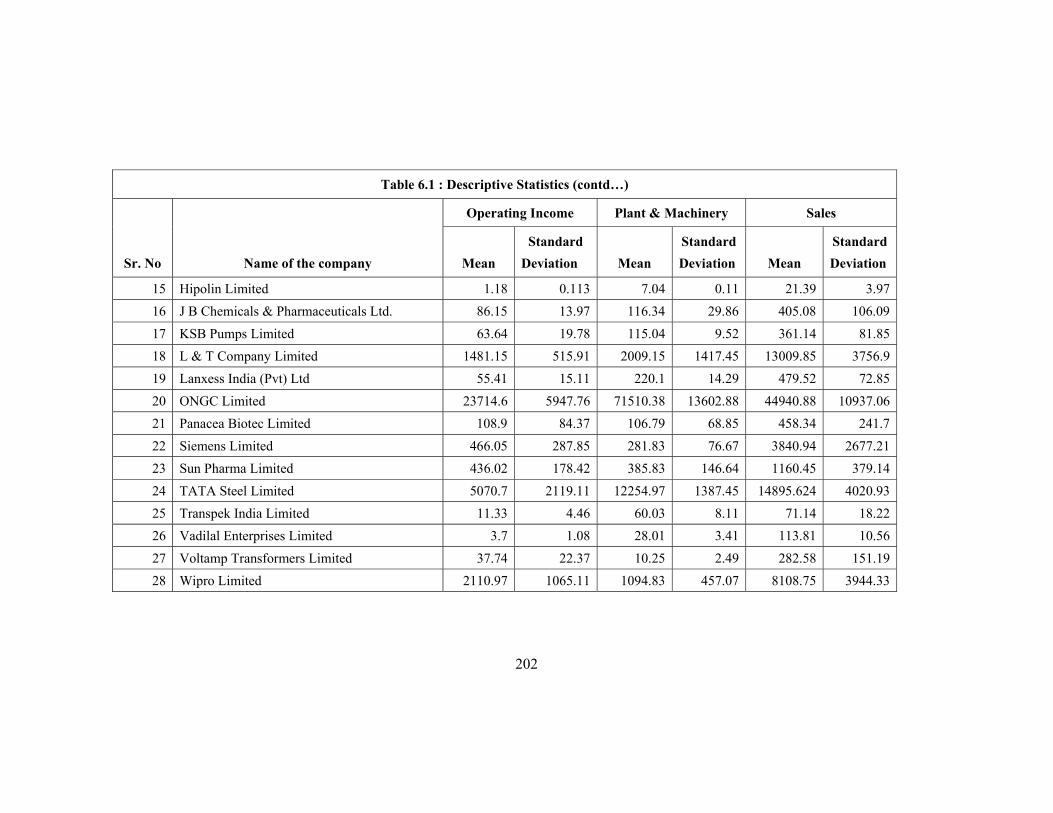
The following tables give the results generated by SPSS programme.
1. Table 6.1… Descriptive Statistics showing Mean and Standard Deviation for the
variables selected.
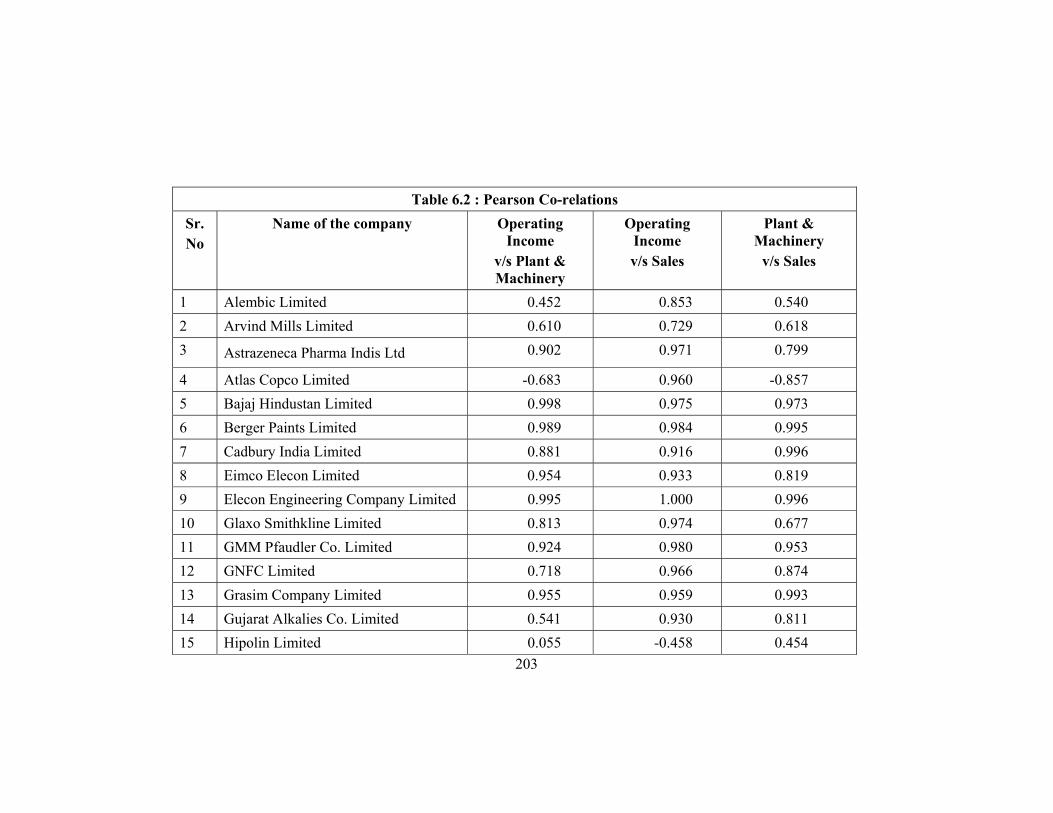
2. Table 6.2… Pearson's Co-relations showing the strength of the relation between
the variables.
1 Regression analysis is a general process of predicting one variable from another by statistical means, using available data. Our goal in carrying out regression analysis is to develop a statistical model that can be used to predict the values of independent variables.

168
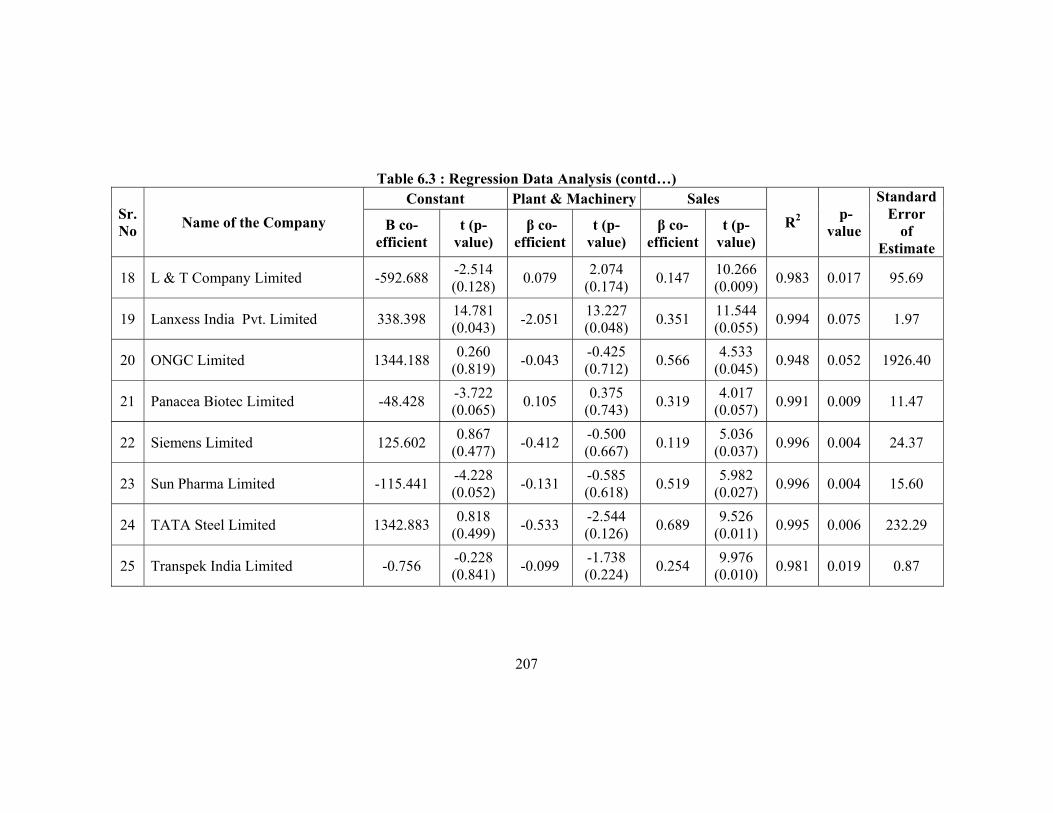
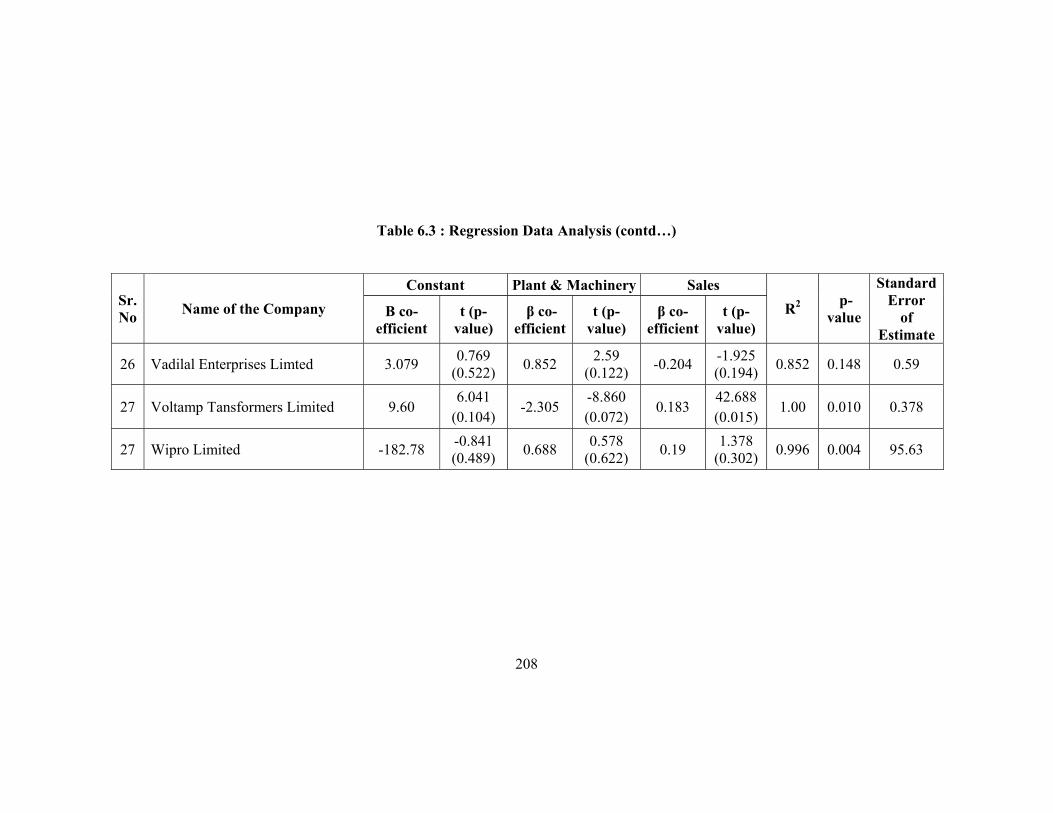
3. Table 6.3… Statistical data showing various Beta (β ) co-efficient for the
variables selected, value of R2, and p values for the estimated
model.
On carrying out regression analysis for the financial data available, following linear
regression model have been used, which checks the significance of investment in Plant
and Machinery and Sales of the company have in explaining the operating income of the
company.
iXXY εβββ +⋅+⋅+= 22110
Where, Y = Dependent Variable, Operating income in our study
0β = A Constant term i.e. the intercept value for the straight line Model.
1β = Beta Co-efficient for 1X variable,
1X = variable 1X , Plant and Machinery (P&M) in our study
2β = Beta Co-efficient for the 2X variable
2X = variable 2X , Sales in our study
ε = Estimate for error, measures the variability, or scatter of the
Observed values around the regression line.
Table 6.3, gives values of β co-efficient and standard estimate of error values for each
company. The regression model that would be derived by reading the values of the co-
efficient from the table 6.3, is provided below for one of the company, GMM Pfaudler
Limited :

169
Operating Income = -3.399 -0.166 P&M + 0.252 Sales + ε 2
Similar model can be estimated for other companies under study through the values of co-
efficient available in Table 6.3.
Further, it would be necessary to check how well the regression model explains the
variation of the dependent variable Y. The co-efficient of determination (R2) 3 is the
primary way to measure the extent, or strength, of the association that exists between two
variables, 1X and 2X . Table 6.3 gives the value of R2 for each company.
The Co-efficient of Determination value R2 for the above regression model of GMM
Pfaudler Limited is 0.962, which denotes that almost 96 % variation in operating income
is explained by the two variables P&M and Sales. In other words, it can be said that the
capital budgeting decisions for Plant and Machinery and the growth in sales together
explains almost 96% variation in the operating income achieved by the company.
As seen in Table 6.3, the R2 for almost 90 % of the companies is around 95 %. Thus, it can be
said that capital budgeting decisions leading to investment in plant and machinery and sales
together influence almost 95 % variation in the operating income of a company.
Further, to support that the regression model achieved is fully significant, t-test and F
ratio along with p-value4 have been evaluated for each company and the values are
provided in Table 6.3.
For, GMM Pfaudler Limited F-statistic is 25.448 together with a 0.038 p value, which
is less than 5 % conventional level, suggests that the model estimated as a whole is fully
significant in explaining the variation in operating income resulting from decisions taken
for investment in Plant and Machinery and growth in sales.
2 Estimating equations are not perfect predictors. The values of operating income derived through the model are only an estimate. Even so, the regression gives us a rough idea of what to expect for the coming year. 3 Co-efficient of determination ( R2) measures the strength of the linear relationship between two variables. The value of R2 is equal to +1 whenever the regression model is perfect estimator. Thus an R2 value close to 1 indicates a strong correlation between the variables. 4 P-value, i.e. Probability value is the largest significance level at which we would accept the hypothesis. Thus, a p-value of model if within significance level of 0.05 denotes that the regression model as a whole is highly (95 %) significant.
170
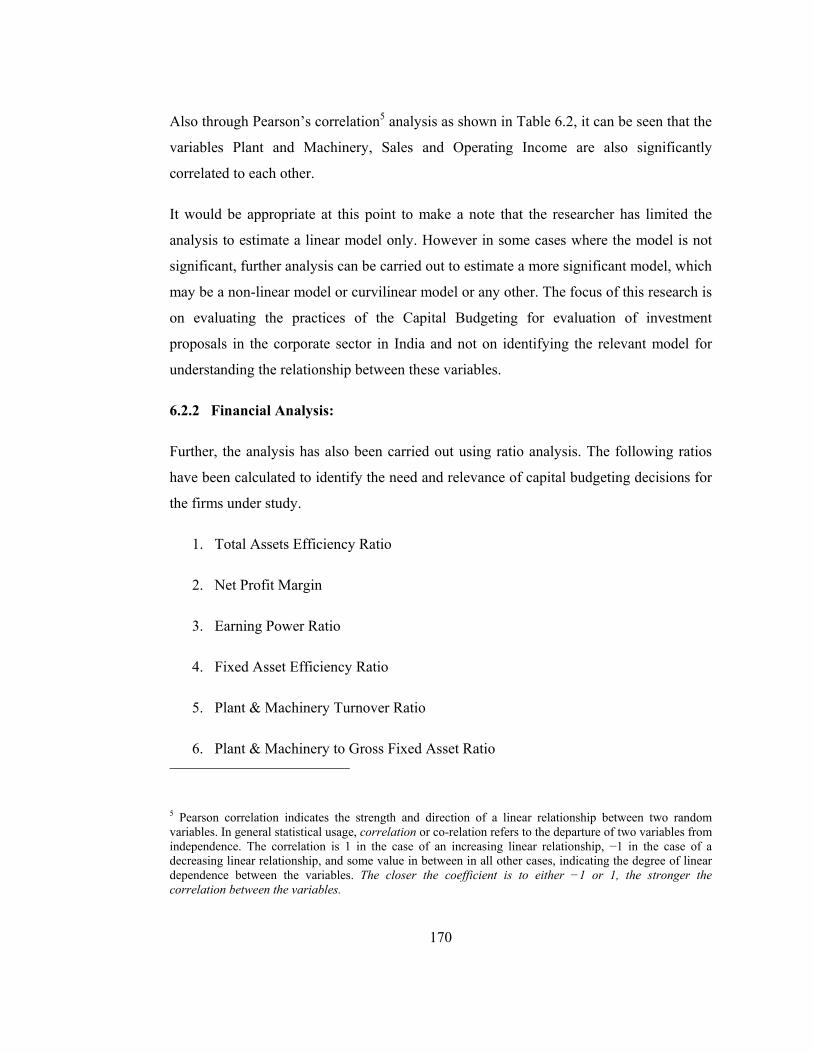
Also through Pearson’s correlation5 analysis as shown in Table 6.2, it can be seen that the
variables Plant and Machinery, Sales and Operating Income are also significantly
correlated to each other.
It would be appropriate at this point to make a note that the researcher has limited the
analysis to estimate a linear model only. However in some cases where the model is not
significant, further analysis can be carried out to estimate a more significant model, which
may be a non-linear model or curvilinear model or any other. The focus of this research is
on evaluating the practices of the Capital Budgeting for evaluation of investment
proposals in the corporate sector in India and not on identifying the relevant model for
understanding the relationship between these variables.
6.2.2 Financial Analysis:
Further, the analysis has also been carried out using ratio analysis. The following ratios
have been calculated to identify the need and relevance of capital budgeting decisions for
the firms under study.
1. Total Assets Efficiency Ratio
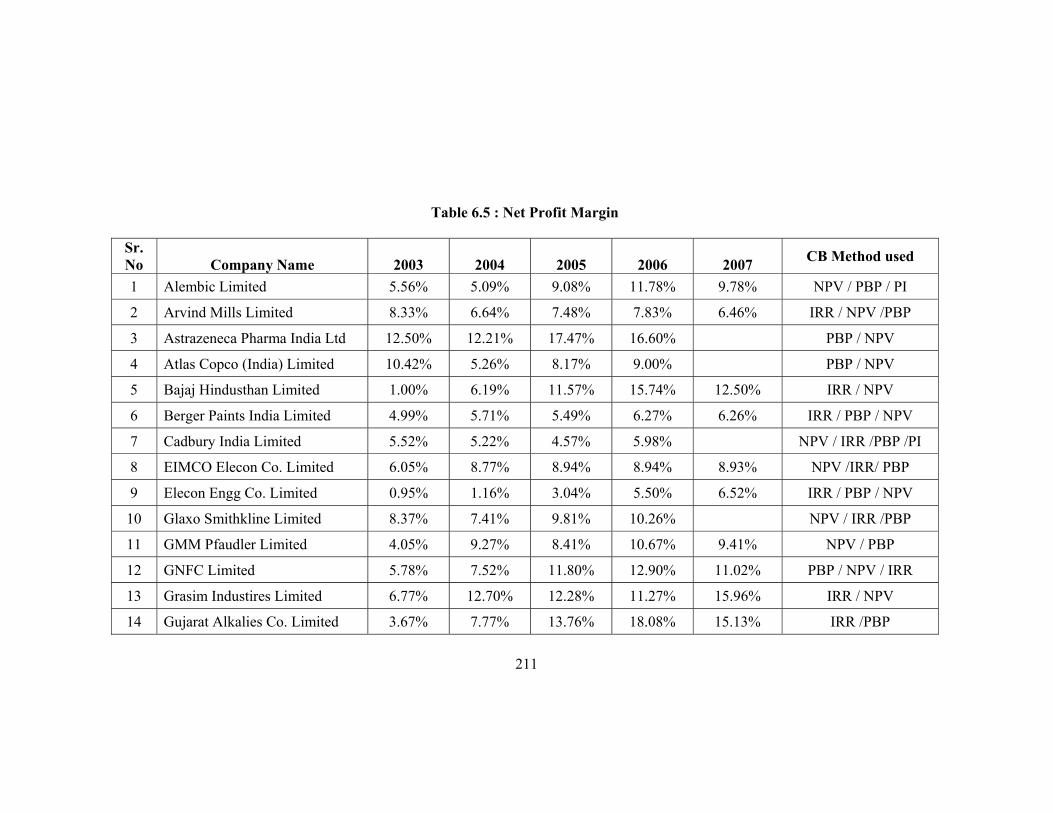
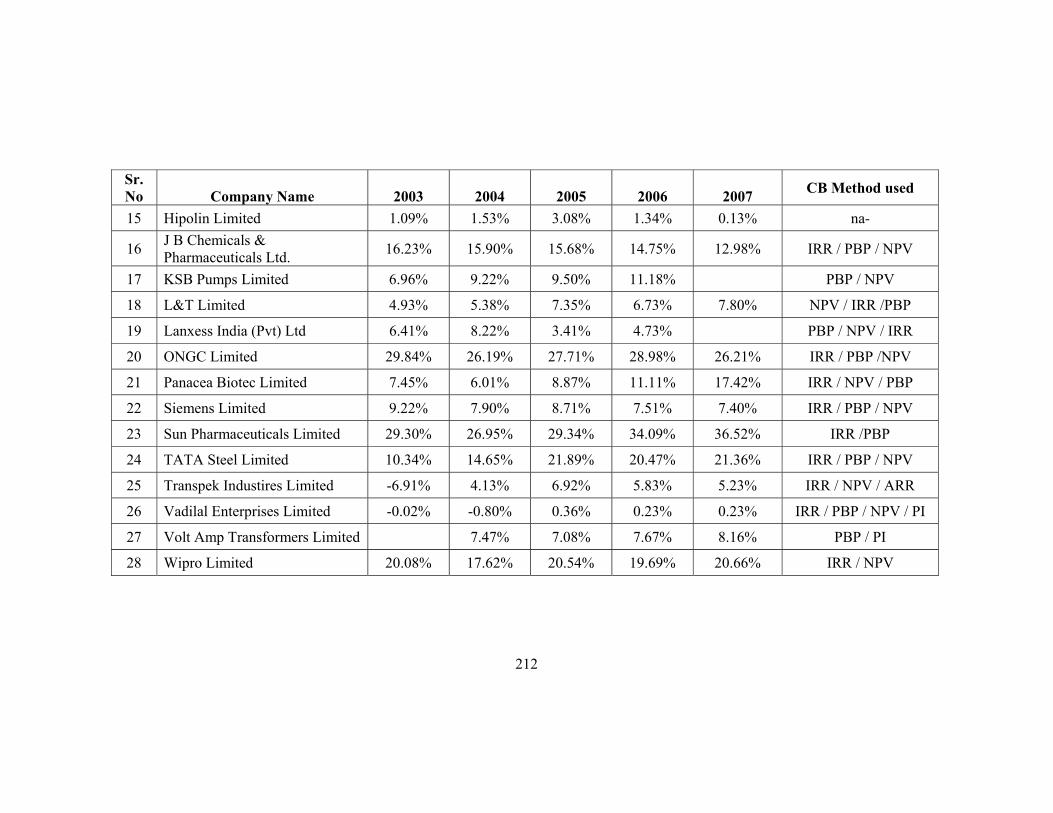
2. Net Profit Margin
3. Earning Power Ratio
4. Fixed Asset Efficiency Ratio
5. Plant & Machinery Turnover Ratio
6. Plant & Machinery to Gross Fixed Asset Ratio
5 Pearson correlation indicates the strength and direction of a linear relationship between two random variables. In general statistical usage, correlation or co-relation refers to the departure of two variables from independence. The correlation is 1 in the case of an increasing linear relationship, −1 in the case of a decreasing linear relationship, and some value in between in all other cases, indicating the degree of linear dependence between the variables. The closer the coefficient is to either −1 or 1, the stronger the correlation between the variables.
171
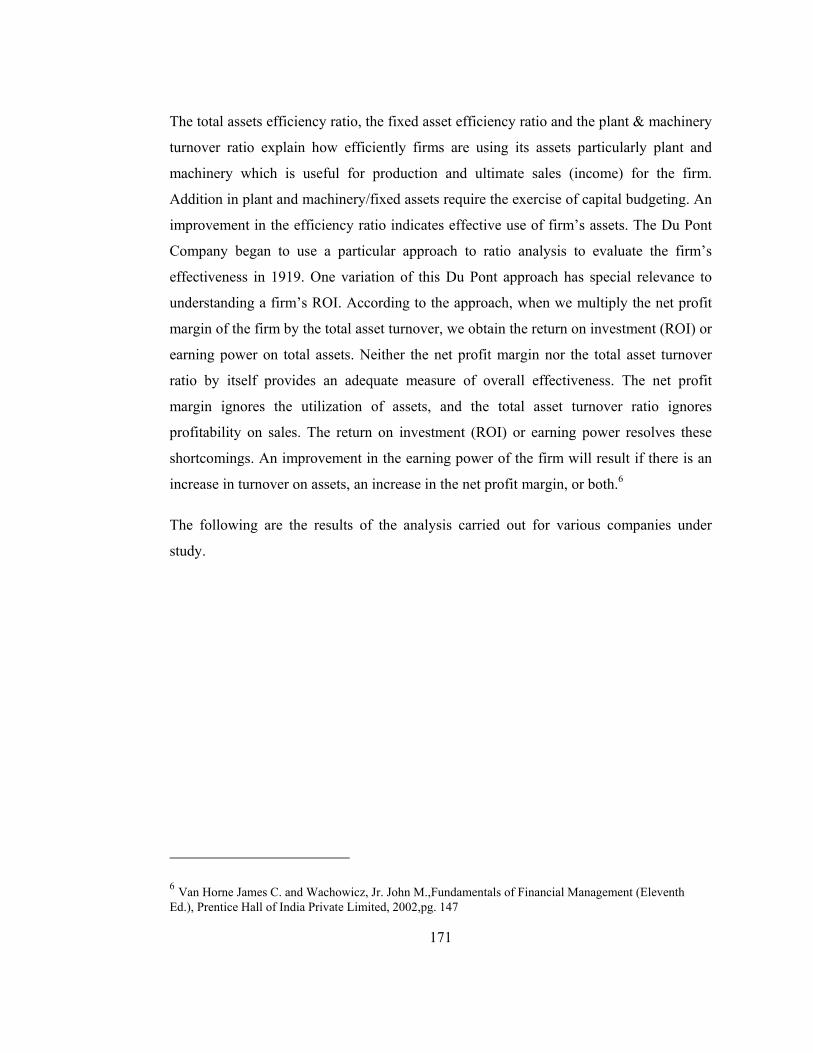
The total assets efficiency ratio, the fixed asset efficiency ratio and the plant & machinery
turnover ratio explain how efficiently firms are using its assets particularly plant and
machinery which is useful for production and ultimate sales (income) for the firm.
Addition in plant and machinery/fixed assets require the exercise of capital budgeting. An
improvement in the efficiency ratio indicates effective use of firm’s assets. The Du Pont
Company began to use a particular approach to ratio analysis to evaluate the firm’s
effectiveness in 1919. One variation of this Du Pont approach has special relevance to
understanding a firm’s ROI. According to the approach, when we multiply the net profit
margin of the firm by the total asset turnover, we obtain the return on investment (ROI) or
earning power on total assets. Neither the net profit margin nor the total asset turnover
ratio by itself provides an adequate measure of overall effectiveness. The net profit
margin ignores the utilization of assets, and the total asset turnover ratio ignores
profitability on sales. The return on investment (ROI) or earning power resolves these
shortcomings. An improvement in the earning power of the firm will result if there is an
increase in turnover on assets, an increase in the net profit margin, or both.6
The following are the results of the analysis carried out for various companies under
study.
6 Van Horne James C. and Wachowicz, Jr. John M.,Fundamentals of Financial Management (Eleventh Ed.), Prentice Hall of India Private Limited, 2002,pg. 147

172
1. Alembic Limited:
The decreasing efficiency ratio calculated below indicates that the assets of the company
are underutilized over a period of last five years. The company’s total investment in plant
and machinery is also reducing year by year. The plant & machinery turnover ratio has
reduced in the year 2004, 2005, and 2006 but it has improved in the year 2007. Thus, the
improvement in net profit margin and earning power ratio indicate that the increase is due
to some other reasons rather than asset efficiency.
Ratio Formula 2003 2004 2005 2006 2007
Asset Efficiency Ratios (times) sTotalAsset
Sales 1.08 1.09 0.90 0.95 0.79
Net Profit Margin (%) 100×
SalesPAT
5.56% 5.09% 9.08% 11.78% 9.78%
Earning Power Ratio (%)
Asset Efficiency Ratio × Net Profit Margin 5.99% 5.54% 8.15% 11.14% 7.69%
Fixed Asset Efficiency Ratio(times) AssetsGrossFixed
Sales 1.56 1.40 1.14 1.26 1.28
Plant & Machinery Turnover Ratio (times)
MachineryPlantSales
& 1.84 1.63 1.49 1.69 1.90
Plant & Machinery to GFA Ratio (%)
100&×
AssetsGrossFixedMachineryPlant
84.71% 86.06% 76.43% 74.59% 67.43%

173
2. Arvind Mills Ltd.
It can be seen that the assets of the company are underutilized over a period of last five
years as the ratio is decreasing and it is significantly less than 1. The company’s total
investment in plant and machinery has also significantly decreased in the year 2007 in
comparison to the year 2003 to 2006 but the plant and machinery turnover ratio has
improved over a period of five years except in the year 2004 and 2006. The net profit
margin has slightly improved in 2005 and 2006 compared to 2004, however, compared to
2003 it is not healthy. In last year of analysis i.e. 2007 it is lowest. This is mainly because
of substantial increase in material consumption cost and sales expenses. Thus, if we put
all these observations together it indicates that the company need to apply sound
techniques of capital budgeting which can help in taking right decision for fixed assets
investment and in turn increasing sales and income.
Ratio Formula 2003 2004 2005 2006 2007
Asset Efficiency Ratios (times) sTotalAsset
Sales 0.58 0.49 0.53 0.44 0.49
Net Profit Margin (%) 100×
SalesPAT
8.33% 6.64% 7.48% 7.83% 6.46%
Earning Power Ratio (%)
Asset Efficiency Ratio × Net Profit Margin 4.87% 3.27% 3.93% 3.46% 3.16%
Fixed Asset Efficiency Ratio(times) AssetsGrossFixed
Sales 0.76 0.70 0.77 0.71 0.64
Plant & Machinery Turnover Ratio(times) MachineryPlant
Sales&
1.22 1.12 1.24 1.11 1.31
Plant & Machinery to GFA Ratio (%) 100&
×AssetsGrossFixed
MachineryPlant62.29% 62.78% 61.88% 64.19% 48.99%

174
3. Astrazeneca Pharma India Ltd.
The company is generally investing more than 50% in plant and machinery out of its total
investment in fixed assets. The asset efficiency ratio is decreasing over a period of four
years except in the year 2005 but the gross fixed assets efficiency ratio and the plant and
machinery turnover ratio has improved continuously indicating use of sound capital
budgeting techniques. This is reflected in terms of increase in net profit margin and
earning power but both the ratios are slightly decreased in the year 2004 though the fixed
asset efficiency ratio is increasing in that year also which may be due to decrease in sales.
Ratio Formula 2003 2004 2005 2006
Asset Efficiency Ratios (times) sTotalAsset
Sales
1.34 1.26 1.38 1.21
Net Profit Margin (%) 100×
SalesPAT
12.50% 12.21% 17.47% 16.60%
Earning Power Ratio (%)
Asset Efficiency Ratio × Net Profit Margin 16.80% 15.38% 24.08% 20.05%
Fixed Asset Efficiency Ratio(times) AssetsGrossFixed
Sales 3.03 3.10 3.32 3.70
Plant & Machinery Turnover Ratio(times)
MachineryPlantSales
& 4.97 5.03 5.46 6.63
Plant & Machinery to GFA Ratio (%)
100&×
AssetsGrossFixedMachineryPlant
61.00% 61.54% 60.71% 55.79%

175
4. Atlas Copco (India) Ltd.
There is a slight decrease in the asset efficiency ratio in the year 2004. The asset
utilization of the company is moderately improving over a period of last four years. The
company’s proportionate investment in plant and machinery is substantially less from the
year 2004 onwards and it has major investment in intangible asset of the company in
these years. Thus almost three times increase in plant and machinery turnover ratio may
be due to decreasing investment in plant and machinery. The poor asset utilization has
been reflected in terms of decrease in net profit margin and earning power ratio.
Ratio Formula 2003 2004 2005 2006
Asset Efficiency Ratios (times) sTotalAsset
Sales 1.41 1.13 1.50 1.50
Net Profit Margin (%) 100×
SalesPAT
10.42% 5.26% 8.17% 9.00%
Earning Power Ratio (%)
Asset Efficiency Ratio × Net Profit Margin 14.64% 5.93% 12.27% 13.48%
Fixed Asset Efficiency Ratio(times) AssetsGrossFixed
Sales
4.32 2.31 3.11 3.64
Plant & Machinery Turnover Ratio(times) MachineryPlant
Sales&
7.98 11.89 16.41 22.86
Plant & Machinery to GFA Ratio (%)
100&×
AssetsGrossFixedMachineryPlant
54.12% 19.46% 18.96% 15.94%

176
5. Bajaj Hindusthan Ltd.
The efficiency ratios calculated below indicate that the assets of the company are under
utilized substantially over a period of five years. The company is usually investing in
plant and machinery more than 50% except in the year 2005 and 2006. The fixed asset
efficiency ratio is decreasing significantly indicating that increase in investment in fixed
asset is more than increase in sales. The net profit margin and earning power ratio have
substantially increased except in the year 2007 where both these ratios have decreased.
This is due to other income and reduction in employee cost and other administrative cost.
It is observed that this improvement has no link with asset utilization of the company. But
the earning power ratio of the company would have improved further if the company
would have used sound capital budgeting techniques for its investment in fixed assets
especially plant and machinery.
Ratio Formula 2003 2004 2005 2006 2007
Asset Efficiency Ratios (times) sTotalAsset
Sales 2.48 1.24 0.92 0.69 0.45
Net Profit Margin (%) 100×
SalesPAT
1.00% 6.19% 11.57% 15.74% 12.50%
Earning Power Ratio (%)
Asset Efficiency Ratio × Net Profit Margin 2.48% 7.67% 10.65% 10.84% 5.61%
Fixed Asset Efficiency Ratio(times) AssetsGrossFixed
Sales
1.86 0.78 0.41 0.36 0.48
Plant & Machinery Turnover Ratio(times)
MachineryPlantSales
& 2.92 1.40 1.05 0.92 0.76
Plant & Machinery to GFA Ratio (%)
100&×
AssetsGrossFixedMachineryPlant
63.58% 55.74% 39.22% 38.56% 63.08%

177
6. Berger Paints India Ltd.
The asset efficiency ratio has decreased continuously over a period of five years. The
fixed asset efficiency ratio is also decreasing year by year but which has increased in the
year 2007. The company is investing more than fifty percent in plant and machinery and
the plant and machinery turnover ratio is fluctuating during this period requiring sound
capital budgeting decisions. The earning power ratio of the firm has also improved
moderately indicating significance of asset efficiency and net profit margin.
Ratio Formula 2003 2004 2005 2006 2007
Asset Efficiency Ratios (times) sTotalAsset
Sales 2.20 2.16 2.18 2.12 2.10
Net Profit Margin (%) 100×
SalesPAT
4.99% 5.71% 5.49% 6.27% 6.26%
Earning Power Ratio (%)
Asset Efficiency Ratio × Net Profit Margin 11.00% 12.32% 11.95% 13.31% 13.14%
Fixed Asset Efficiency Ratio(times) AssetsGrossFixed
Sales
4.97 4.90 4.74 4.73 5.13
Plant & Machinery Turnover Ratio(times)
MachineryPlantSales
& 9.30 9.41 9.32 8.85 9.37
Plant & Machinery to GFA Ratio (%)
100&×
AssetsGrossFixedMachineryPlant
53.48% 52.08% 50.85% 53.42% 54.76%

178
7. Cadbury India Limited
The efficiency ratio calculated has reduced from the year 2003 onwards except in the year
2006 where it has slightly improved indicating little improvement in the use of assets.
Even the fixed asset efficiency ratio has also decreased continuously over the years.
Though the investment in plant and machinery of the total investment in gross fixed
assets has reduced, the plant and machinery turnover ratio is continuously improving
which indicates that the company has used sound capital budgeting techniques at least for
investment in plant and machinery. One can even observe a small increase in Net Profit
Margin and earning power ratio also.
Ratio Formula 2003 2004 2005 2006
Asset Efficiency Ratios (times) sTotalAsset
Sales 1.63 1.54 1.52 1.63
Net Profit Margin (%) 100×
SalesPAT
5.52% 5.22% 4.57% 5.98%
Earning Power Ratio (%)
Asset Efficiency Ratio × Net Profit Margin 8.97% 8.02% 6.96% 9.78%
Fixed Asset Efficiency Ratio(times) AssetsGrossFixed
Sales
2.47 2.39 2.37 2.24
Plant & Machinery Turnover Ratio (times) MachineryPlant
Sales&
3.14 3.19 3.28 3.46
Plant & Machinery to GFA Ratio (%) 100&
×AssetsGrossFixed
MachineryPlant 78.41% 74.73% 72.20% 64.80%

179
8. Eimco Elecon Company Limited
It can be seen that the company is investing more than eighty percent in plant and
machinery out of its total investment in fixed assets but the assets of the company are
underutilized over a period of last five years as the asset efficiency ratio and plant and
machinery turnover ratio is continuously decreasing. The earning power ratio has slightly
reduced in the year 2006 in comparison to year 2003 but still it has again increased in the
year 2007. This would have increased further if the company would have taken care of its
asset utilization through sound capital budgeting decisions which enable the company to
make appropriate investment in fixed assets.
Ratio Formula 2003 2004 2005 2006 2007
Asset Efficiency Ratios (times) sTotalAsset
Sales 0.87 0.65 0.60 0.57 0.69
Net Profit Margin (%) 100×
SalesPAT
6.05% 8.77% 8.94% 8.94% 8.93%
Earning Power Ratio (%)
Asset Efficiency Ratio × Net Profit Margin 5.27% 5.71% 5.32% 5.11% 6.14%
Fixed Asset Efficiency Ratio(times) AssetsGrossFixed
Sales
1.76 1.31 1.29 1.04 1.10
Plant & Machinery Turnover Ratio (times)
MachineryPlantSales
& 2.05 1.49 1.47 1.18 1.24
Plant & Machinery to GFA Ratio (%)
100&×
AssetsGrossFixedMachineryPlant
85.93% 87.87% 87.25% 88.75% 89.21%

180
9. Elecon Engineering Company Ltd
It can be seen that the total assets and gross fixed assets efficiency ratio is improving over
a period of five years except in the year 2004 where asset efficiency ratio is slightly
reducing indicating that the company’s assets are effectively utililized. The net profit and
earning power ratio has also been significantly improved over five years period which is
the result of sound capital budgeting decisions because almost eighty percent of the total
fixed assets investment is in plant and machinery requiring capital budgeting exercise.
There is a considerable increase in the plant and machinery turnover ratio also.
Ratio Formula 2003 2004 2005 2006 2007
Asset Efficiency Ratios (times) sTotalAsset
Sales 0.92 0.76 0.95 0.94 1.13
Net Profit Margin (%) 100×
SalesPAT
0.95% 1.16% 3.04% 5.50% 6.52%
Earning Power Ratio (%)
Asset Efficiency Ratio × Net Profit Margin 0.88% 0.88% 2.88% 5.19% 7.36%
Fixed Asset Efficiency Ratio(times) AssetsGrossFixed
Sales
1.23 1.25 1.86 2.38 3.35
Plant & Machinery Turnover Ratio(times)
MachineryPlantSales
& 1.57 1.57 2.32 3.07 4.18
Plant & Machinery to GFA Ratio (%)
100&×
AssetsGrossFixedMachineryPlant
78.58% 79.27% 80.20% 77.51% 80.13%

181
10. Glaxo Smithkline Limited
The efficiency ratio calculated below is decreasing from the year 2003 onwards except in
the year 2004 where it has moderately improved. The fixed asset efficiency ratio and the
plant & machinery turnover ratio are improving over a period of four years which means
that decrease in total asset utilization ratio is due to higher component of current assets.
However, the earning power ratio has decreased in comparison to the year 2003.
Ratio Formula 2003 2004 2005 2006
Asset Efficiency Ratios (times) sTotalAsset
Sales 1.29 1.32 0.99 0.99
Net Profit Margin (%) 100×
SalesPAT
8.37% 7.41% 9.81% 10.26%
Earning Power Ratio (%)
Asset Efficiency Ratio × Net Profit Margin 10.79% 9.79% 9.76% 10.12%
Fixed Asset Efficiency Ratio(times) AssetsGrossFixed
Sales
1.86 1.96 2.11 2.34
Plant & Machinery Turnover Ratio (times) MachineryPlant
Sales&
3.01 3.22 3.86 4.25
Plant & Machinery to GFA Ratio (%)
100&×
AssetsGrossFixedMachineryPlant
61.64% 60.71% 54.67% 55.07%

182
11. GMM Pfaudler Limited
The asset efficiency ratio has improved in the years 2004, 2005 and 2006 however; it has
slightly decreased in the year 2007. But fixed assets efficiency ratio has been
continuously increased with earning power ratio indicating increase in sales and effective
utilization of fixed assets. The company has made three-fifth of its investment in plant
and machinery of the total investment in GFA and the plant and machinery turnover ratio
has continuously increased over a period of five years indicating that the company is
using its plant and machinery efficiently.
Ratio Formula 2003 2004 2005 2006 2007
Asset Efficiency Ratios (times) sTotalAsset
Sales 0.87 0.93 0.92 1.07 0.93
Net Profit Margin (%) 100×
SalesPAT
4.05% 9.27% 8.41% 10.67% 9.41%
Earning Power Ratio (%)
Asset Efficiency Ratio × Net Profit Margin 3.53% 8.65% 7.73% 11.37% 8.78%
Fixed Asset Efficiency Ratio (times) AssetsGrossFixed
Sales 1.51 1.66 1.86 2.28 2.47
Plant & Machinery Turnover Ratio (times)
MachineryPlantSales
& 2.40 2.69 2.81 3.46 3.69
Plant & Machinery to GFA Ratio (%)
100&×
AssetsGrossFixedMachineryPlant
63.05% 61.75% 66.15% 65.81% 66.96%

183
12. Gujarat Narmada Valley Fertilizers Company Ltd. (GNFC)
The asset efficiency ratio, the fixed asset efficiency ratio and the plant and machinery
turnover ratio are improving over a period of five years. The net profit margin has
improved year by year after 2003, which is doubled by 2005 is because of better asset
utilization as shown by asset efficiency ratio and addition in plant and machinery which
has lead to more production, more sales and higher profit. It indicates that the assets of
the company are properly utilized.
Ratios Formula 2003 2004 2005 2006 2007
Asset Efficiency Ratios (times) sTotalAsset
Sales 0.70 0.74 0.82 0.92 0.87
Net Profit Margin (%) 100×
SalesPAT
5.78% 7.52% 11.8% 12.9% 11.02%
Earning Power Ratio (%)
Asset Efficiency Ratio × Net Profit
Margin 4.02% 5.53% 9.69% 11.81% 9.64%
Fixed Asset Efficiency Ratio(times) AssetsGrossFixed
Sales 0.70 0.74 0.89 1.05 1.10
Plant & Machinery Turnover Ratio(times)
MachineryPlantSales
&
0.75 0.80 0.99 1.15 1.21
Plant & Machinery to GFA Ratio (%)
AssetsGrossFixedMachineryPlant &
93.41% 93.05% 90.43% 91.44% 90.74%

184
13. Grasim Industries Ltd.
It can be seen that the total assets utilization as well as fixed assets utilization of the
company has been moderately improved over a period of last five years as the ratio is
improving and it is very much close to one. The plant & machinery turnover ratio is also
improving during this period. The net profit margin and earning power of the company
has been improved significantly which indicates effective assets utilization as well as
increase in the sales of the company.
Ratio Formula 2003 2004 2005 2006 2007
Asset Efficiency Ratios (times) sTotalAsset
Sales 0.82 0.84 0.89 0.87 0.85
Net Profit Margin (%) 100×
SalesPAT
6.77% 12.70% 12.28% 11.27% 15.96%
Earning Power Ratio (%)
Asset Efficiency Ratio × Net Profit Margin 5.56% 10.66% 10.94% 9.75% 13.64%
Fixed Asset Efficiency Ratio(times) AssetsGrossFixed
Sales 0.97 1.06 1.19 1.19 1.21
Plant & Machinery Turnover Ratio(times)
MachineryPlantSales
& 1.20 1.30 1.48 1.52 1.74
Plant & Machinery to GFA Ratio (%)
100&×
AssetsGrossFixedMachineryPlant
81.04% 81.12% 80.22% 78.59% 69.20%

185
14. Gujarat Alkalies & Chemicals Limited (GACL)
The company is making more than eighty percent investment in plant and machinery. It
can be seen that the assets of the company are effectively utilized as the efficiency ratios
are improving over a period of last five years. The plant and machinery turnover ratio is
also improving during this period indicating sound capital budgeting decisions. The
significant improvement in earning power ratio indicates both effective utilization of
assets as well as increase in sales.
Ratio Formula 2003 2004 2005 2006 2007
Asset Efficiency Ratios (times) sTotalAsset
Sales 0.48 0.52 0.71 0.66 0.67
Net Profit Margin (%) 100×
SalesPAT
3.67% 7.77% 13.76% 18.08% 15.13%
Earning Power Ratio (%)
Asset Efficiency Ratio × Net Profit Margin 1.77% 4.06% 9.80% 11.98% 10.20%
Fixed Asset Efficiency Ratio(times) AssetsGrossFixed
Sales
0.47 0.50 0.63 0.59 0.61
Plant & Machinery Turnover Ratio(times)
MachineryPlantSales
& 0.51 0.54 0.68 0.70 0.68
Plant & Machinery to GFA Ratio (%) AssetsGrossFixed
MachineryPlant &
93.80% 93.74% 91.98% 84.27% 88.95%
186
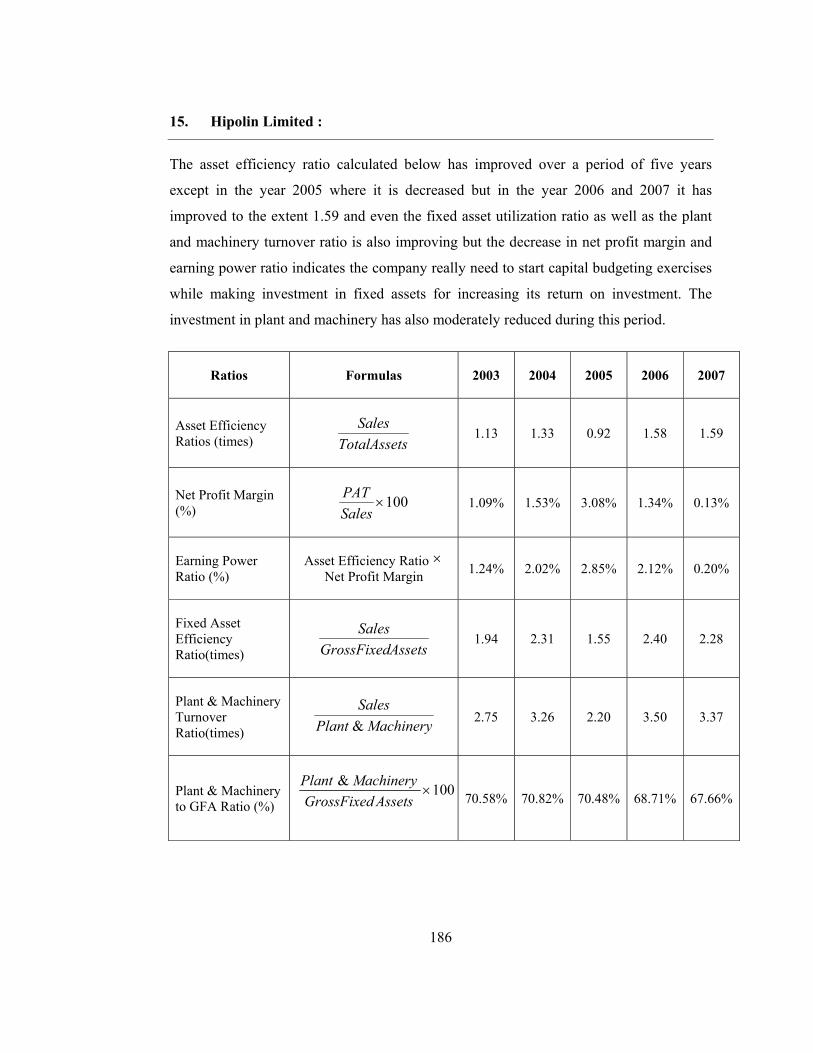
15. Hipolin Limited :
The asset efficiency ratio calculated below has improved over a period of five years
except in the year 2005 where it is decreased but in the year 2006 and 2007 it has
improved to the extent 1.59 and even the fixed asset utilization ratio as well as the plant
and machinery turnover ratio is also improving but the decrease in net profit margin and
earning power ratio indicates the company really need to start capital budgeting exercises
while making investment in fixed assets for increasing its return on investment. The
investment in plant and machinery has also moderately reduced during this period.
Ratios Formulas 2003 2004 2005 2006 2007
Asset Efficiency Ratios (times) sTotalAsset
Sales 1.13 1.33 0.92 1.58 1.59
Net Profit Margin (%) 100×
SalesPAT
1.09% 1.53% 3.08% 1.34% 0.13%
Earning Power Ratio (%)
Asset Efficiency Ratio × Net Profit Margin 1.24% 2.02% 2.85% 2.12% 0.20%
Fixed Asset Efficiency Ratio(times) AssetsGrossFixed
Sales
1.94 2.31 1.55 2.40 2.28
Plant & Machinery Turnover Ratio(times) MachineryPlant
Sales&
2.75 3.26 2.20 3.50 3.37
Plant & Machinery to GFA Ratio (%)
100&×
AssetsGrossFixedMachineryPlant
70.58% 70.82% 70.48% 68.71% 67.66%
187
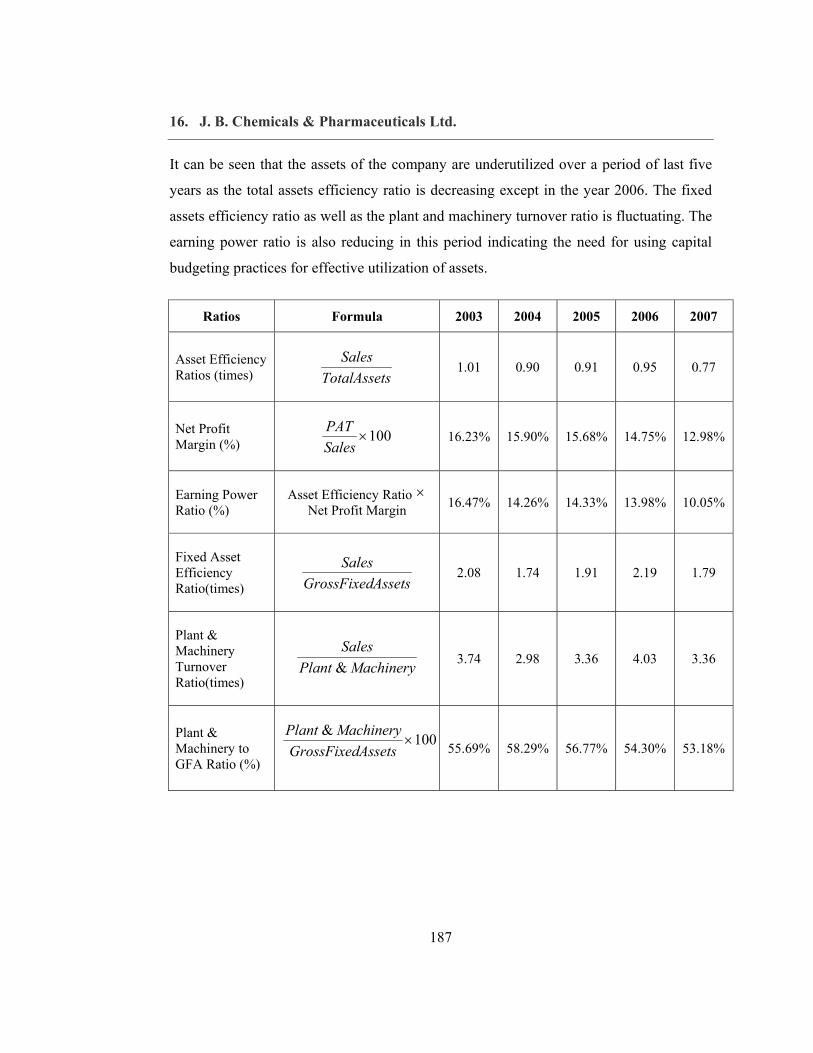
16. J. B. Chemicals & Pharmaceuticals Ltd.
It can be seen that the assets of the company are underutilized over a period of last five
years as the total assets efficiency ratio is decreasing except in the year 2006. The fixed
assets efficiency ratio as well as the plant and machinery turnover ratio is fluctuating. The
earning power ratio is also reducing in this period indicating the need for using capital
budgeting practices for effective utilization of assets.
Ratios Formula 2003 2004 2005 2006 2007
Asset Efficiency Ratios (times) sTotalAsset
Sales 1.01 0.90 0.91 0.95 0.77
Net Profit Margin (%) 100×
SalesPAT
16.23% 15.90% 15.68% 14.75% 12.98%
Earning Power Ratio (%)
Asset Efficiency Ratio × Net Profit Margin 16.47% 14.26% 14.33% 13.98% 10.05%
Fixed Asset Efficiency Ratio(times) AssetsGrossFixed
Sales
2.08 1.74 1.91 2.19 1.79
Plant & Machinery Turnover Ratio(times)
MachineryPlantSales
& 3.74 2.98 3.36 4.03 3.36
Plant & Machinery to GFA Ratio (%)
100&×
AssetsGrossFixedMachineryPlant
55.69% 58.29% 56.77% 54.30% 53.18%

188
17. KSB Pumps Ltd.
The company is investing almost seventy percent in plant and machinery of its total
investment in gross fixed assets. The efficiency ratio has improved over a period of four
years except in the year 2006 where it is slightly reduced indicating that the total assets
including fixed assets of the company and especially plant and machinery are properly
utilized. This has even reflected in the increase of earning power ratio also.
Ratio Formula 2003 2004 2005 2006
Asset Efficiency Ratios (times) sTotalAsset
Sales 1.24 1.39 1.42 1.30
Net Profit Margin (%) 100×
SalesPAT
6.96% 9.22% 9.50% 11.18%
Earning Power Ratio (%)
Asset Efficiency Ratio × Net Profit Margin 8.66% 12.78% 13.51% 14.54%
Fixed Asset Efficiency Ratio(times) AssetsGrossFixed
Sales 1.89 2.24 2.57 2.49
Plant & Machinery Turnover Ratio(times)
MachineryPlantSales
& 2.51 3.01 3.36 3.57
Plant & Machinery to GFA Ratio (%)
100&×
AssetsGrossFixedMachineryPlant
75.51% 74.39% 76.52% 69.68%
189
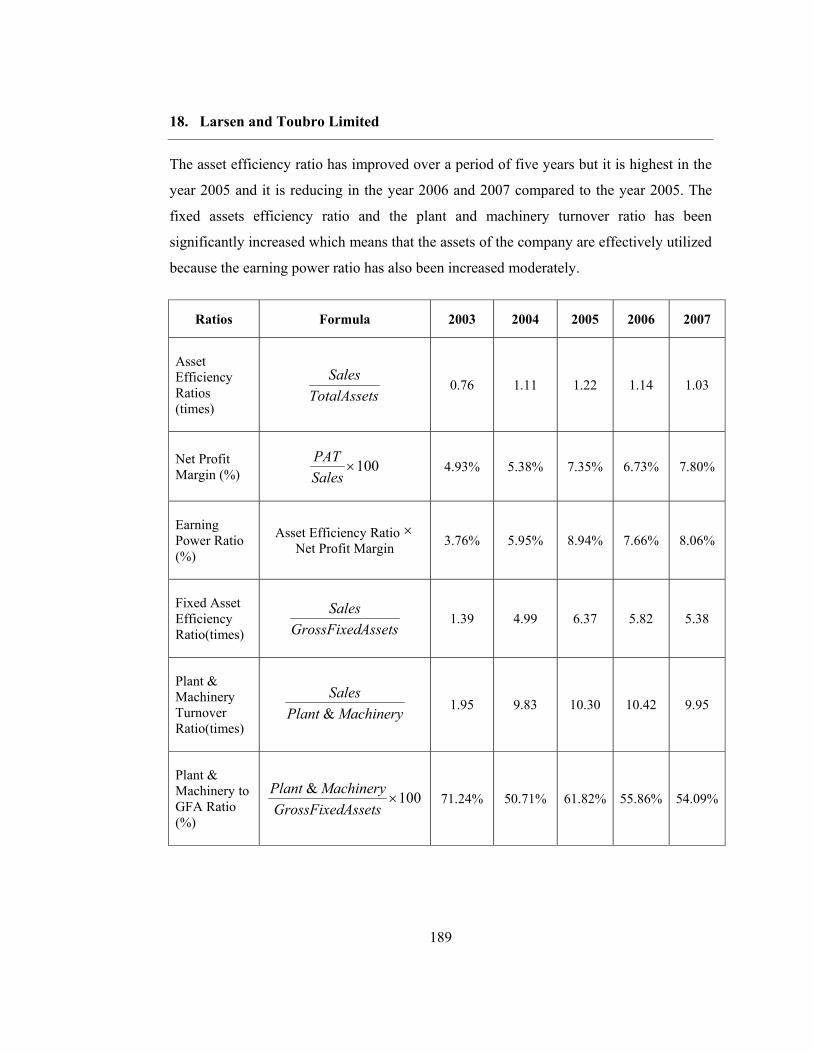
18. Larsen and Toubro Limited
The asset efficiency ratio has improved over a period of five years but it is highest in the
year 2005 and it is reducing in the year 2006 and 2007 compared to the year 2005. The
fixed assets efficiency ratio and the plant and machinery turnover ratio has been
significantly increased which means that the assets of the company are effectively utilized
because the earning power ratio has also been increased moderately.
Ratios Formula 2003 2004 2005 2006 2007
Asset Efficiency Ratios (times)
sTotalAssetSales
0.76 1.11 1.22 1.14 1.03
Net Profit Margin (%) 100×
SalesPAT
4.93% 5.38% 7.35% 6.73% 7.80%
Earning Power Ratio (%)
Asset Efficiency Ratio × Net Profit Margin 3.76% 5.95% 8.94% 7.66% 8.06%
Fixed Asset Efficiency Ratio(times) AssetsGrossFixed
Sales
1.39 4.99 6.37 5.82 5.38
Plant & Machinery Turnover Ratio(times)
MachineryPlantSales
& 1.95 9.83 10.30 10.42 9.95
Plant & Machinery to GFA Ratio (%)
100&×
AssetsGrossFixedMachineryPlant
71.24% 50.71% 61.82% 55.86% 54.09%
190
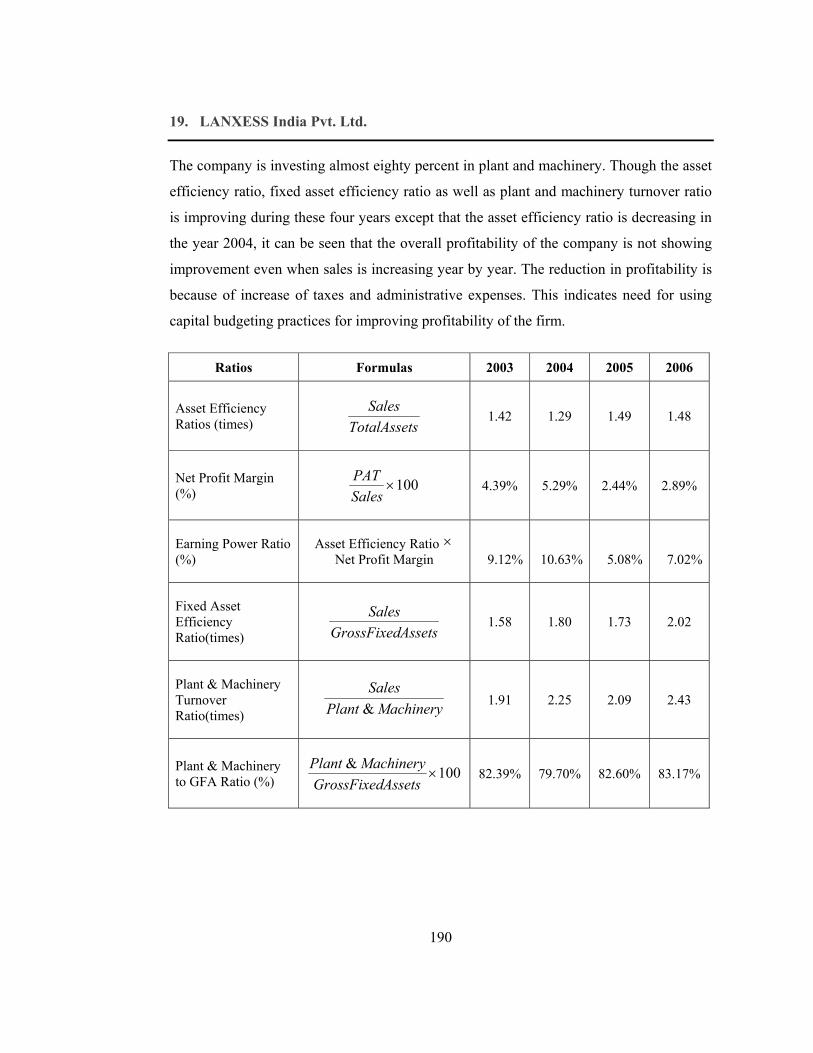
19. LANXESS India Pvt. Ltd.
The company is investing almost eighty percent in plant and machinery. Though the asset
efficiency ratio, fixed asset efficiency ratio as well as plant and machinery turnover ratio
is improving during these four years except that the asset efficiency ratio is decreasing in
the year 2004, it can be seen that the overall profitability of the company is not showing
improvement even when sales is increasing year by year. The reduction in profitability is
because of increase of taxes and administrative expenses. This indicates need for using
capital budgeting practices for improving profitability of the firm.
Ratios Formulas 2003 2004 2005 2006
Asset Efficiency Ratios (times) sTotalAsset
Sales 1.42 1.29 1.49 1.48
Net Profit Margin (%) 100×
SalesPAT
4.39% 5.29% 2.44% 2.89%
Earning Power Ratio (%)
Asset Efficiency Ratio × Net Profit Margin 9.12% 10.63% 5.08% 7.02%
Fixed Asset Efficiency Ratio(times) AssetsGrossFixed
Sales
1.58 1.80 1.73 2.02
Plant & Machinery Turnover Ratio(times) MachineryPlant
Sales&
1.91 2.25 2.09 2.43
Plant & Machinery to GFA Ratio (%) 100&
×AssetsGrossFixed
MachineryPlant82.39% 79.70% 82.60% 83.17%

191
20. Oil and Natural Gas Company Limited (ONGC)
The company is making huge investment in plant and machinery. But the efficiency ratio
has decreased over a period of five years which means that the assets of the company are
not effectively utilized and the fixed assets efficiency ratio and the plant and machinery
turnover ratio has been slightly increased in comparison to the year 2003. The same
observation can be made for earning power ratio also and the net profit ratio has been
decreased year by year except in the year 2006 where it is slightly increased.
Ratios Formulas 2003 2004 2005 2006 2007
Asset Efficiency Ratios (times)
sTotalAssetSales
0.51 0.41 0.49 0.44 0.44
Net Profit Margin (%) 100×
SalesPAT
29.84% 26.19% 27.71% 28.98% 26.21%
Earning Power Ratio (%)
Asset Efficiency Ratio × Net Profit Margin 15.25% 10.79% 13.67% 12.62% 11.43%
Fixed Asset Efficiency Ratio(times) AssetsGrossFixed
Sales
0.60 0.50 0.48 0.61 0.66
Plant & Machinery Turnover Ratio(times)
MachineryPlantSales
& 0.65 0.53 0.53 0.68 0.76
Plant & Machinery to GFA Ratio (%)
100&×
AssetsGrossFixedMachineryPlant
93.43% 93.85% 91.34% 89.63% 87.69%

192
21. Panacea Biotec Limited :
The investment in plant and machinery has been increased significantly over a period of
five years but the asset efficiency is decreased during this period. It can be seen that the
company’s net profit ratio is showing substantial increase particularly in the year 2006
and 2007. This is mainly because of high increase in profit margin due to increase in sales
and decrease in expenses. This increase is not supported by asset utilization indicating the
need for capital budgeting exercise.
Ratio Formula 2003 2004 2005 2006 2007
Asset Efficiency Ratios (times) sTotalAsset
Sales 0.97 0.62 0.72 0.54 0.81
Net Profit Margin (%) 100×
SalesPAT
7.45% 6.01% 8.87% 11.11% 17.42%
Earning Power Ratio (%)
Asset Efficiency Ratio × Net Profit Margin 7.23% 3.72% 6.35% 6.00% 14.10%
Fixed Asset Efficiency Ratio(times) AssetsGrossFixed
Sales
2.24 1.85 1.77 1.80 1.66
Plant & Machinery Turnover Ratio(times)
MachineryPlantSales
& 8.03 3.53 3.80 4.90 3.84
Plant & Machinery to GFA Ratio (%)
100&×
AssetsGrossFixedMachineryPlant
27.91% 52.23% 46.62% 36.76% 43.36%
193
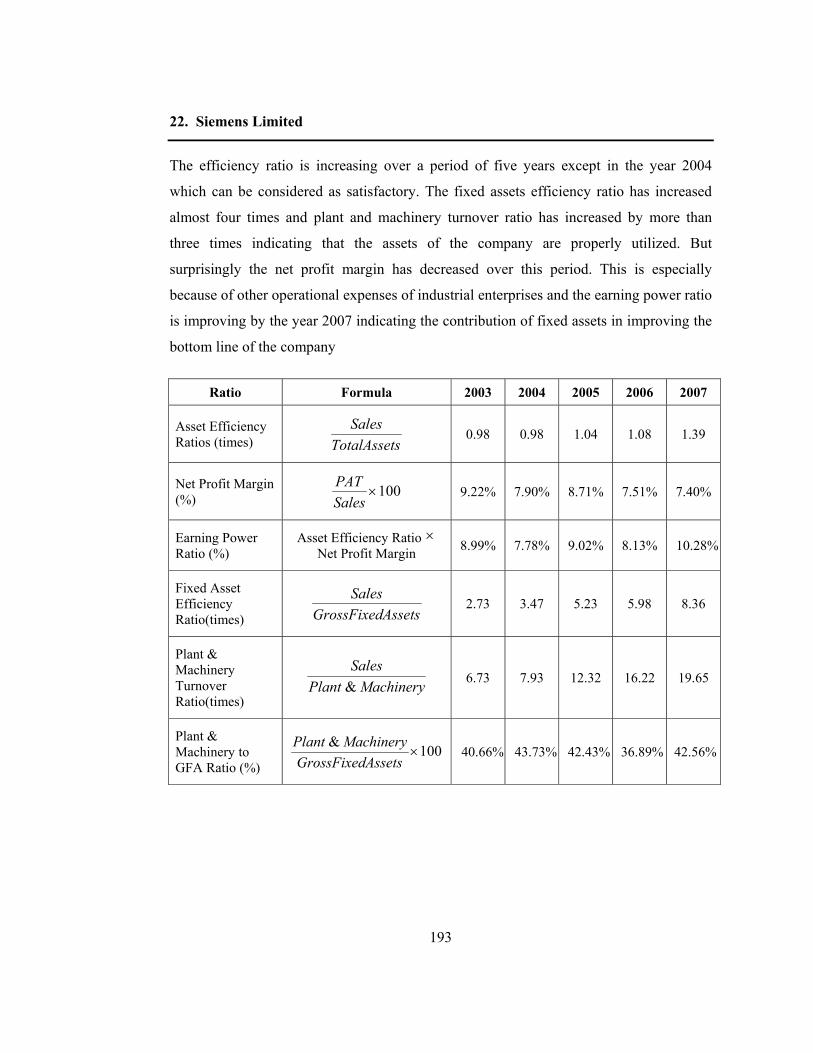
22. Siemens Limited
The efficiency ratio is increasing over a period of five years except in the year 2004
which can be considered as satisfactory. The fixed assets efficiency ratio has increased
almost four times and plant and machinery turnover ratio has increased by more than
three times indicating that the assets of the company are properly utilized. But
surprisingly the net profit margin has decreased over this period. This is especially
because of other operational expenses of industrial enterprises and the earning power ratio
is improving by the year 2007 indicating the contribution of fixed assets in improving the
bottom line of the company
Ratio Formula 2003 2004 2005 2006 2007
Asset Efficiency Ratios (times) sTotalAsset
Sales 0.98 0.98 1.04 1.08 1.39
Net Profit Margin (%) 100×
SalesPAT
9.22% 7.90% 8.71% 7.51% 7.40%
Earning Power Ratio (%)
Asset Efficiency Ratio × Net Profit Margin 8.99% 7.78% 9.02% 8.13% 10.28%
Fixed Asset Efficiency Ratio(times) AssetsGrossFixed
Sales
2.73 3.47 5.23 5.98 8.36
Plant & Machinery Turnover Ratio(times)
MachineryPlantSales
& 6.73 7.93 12.32 16.22 19.65
Plant & Machinery to GFA Ratio (%)
100&×
AssetsGrossFixedMachineryPlant
40.66% 43.73% 42.43% 36.89% 42.56%

194
23. Sun Pharmaceuticals Limited :
Though the fixed asset efficiency ratio is moderately improving in the year 2007 in
comparison to year 2003, the overall asset efficiency ratio and plant and machinery
turnover ratio is decreasing. It can be seen that the company is having lesser asset
efficiency ratio because sales and income are increasing but at the same time there is
substantial increase in fixed assets year by year. Profitability ratio is higher only because
of other income but the earning power ratio is decreasing due to poor asset utilization.
Ratio Formula 2003 2004 2005 2006 2007
Asset Efficiency Ratios (times) sTotalAsset
Sales 0.91 0.62 0.32 0.38 0.44
Net Profit Margin (%) 100×
SalesPAT
29.30% 26.95% 29.34% 34.09% 36.52%
Earning Power Ratio (%)
Asset Efficiency Ratio × Net Profit Margin 26.55% 16.75% 9.49% 12.79% 16.24%
Fixed Asset Efficiency Ratio(times) AssetsGrossFixed
Sales
1.94 1.67 1.58 1.75 1.98
Plant & Machinery Turnover Ratio(times)
MachineryPlantSales
& 3.92 3.04 2.74 2.81 3.01
Plant & Machinery to GFA Ratio (%)
100&×
AssetsGrossFixedMachineryPlant
49.40% 54.79% 57.79% 62.10% 65.62%

195
24. Tata Steel Limited
The efficiency ratio calculated below has improved over a period of five years except in
the year 2007 which means that the assets of the company are properly utilized even the
fixed assets efficiency ratio has been improved over five years indicating effective
utilization of fixed asset where more than eighty percent investment has taken place in
plant and machinery. The plant and machinery turnover ratio has also increased during
this period. This has been reflected in terms of substantial increase in net profit margin
and earning power ratio.
Ratios Formulas 2003 2004 2005 2006 2007
Asset Efficiency Ratios (times)
sTotalAssetSales
0.74 0.86 0.95 0.89 0.62
Net Profit Margin (%) 100×
SalesPAT
10.34% 14.65% 21.89% 20.47% 21.36%
Earning Power Ratio (%)
Asset Efficiency Ratio × Net Profit Margin 7.63% 12.53% 20.81% 18.21% 13.15%
Fixed Asset Efficiency Ratio(times) AssetsGrossFixed
Sales
0.79 0.90 1.06 1.04 1.07
Plant & Machinery Turnover Ratio(times)
MachineryPlantSales
& 0.90 1.06 1.36 1.27 1.42
Plant & Machinery to GFA Ratio (%)
100&×
AssetsGrossFixedMachineryPlant
88.14% 84.42% 78.04% 82.16% 75.67%

196
25. Transpek Industries Limited
The total assets and fixed assets efficiency ratio calculated below has improved over a
period of five years except in the year 2007 which means that the assets of the company
are properly utilized. The same observation can be made for plant and machinery turnover
ratio. This can be observed in the increase of the earning power ratio of the firm. This is
not possible without taking effective capital budgeting decisions because the company is
making more than 75% investment in plant and machinery out of its total investments in
gross fixed assets.
Ratio Formula 2003 2004 2005 2006 2007
Asset Efficiency Ratios (times) sTotalAsset
Sales 0.51 0.73 0.93 0.91 0.86
Net Profit Margin (%) 100×
SalesPAT
-6.91% 4.13% 6.92% 5.83% 5.23%
Earning Power Ratio (%)
Asset Efficiency Ratio × Net Profit Margin -3.50% 3.03% 6.41% 5.28% 4.48%
Fixed Asset Efficiency Ratio(times) AssetsGrossFixed
Sales 0.69 0.85 1.15 1.10 0.96
Plant & Machinery Turnover Ratio(times) MachineryPlant
Sales&
0.77 1.00 1.52 1.44 1.24
Plant & Machinery to GFA Ratio (%) AssetsGrossFixed
MachineryPlant & 88.59% 85.32% 75.61% 76.62% 77.21%

197
26. Vadilal Enterprises Limited:
The company is investing almost ninety percent in plant and machinery. It can be seen
that the assets of the company are underutilized over a period of last five years as the ratio
is decreasing except in year 2004. The fixed assets efficiency ratio is decreasing every
year except 2004 and even net profit margin and earning power ratio of the company is
also not very impressive. All these put together, the company need to focus more on asset
utilization by taking sound capital budgeting decisions at the time of investment in the
fixed assets.
Ratio Formula 2003 2004 2005 2006 2007
Asset Efficiency Ratios (times) sTotalAsset
Sales 2.47 2.72 2.42 2.40 2.41
Net Profit Margin (%) 100×
SalesPAT
(0.02%) (0.80%) 0.36% 0.23% 0.23%
Earning Power Ratio (%)
Asset Efficiency Ratio × Net Profit Margin (0.05%) (2.17%) 0.86% 0.55% 0.55%
Fixed Asset Efficiency Ratio(times) AssetsGrossFixed
Sales 3.80 3.81 3.52 3.64 3.59
Plant & Machinery Turnover Ratio(times)
MachineryPlantSales
& 4.27 4.24 3.90 4.04 3.93
Plant & Machinery to GFA Ratio (%)
100&×
AssetsGrossFixedMachineryPlant
88.97% 89.84% 90.26% 90.07% 91.21%
198
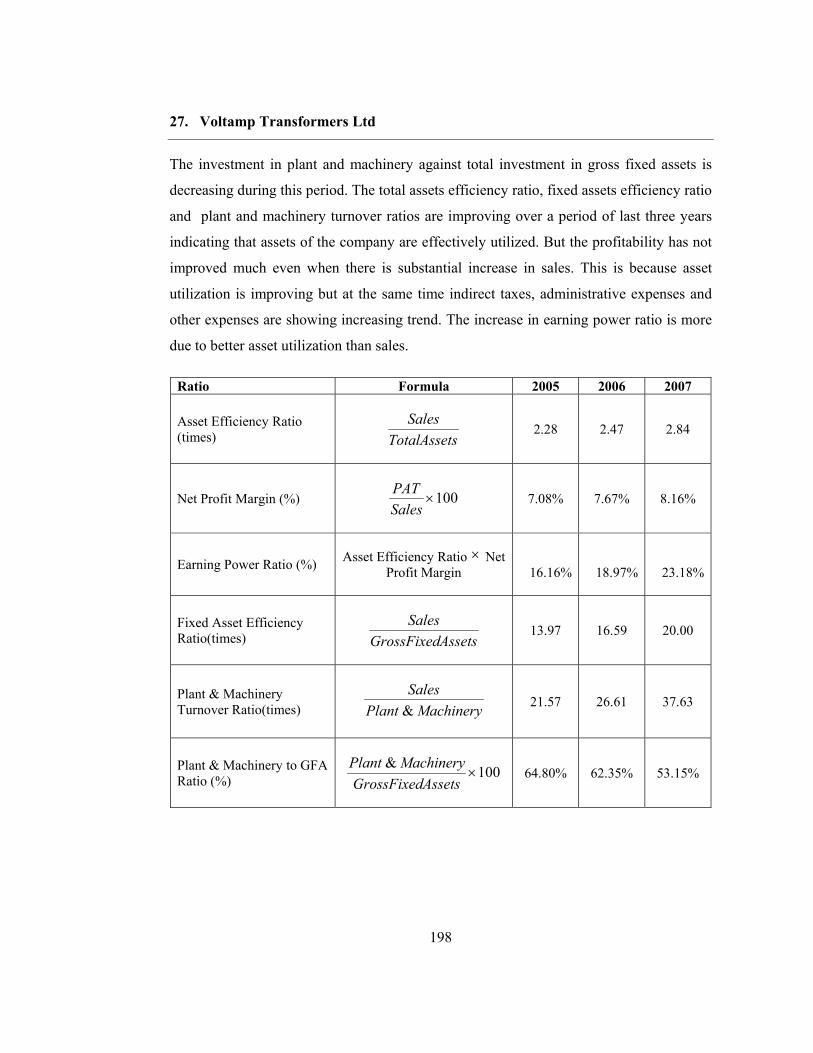
27. Voltamp Transformers Ltd
The investment in plant and machinery against total investment in gross fixed assets is
decreasing during this period. The total assets efficiency ratio, fixed assets efficiency ratio
and plant and machinery turnover ratios are improving over a period of last three years
indicating that assets of the company are effectively utilized. But the profitability has not
improved much even when there is substantial increase in sales. This is because asset
utilization is improving but at the same time indirect taxes, administrative expenses and
other expenses are showing increasing trend. The increase in earning power ratio is more
due to better asset utilization than sales.
Ratio Formula 2005 2006 2007
Asset Efficiency Ratio (times) sTotalAsset
Sales 2.28 2.47 2.84
Net Profit Margin (%) 100×SalesPAT
7.08% 7.67% 8.16%
Earning Power Ratio (%) Asset Efficiency Ratio × Net Profit Margin 16.16% 18.97% 23.18%
Fixed Asset Efficiency Ratio(times) AssetsGrossFixed
Sales
13.97 16.59 20.00
Plant & Machinery Turnover Ratio(times) MachineryPlant
Sales&
21.57 26.61 37.63
Plant & Machinery to GFA Ratio (%) 100&
×AssetsGrossFixed
MachineryPlant 64.80% 62.35% 53.15%

199
28. Wipro Limited
The asset efficiency ratio calculated below indicates that the ratio is marginally improving
over a period of last five years. The earning power ratio has improved negligibly is a
matter of concern because it indicates ineffective utilization of assets. The plant and
machinery turnover ratio has improved in this period but it has not reflected in terms of
significant increase in the profitability of the firm. The sound capital budgeting decision
would have improved fixed asset efficiency and in turn earning power ratio of the firm.
Ratio Formula 2003 2004 2005 2006 2007
Asset Efficiency Ratios (times) sTotalAsset
Sales 1.00 0.98 1.09 1.08 1.03
Net Profit Margin (%) 100×
SalesPAT
20.08% 17.62% 20.54% 19.69% 20.66%
Earning Power Ratio (%)
Asset Efficiency Ratio × Net Profit Margin 19.99% 17.31% 22.43% 21.25% 21.33%
Fixed Asset Efficiency Ratio(times) AssetsGrossFixed
Sales
3.22 3.52 3.61 3.45 3.26
Plant & Machinery Turnover Ratio(times)
MachineryPlantSales
& 5.94 7.10 7.66 7.63 7.79
Plant & Machinery to GFA Ratio (%)
100&×
AssetsGrossFixedMachineryPlant
54.24% 49.67% 47.19% 45.19% 41.78%
200
Conclusion:
As seen, in most cases since the co-efficient of relation R2 is significant (i.e. near to 1), it
can be stated that the variables plant and machinery and sales are exhaustive enough to
explain the variation in operating income of the company. Thus, our findings, through the
above analysis it can be stated that proper usage of capital budgeting techniques lead to
accurate decision for investment in fixed assets and hence better operating income
through the better capital budgeting practices. Further, in cases where R2 is not significant
(i.e. near to 1), future research can be carried out to find more significant / relevant
model.
The financial analysis reveals that the companies which use capital budgeting techniques
wisely have better asset-efficiency ratio and the plant and machinery turnover ratio and
ultimately a good earning power ratio. Further, Table 6.4 to 6.9 reveals that all the
companies are using more than one techniques of capital budgeting for evaluating the
various projects under consideration. Almost all the companies are using pay back period
method to evaluate the project from liquidity point of view and at the same time all the
companies are using at least one of the DCF techniques to assess the profitability of the
projects. This reflects the confidence level in any single method for decision-making.
Hence results of all methods are calibrated and decisions are taken.

201
Table 6.1 : Descriptive Statistics
Sr. No Name of the company
Operating Income Plant & Machinery Sales
Mean Standard
Deviation Mean Standard Deviation Mean
Standard Deviation
1 Alembic Limited 102.522 21.71 368.69 34.55 628.74 65.86
2 Arvind Mills Limited 381.64 36.34 1364.89 75.49 1637.24 149.48
3 Astrazeneca Pharma Indis Ltd 61.07 17.76 42.69 2.55 236.78 43.42
4 Atlas Copco Limited 89.75 40.2 37.57 2.33 545.71 208.66
5 Bajaj Hindustan Limited 172.73 159.24 805.68 737.23 806.03 437.75
6 Berger Paints Limited 95.57 26.67 104.86 29.35 967.88 264.79
7 Cadbury India Limited 118.75 19.46 294.84 30.76 967.13 142.84
8 Eimco Elecon Limited 19.68 4.23 64.02 16.18 90.79 7.17
9 Elecon Engineering Company Limited 49.98 42.24 148.14 35.62 408.34 276.24
10 Glaxo Smithkline Limited 194.7 35.82 295.77 10.76 1057.25 140.96
11 GMM Pfaudler Co. Limited 14.75 6.9 29.88 4.9 91.81 29.9512 GNFC Limited 446.9 144.74 2054.33 223.58 2033 610.913 Grasim Company Limited 1694.18 608.05 4934.99 376.87 7212.02 1609.7
14 Gujarat Alkalies Co. Limited 348.04 92.86 1586.44 122.59 990.37 197.64
202
Table 6.1 : Descriptive Statistics (contd…)
Sr. No Name of the company
Operating Income Plant & Machinery Sales
Mean Standard
Deviation Mean Standard Deviation Mean
Standard Deviation
15 Hipolin Limited 1.18 0.113 7.04 0.11 21.39 3.9716 J B Chemicals & Pharmaceuticals Ltd. 86.15 13.97 116.34 29.86 405.08 106.0917 KSB Pumps Limited 63.64 19.78 115.04 9.52 361.14 81.8518 L & T Company Limited 1481.15 515.91 2009.15 1417.45 13009.85 3756.919 Lanxess India (Pvt) Ltd 55.41 15.11 220.1 14.29 479.52 72.8520 ONGC Limited 23714.6 5947.76 71510.38 13602.88 44940.88 10937.0621 Panacea Biotec Limited 108.9 84.37 106.79 68.85 458.34 241.722 Siemens Limited 466.05 287.85 281.83 76.67 3840.94 2677.2123 Sun Pharma Limited 436.02 178.42 385.83 146.64 1160.45 379.1424 TATA Steel Limited 5070.7 2119.11 12254.97 1387.45 14895.624 4020.9325 Transpek India Limited 11.33 4.46 60.03 8.11 71.14 18.2226 Vadilal Enterprises Limited 3.7 1.08 28.01 3.41 113.81 10.5627 Voltamp Transformers Limited 37.74 22.37 10.25 2.49 282.58 151.1928 Wipro Limited 2110.97 1065.11 1094.83 457.07 8108.75 3944.33
203
Table 6.2 : Pearson Co-relations
Sr. No
Name of the company Operating Income
v/s Plant & Machinery
Operating Income v/s Sales
Plant & Machinery
v/s Sales
1 Alembic Limited 0.452 0.853 0.540 2 Arvind Mills Limited 0.610 0.729 0.618 3 Astrazeneca Pharma Indis Ltd 0.902 0.971 0.799
4 Atlas Copco Limited -0.683 0.960 -0.857 5 Bajaj Hindustan Limited 0.998 0.975 0.973 6 Berger Paints Limited 0.989 0.984 0.995 7 Cadbury India Limited 0.881 0.916 0.996 8 Eimco Elecon Limited 0.954 0.933 0.819 9 Elecon Engineering Company Limited 0.995 1.000 0.996 10 Glaxo Smithkline Limited 0.813 0.974 0.677 11 GMM Pfaudler Co. Limited 0.924 0.980 0.953 12 GNFC Limited 0.718 0.966 0.874 13 Grasim Company Limited 0.955 0.959 0.993 14 Gujarat Alkalies Co. Limited 0.541 0.930 0.811 15 Hipolin Limited 0.055 -0.458 0.454

204
Table 6.2 : Pearson Co-relations Sr. No
Name of the company Operating Income
v/s Plant & Machinery
Operating Income v/s Sales
Plant & Machinery
v/s Sales
16 J B Chemicals & Pharmaceuticals Ltd. 0.862 0.985 0.907 17 KSB Pumps Limited 0.989 0.995 0.990 18 L & T Company Limited -0.276 0.973 -0.460 19 Lanxess India (Pvt) Ltd -0.487 0.029 0.858 20 ONGC Limited 0.639 0.971 0.708 21 Panacea Biotec Limited 0.957 0.995 0.954 22 Siemens Limited 0.975 0.998 0.981 23 Sun Pharma Limited 0.963 0.998 0.971 24 TATA Steel Limited 0.849 0.987 0.917 25 Transpek India Limited 0.175 0.976 0.342 26 Vadilal Enterprises Limited 0.760 0.596 0.965 27 Voltamp Transformers Limited 0.909 0.996 0.942 28 Wipro Limited 0.996 0.998 0.996

205
Table 6.3 : Regression Data Analysis
Sr. No Name of the Company
Constant Plant & Machinery Sales R2 p-
value
Standard Error
of Estimate
B co-efficient
t (p-value)
β co-efficient
t (p-value)
β co-efficient
t (p-value)
1 Alembic Limited -72.873 -0.784 (0.515) -0.007 -0.026
(0.981) 0.283 1.961 (0.189) 0.728 0.272 16.01
2 Arvind Mills Limited -14.732 -0.048 (0.966) 0.124 0.44
(0.703) 0.138 0.968 (0.436) 0.573 0.427 33.59
3 Astrazeneca Pharma India Limited -109.727 -2.561
(0.237) 2.431 1.855 (0.315) 0.283 3.674
(0.169) 0.987 0.113 3.48
4 Atlas Copco Limited -400.072 -4.063 (0.154) 9.088 3.961
(0.157) 0.272 10.617 (0.060) 0.995 0.068 4.77
5 Bajaj Hindustan Limited -9.784 -0.384 (0.738) 0.201 4.891
(0.039) 0.026 0.376 (0.743) 0.996 0.004 13.97
6 Berger Paints Limited 1.195 0.111 (0.922) 0.841 0.873
(0.476) 0.006 0.06 (0.957) 0.978 0.022 5.66
7 Cadbury India Limited 235.041 2.141
(0.278) -2.713 -2.203
(0.271) 0.707 2.666 (0.228) 0.972 0.166 5.60
8 Eimco Elecon Limited -14.674 -2.025 (0.180) 0.15 3.250
(0.083) 0.273 2.616 (0.120) 0.979 0.021 0.86

206
Table 6.3 : Regression Data Analysis (contd…)
Sr. No Name of the Company
Constant Plant & Machinery Sales R2 p-
value
Standard Error
of Estimate
B co-efficient
t (p-value)
β co-efficient
t (p-value)
β co-efficient
t (p-value)
9 Elecon Engineering Company Limited -5.254 -0.195
(0.864) -0.075 -0.267 (0.815) 0.162 4.479
(0.046) 0.999 0.001 1.78
10 Glaxo Smithkline Limited 262.845 -1.868 (0.313) -0.941 -2.379
(0.253) 0.199 6.587 (0.096) 0.992 0.087 5.42
11 GMM Pfuadler Company Limited -3.399 -0.325 (0.776) -0.166 -0.258
(0.820) 0.252 2.398 (0.139) 0.962 0.038 1.90
12 GNFC Limited 465.054 22.091 (0.002) -0.344 -23.765
(0..002) 0.339 63.933 (0.00) 1.000 0.000 3.15
13 Grasim Company Limited -1777.72 -0.194 (0.864) 0.264 0.094
(0.934) 0.301 0.458 (0.692) 0.920 0.080 242.89
14 Gujarat Alkalies & Chemicals Ltd 429.287 9.502 (0.011) -0.472 -12.00
(0.007) 0.675 27.631 (0.001) 0.998 0.002 5.65
15 Hipolin Limited -0.848 -0.182 (0.872)
0.339 0.498
(0.668) -0.017
-0.915 (0.457)
0.291 0.703 0.133
16 J B Chemicals & Pharmaceuticals Ltd. 34.696 5.458
(0.032) -0.082 -0.658 (0.578) 0.151 4.293
(0.05) 0.975 0.025 3.14
17 KSB Pumps Limited -47.664 -0.464 (0.723) 0.333 0.239
(0.851) 0.202 1.247 (0.430) 0.991 0.092 3.17
207
Table 6.3 : Regression Data Analysis (contd…)
Sr. No Name of the Company
Constant Plant & Machinery Sales R2 p-
value
Standard Error
of Estimate
B co-efficient
t (p-value)
β co-efficient
t (p-value)
β co-efficient
t (p-value)
18 L & T Company Limited -592.688 -2.514 (0.128) 0.079 2.074
(0.174) 0.147 10.266 (0.009) 0.983 0.017 95.69
19 Lanxess India Pvt. Limited 338.398 14.781 (0.043) -2.051 13.227
(0.048) 0.351 11.544 (0.055) 0.994 0.075 1.97
20 ONGC Limited 1344.188 0.260 (0.819) -0.043 -0.425
(0.712) 0.566 4.533 (0.045) 0.948 0.052 1926.40
21 Panacea Biotec Limited -48.428 -3.722 (0.065) 0.105 0.375
(0.743) 0.319 4.017 (0.057) 0.991 0.009 11.47
22 Siemens Limited 125.602 0.867 (0.477) -0.412 -0.500
(0.667) 0.119 5.036 (0.037) 0.996 0.004 24.37
23 Sun Pharma Limited -115.441 -4.228 (0.052) -0.131 -0.585
(0.618) 0.519 5.982 (0.027) 0.996 0.004 15.60
24 TATA Steel Limited 1342.883 0.818 (0.499) -0.533 -2.544
(0.126) 0.689 9.526 (0.011) 0.995 0.006 232.29
25 Transpek India Limited -0.756 -0.228 (0.841) -0.099 -1.738
(0.224) 0.254 9.976 (0.010) 0.981 0.019 0.87
208
Table 6.3 : Regression Data Analysis (contd…)
Sr. No Name of the Company
Constant Plant & Machinery Sales R2 p-
value
Standard Error
of Estimate
B co-efficient
t (p-value)
β co-efficient
t (p-value)
β co-efficient
t (p-value)
26 Vadilal Enterprises Limted 3.079 0.769 (0.522) 0.852 2.59
(0.122) -0.204 -1.925 (0.194) 0.852 0.148 0.59
27 Voltamp Tansformers Limited 9.60 6.041
(0.104) -2.305
-8.860 (0.072)
0.183 42.688 (0.015)
1.00 0.010 0.378
27 Wipro Limited -182.78 -0.841 (0.489) 0.688 0.578
(0.622) 0.19 1.378 (0.302) 0.996 0.004 95.63

209
Table 6. 4 : Asset Efficiency Ratio
Sr. No Company Name 2003 2004 2005 2006 2007 CB Method used
1 Alembic Limited 1.08 1.09 0.90 0.95 0.79 NPV / PBP / PI
2 Arvind Mills Limited 0.58 0.49 0.53 0.44 0.49 IRR / NPV /PBP
3 Astrazeneca Pharma Indis Ltd 1.34 1.26 1.38 1.21 PBP / NPV
4 Atlas Copco (India) Limited 1.41 1.13 1.50 1.50 PBP / NPV
5 Bajaj Hindusthan Limited 2.48 1.24 0.92 0.69 0.45 IRR / NPV
6 Berger Paints India Limited 2.20 2.16 2.18 2.12 2.10 IRR / PBP / NPV
7 Cadbury India Limited 1.63 1.54 1.52 1.63 NPV / IRR /PBP /PI
8 EIMCO Elecon Co. Limited 0.87 0.65 0.60 0.57 0.69 NPV /IRR/ PBP
9 Elecon Engg Co. Limited 0.92 0.76 0.95 0.94 1.13 IRR / PBP / NPV
10 Glaxo Smithkline Limited 1.29 1.32 0.99 0.99 NPV / IRR /PBP
11 GMM Pfaudler Limited 0.87 0.93 0.92 1.07 0.93 NPV / PBP
12 GNFC Limited 0.70 0.74 0.82 0.92 0.87 PBP / NPV / IRR
13 Grasim Industires Limited 0.82 0.84 0.89 0.87 0.85 IRR / NPV
14 Gujarat Alkalies Co. Limited 0.48 0.52 0.71 0.66 0.67 IRR /PBP

210
Sr. No Company Name 2003 2004 2005 2006 2007 CB Method used
15 Hipolin Limited 1.13 1.33 0.92 1.58 1.59 na-
16 J B Chemicals & Pharmaceuticals Ltd. 1.01 0.90 0.91 0.95 0.77 IRR / PBP / NPV
17 KSB Pumps Limited 1.24 1.39 1.42 1.30 PBP / NPV
18 L&T Limited 0.76 1.11 1.22 1.14 1.03 NPV / IRR /PBP
19 Lanxess India (Pvt) Ltd 1.42 1.29 1.49 1.48 PBP / NPV / IRR
20 ONGC Limited 0.51 0.41 0.49 0.44 0.44 IRR / PBP /NPV
21 Panacea Biotec Limtied 0.97 0.62 0.72 0.54 0.81 IRR / NPV / PBP
22 Siemens Limited 0.98 0.98 1.04 1.08 1.39 IRR / PBP / NPV
23 Sun Pharmaceuticals Limited 0.91 0.62 0.32 0.38 0.44 IRR /PBP
24 TATA Steel Limited 0.74 0.86 0.95 0.89 0.62 IRR / PBP / NPV
25 Transpek Industires Limited 0.51 0.73 0.93 0.91 0.86 IRR / NPV / ARR
26 Vadilal Enterprises Limited 2.47 2.72 2.42 2.40 2.41 IRR / PBP / NPV / PI
27 Volt Amp Transformers Limited 2.21 2.28 2.47 2.84 PBP / PI
28 Wipro Limited 1.00 0.98 1.09 1.08 1.03 IRR / NPV
211
Table 6.5 : Net Profit Margin
Sr. No Company Name 2003 2004 2005 2006 2007 CB Method used
1 Alembic Limited 5.56% 5.09% 9.08% 11.78% 9.78% NPV / PBP / PI
2 Arvind Mills Limited 8.33% 6.64% 7.48% 7.83% 6.46% IRR / NPV /PBP
3 Astrazeneca Pharma India Ltd 12.50% 12.21% 17.47% 16.60% PBP / NPV
4 Atlas Copco (India) Limited 10.42% 5.26% 8.17% 9.00% PBP / NPV
5 Bajaj Hindusthan Limited 1.00% 6.19% 11.57% 15.74% 12.50% IRR / NPV
6 Berger Paints India Limited 4.99% 5.71% 5.49% 6.27% 6.26% IRR / PBP / NPV
7 Cadbury India Limited 5.52% 5.22% 4.57% 5.98% NPV / IRR /PBP /PI
8 EIMCO Elecon Co. Limited 6.05% 8.77% 8.94% 8.94% 8.93% NPV /IRR/ PBP
9 Elecon Engg Co. Limited 0.95% 1.16% 3.04% 5.50% 6.52% IRR / PBP / NPV
10 Glaxo Smithkline Limited 8.37% 7.41% 9.81% 10.26% NPV / IRR /PBP
11 GMM Pfaudler Limited 4.05% 9.27% 8.41% 10.67% 9.41% NPV / PBP
12 GNFC Limited 5.78% 7.52% 11.80% 12.90% 11.02% PBP / NPV / IRR
13 Grasim Industires Limited 6.77% 12.70% 12.28% 11.27% 15.96% IRR / NPV
14 Gujarat Alkalies Co. Limited 3.67% 7.77% 13.76% 18.08% 15.13% IRR /PBP
212
Sr. No Company Name 2003 2004 2005 2006 2007 CB Method used
15 Hipolin Limited 1.09% 1.53% 3.08% 1.34% 0.13% na-
16 J B Chemicals & Pharmaceuticals Ltd. 16.23% 15.90% 15.68% 14.75% 12.98% IRR / PBP / NPV
17 KSB Pumps Limited 6.96% 9.22% 9.50% 11.18% PBP / NPV
18 L&T Limited 4.93% 5.38% 7.35% 6.73% 7.80% NPV / IRR /PBP
19 Lanxess India (Pvt) Ltd 6.41% 8.22% 3.41% 4.73% PBP / NPV / IRR
20 ONGC Limited 29.84% 26.19% 27.71% 28.98% 26.21% IRR / PBP /NPV
21 Panacea Biotec Limited 7.45% 6.01% 8.87% 11.11% 17.42% IRR / NPV / PBP
22 Siemens Limited 9.22% 7.90% 8.71% 7.51% 7.40% IRR / PBP / NPV
23 Sun Pharmaceuticals Limited 29.30% 26.95% 29.34% 34.09% 36.52% IRR /PBP
24 TATA Steel Limited 10.34% 14.65% 21.89% 20.47% 21.36% IRR / PBP / NPV
25 Transpek Industires Limited -6.91% 4.13% 6.92% 5.83% 5.23% IRR / NPV / ARR
26 Vadilal Enterprises Limited -0.02% -0.80% 0.36% 0.23% 0.23% IRR / PBP / NPV / PI
27 Volt Amp Transformers Limited 7.47% 7.08% 7.67% 8.16% PBP / PI
28 Wipro Limited 20.08% 17.62% 20.54% 19.69% 20.66% IRR / NPV
213
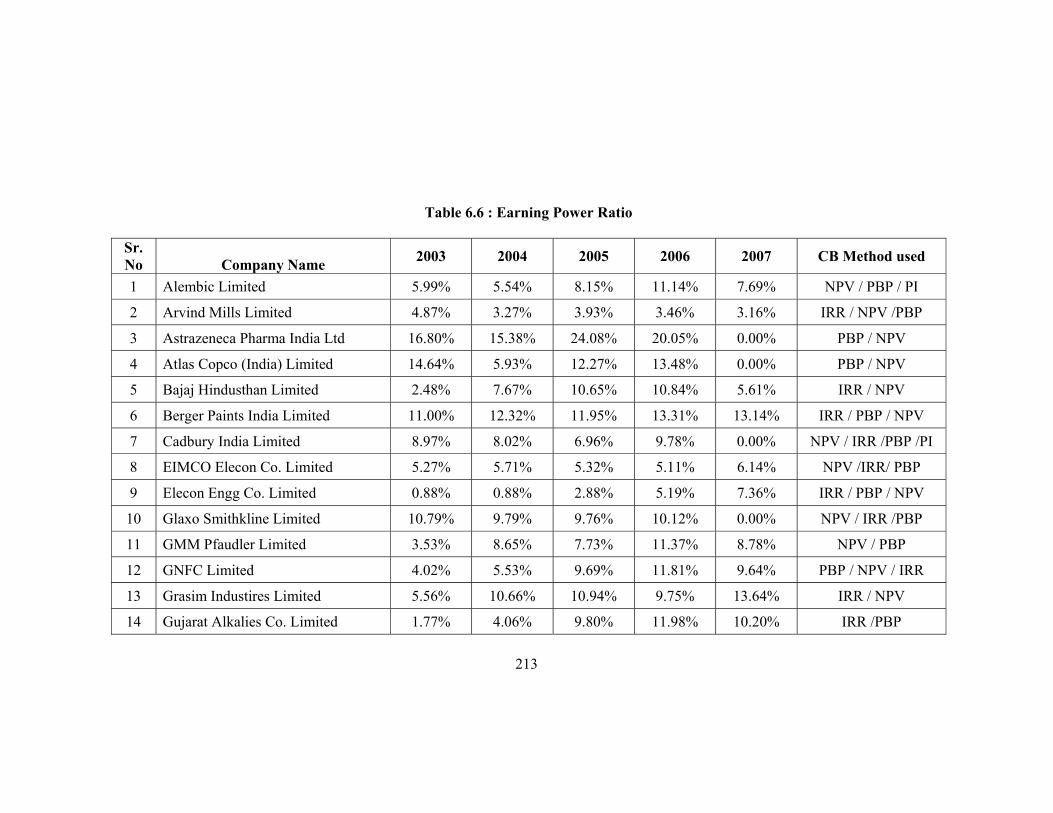
Table 6.6 : Earning Power Ratio
Sr. No Company Name 2003 2004 2005 2006 2007 CB Method used
1 Alembic Limited 5.99% 5.54% 8.15% 11.14% 7.69% NPV / PBP / PI
2 Arvind Mills Limited 4.87% 3.27% 3.93% 3.46% 3.16% IRR / NPV /PBP
3 Astrazeneca Pharma India Ltd 16.80% 15.38% 24.08% 20.05% 0.00% PBP / NPV
4 Atlas Copco (India) Limited 14.64% 5.93% 12.27% 13.48% 0.00% PBP / NPV
5 Bajaj Hindusthan Limited 2.48% 7.67% 10.65% 10.84% 5.61% IRR / NPV
6 Berger Paints India Limited 11.00% 12.32% 11.95% 13.31% 13.14% IRR / PBP / NPV
7 Cadbury India Limited 8.97% 8.02% 6.96% 9.78% 0.00% NPV / IRR /PBP /PI
8 EIMCO Elecon Co. Limited 5.27% 5.71% 5.32% 5.11% 6.14% NPV /IRR/ PBP
9 Elecon Engg Co. Limited 0.88% 0.88% 2.88% 5.19% 7.36% IRR / PBP / NPV
10 Glaxo Smithkline Limited 10.79% 9.79% 9.76% 10.12% 0.00% NPV / IRR /PBP
11 GMM Pfaudler Limited 3.53% 8.65% 7.73% 11.37% 8.78% NPV / PBP
12 GNFC Limited 4.02% 5.53% 9.69% 11.81% 9.64% PBP / NPV / IRR
13 Grasim Industires Limited 5.56% 10.66% 10.94% 9.75% 13.64% IRR / NPV
14 Gujarat Alkalies Co. Limited 1.77% 4.06% 9.80% 11.98% 10.20% IRR /PBP

214
Sr. No Company Name 2003 2004 2005 2006 2007 CB Method used
15 Hipolin Limited 1.24% 2.02% 2.85% 2.12% 0.20% na-
16 J B Chemicals & Pharmaceuticals Ltd. 16.47% 14.26% 14.33% 13.98% 10.05% IRR / PBP / NPV
17 KSB Pumps Limited 8.66% 12.78% 13.51% 14.54% 0.00% PBP / NPV
18 L&T Limited 3.76% 5.95% 8.94% 7.66% 8.06% NPV / IRR /PBP
19 Lanxess India (Pvt) Ltd 9.12% 10.63% 5.08% 7.02% 0.00% PBP / NPV / IRR
20 ONGC Limited 15.25% 10.79% 13.67% 12.62% 11.43% IRR / PBP /NPV
21 Panacea Biotec Limtied 7.23% 3.72% 6.35% 6.00% 14.10% IRR / NPV / PBP
22 Siemens Limited 8.99% 7.78% 9.02% 8.13% 10.28% IRR / PBP / NPV
23 Sun Pharmaceuticals Limited 26.55% 16.75% 9.49% 12.79% 16.24% IRR /PBP
24 TATA Steel Limited 7.63% 12.53% 20.81% 18.21% 13.15% IRR / PBP / NPV
25 Transpek Industires Limited -3.50% 3.03% 6.41% 5.28% 4.48% IRR / NPV / ARR
26 Vadilal Enterprises Limited -0.05% -2.17% 0.86% 0.55% 0.55% IRR / PBP / NPV / PI
27 Volt Amp Transformers Limited 0.00% 16.50% 16.16% 18.97% 23.18% PBP / PI
28 Wipro Limited 19.99% 17.31% 22.43% 21.25% 21.33% IRR / NPV
215
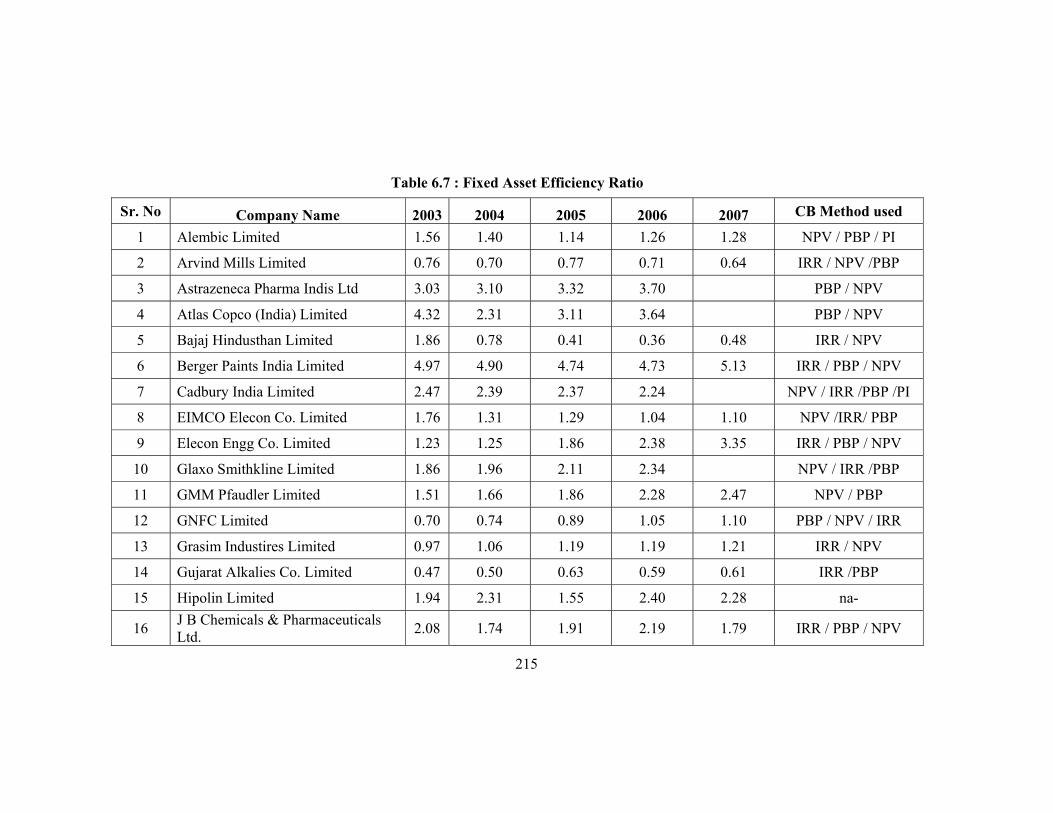
Table 6.7 : Fixed Asset Efficiency Ratio
Sr. No Company Name 2003 2004 2005 2006 2007 CB Method used
1 Alembic Limited 1.56 1.40 1.14 1.26 1.28 NPV / PBP / PI
2 Arvind Mills Limited 0.76 0.70 0.77 0.71 0.64 IRR / NPV /PBP
3 Astrazeneca Pharma Indis Ltd 3.03 3.10 3.32 3.70 PBP / NPV
4 Atlas Copco (India) Limited 4.32 2.31 3.11 3.64 PBP / NPV
5 Bajaj Hindusthan Limited 1.86 0.78 0.41 0.36 0.48 IRR / NPV
6 Berger Paints India Limited 4.97 4.90 4.74 4.73 5.13 IRR / PBP / NPV
7 Cadbury India Limited 2.47 2.39 2.37 2.24 NPV / IRR /PBP /PI
8 EIMCO Elecon Co. Limited 1.76 1.31 1.29 1.04 1.10 NPV /IRR/ PBP
9 Elecon Engg Co. Limited 1.23 1.25 1.86 2.38 3.35 IRR / PBP / NPV
10 Glaxo Smithkline Limited 1.86 1.96 2.11 2.34 NPV / IRR /PBP
11 GMM Pfaudler Limited 1.51 1.66 1.86 2.28 2.47 NPV / PBP
12 GNFC Limited 0.70 0.74 0.89 1.05 1.10 PBP / NPV / IRR
13 Grasim Industires Limited 0.97 1.06 1.19 1.19 1.21 IRR / NPV
14 Gujarat Alkalies Co. Limited 0.47 0.50 0.63 0.59 0.61 IRR /PBP
15 Hipolin Limited 1.94 2.31 1.55 2.40 2.28 na-
16 J B Chemicals & Pharmaceuticals Ltd. 2.08 1.74 1.91 2.19 1.79 IRR / PBP / NPV

216
Sr. No Company Name 2003 2004 2005 2006 2007 CB Method used
17 KSB Pumps Limited 1.89 2.24 2.57 2.49 PBP / NPV
18 L&T Limited 1.39 4.99 6.37 5.82 5.38 NPV / IRR /PBP
19 Lanxess India (Pvt) Ltd 1.58 1.80 1.73 2.02 PBP / NPV / IRR
20 ONGC Limited 0.60 0.50 0.48 0.61 0.66 IRR / PBP /NPV
21 Panacea Biotec Limtied 2.24 1.85 1.77 1.80 1.66 IRR / NPV / PBP
22 Siemens Limited 2.73 3.47 5.23 5.98 8.36 IRR / PBP / NPV
23 Sun Pharmaceuticals Limited 1.94 1.67 1.58 1.75 1.98 IRR /PBP
24 TATA Steel Limited 0.79 0.90 1.06 1.04 1.07 IRR / PBP / NPV
25 Transpek Industires Limited 0.69 0.85 1.15 1.10 0.96 IRR / NPV / ARR
26 Vadilal Enterprises Limited 3.80 3.81 3.52 3.64 3.59 IRR / PBP / NPV / PI
27 Volt Amp Transformers Limited 11.30 13.97 16.59 20.00 PBP / PI
28 Wipro Limited 3.22 3.52 3.61 3.45 3.26 IRR / NPV

217
Table 6.8 : Plant & Machinery Turnover Ratio
Sr. No Company Name 2003 2004 2005 2006 2007 CB Method used
1 Alembic Limited 1.84 1.63 1.49 1.69 1.90 NPV / PBP / PI
2 Arvind Mills Limited 1.22 1.12 1.24 1.11 1.31 IRR / NPV /PBP
3 Astrazeneca Pharma Indis Ltd 4.97 5.03 5.46 6.63 PBP / NPV
4 Atlas Copco (India) Limited 7.98 11.89 16.41 22.86 PBP / NPV
5 Bajaj Hindusthan Limited 2.92 1.40 1.05 0.92 0.76 IRR / NPV
6 Berger Paints India Limited 9.30 9.41 9.32 8.85 9.37 IRR / PBP / NPV
7 Cadbury India Limited 3.14 3.19 3.28 3.46 NPV / IRR /PBP /PI
8 EIMCO Elecon Co. Limited 2.05 1.49 1.47 1.18 1.24 NPV /IRR/ PBP
9 Elecon Engg Co. Limited 1.57 1.57 2.32 3.07 4.18 IRR / PBP / NPV
10 Glaxo Smithkline Limited 3.01 3.22 3.86 4.25 NPV / IRR /PBP
11 GMM Pfaudler Limited 2.40 2.69 2.81 3.46 3.69 NPV / PBP
12 GNFC Limited 0.75 0.80 0.99 1.15 1.21 PBP / NPV / IRR
13 Grasim Industires Limited 1.20 1.30 1.48 1.52 1.74 IRR / NPV
14 Gujarat Alkalies Co. Limited 0.51 0.54 0.68 0.70 0.68 IRR /PBP

218
Sr. No Company Name 2003 2004 2005 2006 2007 CB Method used
15 Hipolin Limited 2.75 3.26 2.20 3.50 3.37 na-
16 J B Chemicals & Pharmaceuticals Ltd. 3.74 2.98 3.36 4.03 3.36 IRR / PBP / NPV
17 KSB Pumps Limited 2.51 3.01 3.36 3.57 3.32 PBP / NPV
18 L&T Limited 1.95 9.83 10.30 10.42 9.95 NPV / IRR /PBP
19 Lanxess India (Pvt) Ltd 1.91 2.25 2.09 2.43 PBP / NPV / IRR
20 ONGC Limited 0.65 0.53 0.53 0.68 0.76 IRR / PBP /NPV
21 Panacea Biotec Limited 8.03 3.53 3.80 4.90 3.84 IRR / NPV / PBP
22 Siemens Limited 6.73 7.93 12.32 16.22 19.65 IRR / PBP / NPV
23 Sun Pharmaceuticals Limited 3.92 3.04 2.74 2.81 3.01 IRR /PBP
24 TATA Steel Limited 0.90 1.06 1.36 1.27 1.42 IRR / PBP / NPV
25 Transpek Industries Limited 0.77 1.00 1.52 1.44 1.24 IRR / NPV / ARR
26 Vadilal Enterprises Limited 4.27 4.24 3.90 4.04 3.93 IRR / PBP / NPV / PI
27 Volt Amp Transformers Limited 19.02 21.57 26.61 37.63 PBP / PI
28 Wipro Limited 5.94 7.10 7.66 7.63 7.79 IRR / NPV

219
Table 6.9 : Plant & Machinery to GFA Ratio
Sr. No Company Name Mar 2003 Mar 2004 Mar 2005 Mar 2006 Mar 2007 CB Method used
1 Alembic Limited 84.71% 86.06% 76.43% 74.59% 67.43% NPV / PBP / PI
2 Arvind Mills Limited 62.29% 62.78% 61.88% 64.19% 48.99% IRR / NPV /PBP
3 Astrazeneca Pharma Indis Ltd 61.00% 61.54% 60.71% 55.79% PBP / NPV
4 Atlas Copco (India) Limited 54.12% 19.46% 18.96% 15.94% PBP / NPV
5 Bajaj Hindusthan Limited 63.58% 55.74% 39.22% 38.56% 63.08% IRR / NPV
6 Berger Paints India Limited 53.48% 52.08% 50.85% 53.42% 54.76% IRR / PBP / NPV
7 Cadbury India Limited 78.41% 74.73% 72.20% 64.80% NPV / IRR /PBP /PI
8 EIMCO Elecon Co. Limited 85.93% 87.87% 87.25% 88.75% 89.21% NPV /IRR/ PBP
9 Elecon Engg Co. Limited 78.58% 79.27% 80.20% 77.51% 80.13% IRR / PBP / NPV
10 Glaxo Smithkline Limited 61.64% 60.71% 54.67% 55.07% NPV / IRR /PBP
11 GMM Pfaudler Limited 63.05% 61.75% 66.15% 65.81% 66.96% NPV / PBP
12 GNFC Limited 93.41% 93.05% 90.43% 91.44% 90.74% PBP / NPV / IRR
13 Grasim Industires Limited 81.04% 81.12% 80.22% 78.59% 69.20% IRR / NPV
14 Gujarat Alkalies Co. Limited 93.80% 93.74% 91.98% 84.27% 88.95% IRR /PBP

220
Sr. No Company Name Mar 2003 Mar 2004 Mar 2005 Mar 2006 Mar 2007 CB Method used
15 Hipolin Limited 70.58% 70.82% 70.48% 68.71% 67.66% na-
16 J B Chemicals & Pharmaceuticals Ltd. 55.69% 58.29% 56.77% 54.30% 53.18% IRR / PBP / NPV
17 KSB Pumps Limited 75.51% 74.39% 76.52% 69.68% PBP / NPV
18 L&T Limited 71.24% 50.71% 61.82% 55.86% 54.09% NPV / IRR /PBP
19 Lanxess India (Pvt) Ltd 82.39% 79.70% 82.60% 83.17% PBP / NPV / IRR
20 ONGC Limited 93.43% 93.85% 91.34% 89.63% 87.69% IRR / PBP /NPV
21 Panacea Biotec Limtied 27.91% 52.23% 46.62% 36.76% 43.36% IRR / NPV / PBP
22 Siemens Limited 40.66% 43.73% 42.43% 36.89% 42.56% IRR / PBP / NPV
23 Sun Pharmaceuticals Limited 49.40% 54.79% 57.79% 62.10% 65.62% IRR /PBP
24 TATA Steel Limited 88.14% 84.42% 78.04% 82.16% 75.67% IRR / PBP / NPV
25 Transpek Industires Limited 88.59% 85.32% 75.61% 76.62% 77.21% IRR / NPV / ARR
26 Vadilal Enterprises Limited 88.97% 89.84% 90.26% 90.07% 91.21% IRR / PBP / NPV / PI
27 Volt Amp Transformers Limited 59.44% 64.80% 62.35% 53.15% PBP / PI
28 Wipro Limited 54.24% 49.67% 47.19% 45.19% 41.78% IRR / NPV