INTRODUCTION · 2020-05-21 · INTRODUCTION What is a Joint Strategic Needs Assessment? The JSNA is...
84
1
Transcript of INTRODUCTION · 2020-05-21 · INTRODUCTION What is a Joint Strategic Needs Assessment? The JSNA is...

1

2
INTRODUCTION
What is a Joint Strategic Needs Assessment?
The JSNA is statutory process for Health & Wellbeing Boards (HWBB) to identify and
improve the current and future health, wellbeing and social care needs of their area. The
purpose is to inform strategic decision making, commissioning of services and reduce
inequalities for all ages. There is no set format, prescribed content or specific time-period
that a JSNA must cover, only that one must be produced in partnership with HWBB member
organisations.
For the 2019 JSNA, the Health & Wellbeing Board is using a ‘place-based’ approach for the
suite of JSNA products which will look at issues and needs at smaller local geographies.
These geographies serve as building blocks to satisfy the need for intelligence at local
authority and NHS geographical area and include:
• NHS/LA Locality/Neighbourhood Profiles • District/Borough Council Profiles • A Countywide Report • Specialist Topic Deep Dive Reports (ESCG to develop) This document presents data from a range of key topics which contribute to the overall the health and wellbeing of residents, in order to highlight areas of inequality and identify opportunities to improve the healthy lives for residents across the Essex County Council Local Authority area, with information also available separately for each of the 12 Districts and Boroughs where relevant. Key findings from this and the 12 individual Local Authority Profiles will be used to identify issues that the Health and Wellbeing Board may wish to consider when refreshing the Joint Health and Wellbeing Strategy.
Notes of Terminology: This document uses the term Essex to refer to the Essex County Council local authority area which does not include the Southend-on-Sea and Thurrock unitary authority areas. The term Colchester is used to refer to the whole local authority area.
CONTENTS NO. SECTION PAGE
1 KEY FINDINGS 3
2 POPULATION & DEMOGRAPHICS 7
3 ACCESS TO SERVICES 20
4 WIDER DETERMINANTS OF HEALTH 25
5 LIFESTYLE, SEXUAL HEALTH & SUBSTANCE MISUSE 40
6 LIFE EXPECTANCY & MORTALITY 50
7 BIRTH RATES AND INFANT HEALTH 58
8 ILLNESS & HOSPITAL ADMISSIONS 63
9 MENTAL HEALTH 80

3

4
THE TOP THREE THINGS TO KNOW ABOUT… POPULATION AND DEMOGRAPHICS
• In 2018, the total population of the Colchester Borough local authority area was an estimated 192,523 people making it the largest local authority area in Essex in terms of population size. This is an estimated increase of 5,888 people since the 2011 census (a rise of 3.15%)
• The Colchester Borough is similar to the county average for Children and Young aged 0-15 (18.8%), but with a higher rate of 16 to 64 years olds (64%) and smaller proportion of older people aged 65+ (17.2%) compared to the Essex average (18.9%, 60.6%, 20.5%). This was also the third lowest proportion of older people in Essex.
• Colchester has an Old Age Dependency Ratio of 266.4 people age 65+ to every 1000 working age. This is equivalent to 3.75 working age people to every one person aged 65 and over and is below the average for Essex as a whole (335.6) and England (286.8).
ACCESS TO SERVICES
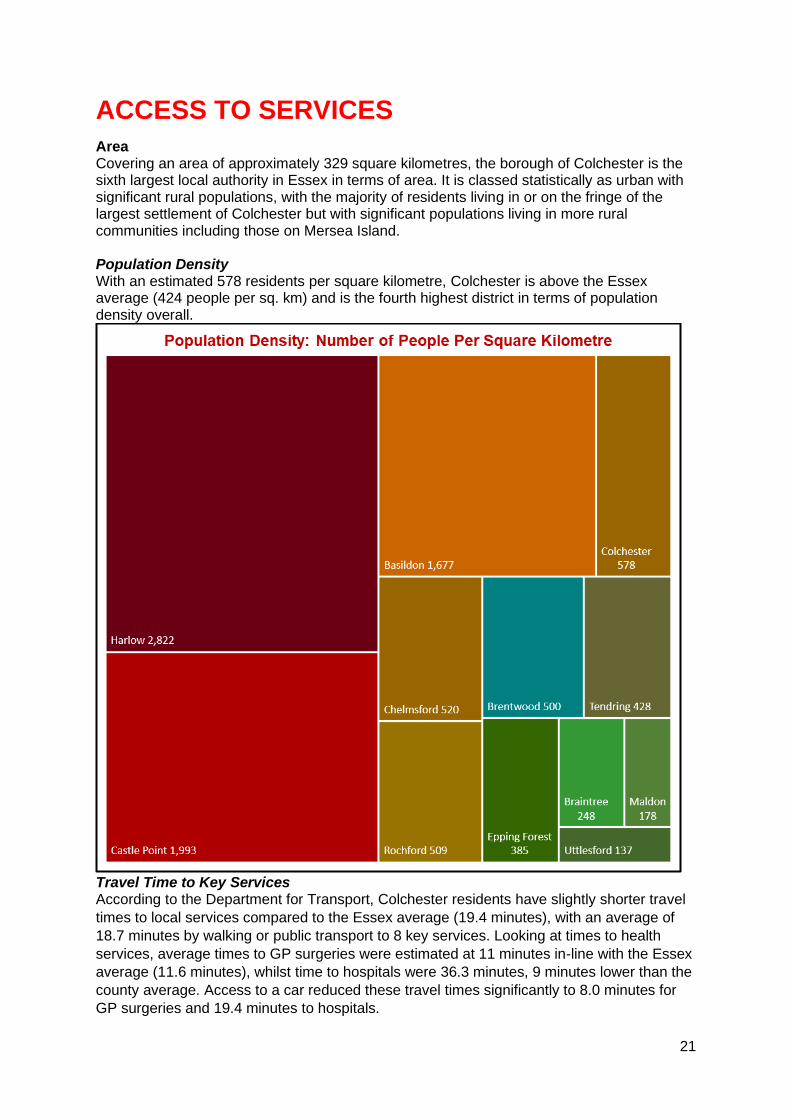
• Covering an area of approximately 329 square kilometres, the borough of Colchester is the sixth largest local authority in Essex in terms of area.
• With an estimated 578 residents per square kilometre, Colchester is above the Essex average (424 people per sq. km) and is the fourth highest district in terms of population density overall.
• Colchester residents have slightly shorter travel times to local services compared to the Essex average (19.4 minutes), with an average of 18.7 minutes by walking or public transport to 8 key services. Looking at times to health services, average times to GP surgeries were estimated at 11 minutes in-line with the Essex average (11.6 minutes), whilst time to hospitals were 36.3 minutes, 9 minutes lower than the county average.
WIDER DETERMINANTS OF HEALTH
• The average weekly income for a Colchester resident working full time in 2018 was £570.40, £48.20 (-8.45%) lower than the average for Essex and £4.50 (-0.8%) lower than the average for England. This was the third lowest average income out of 12 Districts.
• In 2018, 65.3% of pupils achieved grade 9-4 in English and Maths (a good pass) and 43.6% achieved grade 9-5 (a strong pass) at GCSE. This is higher than the England average (59.1%, 39.9%) and Essex (63.3% and 40.7%).
• The amount of residents claiming out of work benefits is lower than average but has increased to its highest level in 5 years from 1.2% in April 2015 to 1.8% in April 2019. This is lower than the averages for Essex (2.1%) and England (2.6%) but is the (joint) fifth highest claimant rate in Essex overall
5
LIFESTYLE, SEXUAL HEALTH & SUBSTANCE MISUSE
• In 2017/18 that 21.6% of pupils in Reception year were classed as overweight or obese. This lower than the level for England but higher than Essex. The sample of pupils in Year 6 showed that 29.8% of pupils in this year group were classed as overweight or obese, lower than England and Essex.
• Of residents aged over 18 years, 64.36% were classified as overweight or obese in 2016/17. This is relatively similar to the prevalence of adult overweight or obesity across the whole of Essex (63.56%), but higher than England (61.29%).
• According to the Office for National Statistics, the age-standardised mortality rate from drug misuse per 100,000 population in Colchester was 5.59 over the period of 2015 - 2017. This was the second highest rate compared across that of the other Districts in Essex.
LIFE EXPECTANCY & MORTALITY
• The average life expectancy at birth for a child born in Colchester (2015-2017) was 83.2 years for females and 80 years for males. This is just above the average for England for both sexes (Females = 83.1, Males = 79.6).
• Life expectancy at age 65 (the number of additional years a person could expect to live) was 21.1 years for females and 18.8 years for males, the same as the England average for both sexes (Females = 21.1, Males 18.8).
• The level of Excess Winter Deaths specifically in the over 85s age group shows a level of 36.8% Excess Winter Deaths for 2014-2017. This is higher than the England rate of 29.3% and the county average of 31.7% and is the 4th highest level in the county
BIRTH RATES & INFANT HEALTH
• In Colchester in 2016, the percentage of low birth weight out of all live births with a recorded weight (and gestational age >=37 weeks) was 2.50. This was the third highest out of the other Districts in Essex, but similar to that for Essex as a whole (2.11) and England (2.79).
• The percentage of breastfeeding initiation of the total number of maternities in Colchester in 2016/17 was 82.02%. This was the second highest compared across the Essex Districts with data available, and significantly higher than that for the whole of Essex (75.02) and England (74.49).
• The percentage of mothers known to be smokers at the time of delivery out of all maternities was 14.70 in the North East Essex CCG in 2017/18. This was the highest (with Tendring) compared across the other CCGs in Essex, and significantly higher than that for Essex as a whole (10.60) and England (10.80).
6
ILLNESS & HOSPITAL ADMISSIONS
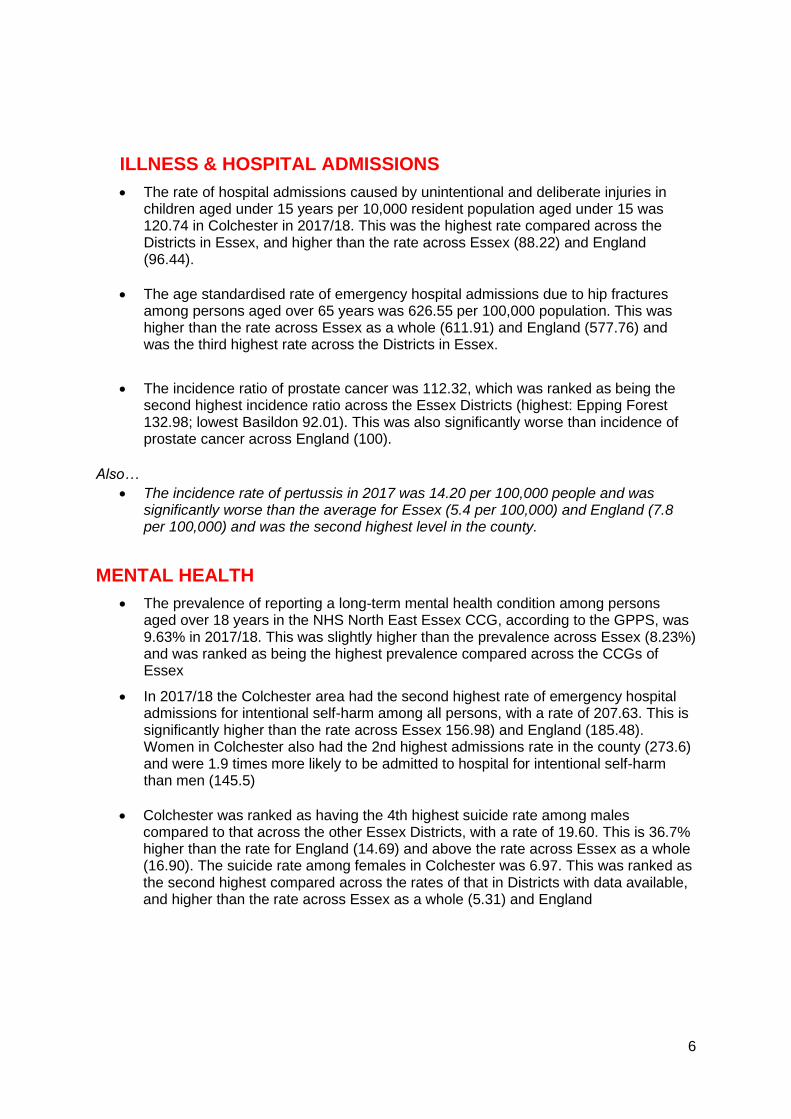
• The rate of hospital admissions caused by unintentional and deliberate injuries in children aged under 15 years per 10,000 resident population aged under 15 was 120.74 in Colchester in 2017/18. This was the highest rate compared across the Districts in Essex, and higher than the rate across Essex (88.22) and England (96.44).
• The age standardised rate of emergency hospital admissions due to hip fractures among persons aged over 65 years was 626.55 per 100,000 population. This was higher than the rate across Essex as a whole (611.91) and England (577.76) and was the third highest rate across the Districts in Essex.
• The incidence ratio of prostate cancer was 112.32, which was ranked as being the second highest incidence ratio across the Essex Districts (highest: Epping Forest 132.98; lowest Basildon 92.01). This was also significantly worse than incidence of prostate cancer across England (100).
Also…
• The incidence rate of pertussis in 2017 was 14.20 per 100,000 people and was significantly worse than the average for Essex (5.4 per 100,000) and England (7.8 per 100,000) and was the second highest level in the county.
MENTAL HEALTH
• The prevalence of reporting a long-term mental health condition among persons aged over 18 years in the NHS North East Essex CCG, according to the GPPS, was 9.63% in 2017/18. This was slightly higher than the prevalence across Essex (8.23%) and was ranked as being the highest prevalence compared across the CCGs of Essex
• In 2017/18 the Colchester area had the second highest rate of emergency hospital admissions for intentional self-harm among all persons, with a rate of 207.63. This is significantly higher than the rate across Essex 156.98) and England (185.48). Women in Colchester also had the 2nd highest admissions rate in the county (273.6) and were 1.9 times more likely to be admitted to hospital for intentional self-harm than men (145.5)
• Colchester was ranked as having the 4th highest suicide rate among males compared to that across the other Essex Districts, with a rate of 19.60. This is 36.7% higher than the rate for England (14.69) and above the rate across Essex as a whole (16.90). The suicide rate among females in Colchester was 6.97. This was ranked as the second highest compared across the rates of that in Districts with data available, and higher than the rate across Essex as a whole (5.31) and England
7

8
POPULATION & DEMOGRAPHICS
Population Growth
According to the Office of National Statistics in 2018, the total population of the Colchester
Borough local authority area was an estimated 192,523 people making it the largest local
authority area in Essex in terms of population size. This is an estimated increase of 5,888
people since the 2011 census (a rise of 3.15%) which is lower than had previously been
predicted by the Office of National Statistics in earlier mid-year estimates. The overall growth
rate was lower than the growth rate for England (5.59%) but was higher than the average for
Essex (1.54%) and was the second highest growth rate in 2019 out of 12 Districts
Looking forward, the Office of National Statistics population projections (2016 based) predict
that by 2034 the total population will increase by another 32,302 people to a total of 222,400.
Age Split
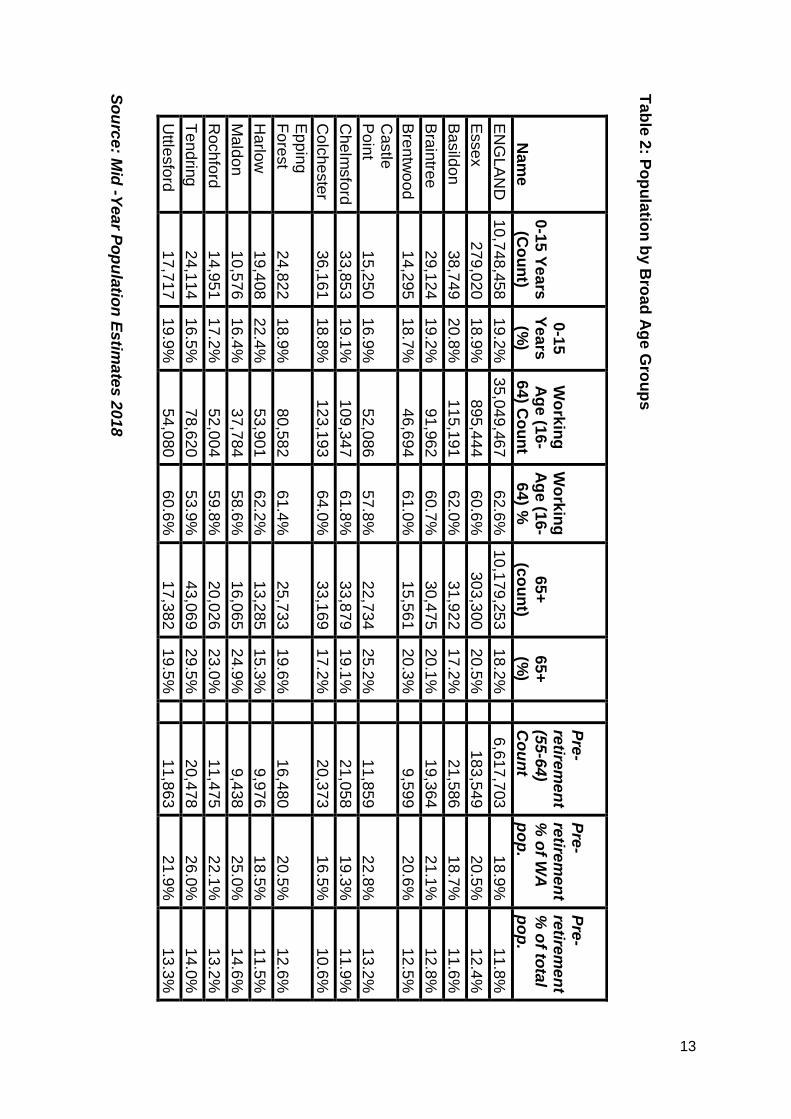
The Colchester Borough is similar to the county average for Children and Young aged 0-15
(18.8%), but with a higher rate of 16 to 64 years olds (64%) and smaller proportion of older
people aged 65+ (17.2%) compared to the Essex average (18.9%, 60.6%, 20.5%). This was
also the third lowest proportion of older people in Essex.
Over the next 15 years the age spilt of the population will change slightly with a small
increase in the proportion of Older People (rising to 18%), and a small decrease in the
percentage of young people aged 0-17 (18%). The Percentage of residents aged 18 to 64
will reduce slightly (63.5%). Despite this small shift, the Colchester local authority area will
have a lower percentage of older people compared to the predicted average for Essex
(22.6%) in 2034.

9
Essex Colchester
2024
Total Population 1549200 205300
Under 18 292989 18.9% 39157 19.1%
18-64 936049 60.4% 131273 63.9%
65+ 320162 20.7% 34869 17.0%
2029
Total Population 1602700 214800
Under 18 295387 18.4% 39868 18.6%
18-64 972743 60.7% 138500 64.5%
65+ 334570 20.9% 36432 17.0%
2034
Total Population 1650800 222600
Under 18 296076 17.9% 40305 18.1%
18-64 981362 59.4% 141460 63.5%
65+ 373362 22.6% 40836 18.3%
Old Age Dependency Ratio
A useful measure to understand how the balance in the population will change, particularly when planning for the needs of the aging population is the old age dependency ratio (OADR) – the number of people over 65 years old for every 1,000 people aged between 16 and 64 years old. Compared to other areas in Essex, Colchester has the second lowest OADR in Essex with an estimated rate of 266.4 in 2019, equivalent to 3.75 working age people to every one person aged 65 and over. This is below the average for Essex as a whole (335.6) but higher than the average for England (286.8). By 2034 this rate is predicted to rise to 288.7 per 1000, below the total rate for Essex (380.4) and the rate for England (334.2).

10
Ethnicity
At the time of the 2011 census the population of the Colchester Borough was majority White
British (87.5%) with the remainder (12.5%) of residents coming from Black and Minority
Ethnic (BAME) ethnic groups including white non-British residents. The percentage of BAME
residents was slightly higher than the average for Essex (9.2%) but was significantly lower
than the average for England (20.3%) and was the third most ethnically diverse district in
2011.
Researchers note: The Office of National Statistics does not produce modelled estimates or projected figures by ethnic group; as such the only comprehensively available figures are taken from the 2011 Census. Given the age of this data caution is advised when generalising to the current population.
11
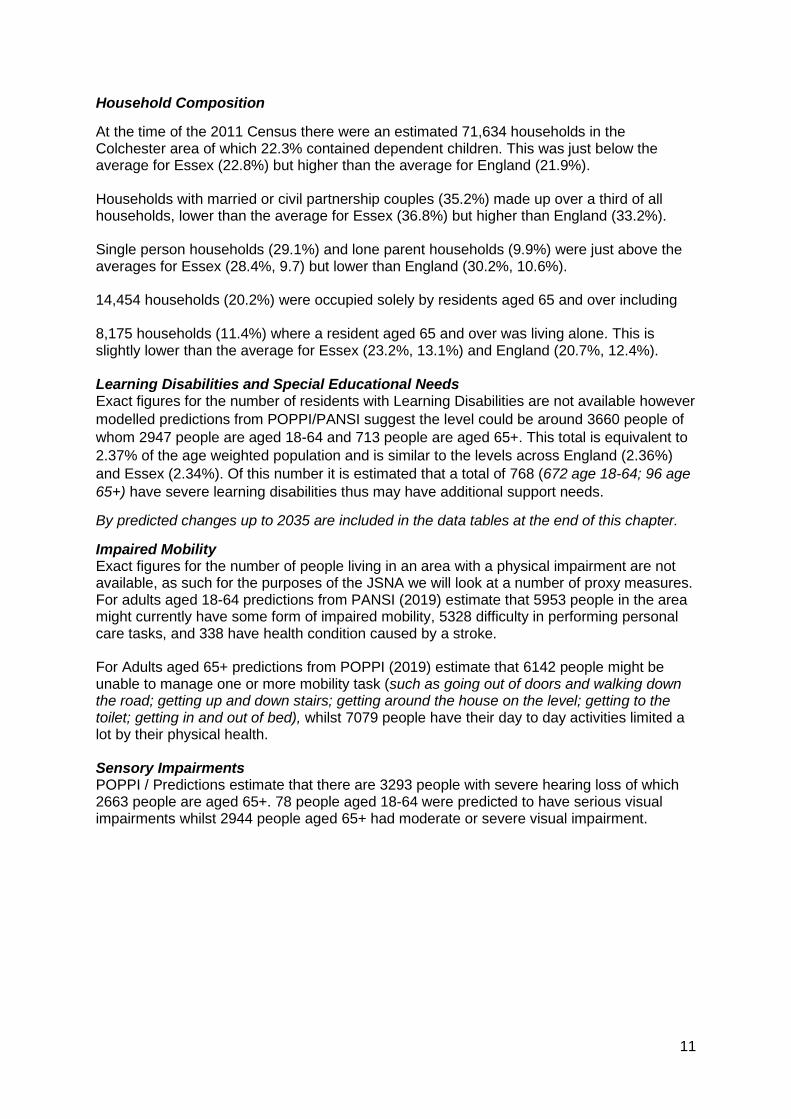
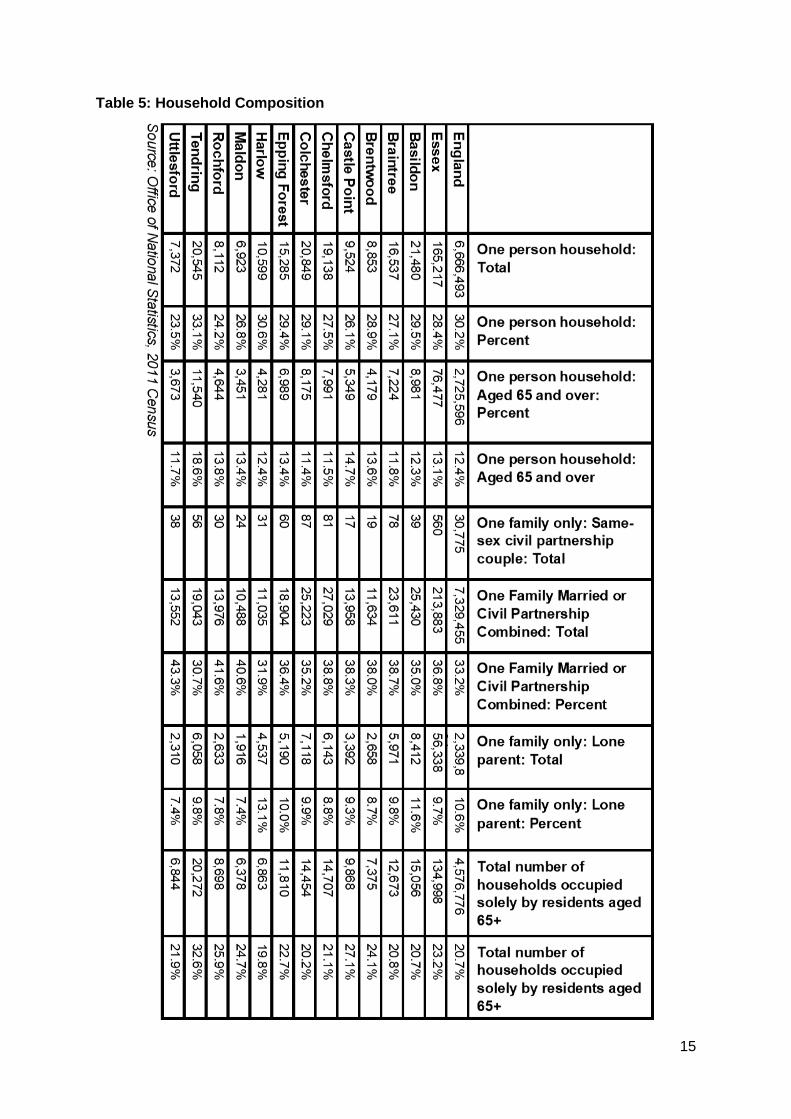
Household Composition
At the time of the 2011 Census there were an estimated 71,634 households in the Colchester area of which 22.3% contained dependent children. This was just below the average for Essex (22.8%) but higher than the average for England (21.9%). Households with married or civil partnership couples (35.2%) made up over a third of all households, lower than the average for Essex (36.8%) but higher than England (33.2%). Single person households (29.1%) and lone parent households (9.9%) were just above the averages for Essex (28.4%, 9.7) but lower than England (30.2%, 10.6%). 14,454 households (20.2%) were occupied solely by residents aged 65 and over including 8,175 households (11.4%) where a resident aged 65 and over was living alone. This is slightly lower than the average for Essex (23.2%, 13.1%) and England (20.7%, 12.4%). Learning Disabilities and Special Educational Needs Exact figures for the number of residents with Learning Disabilities are not available however
modelled predictions from POPPI/PANSI suggest the level could be around 3660 people of
whom 2947 people are aged 18-64 and 713 people are aged 65+. This total is equivalent to
2.37% of the age weighted population and is similar to the levels across England (2.36%)
and Essex (2.34%). Of this number it is estimated that a total of 768 (672 age 18-64; 96 age
65+) have severe learning disabilities thus may have additional support needs.
By predicted changes up to 2035 are included in the data tables at the end of this chapter.
Impaired Mobility Exact figures for the number of people living in an area with a physical impairment are not available, as such for the purposes of the JSNA we will look at a number of proxy measures. For adults aged 18-64 predictions from PANSI (2019) estimate that 5953 people in the area might currently have some form of impaired mobility, 5328 difficulty in performing personal care tasks, and 338 have health condition caused by a stroke. For Adults aged 65+ predictions from POPPI (2019) estimate that 6142 people might be unable to manage one or more mobility task (such as going out of doors and walking down the road; getting up and down stairs; getting around the house on the level; getting to the toilet; getting in and out of bed), whilst 7079 people have their day to day activities limited a lot by their physical health. Sensory Impairments POPPI / Predictions estimate that there are 3293 people with severe hearing loss of which 2663 people are aged 65+. 78 people aged 18-64 were predicted to have serious visual impairments whilst 2944 people aged 65+ had moderate or severe visual impairment.

12
Ta
ble
1: P
op
ula
tion
Ch
an
ge
So
urc
e: O
ffice
of N
atio
na
l Sta
tistic
s –
Mid
Yea
r Pop
ula
tion E
stim
ate
s 2
018
Are
a
Total Population (All
Ages) 2011 Census
Estimated Population
mid-2017
Estimated Population
mid-2018
Percentage of Essex
Population
Births minus Deaths
Internal Migration Net
International Migration
Net
Other
1 year population change
(count)
Change from 2011
Census (count)
Change from 2011
Census (%)
En
gla
nd
5
3,0
12
,456
55
,619
,430
55
,977
,178
1
24
,58
4
-19
,026
253
,49
7
-1,3
07
357
,74
8
2,9
64,7
22
5.5
9%
Esse
x
1,4
55,3
40
1,4
68,1
77
1,4
77,7
64
1
,40
3
5,6
82
2,5
82
-80
9,5
87
22
,424
1.5
4%
Ba
sild
on
1
83
,37
8
184
,47
9
185
,86
2
12
.6%
7
62
263
357
1
1,3
83
2,4
84
1.3
5%
Bra
intre
e
150
,99
9
151
,67
7
151
,56
1
10
.3%
1
18
-16
3
-74
3
-11
6
562
0.3
7%
Bre
ntw
oo
d
76
,386
76
,575
76
,550
.2%
1
4
-14
2
100
3
-25
164
0.2
1%
Ca
stle
Po
int
89
,731
89
,814
90
,070
6.1
%
-20
3
386
75
-2
256
339
0.3
8%
Ch
elm
sfo
rd
17
,408
9
176
,19
4
177
,07
9
12
.0%
4
40
344
223
-12
2
885
2,9
90
1.7
2%
Co
lch
este
r 1
86
,63
5
190
,09
8
192
,52
3
13
.0%
5
62
931
946
-14
2,4
25
5,8
88
3.1
5%
Ep
pin
g
Fo
rest
130
,32
1
130
,57
6
131
,13
7
8.9
%
302
-79
330
8
561
816
0.6
3%
Ha
rlow
8
5,9
95
86
,191
86
,594
5.9
%
428
-25
6
230
1
403
599
0.7
0%
Ma
ldo
n
63
,350
63
,975
64
,425
4.4
%
-10
1
472
74
5
450
1,0
75
1.7
0%
Ro
ch
ford
8
5,6
70
86
,209
86
,981
5.9
%
-14
6
867
48
3
772
1,3
11
1.5
3%
Te
nd
ring
1
42
,59
8
144
,70
5
145
,80
3
9.9
%
-96
4
1,8
94
172
-4
1,0
98
3,2
05
2.2
5%
Uttle
sfo
rd
86
,188
87
,684
89
,179
6.0
%
191
1,1
65
101
38
1,4
95
2,9
91
3.4
7%
13
Ta
ble
2: P
op
ula
tion
by B
roa
d A
ge
Gro
up
s
So
urc
e: M
id -Y
ea
r Po
pu
latio
n E
stim
ate
s 2
01
8
Nam
e
0-1
5 Y
ea
rs
(Co
un
t)
0-1
5
Ye
ars
(%
)
Wo
rkin
g
Ag
e (1
6-
64
) Co
un
t
Wo
rkin
g
Ag
e (1
6-
64
) %
65
+
(co
un
t) 6
5+
(%
)
Pre
-re
tirem
en
t (5
5-6
4)
Co
un
t
Pre
-re
tirem
en
t %
of W
A
po
p.
Pre
-re
tirem
en
t %
of to
tal
po
p.
EN
GL
AN
D
10
,74
8,4
58
19
.2%
3
5,0
49
,46
7
62
.6%
1
0,1
79
,25
3
18
.2%
6,6
17
,703
18
.9%
1
1.8
%
Esse
x
27
9,0
20
18
.9%
8
95
,44
4
60
.6%
3
03
,30
0
20
.5%
18
3,5
49
20
.5%
1
2.4
%
Ba
sild
on
38
,74
9
20
.8%
1
15
,19
1
62
.0%
3
1,9
22
17
.2%
21
,58
6
18
.7%
1
1.6
%
Bra
intre
e
29
,12
4
19
.2%
9
1,9
62
60
.7%
3
0,4
75
20
.1%
19
,36
4
21
.1%
1
2.8
%
Bre
ntw
oo
d
14
,29
5
18
.7%
4
6,6
94
61
.0%
1
5,5
61
20
.3%
9,5
99
20
.6%
1
2.5
%
Castle
P
oin
t 1
5,2
50
16
.9%
5
2,0
86
57
.8%
2
2,7
34
25
.2%
11
,85
9
22
.8%
1
3.2
%
Che
lmsfo
rd
33
,85
3
19
.1%
1
09
,34
7
61
.8%
3
3,8
79
19
.1%
21
,05
8
19
.3%
1
1.9
%
Colc
he
ste
r 3
6,1
61
18
.8%
1
23
,19
3
64
.0%
3
3,1
69
17
.2%
20
,37
3
16
.5%
1
0.6
%
Ep
pin
g
Fo
rest
24
,82
2
18
.9%
8
0,5
82
61
.4%
2
5,7
33
19
.6%
16
,48
0
20
.5%
1
2.6
%
Harlo
w
19
,40
8
22
.4%
5
3,9
01
62
.2%
1
3,2
85
15
.3%
9,9
76
18
.5%
1
1.5
%
Ma
ldo
n
10
,57
6
16
.4%
3
7,7
84
58
.6%
1
6,0
65
24
.9%
9,4
38
25
.0%
1
4.6
%
Roch
ford
1
4,9
51
17
.2%
5
2,0
04
59
.8%
2
0,0
26
23
.0%
11
,47
5
22
.1%
1
3.2
%
Te
nd
ring
24
,11
4
16
.5%
7
8,6
20
53
.9%
4
3,0
69
29
.5%
20
,47
8
26
.0%
1
4.0
%
Uttle
sfo
rd
17
,71
7
19
.9%
5
4,0
80
60
.6%
1
7,3
82
19
.5%
11
,86
3
21
.9%
1
3.3
%

14
Table 3: Old Age Dependency Ratio
Old Age Dependency Ratio (Rate of residents aged 65 years and over per working age population)
2019 2024 2029 2034 2039
England 286.8 295.1 299.7 334.2 361
Essex 335.6 342.0 343.9 380.4 408.6
Basildon 272.4 273.2 272.6 298.8 318.3
Braintree 330.0 348.0 358.2 409.2 448.1
Brentwood 325.1 322.5 321.6 350.6 368.1
Castle Point 431.1 438.3 432.9 469.6 496.8
Chelmsford 307.9 316.8 317.7 347.1 369.9
Colchester 266.4 265.6 263.1 288.7 310.1
Epping Forest 311.8 310.2 309.9 340.9 365.9
Harlow 242.8 248.3 250.0 276.1 294.9
Maldon 426.6 457.5 471.1 533.8 579.2
Rochford 385.1 392.1 394.9 438.2 473.1
Tendring 544.0 552.1 553.3 615.3 665.7
Uttlesford 327.7 344.9 358.6 408.2 448.4
Source: Office of National Statistics Population Projections 2016
Table 4: Ethnicity
Ethnicity
White British %
% White non British
% Mixed/ Multiple Ethnic Group
% Asian/ Asian British
% Black/ Black British
% Other Ethnic Groups
Total Percentage of BAME (Inc. white non-British)
England 79.75% 5.7% 2.3% 7.8% 3.5% 1.0% 20.25%
Essex 90.8% 3.5% 1.5% 2.5% 1.3% 0.4% 9.24%
Basildon 89.5% 3.1% 1.7% 2.7% 2.7% 0.3% 10.48%
Braintree 93.2% 3.5% 1.2% 1.4% 0.6% 0.2% 6.85%
Brentwood 89.2% 4.3% 1.6% 3.2% 1.2% 0.4% 10.75%
Castle Point 95.4% 1.5% 1.0% 1.1% 0.8% 0.2% 4.62%
Chelmsford 90.3% 3.6% 1.6% 2.9% 1.2% 0.4% 9.70%
Colchester 87.5% 4.5% 1.8% 3.7% 1.5% 1.0% 12.49%
Epping Forest 85.2% 5.3% 2.1% 4.8% 1.9% 0.7% 14.78%
Harlow 83.9% 5.2% 2.1% 4.6% 3.8% 0.5% 16.14%
Maldon 95.8% 2.3% 0.8% 0.8% 0.2% 0.1% 4.25%
Rochford 95.6% 1.6% 1.1% 1.1% 0.5% 0.2% 4.39%
Tendring 95.4% 2.2% 1.1% 0.9% 0.3% 0.1% 4.62%
Uttlesford 92.3% 4.3% 1.2% 1.4% 0.5% 0.2% 7.70%
Source: Office of National Statistics 2011 Census
15
Table 5: Household Composition

16
Table 6: Learning Disability Predictions 2019
Number of people predicted to have a learning disability in 2019
Age 18-64 Age 65+ Total Age 18+
Number %* Number %* Number %*
England 826834 2.44% 216362 2.09% 1043196 2.36%
East of England 89212 2.43% 26011 2.09% 115223 2.34%
Essex 21059 2.43% 6487 2.09% 27546 2.34%
Basildon 2740 2.43% 683 2.09% 3423 2.36%
Braintree 2164 2.42% 659 2.09% 2823 2.34%
Brentwood 1110 2.42% 333 2.08% 1443 2.33%
Castle Point 1219 2.42% 486 2.09% 1705 2.32%
Chelmsford 2561 2.43% 725 2.09% 3286 2.35%
Colchester 2947 2.45% 713 2.10% 3660 2.37%
Epping Forest 1914 2.43% 546 2.09% 2460 2.34%
Harlow 1276 2.44% 282 2.07% 1558 2.36%
Maldon 870 2.41% 344 2.11% 1214 2.32%
Rochford 1210 2.42% 429 2.09% 1639 2.32%
Tendring 1828 2.41% 919 2.09% 2747 2.30%
Uttlesford 1237 2.42% 376 2.09% 1613 2.33%
Number of people predicted to have a moderate or severe learning disability in 2019
Age 18-64 Age 65+ Total Age 18+
Number %* Number %* Number %*
England 188444 0.56% 29128 0.28% 217572 0.49%
East of England 20343 0.55% 3488 0.28% 23831 0.48%
Essex 4797 0.55% 870 0.28% 5667 0.48%
Basildon 625 0.56% 92 0.28% 717 0.49%
Braintree 493 0.55% 89 0.28% 582 0.48%
Brentwood 253 0.55% 44 0.28% 297 0.48%
Castle Point 277 0.55% 65 0.28% 342 0.47%
Chelmsford 585 0.56% 97 0.28% 682 0.49%
Colchester 672 0.56% 96 0.28% 768 0.50%
Epping Forest 437 0.55% 73 0.28% 510 0.49%
Harlow 291 0.56% 38 0.28% 329 0.50%
Maldon 197 0.55% 47 0.29% 244 0.47%
Rochford 276 0.55% 57 0.28% 333 0.47%
Tendring 413 0.55% 123 0.28% 536 0.45%
Uttlesford 283 0.55% 50 0.28% 333 0.48%
Source POPPI/PANSI 2019

17
Table 7: Learning Disability Projections
Predicted Numbers of People with a Learning Disability to 2035
2025 2030 2035
Predicted Change 2019-
2035
18-64 65+ 18-64 65+ 18-64 65+ 18-64 65+
England 833689 240660 839192 269064 842807 296050 15973 79688
East of England 90564 28952 91550 32438 92307 35875 3095 9864
Essex 21467 7179 21763 8011 22030 8855 971 2368
Basildon 2816 754 2880 844 2953 932 213 249
Braintree 2167 744 2166 842 2149 936 -15 277
Brentwood 1137 354 1155 397 1180 433 70 100
Castle Point 1217 520 1221 566 1230 614 11 128
Chelmsford 2590 797 2619 881 2650 958 89 233
Colchester 3078 784 3182 877 3254 976 307 263
Epping Forest 1961 594 1993 662 2034 733 120 187
Harlow 1292 319 1315 356 1341 391 65 109
Maldon 853 392 844 434 835 482 -35 138
Rochford 1213 467 1219 521 1218 570 8 141
Tendring 1856 1017 1879 1139 1893 1263 65 344
Uttlesford 1268 437 1283 506 1299 572 62 196
Predicted Numbers of People with Moderate or Severe Learning Disabilities to 2035
2025 2030 2035
Predicted Change 2019-
2035
18-64 65+ 18-64 65+ 18-64 65+ 18-64 65+
England 190642 31818 192706 35452 193757 38627 5313 9499
East of England 20718 3802 21027 4244 21222 4654 879 1166
Essex 4906 942 4994 1047 5064 1150 267 280
Basildon 645 100 663 112 680 123 55 31
Braintree 495 98 496 110 493 121 0 32
Brentwood 260 46 266 51 272 56 19 12
Castle Point 277 68 279 73 282 79 5 14
Chelmsford 593 104 603 114 610 123 25 26
Colchester 704 103 731 115 749 127 77 31
Epping Forest 449 78 458 87 468 95 31 22
Harlow 296 43 303 48 309 51 18 13
Maldon 194 52 192 57 191 63 -6 16
Rochford 277 61 279 68 280 74 4 17
Tendring 420 133 428 149 432 164 19 41
Uttlesford 290 57 295 66 299 74 16 24
Source POPPI/PANSI 2019

18
Table 8: Physical Impairments
The number of people aged 18-64 predicted to have a physical impairment in 2019
Impaired Mobility
Any moderate or severe personal care disability
A longstanding health condition caused by a stroke Combined Total
Number %* Number %* Number %* Number %*
Essex 48922 5.23% 43109 4.61% 2817 0.30% 94848 10.13%
Basildon 6079 4.97% 5385 4.40% 345 0.28% 11809 9.66%
Braintree 5149 5.41% 4540 4.77% 300 0.32% 9989 10.49%
Brentwood 2618 5.27% 2307 4.65% 151 0.30% 5076 10.23%
Castle Point 2969 5.54% 2604 4.86% 172 0.32% 5745 10.73%
Chelmsford 5814 5.16% 5139 4.56% 334 0.30% 11287 10.01%
Colchester 5953 4.53% 5328 4.06% 338 0.26% 11619 8.85%
Epping Forest 4467 5.24% 3937 4.62% 256 0.30% 8660 10.16%
Harlow 2786 4.95% 2461 4.38% 155 0.28% 5402 9.61%
Maldon 2282 6.02% 1991 5.25% 135 0.36% 4408 11.63%
Rochford 2967 5.56% 2604 4.88% 172 0.32% 5743 10.76%
Tendring 4785 5.80% 4142 5.02% 273 0.33% 9200 11.16%
Uttlesford 3089 5.51% 2710 4.83% 181 0.32% 5980 10.66%
*Percentage of the total population aged 18-64 based on 2019 population projections
The number of Adults aged 65 and over with long term limiting conditions or restricted mobility
Day-to-day activities are limited a little
Day-to-day activities are limited a lot
Unable to manage at least one mobility** activity on their own
Number % Number % Number %
Essex 76314 24.6% 66662 21.5% 57212 18.4%
Basildon 8044 24.6% 8043 24.6% 6058 18.5%
Braintree 7669 24.3% 6309 20.0% 5676 18.0%
Brentwood 3793 23.7% 3020 18.9% 3147 19.7%
Castle Point 5593 24.1% 5482 23.6% 4180 18.0%
Chelmsford 8433 24.3% 6379 18.4% 6387 18.4%
Colchester 8386 24.7% 7079 20.8% 6142 18.1%
Epping Forest 6265 24.0% 5398 20.7% 5017 19.2%
Harlow 3465 25.5% 3615 26.6% 2625 19.3%
Maldon 3909 24.0% 3237 19.9% 2893 17.7%
Rochford 5259 25.7% 4198 20.5% 3727 18.2%
Tendring 11449 26.1% 10819 24.6% 8078 18.4%
Uttlesford 4309 23.9% 3242 18.0% 3358 18.7%
**Activities include: going out of doors and walking down the road; getting up and down stairs; getting around the house on the level; getting to the toilet; getting in and out of bed
Source POPPI/PANSI 2019

19
Table 9: Sensory Impairments
Severe Hearing Loss Visual Impairments
Visual Impairments
Total
Serious Visual
Impairments in people age 18-64
Moderate or Severe Visual
Impairments in People age 65+
Total 18 and over
18-64 65+
Essex 30503 5272 25231 27745 564 27181
Basildon 3309 659 2651 2925 74 2851
Braintree 3074 562 2511 2775 59 2716
Brentwood 1718 285 1433 1475 29 1446
Castle Point 2154 317 1837 2059 32 2027
Chelmsford 3496 632 2864 3113 68 3045
Colchester 3293 631 2663 3022 78 2944
Epping Forest 2757 487 2269 2364 52 2312
Harlow 1487 310 1177 1238 34 1204
Maldon 1471 245 1227 1418 23 1395
Rochford 1956 310 1645 1827 33 1794
Tendring 4013 503 3510 3916 50 3866
Uttlesford 1775 331 1443 1613 33 1580
Source POPPI/PANSI 2019
20
21
ACCESS TO SERVICES
Area Covering an area of approximately 329 square kilometres, the borough of Colchester is the sixth largest local authority in Essex in terms of area. It is classed statistically as urban with significant rural populations, with the majority of residents living in or on the fringe of the largest settlement of Colchester but with significant populations living in more rural communities including those on Mersea Island. Population Density With an estimated 578 residents per square kilometre, Colchester is above the Essex average (424 people per sq. km) and is the fourth highest district in terms of population density overall.
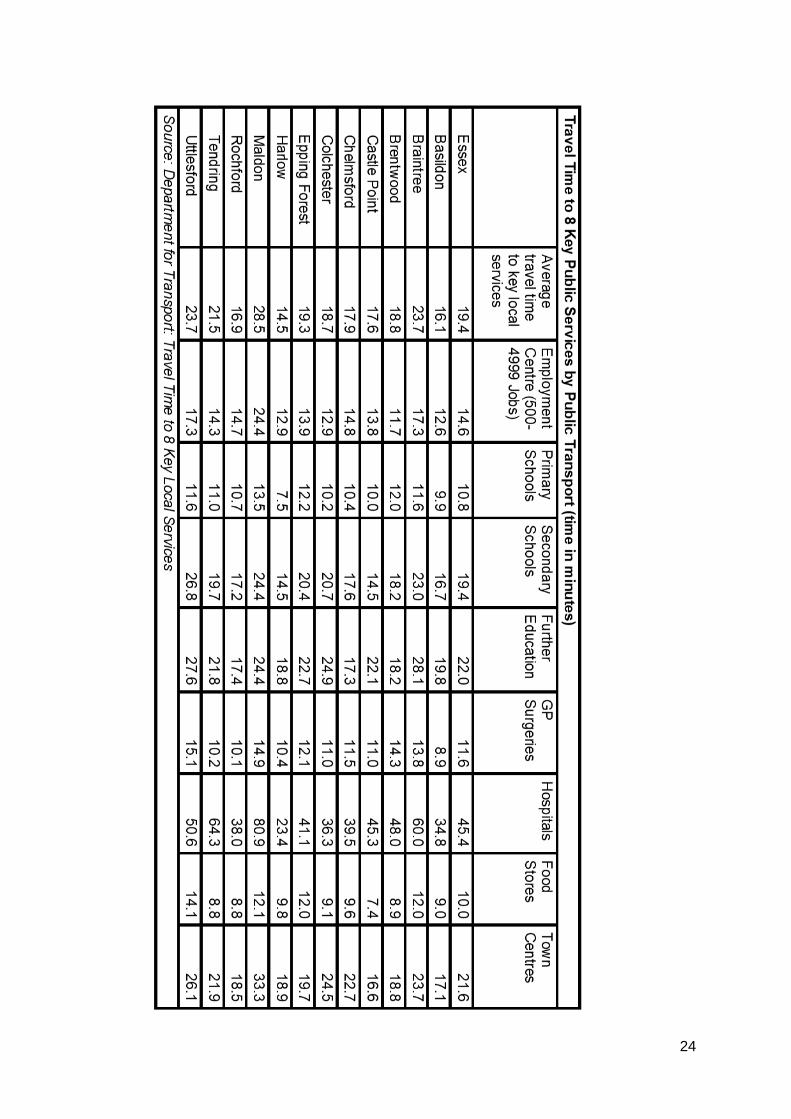
Travel Time to Key Services According to the Department for Transport, Colchester residents have slightly shorter travel
times to local services compared to the Essex average (19.4 minutes), with an average of
18.7 minutes by walking or public transport to 8 key services. Looking at times to health
services, average times to GP surgeries were estimated at 11 minutes in-line with the Essex
average (11.6 minutes), whilst time to hospitals were 36.3 minutes, 9 minutes lower than the
county average. Access to a car reduced these travel times significantly to 8.0 minutes for
GP surgeries and 19.4 minutes to hospitals.

22
Source: Department for Transport See table at the end of this chapter for average travel times to all service types.
Satisfaction with GP Services Information about satisfaction with GP services from the GP Patient Survey are only available at CCG level so it is not possible to present views of Colchester residents in isolation. According to data from the 2018 survey, 79.1% of patients in the North East Essex CCG reported a positive experience of their GP practice. This lower than the average for both England (83.75%) and the NHS Eastern Region (83.3%) but is in line with the combined average for all CCGs in Essex (80.35%).
The percentage of patients aged 16+ who have a positive experience of their GP practice
Time period %
England 2018 83.8
East NHS region 2018 83.3
NHS Basildon And Brentwood CCG 2018 80.6
NHS Castle Point and Rochford CCG 2018 82.8
NHS Mid Essex CCG 2018 79.2
NHS North East Essex CCG 2018 79.1
NHS Southend CCG 2018 80.1
NHS Thurrock CCG 2018 76.0
NHS West Essex CCG 2018 80.2
Source: GP Patient Survey 2018 Carers The exact number of residents providing informal or unpaid care to friends or family members is not known, however figures from the Department for Work and Pensions identified 1990 residents who had been in receipt of Carers Allowance benefits in November

23
2018.The largest numbers of claimants were in 45-54 age group. Women were more than three times more likely to be in receipt of carers allowance (1,560 / 78.4%) compared to Men however this rate was close to the levels across Essex as a whole (77.4%).
Number of people in receipt of carers allowance by age Group – November 2018
Total under 18 18-24 25-34 35-44 45-54 55-64 65+
Essex 16,620 30 580 2,940 4,020 4,410 4,410 230
Basildon 2,690 10 120 530 710 670 630 30
Braintree 1,750
40 350 430 460 430 20
Brentwood 540
20 70 120 160 150 ~
Castle Point 1,110
40 160 220 310 350 20
Chelmsford 1,500
50 260 400 400 360 20
Colchester 1,990 10 80 390 500 520 450 30
Epping Forest 1,170
40 170 280 320 340 20
Harlow 1,100
40 220 300 260 260 10
Maldon 720
10 130 170 200 210 10
Rochford 770
20 80 190 230 250 10
Tendring 2,800
100 490 610 720 830 40
Uttlesford 480
10 80 90 140 130 10
Number of people in receipt of carers allowance by Gender –November 2018
All Claimants Male Female
Number Number % Number %
Essex 16,620 3,760 22.6% 12,860 77.4%
Basildon 2,690 610 22.7% 2,080 77.3%
Braintree 1,750 390 22.3% 1,360 77.7%
Brentwood 540 100 18.5% 440 81.5%
Castle Point 1,110 230 20.7% 880 79.3%
Chelmsford 1,510 310 20.5% 1,200 79.5%
Colchester 1,990 430 21.6% 1,560 78.4%
Epping Forest 1,170 260 22.2% 910 77.8%
Harlow 1,100 230 20.9% 870 79.1%
Maldon 720 140 19.4% 580 80.6%
Rochford 770 160 20.8% 610 79.2%
Tendring 2,810 800 28.5% 2,010 71.5%
Uttlesford 480 100 20.8% 380 79.2%
Source: Department of Work and Pensions 2019
24

25

26
WIDER DETERMINANTS OF HEALTH
“Wider determinants, also known as social determinants, are a diverse range of
social, economic and environmental factors which impact on people’s health. Such
factors are influenced by the local, national and international distribution of power
and resources which shape the conditions of daily life. They determine the extent to
which different individuals have the physical, social and personal resources to
identify and achieve goals, meet their needs and deal with changes to their
circumstances.” Public Health England 2019
Income & Average Earnings
The average weekly income for a Colchester resident working full time in 2018 was £570.40,
£48.20 (-8.45%) lower than the average for Essex and £4.50 (-0.8%) lower than the average
for England. This was the third lowest average income out of 12 Districts. Part time workers
earned an average of £174.2 per week, 4.5% less than the Essex average, 7.5% less than
the average for England, and was the eighth highest average income in the county.
Male residents generally earned £97.80 (15.97%) more per week than females with an average weekly pay of £612.50 for male full time workers compared to £514.7 for females. This was just below the average income difference for England (16.7%) and was sixth highest average difference in percentage. Deprivation In the Indices of Multiple Deprivation 2019 the Colchester Local Authority area was ranked
181out of 317 lower tier authorities in England based on the average rank of the LSOAs in
this area (where 1= most deprived). This places Colchester in the upper 50% of least
deprived Lower Tier Local Authorities (LTLAs) nationally. Compared to the other local
authority areas in Essex, Colchester is ranked as 4th out of 12 in the county for overall
deprivation and is one of two areas in Essex which falls into the 6th decile nationally.
27
See the Essex 2019 Indices of Deprivation report for a full analysis of the latest English
Indices of deprivation data for each district.
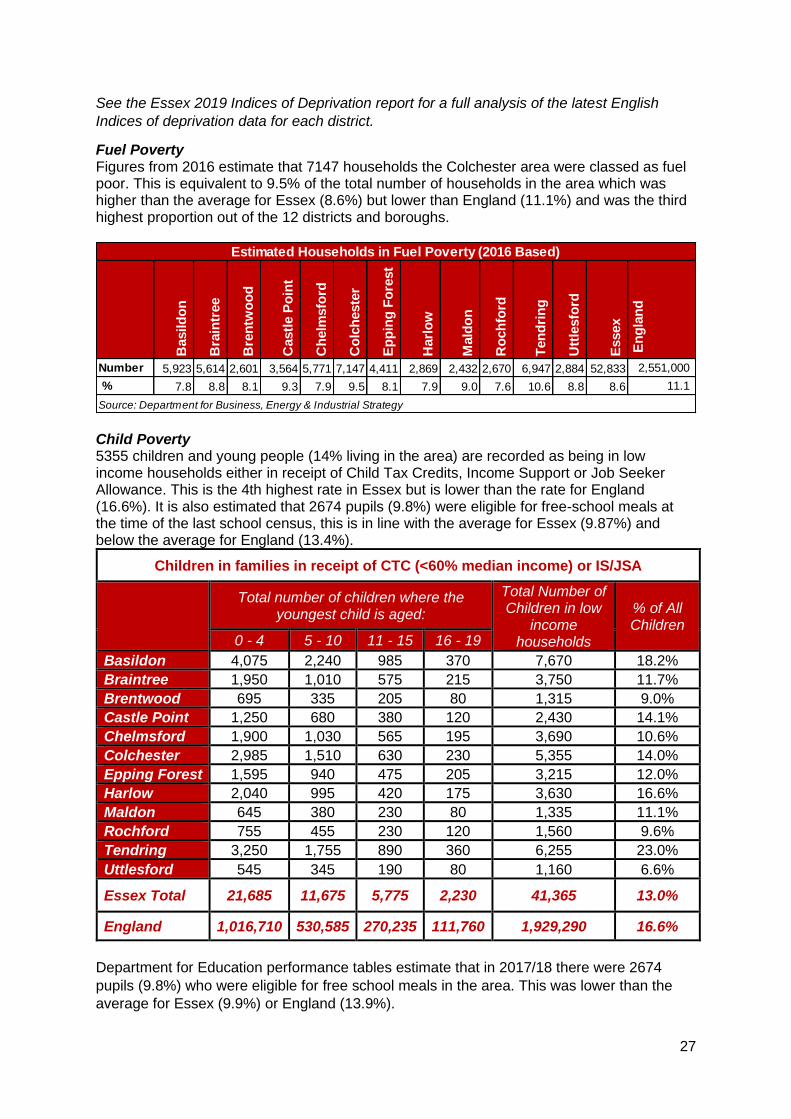
Fuel Poverty Figures from 2016 estimate that 7147 households the Colchester area were classed as fuel poor. This is equivalent to 9.5% of the total number of households in the area which was higher than the average for Essex (8.6%) but lower than England (11.1%) and was the third highest proportion out of the 12 districts and boroughs.
Child Poverty 5355 children and young people (14% living in the area) are recorded as being in low income households either in receipt of Child Tax Credits, Income Support or Job Seeker Allowance. This is the 4th highest rate in Essex but is lower than the rate for England (16.6%). It is also estimated that 2674 pupils (9.8%) were eligible for free-school meals at the time of the last school census, this is in line with the average for Essex (9.87%) and below the average for England (13.4%).
Children in families in receipt of CTC (<60% median income) or IS/JSA
Total number of children where the
youngest child is aged:
Total Number of Children in low
income households
% of All Children
0 - 4 5 - 10 11 - 15 16 - 19
Basildon 4,075 2,240 985 370 7,670 18.2%
Braintree 1,950 1,010 575 215 3,750 11.7%
Brentwood 695 335 205 80 1,315 9.0%
Castle Point 1,250 680 380 120 2,430 14.1%
Chelmsford 1,900 1,030 565 195 3,690 10.6%
Colchester 2,985 1,510 630 230 5,355 14.0%
Epping Forest 1,595 940 475 205 3,215 12.0%
Harlow 2,040 995 420 175 3,630 16.6%
Maldon 645 380 230 80 1,335 11.1%
Rochford 755 455 230 120 1,560 9.6%
Tendring 3,250 1,755 890 360 6,255 23.0%
Uttlesford 545 345 190 80 1,160 6.6%
Essex Total 21,685 11,675 5,775 2,230 41,365 13.0%
England 1,016,710 530,585 270,235 111,760 1,929,290 16.6%
Department for Education performance tables estimate that in 2017/18 there were 2674
pupils (9.8%) who were eligible for free school meals in the area. This was lower than the
average for Essex (9.9%) or England (13.9%).
Basild
on
Bra
intr
ee
Bre
ntw
oo
d
Castl
e P
oin
t
Ch
elm
sfo
rd
Co
lch
este
r
Ep
pin
g F
ore
st
Harl
ow
Mald
on
Ro
ch
ford
Ten
dri
ng
Utt
lesfo
rd
Essex
En
gla
nd
Number 5,923 5,614 2,601 3,564 5,771 7,147 4,411 2,869 2,432 2,670 6,947 2,884 52,833 2,551,000
% 7.8 8.8 8.1 9.3 7.9 9.5 8.1 7.9 9.0 7.6 10.6 8.8 8.6 11.1
Estimated Households in Fuel Poverty (2016 Based)
Source: Department for Business, Energy & Industrial Strategy

28
Education & Skills
Adult Qualifications
19.4% of Colchester residents aged 16+ had no formal qualifications at the time of the 2011
Census, 4.5% lower than the average for Essex (23.9%) and 3.1% lower than the average
for England (22.5%). Colchester residents also achieved similar to the national average
levels of NVQ level four qualifications (certificate of higher education) or higher (Batchelors
Degree and above) with 27.2% of residents gaining this level of qualification compared to an
average of 23% for the whole of Essex and 27.4% at the England level. These are the fourth
lowest and fourth highest levels in Essex respectively.
Levels for all districts in the Essex County Council area along with averages for the county,
East of England and England are set out in the table below.
Area
Number of adult residents with
no qualifications
% of adult residents with
no qualifications
Number of adult residents with
Level 4 qualifications
and above
% of adult residents with
Level 4 qualifications
and above
Basildon 37084 26.64% 25939 18.63%
Braintree 26958 22.83% 26212 22.20%
Brentwood 11651 19.38% 18441 30.68%
Castle Point 21885 29.92% 10693 14.62%
Chelmsford 25844 18.86% 39452 28.80%
Colchester 27440 19.40% 38412 27.16%
Epping Forest 24360 23.95% 25769 25.34%
Harlow 16948 26.05% 11468 17.63%
Maldon 11749 23.13% 12009 23.64%
Rochford 16134 23.63% 13659 20.01%
Tendring 39616 34.30% 18340 15.88%
Uttlesford 11232 17.72% 20251 31.94%
Essex 270901 23.89% 260645 22.99%
England 9656810 22.46% 11769361 27.38%
East of England 1067449 22.53% 1218862 25.72%
Basild
on
Bra
intr
ee
Bre
ntw
oo
d
Castl
e P
oin
t
Ch
elm
sfo
rd
Co
lch
este
r
Ep
pin
g F
ore
st
Harl
ow
Mald
on
Ro
ch
ford
Ten
dri
ng
Utt
lesfo
rd
Essex
En
gla
nd
Number 3360 1800 662 1289 2030 2674 1475 1766 668 780 3056 502 20062 1061314
% 13.1% 9.2% 5.2% 10.4% 7.7% 9.8% 8.6% 12.6% 10.2% 6.8% 16.9% 4.3% 9.9% 13.4%
Students known to be eligible for fsm (Performance Table Statistics) 2017/18
Source: Department for Education

29
Early Years
In Colchester the percentage of
children achieving a good level of
development has generally improved
since 2015 with 73% of children
achieving a good level of development
in 2018, an increase of 7% compared to
2015. The 2018 score was just above
the averages for Essex (72.1) and
England (71.5%) and a 1% increase
compared to 2017.
A similar trend was seen in the
percentage of children achieving at least
the expected level across all early
learning goals. This has also increased
to 73% in 2018, up by 9% compared to
2015 and 2% on the previous year. This
was higher than the averages for Essex
(70.7%) and England (70.2%).
Levels for all districts in the Essex County Council area along with averages for the county,
East of England and England are set out in the table below.
2015 2016 2017 2018 Change
2015-2018
Area of Pupil Residence
% of ELG
% of GLD
% of ELG
% of GLD
% of ELG
% of GLD
% of ELG
% of GLD
% of ELG
% of GLD
Basildon 65 67 70 71 70 71 72.0 73.0 2.0 6.0
Braintree 63 65 71 72 72 74 72.0 73.0 9.0 8.0
Brentwood 70 71 73 75 77 78 76.0 77.0 6.0 6.0
Castle Point 61 65 70 72 70 73 73.0 74.0 12.0 9.0
Chelmsford 68 70 73 73 74 75 74.0 75.0 6.0 5.0
Colchester 64 66 68 70 71 72 73.0 73.0 9.0 7.0
Epping Forest
67 69 69 70 72 73 73.0 73.0 6.0 4.0
Harlow 65 66 69 71 69 72 71.0 72.0 6.0 6.0
Maldon 70 72 73 74 74 75 75.0 76.0 5.0 4.0
Rochford 70 72 73 74 76 77 77.0 79.0 7.0 7.0
Tendring 64 66 66 67 67 70 70.0 70.0 6.0 4.0
Uttlesford 72 73 78 79 76 77 76.0 77.0 4.0 4.0
Essex 65.8 67.7 70.5 71.9 72.1 73.5 70.7 72.1 4.9 4.4
England 64.1 66.3 67.3 69.3 69.0 70.7 70.2 71.5 6.1 5.2
East of England
64.6 66.6 67.8 69.7 69.4 71.3 73.0 73.8 8.4 7.2
% of ELG = % of pupils achieving at least the expected standard in all Early Learning Goals
% of GLD = % of pupils achieving a Good Level of Development at the Early Years foundation Stage
Good level of development (GLD)
Children achieving a good level of development are those achieving at least the expected level within the following areas of
learning: communication and language; physical development; personal, social and
emotional development; literacy and mathematics.
Achieving at least the expected level across all early learning goals
Children achieving at least the expected level
across all early learning goals (ELGs) are those achieving ‘expected’ or ‘exceeded’ in all
17 ELGs.

30
GCSE Attainment
Since the introduction of the new GCSE grading system, pupil performance in Colchester
has fallen slightly with 65.3% of pupils achieving grade 9-4 in English and Maths (a good
pass) and 43.6% achieving grade 9-5 (a strong pass) in 2018. This is higher than the
England average (59.1%, 39.9%) and Essex (63.3% and 40.7%). Compared to scores for
2017 this is a small reduction (-1.4%, -
3.3%) however it is not possible to
make a longer term comparison due to
changes in the grading system.
Looking at the pupils' Attainment 8
score provides a slightly longer term
comparison of performance and shows
that overall performance has fallen
3.6% down from 51.6% in 2016 to
48% in 2018. These figures are higher
than the average for England (48.5,
44.5) and Essex (50.4, 46.1), and
were the fourth highest scores in the
county in 2018. The downward trend in performance for Colchester is similar to the trend
observed at across England since the introducation of the new GCSE grading system which
has seen a 4% reduction in average attainment 8 scores between 2016 and 2018.
Area
2017 2018
Average Attainment
8 Score 2017-2018
Change
% of pupils who achieved grade 9-5 in English and Maths
% of pupils who achieved grade 9-4 in English and Maths
Average Attainment
8 Score
% of pupils who
achieved grade 9-5 in English and Maths
% of pupils who
achieved grade 9-4 in English and Maths
Average Attainment
8 Score
Basildon 41.4 63.4 46.4 40.7 62.6 45.3 -4.0
Braintree 40.4 63.6 45.2 39 63 45.5 -4.0
Brentwood 56.5 79.3 51.0 56.2 76.8 52.6 -1.5
Castle Point 39.2 64.2 45.6 41.9 65.6 45 -4.7
Chelmsford 49.5 72.2 50.4 49.5 72 50.9 -3.1
Colchester 46.9 66.7 47.6 43.6 65.3 48 -3.6
Epping Forest
43.8 66.8 47.8 45 67.8 46.9 -4.3
Harlow 36.5 59.8 44.1 38.3 59.6 42.8 -5.4
Maldon 42.4 62.4 47.0 39 62.8 47 -5.8
Rochford 47.5 70.5 47.9 41.5 63.1 46.3 -4.7
Tendring 31.9 52.0 41.6 26.5 47.2 39.9 -5.9
Uttlesford 51.6 74.9 51.5 50.1 71.1 51.8 -3.1
Essex 42.4 64.9 46.7 40.7 63.3 46.1 -4.3
East of England
43.5 65.4 46.7 43.7 65.2 47 -3.4
England 39.1 58.5 44.6 39.9 59.1 44.5 -4.0
Attainment 8 Attainment 8 measures a student's average grade across eight subjects across the following three groups: English and maths: (double-weighted) English Baccalaureate (Ebacc): the highest scores from the sciences, computer science, geography, history and languages. Open group: Any remaining GCSEs and other approved academic, arts or vocational qualifications.

31
Destinations of School Leavers
In 2017 95% of pupils in Colchester were in sustained Education, Employment or Training at
the end of Key stage 4 (Secondary School), just above the average for England (94%) and
in line with the average for Essex (95%). Within this group 87% were in education, higher
again than the county and England averages (86%) a. A further 4% were in apprenticeships,
whilst another 4% were in employment. At this stage 4% of young people were not in any
form of sustained education, employment or training, just below to the national and county
average (5%).
After Key Stage 5 (Further Education) the number of young people in sustained education
employment or training reduced to 90%. Of this cohort, 62% were believed to be in
Education including 48% in Higher Education. The rate of young people attending university
was 2% lower than the national average (50%) but 2% above the average for Essex (46%).
The next largest destination was sustained employment accounting for approximately 24%
of the cohort, 2% higher than the England average (22%) and 2% less than Essex (26%).
4% were in apprenticeships, this is the lowest level in Essex and was 4% lower than the
average for Essex (8%). 7% were not in any form of sustained education, training or
employment, in line with the average for Essex (7%).
Percentage of pupils with destinations sustained for at least two terms post KS4 in 2016/17:
Area
Any sustained
education or employment
Any sustained education
destination
Sustained apprentice
ships
Sustained employment
destination
Destination not
sustained
Activity not captured in
the data
ENGLAND* 94 86 5 3 5 1
EAST 95 87 4 3 5 1
Essex 95 86 5 4 5 1
Basildon 93 82 5 5 7 1
Braintree 94 85 5 5 5 1
Brentwood 96 90 3 2 3 2
Castle Point 94 83 8 3 5 1
Chelmsford 96 89 4 3 4 0
Colchester 95 87 4 4 5 1
Epping Forest 95 88 5 2 4 x
Harlow 95 88 4 3 3 2
Maldon 96 85 6 5 3 x
Rochford 95 86 7 3 4 2
Tendring 92 82 5 6 7 1
Uttlesford 94 87 5 3 5 0
* State-funded schools (mainstream and special)
x Data not available NB: England figures may not add to 100% due to rounding
32
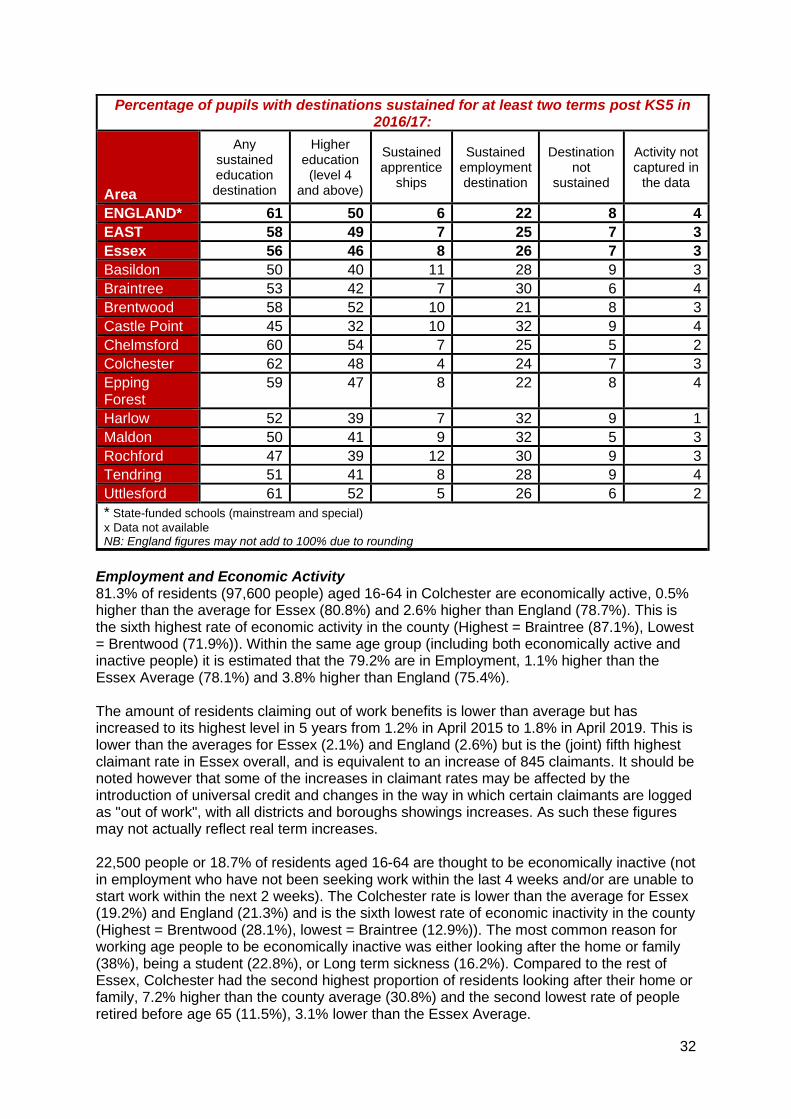
Percentage of pupils with destinations sustained for at least two terms post KS5 in 2016/17:
Area
Any sustained education destination
Higher education
(level 4 and above)
Sustained apprentice
ships
Sustained employment destination
Destination not
sustained
Activity not captured in
the data
ENGLAND* 61 50 6 22 8 4
EAST 58 49 7 25 7 3
Essex 56 46 8 26 7 3
Basildon 50 40 11 28 9 3
Braintree 53 42 7 30 6 4
Brentwood 58 52 10 21 8 3
Castle Point 45 32 10 32 9 4
Chelmsford 60 54 7 25 5 2
Colchester 62 48 4 24 7 3
Epping Forest
59 47 8 22 8 4
Harlow 52 39 7 32 9 1
Maldon 50 41 9 32 5 3
Rochford 47 39 12 30 9 3
Tendring 51 41 8 28 9 4
Uttlesford 61 52 5 26 6 2
* State-funded schools (mainstream and special)
x Data not available NB: England figures may not add to 100% due to rounding
Employment and Economic Activity 81.3% of residents (97,600 people) aged 16-64 in Colchester are economically active, 0.5% higher than the average for Essex (80.8%) and 2.6% higher than England (78.7%). This is the sixth highest rate of economic activity in the county (Highest = Braintree (87.1%), Lowest = Brentwood (71.9%)). Within the same age group (including both economically active and inactive people) it is estimated that the 79.2% are in Employment, 1.1% higher than the Essex Average (78.1%) and 3.8% higher than England (75.4%). The amount of residents claiming out of work benefits is lower than average but has increased to its highest level in 5 years from 1.2% in April 2015 to 1.8% in April 2019. This is lower than the averages for Essex (2.1%) and England (2.6%) but is the (joint) fifth highest claimant rate in Essex overall, and is equivalent to an increase of 845 claimants. It should be noted however that some of the increases in claimant rates may be affected by the introduction of universal credit and changes in the way in which certain claimants are logged as "out of work", with all districts and boroughs showings increases. As such these figures may not actually reflect real term increases. 22,500 people or 18.7% of residents aged 16-64 are thought to be economically inactive (not in employment who have not been seeking work within the last 4 weeks and/or are unable to start work within the next 2 weeks). The Colchester rate is lower than the average for Essex (19.2%) and England (21.3%) and is the sixth lowest rate of economic inactivity in the county (Highest = Brentwood (28.1%), lowest = Braintree (12.9%)). The most common reason for working age people to be economically inactive was either looking after the home or family (38%), being a student (22.8%), or Long term sickness (16.2%). Compared to the rest of Essex, Colchester had the second highest proportion of residents looking after their home or family, 7.2% higher than the county average (30.8%) and the second lowest rate of people retired before age 65 (11.5%), 3.1% lower than the Essex Average.

33
Residents Age 16-64 Claiming Key Out of Work Benefits
Area
April 2015 April 2016 April 2017 April 2018 April 2019
Claimant Count
% Claimant
Count %
Claimant Count
% Claimant
Count %
Claimant Count
%
Basildon 2,155 1.9 2,110 1.8 2,140 1.9 2,605 2.3 3,330 2.9
Braintree 1,155 1.2 1,090 1.2 1,030 1.1 1,315 1.4 1,720 1.9
Brentwood 355 0.8 295 0.6 415 0.9 555 1.2 720 1.5
Castle Point 685 1.3 740 1.4 675 1.3 555 1.1 920 1.8
Chelmsford 1,430 1.3 1,250 1.2 1,255 1.1 1,225 1.1 1,590 1.5
Colchester 1,395 1.2 1,540 1.3 1,425 1.2 1,435 1.2 2,240 1.8
Epping Forest 1,050 1.3 925 1.1 980 1.2 1,010 1.3 1,230 1.5
Harlow 1,195 2.2 1,000 1.8 1,050 1.9 1,535 2.8 1,865 3.5
Maldon 400 1.1 360 1.0 385 1.0 380 1.0 405 1.1
Rochford 500 1.0 455 0.9 470 0.9 465 0.9 700 1.4
Tendring 2,015 2.6 2,200 2.8 2,225 2.8 2,170 2.8 3,150 4.0
Uttlesford 300 0.6 240 0.5 255 0.5 370 0.7 500 0.9
England 660,415 1.9 630,975 1.8 662,795 1.9 751,250 2.1 922,235 2.6
East 51,805 1.4 48,255 1.3 51,225 1.4 60,080 1.6 75,315 2.0
Essex 12,625 1.4 12,200 1.4 12,305 1.4 13,615 1.5 18,370 2.1
Occupations
Colchester residents are most likely to work in Professional Occupations (18.6%), Caring
Leisure or Other Service roles (13.3%), or Associate Professional & Technical Occupations
(12.3%). The smallest occupation groups were people working in Sales and Other Customer
Service Occupations (5.4%). Compared to the rest of Essex, Colchester has the highest

34
proportion of people working in Caring, Leisure and Service roles and the second highest
proportion of residents working in plant and machine operative roles.
Percentage of Residents by Employment Occupation Group (Annual Population Survey: 12 months to June 2019)
1:
ma
nag
ers
, d
ire
cto
rs a
nd
sen
ior
off
icia
ls
2:
pro
fess
ion
al
occ
up
ati
on
s
3:
ass
ocia
te p
rof
& t
ech
occ
up
ati
on
s
4:
ad
min
istr
ati
ve &
secre
tari
al
occ
up
ati
on
s
5:
skille
d t
rad
es o
cc
up
ati
on
s
6:
cari
ng
, le
isu
re a
nd
oth
er
serv
ice o
cc
up
ati
on
s
7:
sale
s a
nd
cu
sto
me
r s
erv
ice
occ
up
ati
on
s
8:
pro
ce
ss,
pla
nt
an
d m
ac
hin
e
op
era
tiv
es
9:
ele
me
nta
ry o
cc
up
ati
on
s
Basildon 7.3 18.2 17.3 11.2 8.9 11.1 9.4 4.9 11.7
Braintree 14.4 18.7 15.4 8.8 12.0 8.6 5.9 2.9 12.9
Brentwood 20.0 24.1 18.0 5.4 13.5 8.5 ! ! 6.0
Castle Point 7.8 14.2 9.7 13.2 17.6 10.2 ! 7.8 17.8
Chelmsford 13.1 22.2 16.5 9.2 9.1 10.6 5.9 3.5 10.0
Colchester 11.5 18.6 12.3 9.6 10.2 13.3 5.4 9.1 9.9
Epping Forest 19.2 22.3 12.0 11.7 12.4 6.5 3.3 5.7 6.9
Harlow 7.9 14.8 19.0 9.9 9.8 8.0 7.1 15.0 8.5
Maldon 19.0 8.2 12.8 9.3 12.0 12.5 8.7 7.3 10.2
Rochford 8.0 22.0 20.0 15.4 14.5 4.5 4.2 6.0 5.5
Tendring 16.6 14.1 13.0 10.2 16.3 9.8 8.9 1.7 9.3
Uttlesford 20.2 16.0 17.7 14.4 4.4 5.9 9.9 4.0 7.5
England 11.4 21.2 15.0 9.9 9.8 8.9 7.1 6.2 10.2
East 12.2 20.0 14.4 10.5 10.3 9.1 6.8 6.3 10.3
Essex 13.3 18.3 15.1 10.6 11.5 9.5 6.1 5.6 10.0
Housing According to the most recent statistics there are an estimated 10,835 social housing units in
the Colchester area, of which 5,945 are owned by the local authority. This is the third highest
number of social housing units of any district or borough in the Essex County Council area
(Highest: Basildon = 16,890, Lowest: Castle Point = 2,104 units).
Across both the Social and Private rented housing sector in 2018-19 a total of 64 properties
were inspected and found to have one or more "category 1 hazard". i.e. it poses a serious
and immediate risk to a person's health and safety (Highest: Epping Forest = 614, Lowest:
Brentwood = 0). All properties with these hazards were found to be in the private rented
sector and was the third highest number of unsafe properties in the county.

35
Local Authority Owned
(including those owned
by other Local Authorities)
General Needs Social
Housing Stock
(owned by RSLs)
Sum of Supported
Accommodation Housing Stock
(owned by RSLs)
Sum of Social
Housing for Older People (owned
by RSLs) Total
Essex 42,569 40102 2100 4844 89,928
Basildon 10,954 5293 220 351 16,890
Braintree 4 9499 305 713 10,622
Brentwood 2,441 759 114 169 3,483
Castle Point 1,517 460 54 73 2,104
Chelmsford 56 9458 294 286 10,140
Colchester 5,945 3988 524 355 10,835
Epping Forest
6,453 1403 58 228 8,213
Harlow 9,279 1468 197 292 11,236
Maldon 0 2178 22 812 3,012
Rochford 0 2133 45 697 2,875
Tendring 3,134 1935 198 681 5,948
Uttlesford 2,786 1528 69 187 4,570
RSL = Register Social Landlord (including Housings Associations)
Source: LA Housing Returns 2018-19; Regulator of Social Housing Statistical returns 2017/18
In 2018/19 there were a total of 4,392 households on the housing waiting list in Colchester, equivalent to 5.5% of all households in the area. During the same period, it is estimated that 527 homes were let directly or through nominations from the local authority, equivalent to 12% of households on the waiting list. Out of the total number of households on waiting list it was recorded that:
• 1,983 households (45%) were classed as being in a "reasonable preference category" (Highest: Rochford=100%/638 Households. Lowest: Maldon 10.1%/95 Households)
• 111 households (2.5%) were classed as "homeless" regardless of statutory duty to be housed (Highest: Castle Point=21.2%/114 Households. Lowest: Epping Forest and Maldon= 0 Households)
• 299 households (6.8%) were classed as being overcrowded or in unsatisfactory conditions (Highest: Tendring = 43.3%/589 Households. Lowest: Epping Forest = 0 Households)
• 533 households (12.1%) need to move due to welfare, medical or disability grounds (Highest: Rochford = 60.8%/388 Households. Lowest: Chelmsford = 4.4%/173 Households)
Compared to other areas Colchester has the largest housing waiting list in the county but a lower than average percentage of applicants classed as homeless (Essex average = 7.2%), and the second lowest percentage of people in a reasonable preference category (Essex average 54.5%).

36
Total households on the housing waiting list
Total households on
the housing waiting list in a
reasonable preference category
Percentage People who
are homeless within the meaning
given in Part VII of the Act, regardless of whether there is a statutory duty to house
them
People occupying
insanitary or overcrowded
housing or otherwise living in
unsatisfactory housing
conditions
People who need to move on medical or
welfare grounds, including grounds
relating to a disability
Count Count % Count % Count % Count % Essex 21,803 11,885 54.5% 1560 7.2% 3473 15.9% 3262 15.0% Basildon 1,169 576 49.3% 5 0.4% 441 37.7% 57 4.9%
Braintree 2,749 1,070 38.9% 47 1.7% 773 28.1% 276 10.0%
Brentwood 626 389 62.1% 57 9.1% 8 1.3% 267 42.7%
Castle Point 539 509 94.4% 114 21.2% 183 34.0% 197 36.5% Chelmsford 3,939 3,269 83.0% 494 12.5% 429 10.9% 173 4.4%
Colchester 4,392 1,983 45.2% 111 2.5% 299 6.8% 533 12.1% Epping Forest 1,376 299 21.7% 0 0.0% 0 0.0% 299 21.7%
Harlow 2,965 1,403 47.3% 537 18.1% 522 17.6% 298 10.1%
Maldon 936 95 10.1% 0 0.0% 28 3.0% 54 5.8%
Rochford 638 638 100.0% 79 12.4% 62 9.7% 388 60.8%
Tendring 1,362 1,275 93.6% 19 1.4% 589 43.2% 563 41.3%
Uttlesford 1,112 379 34.1% 97 8.7% 139 12.5% 157 14.1%
Source: LA Housing Returns 2018-19; Regulator of Social Housing Statistical returns 2017/18
Homelessness & Rough Sleeping
According to Public Health England, homeless people experience the most significant health
inequalities and that the mean life expectancy of somebody who is homeless is just 44 years
for men and 42 years for women. Colchester generally has a higher number of rough
sleepers than other areas in Essex, with a 5 year high of 35 individuals recorded in 2015. By
2018 this had fallen to 13 individuals and was the second highest number out of all Districts
and Boroughs. Compared to the average rates of rough sleeping in other areas, Colchester
had estimated 1.63 rough sleepers to every 10,000 households in the area. This is lower
than the average for England (2.01 per 10,000) but higher than the average for the rest of
the Essex County council area (1.09) and is the third highest rate compared to the other
districts and boroughs (Highest: Harlow = 2.51, Lowest: Castle Point, Maldon, Uttlesford =
0).
In 2018 Colchester (as well as Basildon, Harlow and Southend-on-Sea) was selected as one
83 areas nationally to receive additional funding to tackle rough sleeping in their areas, at
the same time these areas have all seen the largest overall reductions in the number of
rough sleepers identified in the last count.

37
In this area the nine out of the 13 of rough sleepers identified were aged 26 years or older
(69%) with the remaining 4 people (31%) age unknown. Within this group 9 people were also
identified as male and the remaining 4 people were of unknown gender.
Under 18 18 - 25 26 or over Age not known
Count % Count % Count % Count %
England 1 0.02% 295 6.3% 3744 80.1% 637 13.6%
East of England 0 0.00% 28 5.8% 395 81.6% 61 12.6%
Essex 0 0.00% 1 1.5% 47 70.1% 19 28.4%
Basildon 0 0.00% 1 8.3% 11 91.7% 0 0.0%
Braintree 0 0.00% 0 0 5 100.0% 0 0.0%
Brentwood 0 0.00% 0 0 2 100.0% 0 0.0%
Castle Point 0 0.00% 0 0 0 0.0% 0 0.0%
Chelmsford 0 0.00% 0 0 6 42.9% 8 57.1%
Colchester 0 0.00% 0 0 9 69.2% 4 30.8%
Epping Forest 0 0.00% 0 0 0 0.0% 3 100.0%
Harlow 0 0.00% 0 0 9 100.0% 0 0.0%
Maldon 0 0.00% 0 0 0 0.0% 0 0.0%
Rochford 0 0.00% 0 0 0 0.0% 3 100.0%
Tendring 0 0.00% 0 0 5 83.3% 1 16.7%
Uttlesford 0 0.00% 0 0 0 0.0% 0 0.0%
Crime and Community Safety Nationally and locally the number of crimes recorded by the police force in England and Wales is on the increase. Over a four year period the number of crimes recorded in the Colchester area has risen by 48.8% from 11,995 incidents or 66 crimes per 1000 residents in 2015/16 to 17,845 crimes or 94 crimes per 1000 in 2018/19. The overall crime rate for Colchester is higher than the average for England (89 per 1000) but is similar to the Essex Police average (87 per 1000) and is the 6th (out of 14) highest local authority in Essex (including Southend and Thurrock). The largest category of crime in the area for the last year was Violent Crime which accounted for 7,119 (39.9%) offences or a rate of 37 crimes per 1000; higher than the average rate for Essex police (32 per 1000) or for England (28 per 1000). Theft makes up the second largest category with 30.9% of crimes or a rate of 29 per 1000; lower than the Essex Police (32 per 1000) average but just above the rate for England (28 per 1000). The proportion of Violent Crime is just above the average for Essex Police whilst theft is slightly lower (Violent Crime = 36.2%, Theft = 35.3%). The most significant four year change in the number of crimes recorded in the Colchester area is the increase in the levels of Violent Crime, which has seen an additional 3,506 offences in 2018/19 (an increase of 97%) compared to the same period in 2015/16. The increase in the rate of violent Crime locally reflects a national trend which includes an increase in the number of crimes recorded as stalking or harassment. Nationally the Crown Prosecution Service (CPS) reports that there was a 69% increase in prosecutions started for stalking offences from 2016–17 to 2017–18 because of improvements in awareness following a police and CPS inspection and the implementation of Violence Against Women

38
Strategies. This development is reflected locally with 2500 crimes recorded as stalking or harassment in 2018/19 up from 1245in 2017/18. Environmental Health and Licencing The Marmot Review (2008) identified different health outcomes could be associated with the prevalence of certain build environment factors in their area such as the rate of noise complaints, the number of alcohol licences in an area, to the density of fast food outlets in a neighbourhood. Noise Excessive noise can have a range of impacts on our health from directly affecting our auditory system and hearing, to impacting our physical and mental health and quality of life; especially through long term exposure. Modelled estimates from based on data collected by the Chartered Institute of Environmental Health (CIEH) give an estimate for the rate of complaints per 1000 people about excessive noise from neighbours, their neighbourhood or the environment. Public Health England estimates that in 2016 there was an average of 7.2 noise complaints per 1000 residents across the Colchester area; higher than the average rates for Essex (4.8) or England (6.3). Compared to other areas this was the 3rd highest estimated rate in the Essex County Council area (Highest: Epping Forest = 9.8, Lowest: Castle Point = 1.6). Alcohol Licences Number of premises permitted to sell or supply alcohol on trade and/or off trade is another measure used to look at the impact of the physical environment on health, particularly when considering alcohol related harm and illness. Local Alcohol Profiles for England estimate that in 2016/17 there were an average of 1.9 licenced premises per square kilometre in the Colchester area, higher than the England average of 1.4 (data is not available for an Essex countywide average). Compared to other districts in Essex this is the 4th highest area* (Highest: Harlow = 5.4, Lowest: Uttlesford = 0.5). Density of Fast Food Outlets The availability of fast food is an issue which is associated with a range of negative health outcomes for our communities such as obesity. This indicator calculates the number of fast food outlets per 100,000 population at an area level as a proxy for the density of these businesses within a particular local authority area. In 2014 it was estimated that Chelmsford had a density of 71.5 per 100,000, higher than the Essex (69.5) average but lower than England (88.2). Compared to other districts, this is the 5th highest density in Essex (Highest: Tendring = 95.8, Lowest: Uttlesford = 41.6).
39
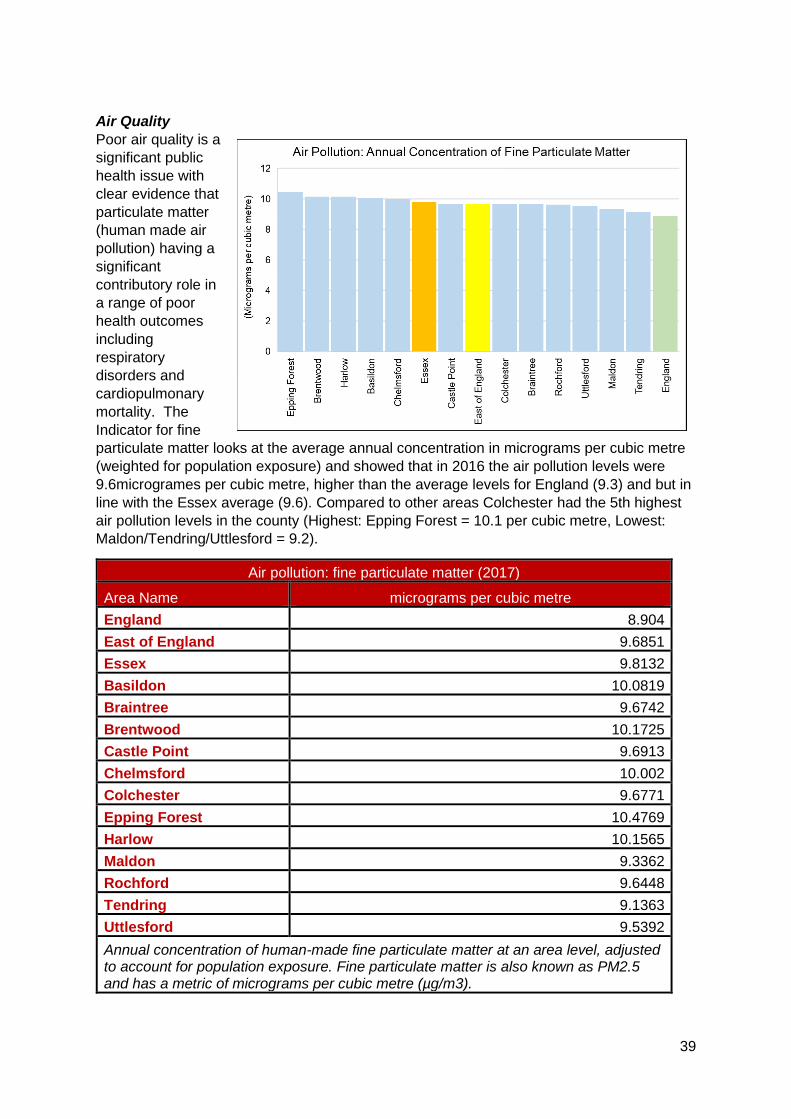
Air Quality
Poor air quality is a
significant public
health issue with
clear evidence that
particulate matter
(human made air
pollution) having a
significant
contributory role in
a range of poor
health outcomes
including
respiratory
disorders and
cardiopulmonary
mortality. The
Indicator for fine
particulate matter looks at the average annual concentration in micrograms per cubic metre
(weighted for population exposure) and showed that in 2016 the air pollution levels were
9.6microgrames per cubic metre, higher than the average levels for England (9.3) and but in
line with the Essex average (9.6). Compared to other areas Colchester had the 5th highest
air pollution levels in the county (Highest: Epping Forest = 10.1 per cubic metre, Lowest:
Maldon/Tendring/Uttlesford = 9.2).
Air pollution: fine particulate matter (2017)
Area Name micrograms per cubic metre
England 8.904
East of England 9.6851
Essex 9.8132
Basildon 10.0819
Braintree 9.6742
Brentwood 10.1725
Castle Point 9.6913
Chelmsford 10.002
Colchester 9.6771
Epping Forest 10.4769
Harlow 10.1565
Maldon 9.3362
Rochford 9.6448
Tendring 9.1363
Uttlesford 9.5392
Annual concentration of human-made fine particulate matter at an area level, adjusted to account for population exposure. Fine particulate matter is also known as PM2.5 and has a metric of micrograms per cubic metre (µg/m3).

40
41
LIFESTYLE, SEXUAL HEALTH & SUBSTANCE
MISUSE
This Section brings together datasets looking at a range of lifestyle and behavioural factors
which can impact on long term health outcomes and increase or decrease the likelihood of
developing a range of conditions or require more serious treatments going forward. This
section includes:
• Children’s Weight
• Adult Healthy Eating, Obesity and Physical Activity
• Sexual Health
• Substance Misuse
CHILDREN’S WEIGHT
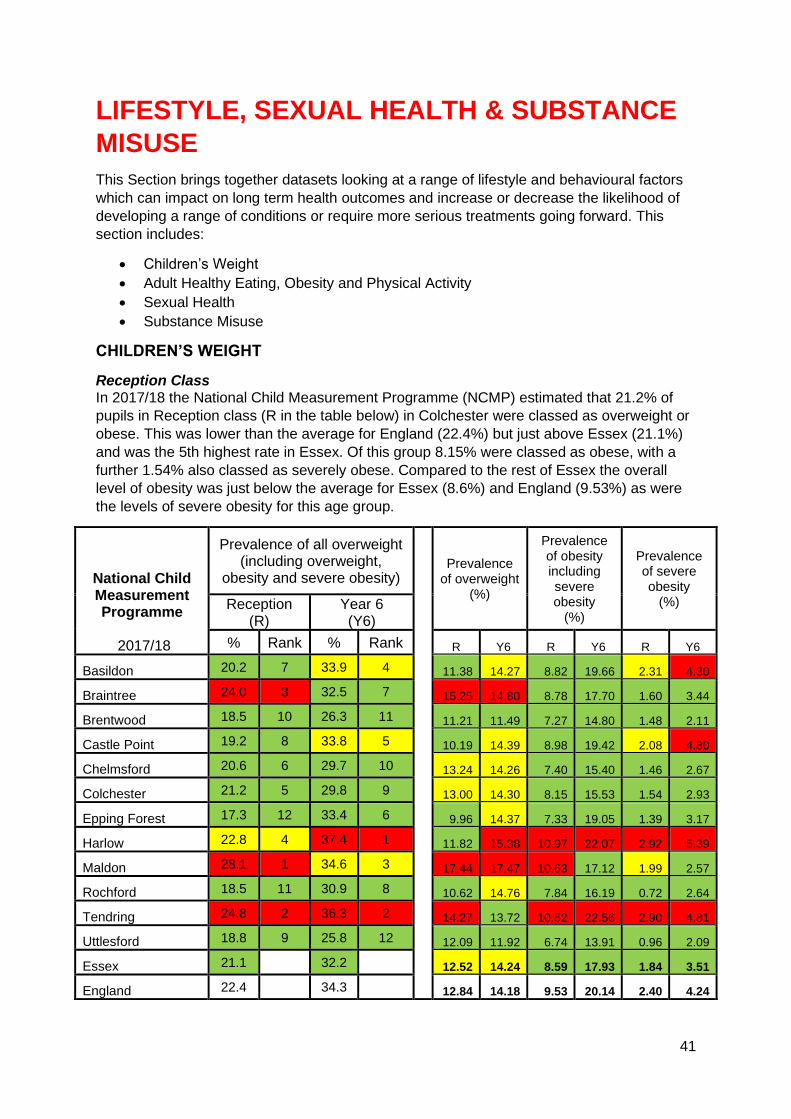
Reception Class In 2017/18 the National Child Measurement Programme (NCMP) estimated that 21.2% of
pupils in Reception class (R in the table below) in Colchester were classed as overweight or
obese. This was lower than the average for England (22.4%) but just above Essex (21.1%)
and was the 5th highest rate in Essex. Of this group 8.15% were classed as obese, with a
further 1.54% also classed as severely obese. Compared to the rest of Essex the overall
level of obesity was just below the average for Essex (8.6%) and England (9.53%) as were
the levels of severe obesity for this age group.
National Child Measurement Programme
2017/18
Prevalence of all overweight (including overweight,
obesity and severe obesity)
Prevalence of overweight
(%)
Prevalence of obesity including severe obesity
(%)
Prevalence of severe obesity
(%) Reception (R)
Year 6 (Y6)
% Rank % Rank R Y6 R Y6 R Y6
Basildon 20.2 7 33.9 4 11.38 14.27 8.82 19.66 2.31 4.30
Braintree 24.0 3 32.5 7 15.25 14.80 8.78 17.70 1.60 3.44
Brentwood 18.5 10 26.3 11 11.21 11.49 7.27 14.80 1.48 2.11
Castle Point 19.2 8 33.8 5 10.19 14.39 8.98 19.42 2.08 4.80
Chelmsford 20.6 6 29.7 10 13.24 14.26 7.40 15.40 1.46 2.67
Colchester 21.2 5 29.8 9 13.00 14.30 8.15 15.53 1.54 2.93
Epping Forest 17.3 12 33.4 6 9.96 14.37 7.33 19.05 1.39 3.17
Harlow 22.8 4 37.4 1 11.82 15.38 10.97 22.07 2.92 5.39
Maldon 28.1 1 34.6 3 17.44 17.47 10.63 17.12 1.99 2.57
Rochford 18.5 11 30.9 8 10.62 14.76 7.84 16.19 0.72 2.64
Tendring 24.8 2 36.3 2 14.27 13.72 10.52 22.56 2.90 4.81
Uttlesford 18.8 9 25.8 12 12.09 11.92 6.74 13.91 0.96 2.09
Essex 21.1 32.2 12.52 14.24 8.59 17.93 1.84 3.51
England 22.4 34.3 12.84 14.18 9.53 20.14 2.40 4.24
42
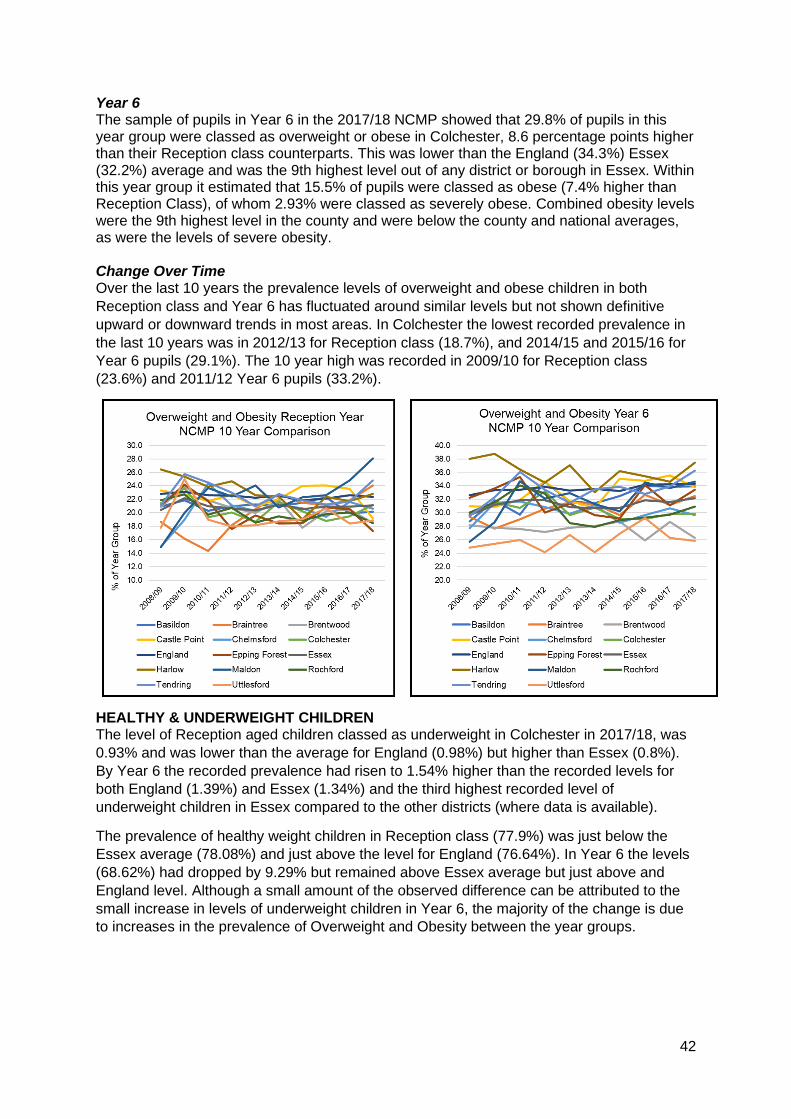
Year 6 The sample of pupils in Year 6 in the 2017/18 NCMP showed that 29.8% of pupils in this year group were classed as overweight or obese in Colchester, 8.6 percentage points higher than their Reception class counterparts. This was lower than the England (34.3%) Essex (32.2%) average and was the 9th highest level out of any district or borough in Essex. Within this year group it estimated that 15.5% of pupils were classed as obese (7.4% higher than Reception Class), of whom 2.93% were classed as severely obese. Combined obesity levels were the 9th highest level in the county and were below the county and national averages, as were the levels of severe obesity. Change Over Time Over the last 10 years the prevalence levels of overweight and obese children in both
Reception class and Year 6 has fluctuated around similar levels but not shown definitive
upward or downward trends in most areas. In Colchester the lowest recorded prevalence in
the last 10 years was in 2012/13 for Reception class (18.7%), and 2014/15 and 2015/16 for
Year 6 pupils (29.1%). The 10 year high was recorded in 2009/10 for Reception class
(23.6%) and 2011/12 Year 6 pupils (33.2%).
HEALTHY & UNDERWEIGHT CHILDREN The level of Reception aged children classed as underweight in Colchester in 2017/18, was
0.93% and was lower than the average for England (0.98%) but higher than Essex (0.8%).
By Year 6 the recorded prevalence had risen to 1.54% higher than the recorded levels for
both England (1.39%) and Essex (1.34%) and the third highest recorded level of
underweight children in Essex compared to the other districts (where data is available).
The prevalence of healthy weight children in Reception class (77.9%) was just below the
Essex average (78.08%) and just above the level for England (76.64%). In Year 6 the levels
(68.62%) had dropped by 9.29% but remained above Essex average but just above and
England level. Although a small amount of the observed difference can be attributed to the
small increase in levels of underweight children in Year 6, the majority of the change is due
to increases in the prevalence of Overweight and Obesity between the year groups.

43
Time Period: 2017/18
Prevalence of underweight (%)
Prevalence of healthy weight (%)
R Y6 R Y6
Basildon 0.70 1.40 79.10 64.67
Braintree 0.47 1.03 75.49 66.47
Brentwood 0.99 ! 80.54 !
Castle Point ! 1.17 ! 65.03
Chelmsford 0.76 1.59 78.61 68.75
Colchester 0.93 1.54 77.91 68.62
Epping Forest 1.32 1.51 81.39 65.08
Harlow 1.46 1.22 75.75 61.34
Maldon ! ! ! !
Rochford ! 2.42 ! 66.63
Tendring 0.56 0.93 74.65 62.79
Uttlesford 0.86 1.26 80.32 72.91
Essex 0.80 1.34 78.08 66.49
England 0.98 1.39 76.64 64.29
Adult Obesity, Healthy Eating, and Physical Activity Of residents in Colchester aged over 18 years, 64.36% were classified as overweight or obese in 2016/17. This is relatively similar to the prevalence of adult overweight or obesity across the whole of Essex (63.56%), but higher than England (61.29%) and was ranked as being the 5th highest prevalence across the Essex Districts (highest: Basildon 70.47%; lowest: Uttlesford 55.32%). The proportion of adults aged over 16 years meeting the recommended fruit and vegetable intake of 5 portions on a ‘usual day’ was 54.6% in 2016/17. This was just below the proportion meeting this recommendation across Essex (55.96%), lower than England (57.44%) and was ranked as being the 9th highest proportion across the Districts in Essex (highest: Braintree 62.92%; lowest: Harlow 46.23%).
Percentage eating the recommended “5 a day”
Percentage of Adults who are overweight or obese
Percentage who take part in Organised sport
Value Rank Value Rank Value Value
Basildon 50.2% 11 70.5% 1 29.5% 10
Braintree 62.9% 1 60.8% 8 33.7% 9
Brentwood 62.1% 3 58.5% 10 43.0% 2
Castle Point 58.2% 5 65.1% 4 35.1% 6
Chelmsford 53.7% 10 63.3% 6 38.2% 5
Colchester 54.6% 9 64.4% 5 35.1% 7
Epping Forest 56.7% 6 58.8% 9 46.9% 1
Harlow 46.2% 12 66.9% 3 25.8% 11
Maldon 59.7% 4 57.9% 11 34.6% 8
Rochford 55.3% 7 61.4% 7 41.0% 4
Tendring 54.7% 8 67.5% 2 22.1% 12
Uttlesford 62.7% 2 55.3% 12 42.6% 3
Essex 55.9% - 63.6% - 35% -
England 57.4% - 61.3% - - -
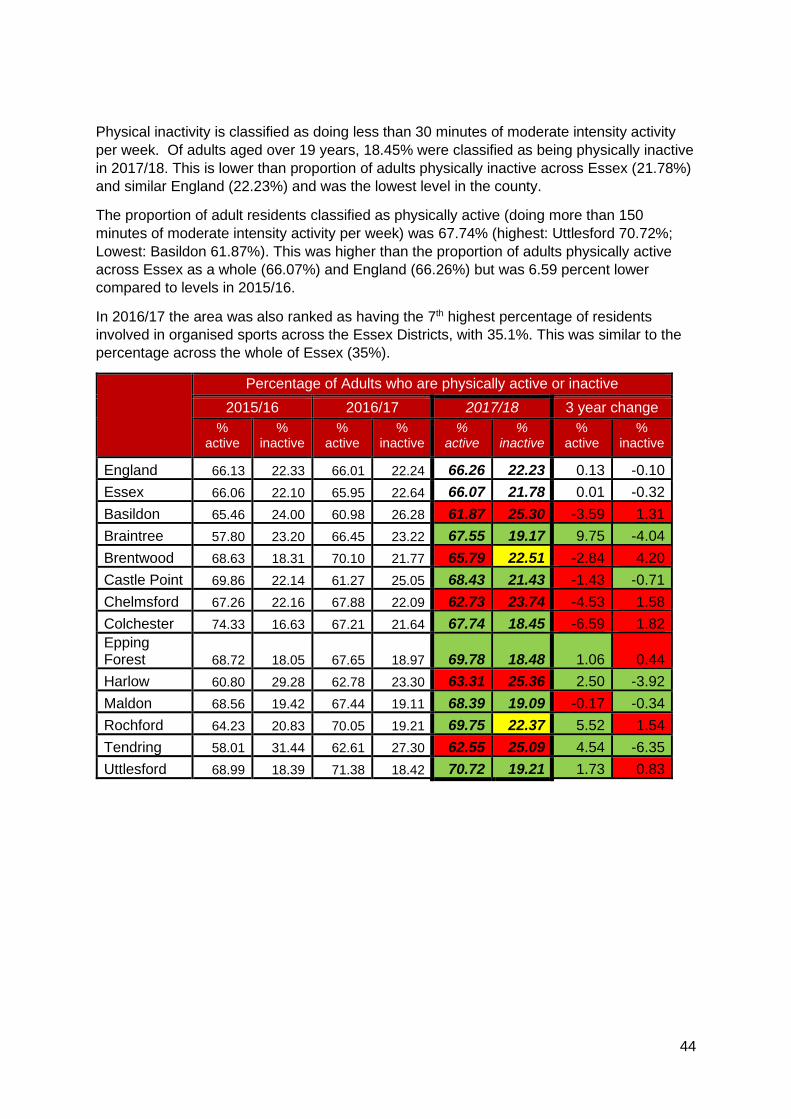
44
Physical inactivity is classified as doing less than 30 minutes of moderate intensity activity
per week. Of adults aged over 19 years, 18.45% were classified as being physically inactive
in 2017/18. This is lower than proportion of adults physically inactive across Essex (21.78%)
and similar England (22.23%) and was the lowest level in the county.
The proportion of adult residents classified as physically active (doing more than 150
minutes of moderate intensity activity per week) was 67.74% (highest: Uttlesford 70.72%;
Lowest: Basildon 61.87%). This was higher than the proportion of adults physically active
across Essex as a whole (66.07%) and England (66.26%) but was 6.59 percent lower
compared to levels in 2015/16.
In 2016/17 the area was also ranked as having the 7th highest percentage of residents
involved in organised sports across the Essex Districts, with 35.1%. This was similar to the
percentage across the whole of Essex (35%).
Percentage of Adults who are physically active or inactive
2015/16 2016/17 2017/18 3 year change
% active
% inactive
% active
% inactive
% active
% inactive
% active
% inactive
England 66.13 22.33 66.01 22.24 66.26 22.23 0.13 -0.10
Essex 66.06 22.10 65.95 22.64 66.07 21.78 0.01 -0.32
Basildon 65.46 24.00 60.98 26.28 61.87 25.30 -3.59 1.31
Braintree 57.80 23.20 66.45 23.22 67.55 19.17 9.75 -4.04
Brentwood 68.63 18.31 70.10 21.77 65.79 22.51 -2.84 4.20
Castle Point 69.86 22.14 61.27 25.05 68.43 21.43 -1.43 -0.71
Chelmsford 67.26 22.16 67.88 22.09 62.73 23.74 -4.53 1.58
Colchester 74.33 16.63 67.21 21.64 67.74 18.45 -6.59 1.82
Epping Forest 68.72 18.05 67.65 18.97 69.78 18.48 1.06 0.44
Harlow 60.80 29.28 62.78 23.30 63.31 25.36 2.50 -3.92
Maldon 68.56 19.42 67.44 19.11 68.39 19.09 -0.17 -0.34
Rochford 64.23 20.83 70.05 19.21 69.75 22.37 5.52 1.54
Tendring 58.01 31.44 62.61 27.30 62.55 25.09 4.54 -6.35
Uttlesford 68.99 18.39 71.38 18.42 70.72 19.21 1.73 0.83

45
SEXUAL HEALTH
New STI Diagnosis According to Public Health England in 2017, the rate of new STI diagnoses among persons in the Colchester area was 721.11 per 100,000 population aged between 15 - 64 years. This was the second highest rate compared across the other Districts in Essex and higher than that for Essex as a whole (580.81), but lower to that for England (793.85). STI diagnoses excluded chlamydia in under 25 year olds, and was among persons attending specialist (level 3) and non-specialist (level 1 and 2) sexual health services. Chlamydia The proportion of all 15 - 24 year olds in the Colchester area in 2017 screened for chlamydia with asymptomatic screens and symptomatic tests at sexual health services was 18.2%. This was the second highest proportion compared to that of the other Districts in Essex and higher than that across the whole of Essex (15.5), but lower than that for England (19.3).
New STI diagnoses (excluding chlamydia aged <25) / 100,000
Chlamydia proportion aged 15-24 screened
Value Rank % Rank
Basildon 647.54 4 14.5 5
Braintree 414.14 11 12.5 11
Brentwood 560.57 6 13.2 8
Castle Point 520.65 7 12.4 12
Chelmsford 561.50 5 15.3 4
Colchester 721.10 2 18.2 2
Epping Forest 653.27 3 15.5 3
Harlow 1042.41 1 29.5 1
Maldon 364.71 12 13.1 9
Rochford 438.23 9 13.7 6
Tendring 430.44 10 13.1 10
Uttlesford 459.94 8 13.7 7
Essex 580.81 15.5
England 793.85 19.3
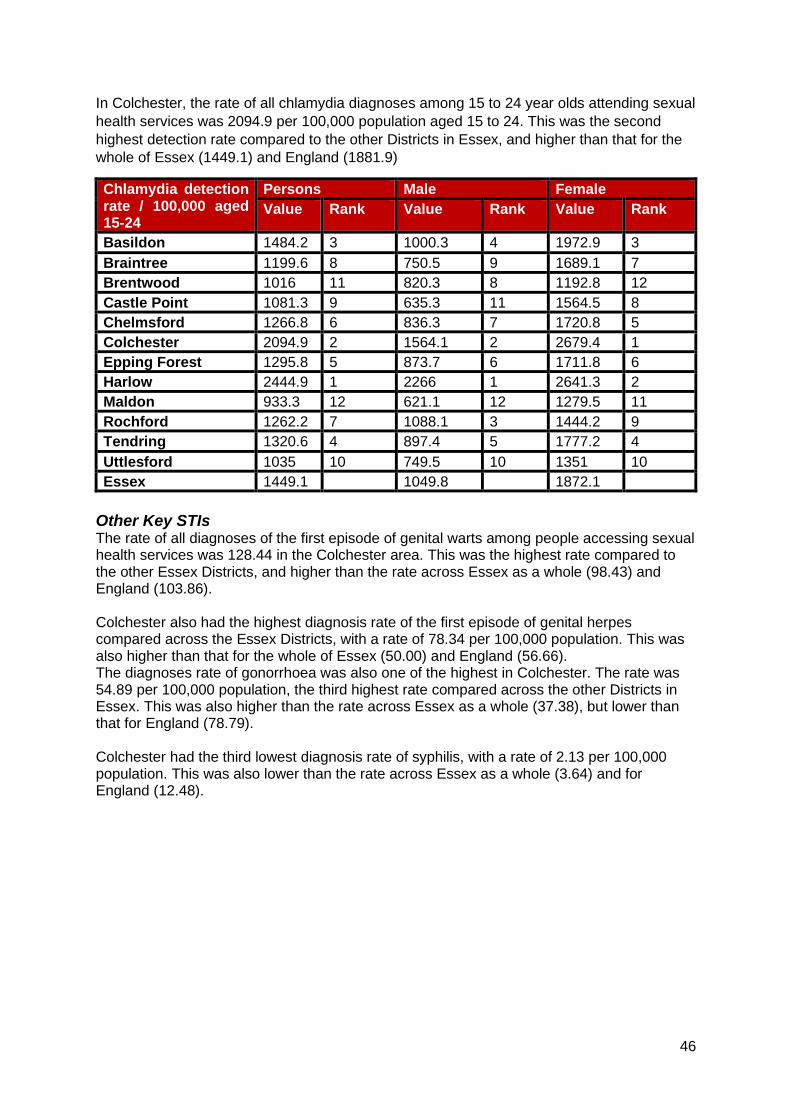
46
In Colchester, the rate of all chlamydia diagnoses among 15 to 24 year olds attending sexual
health services was 2094.9 per 100,000 population aged 15 to 24. This was the second
highest detection rate compared to the other Districts in Essex, and higher than that for the
whole of Essex (1449.1) and England (1881.9)
Chlamydia detection rate / 100,000 aged 15-24
Persons Male Female
Value Rank Value Rank Value Rank
Basildon 1484.2 3 1000.3 4 1972.9 3
Braintree 1199.6 8 750.5 9 1689.1 7
Brentwood 1016 11 820.3 8 1192.8 12
Castle Point 1081.3 9 635.3 11 1564.5 8
Chelmsford 1266.8 6 836.3 7 1720.8 5
Colchester 2094.9 2 1564.1 2 2679.4 1
Epping Forest 1295.8 5 873.7 6 1711.8 6
Harlow 2444.9 1 2266 1 2641.3 2
Maldon 933.3 12 621.1 12 1279.5 11
Rochford 1262.2 7 1088.1 3 1444.2 9
Tendring 1320.6 4 897.4 5 1777.2 4
Uttlesford 1035 10 749.5 10 1351 10
Essex 1449.1 1049.8 1872.1
Other Key STIs The rate of all diagnoses of the first episode of genital warts among people accessing sexual health services was 128.44 in the Colchester area. This was the highest rate compared to the other Essex Districts, and higher than the rate across Essex as a whole (98.43) and England (103.86). Colchester also had the highest diagnosis rate of the first episode of genital herpes compared across the Essex Districts, with a rate of 78.34 per 100,000 population. This was also higher than that for the whole of Essex (50.00) and England (56.66). The diagnoses rate of gonorrhoea was also one of the highest in Colchester. The rate was 54.89 per 100,000 population, the third highest rate compared across the other Districts in Essex. This was also higher than the rate across Essex as a whole (37.38), but lower than that for England (78.79). Colchester had the third lowest diagnosis rate of syphilis, with a rate of 2.13 per 100,000 population. This was also lower than the rate across Essex as a whole (3.64) and for England (12.48).

47
SUBSTANCE MISUSE Smoking In Colchester in 2017, the prevalence of current smokers among persons aged over 18 years was 15.99. This was the 5th highest prevalence compared to other Districts in Essex. Smoking attributable mortality over the three year period of 2012 - 14 was estimated to be 245.69, of which 27.66 was due to heart disease. Overall, it was estimated that 1249.99 potential years of life were lost due to smoking in Colchester. Colchester had the second lowest prevalence of ex-smokers among persons aged over 18 years out of the Districts in Essex, with a prevalence of 24.80. This was slightly lower than that across Essex as a whole (29.51) and England (26.17).
See table below for the ranked prevalence of current and previous smoking status across
the Districts in Essex in 2017/18.
Smoking prevalence in adults by current and previous status (Annual Population Survey, 2017)
Current smoker Ex-smoker Never-smoked
% Rank % Rank % Rank
Basildon 16.72 3 28.18 8 55.10 7
Braintree 17.15 2 31.19 6 51.65 9
Brentwood 6.48 11 18.37 12 75.15 1
Castle Point 21.48 1 33.89 4 44.62 12
Chelmsford 12.02 8 28.75 7 59.23 4
Colchester 15.99 5 24.80 11 59.20 5
Epping Forest 7.84 10 25.72 10 66.44 2
Harlow 14.81 6 38.19 1 47.01 11
Maldon 5.33 12 37.50 2 57.17 6
Rochford 10.98 9 28.02 9 61.00 3
Tendring 16.72 4 32.03 5 51.25 10
Uttlesford 12.33 7 34.38 3 53.29 8
Essex 13.84 - 29.51 - 56.65 -
England 14.87 - 26.17 - 58.96 -
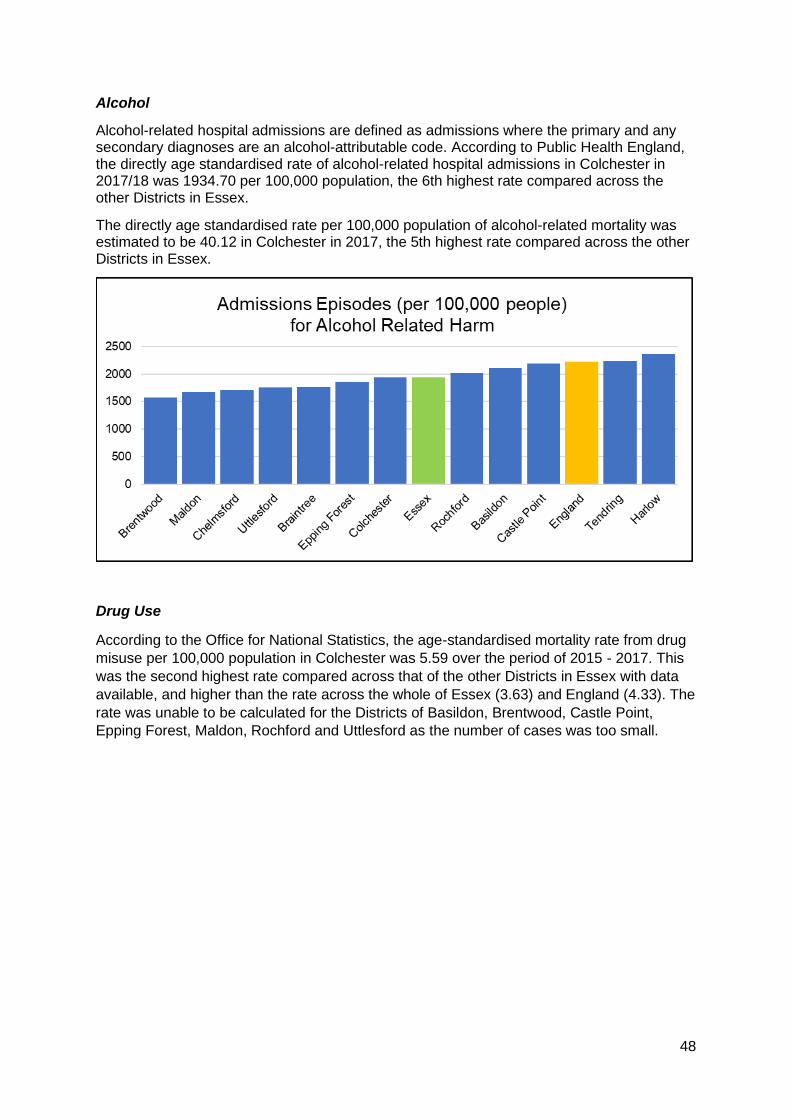
48
Alcohol
Alcohol-related hospital admissions are defined as admissions where the primary and any secondary diagnoses are an alcohol-attributable code. According to Public Health England, the directly age standardised rate of alcohol-related hospital admissions in Colchester in 2017/18 was 1934.70 per 100,000 population, the 6th highest rate compared across the other Districts in Essex.
The directly age standardised rate per 100,000 population of alcohol-related mortality was estimated to be 40.12 in Colchester in 2017, the 5th highest rate compared across the other Districts in Essex.
Drug Use
According to the Office for National Statistics, the age-standardised mortality rate from drug
misuse per 100,000 population in Colchester was 5.59 over the period of 2015 - 2017. This
was the second highest rate compared across that of the other Districts in Essex with data
available, and higher than the rate across the whole of Essex (3.63) and England (4.33). The
rate was unable to be calculated for the Districts of Basildon, Brentwood, Castle Point,
Epping Forest, Maldon, Rochford and Uttlesford as the number of cases was too small.

49
Alcohol and Drugs
Alcohol-related hospital admission rate per 100K
Alcohol mortality Deaths from drug misuse
Value Rank Value Rank Count Rate Per 100K
Basildon 2111.07 4 46.31 2 9 *
Braintree 1761.831 8 41.66 4 18 4.19
Brentwood 1576.501 12 39.80 6 2 *
Castle Point
2194.25 3 39.46 7 9 *
Chelmsford 1713.9 10 38.26 8 12 2.33
Colchester 1934.702 6 40.12 5 31 5.59
Epping Forest
1856.899 7 35.50 10 8 *
Harlow 2360.043 1 44.38 3 14 5.51
Maldon 1675.22 11 37.67 9 7 *
Rochford 2022.617 5 32.49 12 8 *
Tendring 2237.576 2 61.49 1 27 7.60
Uttlesford 1749.756 9 33.78 11 5 *
Essex 1935.651 - 41.90 - 150 3.63
England 2223.806 - 46.15 - 6996 4.33
*value cannot be calculated as number of cases too small

50
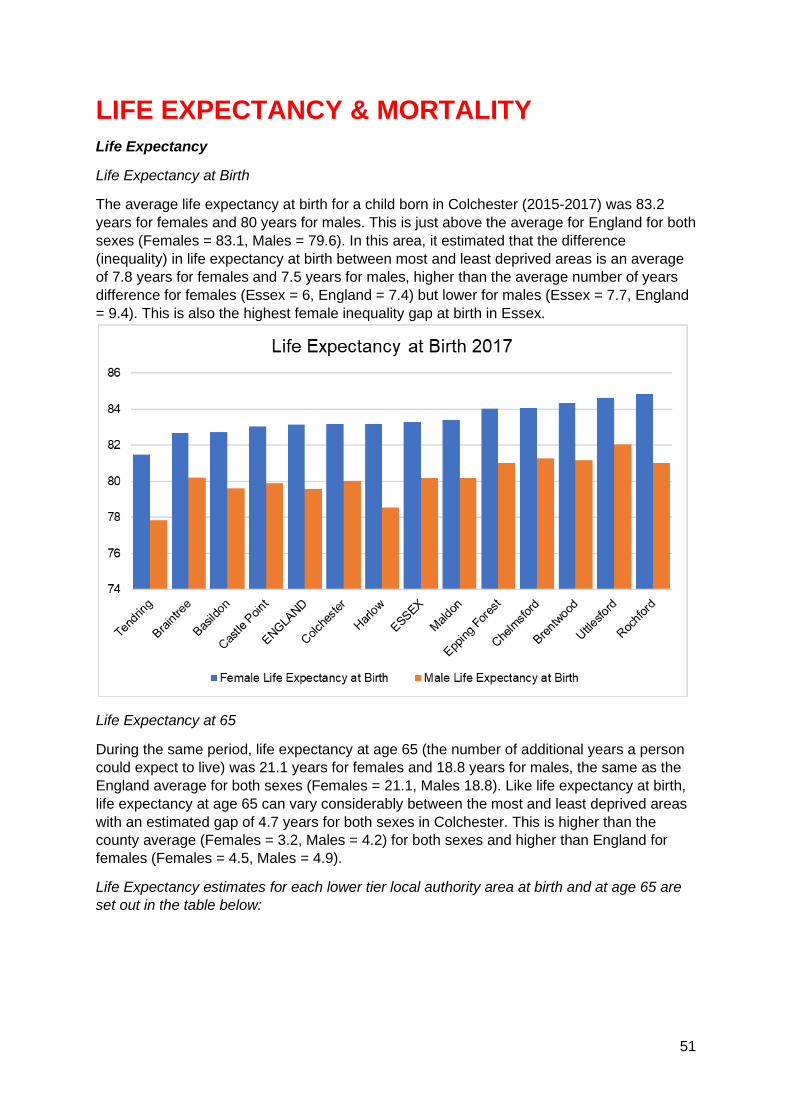
51
LIFE EXPECTANCY & MORTALITY
Life Expectancy
Life Expectancy at Birth
The average life expectancy at birth for a child born in Colchester (2015-2017) was 83.2
years for females and 80 years for males. This is just above the average for England for both
sexes (Females = 83.1, Males = 79.6). In this area, it estimated that the difference
(inequality) in life expectancy at birth between most and least deprived areas is an average
of 7.8 years for females and 7.5 years for males, higher than the average number of years
difference for females (Essex = 6, England = 7.4) but lower for males (Essex = 7.7, England
= 9.4). This is also the highest female inequality gap at birth in Essex.
Life Expectancy at 65
During the same period, life expectancy at age 65 (the number of additional years a person
could expect to live) was 21.1 years for females and 18.8 years for males, the same as the
England average for both sexes (Females = 21.1, Males 18.8). Like life expectancy at birth,
life expectancy at age 65 can vary considerably between the most and least deprived areas
with an estimated gap of 4.7 years for both sexes in Colchester. This is higher than the
county average (Females = 3.2, Males = 4.2) for both sexes and higher than England for
females (Females = 4.5, Males = 4.9).
Life Expectancy estimates for each lower tier local authority area at birth and at age 65 are
set out in the table below:

52
Female Life Expectancy Male Life Expectancy
At 65 At
birth
Inequality in LE
At 65 At
birth
Inequality in LE
At 65 At Birth
At 65 At Birth
England 21.1 83.1 4.5 7.4 18.8 79.6 4.9 9.4
Essex 21.2 83.3 3.2 6 18.9 80.2 4.2 7.7
Basildon 21.1 82.7 4 7.5 18.6 79.6 5.1 9.6
Braintree 20.6 82.7 2.1 5 18.7 80.2 2.4 5.5
Brentwood 21.6 84.3 5.1 7 19.4 81.2 5.9 9.9
Castle Point 20.8 83.0 2.6 4.3 18.4 79.9 3.6 6
Chelmsford 21.6 84.0 2.7 4.5 19.8 81.3 3.3 6
Colchester 21.1 83.2 4.7 7.8 18.8 80.0 4.7 7.5
Epping Forest 21.1 84.0 3.3 5.6 19.1 81.0 4.1 6.6
Harlow 21.3 83.2 2.6 5.1 18.3 78.5 5.3 7.8
Maldon 21.7 83.4 1.9 2.3 19.0 80.2 1.9 3.9
Rochford 21.9 84.8 2.6 4.4 19.1 81.0 2.8 3.2
Tendring 20.6 81.5 4 7 18.2 77.8 4.5 10.8
Uttlesford 22.0 84.6 0.6 -0.3 20.0 82.1 1.9 2.2
Mortality
In 2017 the Colchester area had an all ages mortality rate of 985.4 deaths per 100,000
residents, based on 1631 deaths recorded during that time period. This overall mortality rate
was higher than the England average of 958.7 (per 100K), but was a slight decrease
compared the previous year (992.5 per 100K). Looking at mortality rates across the different
age groups, 43.9% of all deaths during this period were from residents aged 85 years and
over with an age standardised mortality rate of 17555.6 per 100K (based 716 actual deaths).
This was higher than the England average (40.4%, 15280.8 per 100K) and Essex rate
(43.3%, 16031.7 per 100K). Mortality rates for residents aged 75-84 (4452.0 per 100,000)
were also higher than the England (4287.1) and Essex (4268.1) averages, whilst all other
age groups were lower.
Premature Mortality
The Colchester Borough has the sixth highest rate of all premature mortalities in Essex with
a rate of 298 deaths per 100,000 residents under the age of 75. This is 11.3% lower than to
the average for England, 3% lower than the average for the county, and 15.3% higher than
the best performing area (Uttlesford). Despite this relatively good performance compared to
county and national levels there, some health inequalities persist for residents living in some
in more deprived neighbourhoods.
There is also a significant difference the under 75 mortality rates between females (231 per
100,000) and males (371 per 100,000) a difference of 37% slightly larger than the average
difference across England (34%).
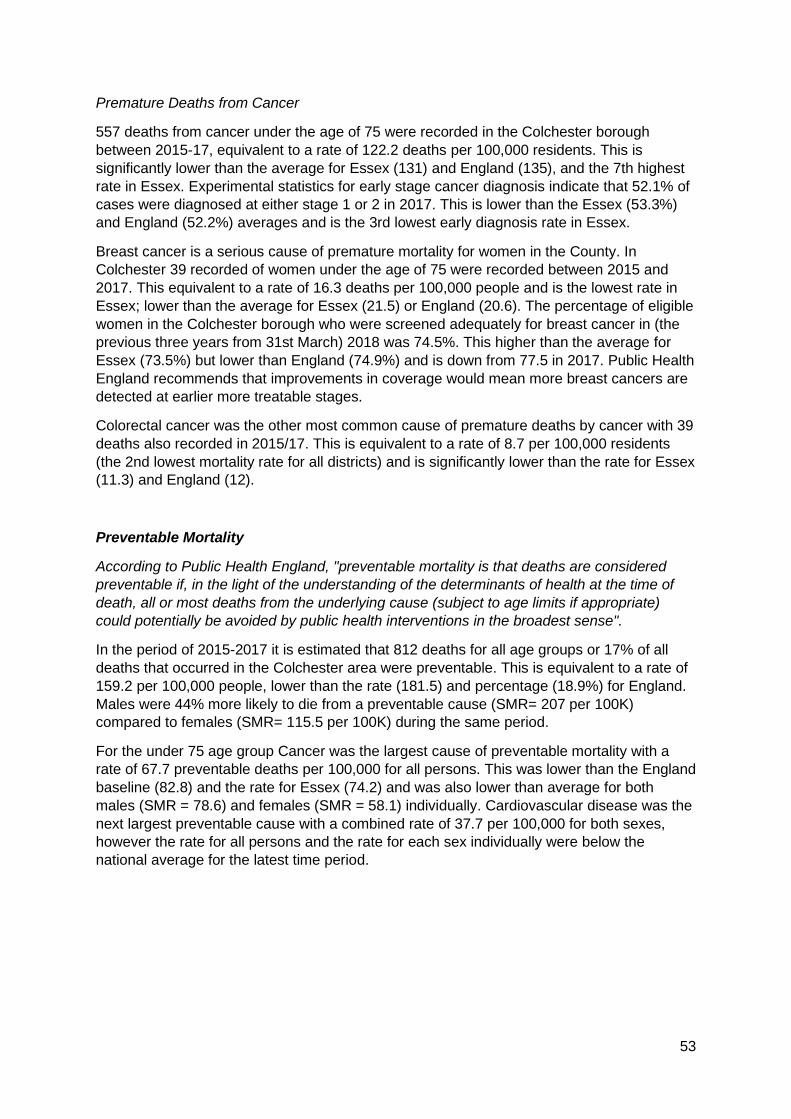
53
Premature Deaths from Cancer
557 deaths from cancer under the age of 75 were recorded in the Colchester borough
between 2015-17, equivalent to a rate of 122.2 deaths per 100,000 residents. This is
significantly lower than the average for Essex (131) and England (135), and the 7th highest
rate in Essex. Experimental statistics for early stage cancer diagnosis indicate that 52.1% of
cases were diagnosed at either stage 1 or 2 in 2017. This is lower than the Essex (53.3%)
and England (52.2%) averages and is the 3rd lowest early diagnosis rate in Essex.
Breast cancer is a serious cause of premature mortality for women in the County. In
Colchester 39 recorded of women under the age of 75 were recorded between 2015 and
2017. This equivalent to a rate of 16.3 deaths per 100,000 people and is the lowest rate in
Essex; lower than the average for Essex (21.5) or England (20.6). The percentage of eligible
women in the Colchester borough who were screened adequately for breast cancer in (the
previous three years from 31st March) 2018 was 74.5%. This higher than the average for
Essex (73.5%) but lower than England (74.9%) and is down from 77.5 in 2017. Public Health
England recommends that improvements in coverage would mean more breast cancers are
detected at earlier more treatable stages.
Colorectal cancer was the other most common cause of premature deaths by cancer with 39
deaths also recorded in 2015/17. This is equivalent to a rate of 8.7 per 100,000 residents
(the 2nd lowest mortality rate for all districts) and is significantly lower than the rate for Essex
(11.3) and England (12).
Preventable Mortality
According to Public Health England, "preventable mortality is that deaths are considered
preventable if, in the light of the understanding of the determinants of health at the time of
death, all or most deaths from the underlying cause (subject to age limits if appropriate)
could potentially be avoided by public health interventions in the broadest sense".
In the period of 2015-2017 it is estimated that 812 deaths for all age groups or 17% of all
deaths that occurred in the Colchester area were preventable. This is equivalent to a rate of
159.2 per 100,000 people, lower than the rate (181.5) and percentage (18.9%) for England.
Males were 44% more likely to die from a preventable cause (SMR= 207 per 100K)
compared to females (SMR= 115.5 per 100K) during the same period.
For the under 75 age group Cancer was the largest cause of preventable mortality with a
rate of 67.7 preventable deaths per 100,000 for all persons. This was lower than the England
baseline (82.8) and the rate for Essex (74.2) and was also lower than average for both
males (SMR = 78.6) and females (SMR = 58.1) individually. Cardiovascular disease was the
next largest preventable cause with a combined rate of 37.7 per 100,000 for both sexes,
however the rate for all persons and the rate for each sex individually were below the
national average for the latest time period.
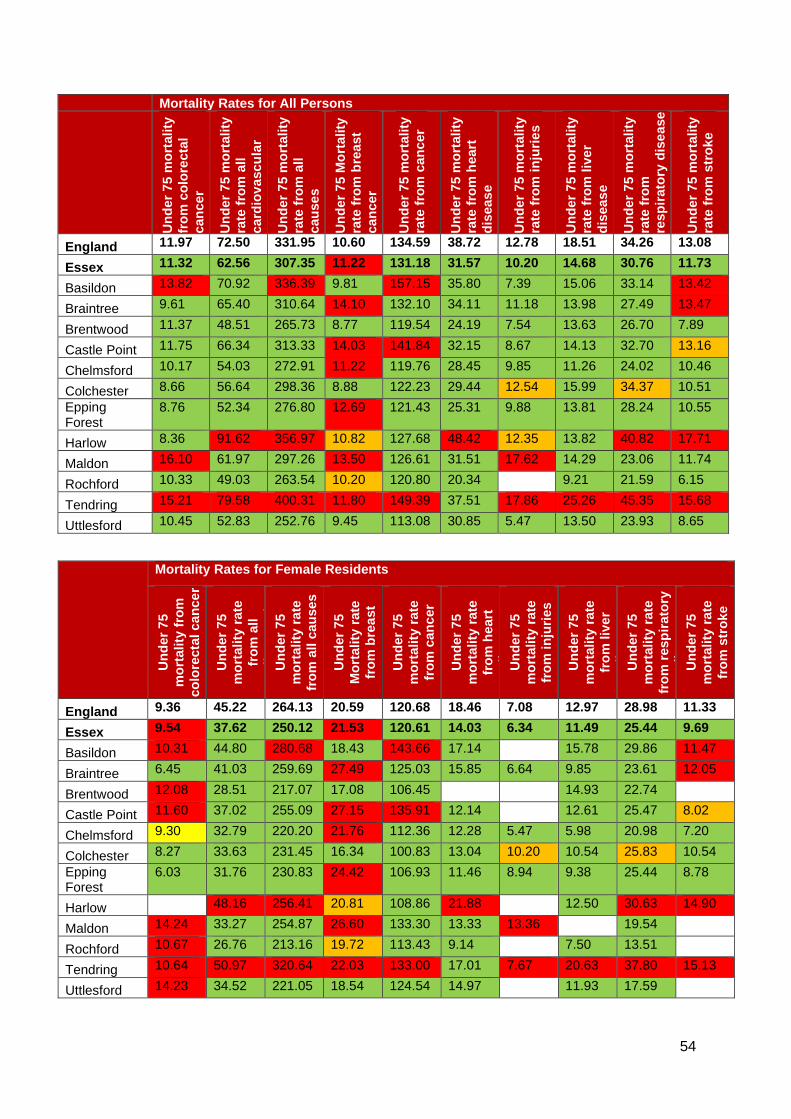
54
Mortality Rates for All Persons
Un
der
75 m
ort
ali
ty
fro
m c
olo
recta
l
can
ce
r
Un
der
75 m
ort
ali
ty
rate
fro
m a
ll
card
iov
ascu
lar
dis
eas
es
U
nd
er
75 m
ort
ali
ty
rate
fro
m a
ll
cau
se
s
Un
der
75 M
ort
ality
rate
fro
m b
rea
st
can
ce
r
Un
der
75 m
ort
ali
ty
rate
fro
m c
an
cer
Un
der
75 m
ort
ali
ty
rate
fro
m h
eart
dis
eas
e
Un
der
75 m
ort
ali
ty
rate
fro
m i
nju
rie
s
Un
der
75 m
ort
ali
ty
rate
fro
m l
ive
r
dis
eas
e
Un
der
75 m
ort
ali
ty
rate
fro
m
resp
irato
ry d
ise
ase
Un
der
75 m
ort
ali
ty
rate
fro
m s
tro
ke
England 11.97 72.50 331.95 10.60 134.59 38.72 12.78 18.51 34.26 13.08
Essex 11.32 62.56 307.35 11.22 131.18 31.57 10.20 14.68 30.76 11.73
Basildon 13.82 70.92 336.39 9.81 157.15 35.80 7.39 15.06 33.14 13.42
Braintree 9.61 65.40 310.64 14.10 132.10 34.11 11.18 13.98 27.49 13.47
Brentwood 11.37 48.51 265.73 8.77 119.54 24.19 7.54 13.63 26.70 7.89
Castle Point 11.75 66.34 313.33 14.03 141.84 32.15 8.67 14.13 32.70 13.16
Chelmsford 10.17 54.03 272.91 11.22 119.76 28.45 9.85 11.26 24.02 10.46
Colchester 8.66 56.64 298.36 8.88 122.23 29.44 12.54 15.99 34.37 10.51
Epping Forest
8.76 52.34 276.80 12.69 121.43 25.31 9.88 13.81 28.24 10.55
Harlow 8.36 91.62 356.97 10.82 127.68 48.42 12.35 13.82 40.82 17.71
Maldon 16.10 61.97 297.26 13.50 126.61 31.51 17.62 14.29 23.06 11.74
Rochford 10.33 49.03 263.54 10.20 120.80 20.34 9.21 21.59 6.15
Tendring 15.21 79.58 400.31 11.80 149.39 37.51 17.86 25.26 45.35 15.68
Uttlesford 10.45 52.83 252.76 9.45 113.08 30.85 5.47 13.50 23.93 8.65
Mortality Rates for Female Residents
Un
der
75
mo
rtality
fro
m
co
lore
cta
l c
an
ce
r
Un
der
75
mo
rtality
rate
fro
m a
ll
card
iov
ascu
lar
dis
eas
es
U
nd
er
75
mo
rtality
rate
fro
m a
ll c
au
se
s
Un
der
75
Mo
rtality
rate
fro
m b
rea
st
can
ce
r U
nd
er
75
mo
rtality
rate
fro
m c
an
cer
Un
der
75
mo
rtality
rate
fro
m h
eart
dis
eas
e
Un
der
75
mo
rtality
rate
fro
m in
juri
es
Un
der
75
mo
rtality
rate
fro
m liv
er
dis
eas
e
Un
der
75
mo
rtality
rate
fro
m r
esp
irato
ry
dis
eas
e
Un
der
75
mo
rtality
rate
fro
m s
tro
ke
England 9.36 45.22 264.13 20.59 120.68 18.46 7.08 12.97 28.98 11.33
Essex 9.54 37.62 250.12 21.53 120.61 14.03 6.34 11.49 25.44 9.69
Basildon 10.31 44.80 280.68 18.43 143.66 17.14 15.78 29.86 11.47
Braintree 6.45 41.03 259.69 27.49 125.03 15.85 6.64 9.85 23.61 12.05
Brentwood 12.08 28.51 217.07 17.08 106.45 14.93 22.74
Castle Point 11.60 37.02 255.09 27.15 135.91 12.14 12.61 25.47 8.02
Chelmsford 9.30 32.79 220.20 21.76 112.36 12.28 5.47 5.98 20.98 7.20
Colchester 8.27 33.63 231.45 16.34 100.83 13.04 10.20 10.54 25.83 10.54
Epping Forest
6.03 31.76 230.83 24.42 106.93 11.46 8.94 9.38 25.44 8.78
Harlow 48.16 256.41 20.81 108.86 21.88 12.50 30.63 14.90
Maldon 14.24 33.27 254.87 26.60 133.30 13.33 13.36 19.54
Rochford 10.67 26.76 213.16 19.72 113.43 9.14 7.50 13.51
Tendring 10.64 50.97 320.64 22.03 133.00 17.01 7.67 20.63 37.80 15.13
Uttlesford 14.23 34.52 221.05 18.54 124.54 14.97 11.93 17.59

55
Mortality Rates for Male Residents
Un
der
75
mo
rtality
fro
m
co
lore
cta
l c
an
ce
r
Un
der
75
mo
rtality
rate
fro
m a
ll
card
iov
ascu
lar
dis
eas
es
U
nd
er
75
mo
rtality
rate
fro
m a
ll c
au
se
s
Un
der
75
Mo
rtality
rate
fro
m b
rea
st
can
ce
r U
nd
er
75
mo
rtality
rate
fro
m c
an
cer
Un
der
75
mo
rtality
rate
fro
m h
eart
dis
eas
e
Un
der
75
mo
rtality
rate
fro
m in
juri
es
Un
der
75
mo
rtality
rate
fro
m liv
er
dis
eas
e
Un
der
75
mo
rtality
rate
fro
m r
esp
irato
ry
dis
eas
e
Un
der
75
mo
rtality
rate
fro
m s
tro
ke
England 14.74 101.25 403.22 0.16 149.57 60.09 18.56 24.30 39.90 14.93
Essex 13.24 89.42 368.93 142.83 50.47 14.20 18.10 36.54 13.93
Basildon 17.81 99.62 397.73 172.39 56.22 11.82 14.36 36.87 15.54
Braintree 13.02 91.43 364.90 139.74 53.66 15.89 18.39 31.54 14.99
Brentwood 10.55 69.95 317.48 133.43 43.71 12.22 30.95
Castle Point 12.06 98.06 377.12 149.35 53.77 13.49 15.71 40.68 18.99
Chelmsford 11.13 77.03 329.61 128.28 45.96 14.34 16.89 27.24 14.00
Colchester 9.00 81.61 371.09 145.81 47.24 15.05 21.98 43.84 10.44
Epping Forest
11.70 74.50 326.33 137.14 40.29 10.87 18.58 31.31 12.39
Essex 13.24 89.42 368.93 142.83 50.47 14.20 18.10 36.54 13.93
Harlow 12.24 139.51 468.88 149.33 78.10 20.15 15.19 52.91 20.54
Maldon 17.94 91.25 341.00 119.81 50.07 21.78 21.79 26.56 17.01
Rochford 10.07 73.13 317.49 128.69 32.39 11.08 30.51 10.28
Tendring 20.24 111.07 488.75 167.63 60.01 28.97 30.42 53.80 16.34
Uttlesford 71.35 284.31 101.11 46.90 15.01 30.38 9.84
Killed and Seriously Injured in Road Traffic
Accidents
The rate of people killed or seriously injured on
England’s roads has risen is recorded as a rate
per 100,000 population (all ages) over a three year
period. During the last recorded period (2015-17)
the average rate for Essex (51.28) was higher than
the average for England (40.8) with nine out of 12
Districts having rates above the national average.
Colchester had a rate of 46.54 which was above
the England average but below Essex. Rates have
increased by 1.14 per 100K or 2.5% compared to
2011-13 but were a similar compared to 2014-16
levels.
KSI rates for all areas & over time are set out in
the table below.

56
Killed and seriously injured (KSI) casualties on England's roads
5 Year Change
2011 - 13
2012 - 14
2013 - 15
2014 - 16
2015 - 17
Rate (per 100K) %
Epping Forest 66.93 70.35 67.73 75.81 78.76 11.83 17.7%
Uttlesford 56.24 50.80 48.37 55.16 64.51 8.27 14.7%
Maldon 42.51 42.86 43.52 57.83 59.92 17.41 41.0%
Tendring 43.35 39.80 40.60 45.84 57.43 14.08 32.5%
Braintree 39.09 40.45 43.09 51.37 55.76 16.67 42.7%
Brentwood 47.66 47.28 45.23 54.10 54.28 6.62 13.9%
ESSEX 42.74 42.21 42.47 48.18 51.28 8.55 20.0%
Chelmsford 48.61 43.25 44.49 45.74 47.65 -0.96 -2.0%
Colchester 45.41 42.89 44.02 46.51 46.54 1.14 2.5%
Castle Point 26.83 28.97 32.99 39.24 41.97 15.14 56.4%
ENGLAND 39.71 39.26 38.50 39.70 40.80 1.09 2.7%
Basildon 32.48 36.98 35.79 39.02 39.72 7.25 22.3%
Harlow 26.97 21.97 24.03 31.25 36.49 9.52 35.3%
Rochford 30.99 34.94 32.23 39.52 36.17 5.18 16.7%
Number of people reported killed or seriously injured (KSI) on the roads, all ages, per 100,000 resident population
Excess Winter Deaths
Excess Winter Deaths Index (EWD Index) is the excess winter
deaths measured as the ratio of extra deaths from all
causes that occur in the winter months compared with the
expected number of deaths, based on the average of the
number of non-winter deaths. The Excess Winter Deaths
Index is calculated as the number of excess winter deaths
divided by the average non-winter deaths expressed as a
percentage.
Between August 2014 and July 2017, the three year
average rate of Excess Deaths for all ages was 25.4%,
which was higher than the average for England (21.9%) and
Essex (23.3%). Looking at the level of Excess Winter
Deaths specifically in the over 85s age group shows a level
of 36.8% Excess Winter Deaths for this age group during
the same period. This is higher than the England rate of
29.3% and the county average of 31.7% and is the 4th
highest level in the county. (Highest: Maldon = 39.5%;
Lowest: Brentwood 14.5%). A breakdown of the levels of
Excess Winter Deaths for each district can be found in the
table below.
According to the Office of
National Statistics…
“Colder than average
temperatures for the winter
months of 2017 to 2018 may
partially explain the increase in
winter deaths. However,
previous years demonstrate a
weak relationship between
temperature and EWD.
Increased EWD are not always
coupled with unusually cold
winters and conversely winters
with decreased EWD are not
always coupled with milder
winter temperatures, indicating
factors other than temperature,
such as influenza, are also
relevant in explaining trends in
excess winter mortality (EWM).”*
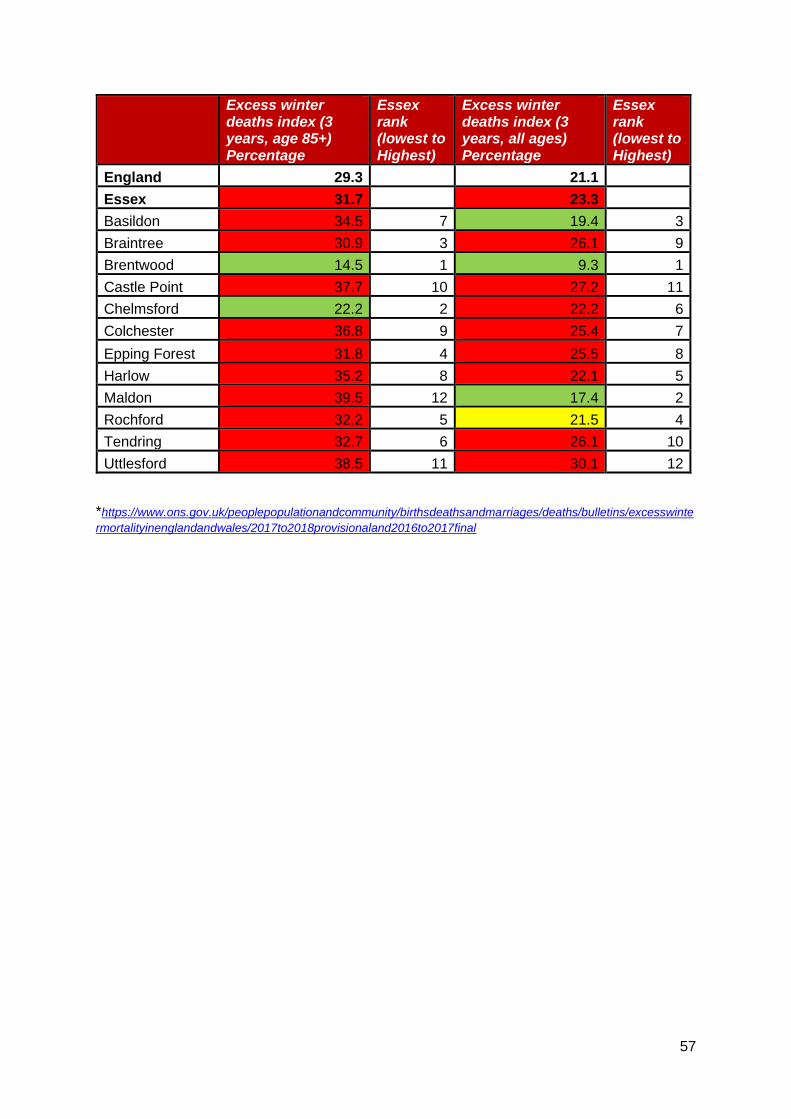
57
Excess winter deaths index (3 years, age 85+) Percentage
Essex rank (lowest to Highest)
Excess winter deaths index (3 years, all ages) Percentage
Essex rank (lowest to Highest)
England 29.3 21.1
Essex 31.7 23.3
Basildon 34.5 7 19.4 3
Braintree 30.9 3 26.1 9
Brentwood 14.5 1 9.3 1
Castle Point 37.7 10 27.2 11
Chelmsford 22.2 2 22.2 6
Colchester 36.8 9 25.4 7
Epping Forest 31.8 4 25.5 8
Harlow 35.2 8 22.1 5
Maldon 39.5 12 17.4 2
Rochford 32.2 5 21.5 4
Tendring 32.7 6 26.1 10
Uttlesford 38.5 11 30.1 12
*https://www.ons.gov.uk/peoplepopulationandcommunity/birthsdeathsandmarriages/deaths/bulletins/excesswinte
rmortalityinenglandandwales/2017to2018provisionaland2016to2017final

58

59
BIRTH RATES & INFANT HEALTH
Birth Rates
According to the Office for National Statistics, the Crude Birth Rate (CBR; all births per 1,000
population) was 11.7 in Colchester in 2017. This was the 4th highest CBR compared to the
other Districts in Essex and was higher than the rate for Essex as a whole (11.4) but lower
than England (12.0).
The CBR in Colchester has shown an overall decrease since 2013, with, for example, a CBR
of 12.4 in 2013. This was also the largest decrease compared across that in the other
Districts. In contrast, the CBR remained stable across Essex (2013 and 2017: 11.3) and
decreased across England by 0.7 (2013: 12.3; 2017: 11.6).
The Table below provides the ranked CBR in each district in each year from 2013 to 2017
Year
2013 2014 2015 2016 2017
CBR Rank CBR Rank CBR Rank CBR Rank CBR Rank
England 12.3 - 12.2 - 12.1 - 12.0 - 11.6 -
Essex 11.3 - 11.5 - 11.3 - 11.4 - 11.3 -
Basildon 13.6 2 13.4 2 13.5 2 13.6 2 13.5 2
Braintree 11.1 5 11.0 7 10.7 7 11.4 6 11.2 5
Brentwood 11.1 6 11.6 4 11.7 5 11.1 7 10.9 7
Castle Point 9.0 10 9.7 10 9.5 9 9.6 9 9.7 9
Chelmsford 10.9 7 11.4 6 10.9 6 11.7 5 11.2 6
Colchester 12.4 3 12.4 3 12.2 4 11.8 4 11.7 4
Epping Forest 12.2 4 11.5 5 12.5 3 12.2 3 12.4 3
Harlow 14.6 1 16.1 1 14.3 1 15.2 1 14.2 1
Maldon 8.8 11 8.5 12 9.2 11 8.4 12 9.2 12
Rochford 8.4 12 9.4 11 8.8 12 8.8 11 9.7 10
Tendring 9.7 9 9.8 9 9.5 10 9.0 10 9.4 11
Uttlesford 9.9 8 10.9 8 10.5 8 10.7 8 9.8 8

60
Birth rates by age of mother
The rate of births per 1,000 population among females aged 25 - 29 years (93.0) was the
second lowest in Colchester compared to the other Districts in Essex in 2016, and lower
than that for Essex as a whole (109.2) and England (98.5).
The rate of births per 1,000 population among females aged 30 - 34 years (111.4) was the
second lowest in Colchester compared to the other Districts in Essex in 2016, and slightly
lower than that of Essex as a whole (123.9) and England (112.4)
The rate of births per 1,000 population among females aged over 45 years (1.7) was the
second highest in Colchester compared to the other Districts in Essex with data available in
2016, and higher than that for Essex as a whole (1.0) and England (1.10).
See Table 2 for birth rates by age of mother for each Essex District
Under 18 Conceptions and Births
The rate of conceptions in women aged under 18 years per 1,000 females aged 15 to 17
years in Colchester was 12.4 in 2016, the 8th highest rate compared across the other Essex
Districts.

61
The rate of live births in women aged under 18 per 1,000 females aged 15 to 17 years was
3.44 in Chelmsford in 2016, also the 8th highest rate compared to the other Districts in
Essex.
Birth Rates (per 1000) by Age of Mother
Under 18s
Under 20
20-24 years
25-29 years
30-34 years
35-39 years
40-44 years
45+ years
Essex 5.6 11.9 57.3 109.2 123.9 66.7 12.4 1
England 4.6 13.5 55.6 98.5 112.4 67.5 14.9 1.1
Basildon 4.1 17 73.9 117.9 122.5 66.3 13 -
Braintree 7.2 12.7 70.3 120.8 115.1 61 12.8 0.7
Brentwood 3.0 7.5 36 90.7 145.4 77.4 14 1
Castle Point
3.8 10.1 51.2 110.4 126.5 62.1 7.7 1.2
Chelmsford 3.1 10.4 43.3 105.1 124.8 73 14.6 1.1
Colchester 3.4 11.4 52.1 93 111.4 61.9 11.7 1.7
Epping Forest
4.2 8.6 45 98.8 145.5 77.8 14.5 1
Harlow 8.5 16.2 72.4 137.5 116.8 69.3 15.4 2.7
Maldon 2.8 8.3 61.9 100.8 122.4 60.8 6.3 -
Rochford 5.3 7.9 32.4 105.3 128.2 53.5 12.3 -
Tendring 8.1 18.8 88.4 132.6 101.7 46.8 9.4 -
Uttlesford 1.9 6.2 47.1 93.7 151.1 85.9 13.2 1.4
INFANT HEALTH
Premature Births
Premature births are live or still births at a gestational age of less than 37 weeks. The rate of
premature births per 1,000 total live and still births in Colchester was 77.37 over the 3 year
period of 2014 - 2016. This was the 5th highest rate compared to the other Districts in
Essex, and slightly higher than that for Essex as a whole (74.69).
Low Birth Weight
Low birth weight is defined as a live birth with a recorded weight under 2500g and
gestational age of at least 37 weeks. In Colchester in 2016, the percentage of low birth
weight out of all live births with a recorded weight (and gestational age >=37 weeks) was
2.50. This was the third highest out of the other Districts in Essex, but similar to that for
Essex as a whole (2.11) and England (2.79).
Infant Mortality
According to Public Health England, the rate of infant mortality aged under 1 years old was
4.20 per 1,000 live births in Colchester over the period 2015 - 2017. This was the second
highest compared to the other districts of Essex, and higher than that for the whole of Essex
(3.10) and England (3.92).

62
Breastfeeding Initiation
Breastfeeding initiation is mothers giving their babies breast milk in the first 48 hours after
delivery. The percentage of breastfeeding initiation of the total number of maternities in
Colchester in 2016/17 was 82.02%. This was the second highest compared across the
Essex Districts with data available, and significantly higher than that for the whole of Essex
(75.02) and England (74.49).
Smoking at The Time of Delivery
The percentage of mothers known to be smokers at the time of delivery out of all maternities
was 14.70 in the North East Essex CCG in 2017/18. This was the highest (with Tendring)
compared across the other CCGs in Essex, and significantly higher than that for Essex as a
whole (10.60) and England (10.80).
All of the infant health datasets mentioned in this section are set out in table below:
Premature births (less
than 37 weeks
gestation) Per 1000
Low birth weight of
term babies (%)
Infant mortality (per 1000)
Breast Feeding Initiation
(%)
Smoking status at time of delivery
(%)
England 79.52 2.79 3.92 74.49 10.80
Essex 74.69 2.11 3.10 75.02 10.6
Basildon 79.05 2.52 2.83 68.02 11.82
Braintree 73.88 2.32 3.19 70.82 7.76
Brentwood 62.79 2.03 1.56 76.56 11.82
Castle Point 91.76 1.92 1.94 75.70 6.25
Chelmsford 65.68 1.67 3.06 77.55 7.76
Colchester 77.37 2.50 4.20 82.02 14.70
Epping Forest 74.35 2.07 1.24 ! 9.98
Harlow 84.90 2.61 3.20 71.18 9.98
Maldon 59.39 1.18 2.95 ! 7.76
Rochford 62.91 1.13 3.42 83.35 6.25
Tendring 81.90 2.03 5.52 68.38 14.70
Uttlesford 67.35 1.82 2.99 80.28 9.98
Time Period 2014-16 2016 2015-17 2016/17 2017/18
! Data not available

63
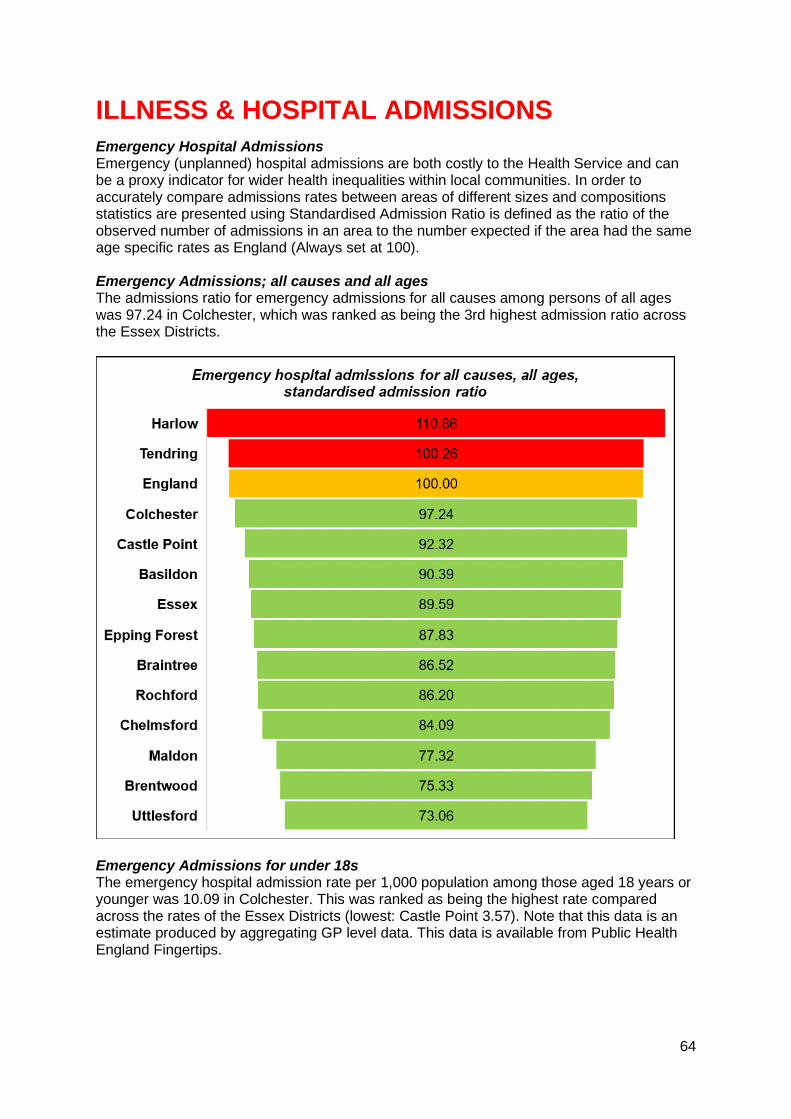
64
ILLNESS & HOSPITAL ADMISSIONS
Emergency Hospital Admissions Emergency (unplanned) hospital admissions are both costly to the Health Service and can be a proxy indicator for wider health inequalities within local communities. In order to accurately compare admissions rates between areas of different sizes and compositions statistics are presented using Standardised Admission Ratio is defined as the ratio of the observed number of admissions in an area to the number expected if the area had the same age specific rates as England (Always set at 100). Emergency Admissions; all causes and all ages The admissions ratio for emergency admissions for all causes among persons of all ages was 97.24 in Colchester, which was ranked as being the 3rd highest admission ratio across the Essex Districts.
Emergency Admissions for under 18s The emergency hospital admission rate per 1,000 population among those aged 18 years or younger was 10.09 in Colchester. This was ranked as being the highest rate compared across the rates of the Essex Districts (lowest: Castle Point 3.57). Note that this data is an estimate produced by aggregating GP level data. This data is available from Public Health England Fingertips.

65
Emergency hospital admissions (standardised admission ratio)
All causes & All ages
Chronic Obstructive Pulmonary
Disease (COPD)
Coronary Heart
Disease, (CHD)
Hip fracture in persons 65 years and over
Myocardial Infarction
(heart attack)
Stroke
Basildon 90.4 116.5 100.4 103.5 104.0 113.8
Braintree 86.5 75.5 83.5 116.1 85.2 88.8
Brentwood 75.3 61.3 81.1 104.4 81.6 89.8
Castle Point 92.3 102.0 84.7 104.5 77.5 102.0
Chelmsford 84.1 61.2 77.2 107.9 75.4 89.3
Colchester 97.2 71.7 92.4 108.3 81.2 86.5
England 100.0 100.0 100.0 100.0 100.0 100.0
Epping Forest 87.8 78.4 88.3 99.7 91.9 89.8
Essex 89.6 83.2 90.5 106.2 87.5 94.3
Harlow 110.9 129.8 128.8 99.3 125.8 96.8
Maldon 77.3 52.2 80.8 105.8 83.9 80.2
Rochford 86.2 81.6 90.5 101.9 77.0 105.7
Tendring 100.3 100.3 105.7 108.4 93.7 100.1
Uttlesford 73.1 51.9 67.6 106.1 74.4 76.0
Heart Attack Over the period of 2013/14 - 2017/18, the admissions ratio for emergency admissions for Myocardial Infarction (heart attack) was 81.22 in Colchester. This was ranked as being the 8th highest admissions ratio across the Essex Districts. Every District of Essex had a significantly better admissions ratio for Myocardial Infarction than England, with exception for Basildon and Harlow. Coronary Heart Disease The admission ratio for emergency admissions due to Coronary Heart Disease (CHD) was 92.36 in Colchester, which was ranked as the 4th highest admission ratio across the Essex Districts. Stroke The emergency admission ratio for Stroke in Colchester was 86.48, which was the third lowest admission ratio compared across the Essex Districts. This was also significantly better than the admission ratio for Stroke across England (100). All Districts in Essex had an admission ratio similar to (Harlow, Rochford, Tendring) or significantly better than that of England, with exception of significantly worse in Basildon. Chronic Obstructive Pulmonary Disease (COPD) Chronic Obstructive Pulmonary Disease (COPD) refers to serious lung conditions, including chronic bronchitis and emphysema. According to data from the Hospital Episode Statistics, the age standardised rate of emergency hospital admissions for COPD in adults aged over 35 years was 298.78 per 100,000 in Colchester in 2017/18. This was ranked as the 8th highest rate across the Essex Districts (lowest: Uttlesford 215.50; highest: Basildon 490.48).

66
VIOLENCE AND INJURIES Violence Related Admissions In the Colchester area, the directly age standardised rate per 100,000 population of emergency hospital admissions for violence was 34.90 over the period of 2015/16 - 2017/18. This was ranked as being the 2nd highest rate compared across the Essex Districts (highest: Tendring 50.75; lowest: Uttlesford 12.80) and higher than the emergency hospital admission rate for Essex as a whole (28.83). However, this was significantly better than the rate across England (43.36). Injuries Colchester had a lower than average rate of hospital stays due to alcohol related harm with a SAR of 93 but was significantly worse intentional self-harm with a rate 130.6.
Unintentional and deliberate injuries (per
10,000)
Hospital admissions for violence (Incl. sexual violence) Directly Age Standardised Per 100K
Hospital Stays (Standardised Admissions Ratios)
Children (aged 0-14 years)
Young People
(aged 15-24)
For alcohol-related harm
For self-harm
England 96.44 132.67 43.36 100.0 100.0
Essex 88.22 125.93 28.83 86.1 81.6
Basildon 56.04 188.13 34.50 85.9 57.5
Braintree 96.73 135.54 18.06 77.7 78.4
Brentwood 65.56 112.42 20.47 67.9 40.1
Castle Point 70.35 107.87 28.24 89.1 62.0
Chelmsford 99.08 136.21 26.99 75.4 76.9
Colchester 120.74 124.52 34.90 93.0 130.6
Epping Forest 88.23 89.35 29.05 87.4 47.7
Harlow 85.02 105.57 34.25 111.0 87.7
Maldon 95.84 114.00 23.93 72.6 61.9
Rochford 73.12 93.17 17.86 81.2 59.8
Tendring 112.74 114.68 50.75 105.2 151.5
Uttlesford 69.12 118.85 12.80 75.8 68.4
Injuries to Children & Young People The rate of hospital admissions caused by unintentional and deliberate injuries in children
aged under 15 years per 10,000 resident population aged under 15 was 120.74 in
Colchester in 2017/18. This was the highest rate compared across the Districts in Essex,
and higher than the rate across Essex (88.22) and England (96.44).
Colchester also had the highest rate among males aged under 15 years compared across
the Districts in Essex in 2017/18, with a rate of 132.38. This was also higher than the Essex
(101.91) and England (106.79) rates. The rate among females was 108.52 in Colchester.
This was again the highest rate of the Essex Districts, and higher than the rate across Essex
(73.74) and England (85.56).

67
FALLS AND HIP FRACTURES According to data from the Hospital Episode Statistics, the age standardised rate of
emergency hospital admissions due to falls in persons aged over 65 years was 1945.47per
100,000 in Colchester in 2017/18. This was lower than the rate across Essex (2059.46) and
England (2170.43).
Emergency hospital admissions due to falls
Hip fractures
All Persons Aged 65 and over
Age 65-79 Age 80+
All persons aged 65 and over
Age 65-79 Age 80+
England 2170.43 1032.87 5469.37 577.76 246.32 1539
Essex 2059.46 940.94 5303.19 611.9 259.41 1634
Basildon 2677.1 1345.86 6537.69 617.96 300.99 1537
Braintree 2122.3 950.99 5519.13 716.43 269.9 2011
Brentwood 2071.46 1067.65 4982.49 623.82 337.66 1454
Castle Point
2362.11 912.43 6566.18 588.79 207.44 1695
Chelmsford 1929.67 883.43 4963.76 565.04 214.47 1582
Colchester 1945.47 921.23 4915.78 626.55 261.02 1687
Epping Forest
1772.09 774.38 4665.45 542.61 239.76 1421
Harlow 1742.48 830.26 4387.93 615.28 291.71 1554
Maldon 1877.77 876.69 4780.91 604.99 264.76 1592
Rochford 2258.51 850.92 6340.51 607.61 219.16 1734
Tendring 1955.95 902.11 5012.1 660.87 292.17 1730
Uttlesford 1871.26 822.68 4912.14 532.18 215.53 1450
In Colchester in 2017/18, the age standardised rate of emergency hospital admissions due
to hip fractures among persons aged over 65 years was 626.55 per 100,000 population. This
was higher than the rate across Essex as a whole (611.91) and England (577.76) and was
ranked as being the third highest rate across the Districts in Essex (highest: Braintree
716.43; lowest: Uttlesford 532.18).
ILLNESS AND LONG TERM CONDITIONS
As part of the Quality Outcomes Framework (QOF) each GP surgery records the percentage
of registered patients who have been diagnosed with a range of different medical conditions.
This rate is known as QOF prevalence which along with records from of practices can be
combined to give a prevalence level at different geographies.
Hypertension & Stroke In 2015/16, the estimated proportion of all those registered at General Practitioner surgeries in the Colchester area with a diagnosis of Hypertension was 13.32%. This was relatively similar to the prevalence across England (13.94%), but lower than the prevalence across Essex as a whole (15.11%) and was ranked as being the lowest QOF prevalence compared across the Essex Districts (highest: Tendring 19.58%).

68
In the Colchester area in 2015, the prevalence of diagnosed hypertension among persons aged over 16 years was estimated to be 19.01. This was slightly lower than the prevalence across England (20.78) and was ranked as being the lowest prevalence across the Essex Districts (highest: Tendring 27.44). Colchester was also ranked as having the lowest prevalence of undiagnosed hypertension among persons aged over 16, with an estimate of 11.61 (highest: Tendring 14.04). This was also slightly lower than the estimated prevalence across England (12.15). The percentage of patients in the Colchester District with a stroke or transient ischemic attack, as registered on the disease practice register, was 1.43% in 2017/18. This was lower than that across Essex (1.76%) and England (1.77%) and ranked as being the lowest across the Essex Districts.as being the 4th highest across the Essex Districts. Coronary Heart Disease In Colchester was 3.06% in 2017/18. This was ranked as the second lowest estimated prevalence across the Essex Districts, and lower than the prevalence across the whole of Essex (3.16%) and England (3.13%). Among persons aged between 55 - 79 years in Colchester, the estimated prevalence of CHD was 7.82 in 2015. This was ranked as being the 7th estimated prevalence across the Essex Districts, and relatively similar to the prevalence across England (7.94). Asthma The proportion of all those registered at General Practitioner surgeries in the Colchester area with a diagnosis of Asthma was estimated to be 5.81%. This was ranked as being the third lowest prevalence compared across the other Districts in Essex, but similar to that across England (5.93%). Note that this estimate is produced by aggregating from GP level data. Epilepsy In 2017/18, the estimated proportion of all those registered at General Practitioner surgeries
in the Colchester area with a diagnosis of Epilepsy was 0.80%. This was ranked as being
the 5th highest QOF prevalence compared across the Essex Districts.
Dementia The proportion of patients of all ages registered at General Practitioner surgeries in
Colchester with a diagnosis of Dementia was estimated to be 0.67%. This was ranked as
being the second lowest prevalence compared across the other Districts in Essex and was
lower than the prevalence across Essex (0.81%) and England (0.77%).
Among persons aged over 65 years in the Colchester area in 2018, the estimated Dementia
diagnosis rate was 59.0. This was ranked as being the 8th highest rate compared across the
Districts.
In 2019 information from Projecting Older People’s Population Information (POPPI)
estimated that there were 2323 people with dementia which would rise to 3639 by 2035.
Projected numbers are set out in the table below (Source: POPPI 2019)
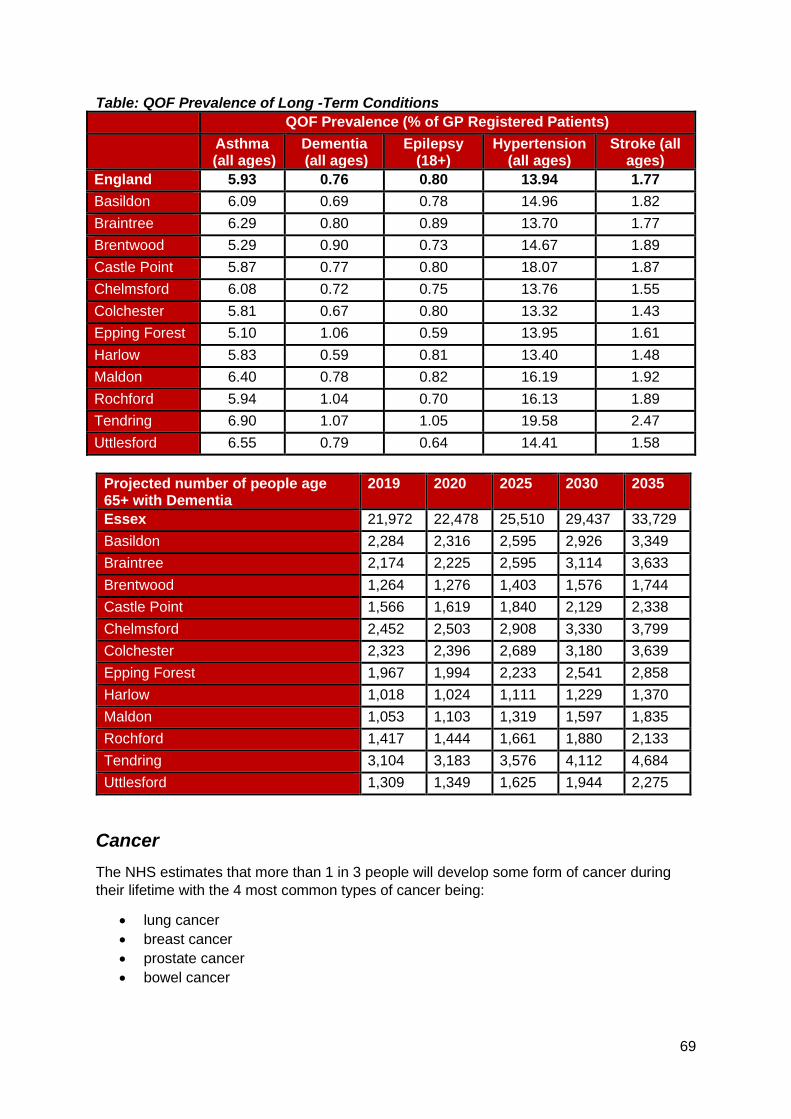
69
Table: QOF Prevalence of Long -Term Conditions QOF Prevalence (% of GP Registered Patients)
Asthma (all ages)
Dementia (all ages)
Epilepsy (18+)
Hypertension (all ages)
Stroke (all ages)
England 5.93 0.76 0.80 13.94 1.77
Basildon 6.09 0.69 0.78 14.96 1.82
Braintree 6.29 0.80 0.89 13.70 1.77
Brentwood 5.29 0.90 0.73 14.67 1.89
Castle Point 5.87 0.77 0.80 18.07 1.87
Chelmsford 6.08 0.72 0.75 13.76 1.55
Colchester 5.81 0.67 0.80 13.32 1.43
Epping Forest 5.10 1.06 0.59 13.95 1.61
Harlow 5.83 0.59 0.81 13.40 1.48
Maldon 6.40 0.78 0.82 16.19 1.92
Rochford 5.94 1.04 0.70 16.13 1.89
Tendring 6.90 1.07 1.05 19.58 2.47
Uttlesford 6.55 0.79 0.64 14.41 1.58
Projected number of people age 65+ with Dementia
2019 2020 2025 2030 2035
Essex 21,972 22,478 25,510 29,437 33,729
Basildon 2,284 2,316 2,595 2,926 3,349
Braintree 2,174 2,225 2,595 3,114 3,633
Brentwood 1,264 1,276 1,403 1,576 1,744
Castle Point 1,566 1,619 1,840 2,129 2,338
Chelmsford 2,452 2,503 2,908 3,330 3,799
Colchester 2,323 2,396 2,689 3,180 3,639
Epping Forest 1,967 1,994 2,233 2,541 2,858
Harlow 1,018 1,024 1,111 1,229 1,370
Maldon 1,053 1,103 1,319 1,597 1,835
Rochford 1,417 1,444 1,661 1,880 2,133
Tendring 3,104 3,183 3,576 4,112 4,684
Uttlesford 1,309 1,349 1,625 1,944 2,275
Cancer
The NHS estimates that more than 1 in 3 people will develop some form of cancer during
their lifetime with the 4 most common types of cancer being:
• lung cancer
• breast cancer
• prostate cancer
• bowel cancer

70
The following incidence ratio of all cancers and the major cancer sub-types are the
standardised incidence ratio, the number of observed new cases as a percentage of number
expected new cases, calculated relative to England (100) during the period of 2012-2016.
Incidence Rates of Cancers
Breast Cancer
Colorectal Cancer Lung Cancer
Prostate Cancer All Cancers
England 100.00 100.00 100.00 100.00 100.00
Essex 100.97 97.58 90.53 104.12 98.49
Basildon 106.58 102.13 108.63 92.01 104.75
Braintree 98.81 88.86 84.42 104.95 95.66
Brentwood 99.53 88.81 68.29 101.00 93.95
Castle Point 92.74 92.87 101.61 93.50 96.58
Chelmsford 104.20 99.87 70.10 99.10 92.40
Colchester 98.63 98.14 84.95 112.32 97.99
Epping Forest 103.04 103.80 96.50 132.98 104.62
Harlow 100.36 98.95 123.62 95.24 105.18
Maldon 105.22 93.31 83.34 95.07 93.35
Rochford 96.24 98.32 80.73 97.19 91.62
Tendring 97.98 101.04 106.26 109.79 104.66
Uttlesford 108.04 96.62 67.11 102.20 94.02
The following incidence ratio of all cancers and the major cancer sub-types are the standardised incidence ratio, the number of observed new cases as a percentage of number expected new cases, calculated relative to England. The incidence ratio for all cancers over the period of 2012 - 2016 in the Colchester area was 97.99. This was similar to the incidence ratio for all cancers across England (100) and was ranked as being the 5th highest across the Essex Districts (highest: Harlow: 105.18; lowest: Rochford 91.62). Castle Point and Colchester were the only Essex Districts with an incidence ratio for all cancers similar to England. In Colchester, the incidence ratio for lung cancer was 84.95. This was significantly better than the incidence ratio relative to England (100) and was ranked as being the 6th highest across Essex Districts (highest: Harlow 123.62; lowest: Uttlesford 67.11). The incidence ratio for Breast Cancer was 98.63 in Colchester, which was ranked as being the 9th highest incidence ratio compared across the Districts of Essex (highest: Uttlesford 108.04; lowest: Castle Point 92.74). The incidence ratio of all Districts in Essex for breast cancer was not significantly different to England (100). The incidence ratio for colorectal cancer was 98.14, which was ranked as being the 7th highest incidence ratio across the Essex Districts (highest: Epping Forest 103.80; lowest: Braintree 88.86). However, with exception of Braintree, the incidence ratios for colorectal cancer of all Essex Districts were similar relative to England (100). The incidence ratio of prostate cancer was 112.32, which was ranked as being the second highest incidence ratio across the Essex Districts (highest: Epping Forest 132.98; lowest

71
Basildon 92.01). This was also significantly worse relative to the incidence of prostate cancer across England (100).
Musculoskeletal (MSK) Conditions An estimated 32% of residents were recorded as reporting a long term musculoskeletal (MSK) problem. This was lower than the Essex average (34.9%) and the average for England (33.5%)
The percentage of residents reporting a long term back problem (7.5%) was lower the average for England (9.4%) and Essex (9.3%), whilst the percentage of residents reporting arthritis or a long term joint problem (10.6%) was also lower. The QOF prevalence of patients aged 50+ recorded with a diagnosis of Osteoporosis (0.56%) was lower than the national average (0.62%) but higher than the average for Essex (0.39%).
% reporting a long term MSK problem
% reporting a long-term back problem
% reporting arthritis or long-term joint problem
Osteoporosis: QOF prevalence (50+)
Basildon 33.5 9.4 11.5 0.35
Braintree 33.4 8.7 12.8 0.45
Brentwood 35.7 10.5 13.0 0.42
Castle Point 39.3 9.4 15.3 0.26
Chelmsford 30.8 7.5 11.3 0.4
Colchester 32.0 8.2 10.6 0.56
England 33.5 9.4 12.2 0.62
Epping Forest 32.0 8.7 11.7 0.42
Essex 34.9 9.3 12.6 0.39
Harlow 33.4 10.5 11.9 0.27
Maldon 36.6 11.3 13.3 0.33
Rochford 36.8 8.0 13.4 0.29
Tendring 47.7 13.1 17.6 0.41
Uttlesford 29.8 8.2 9.8 0.36
Diabetes Diabetes is a lifelong condition that causes a person's blood sugar level to become too high. There are 2 main types of diabetes:
• type 1 diabetes – where the body's immune system attacks and destroys the cells that produce insulin
• type 2 diabetes – where the body does not produce enough insulin, or the body's cells do not react to insulin
Type 2 diabetes is far more common than type 1. In the UK, around 90% of all adults with diabetes have type 2. The recorded QOF prevalence of Diabetes for people aged 17+ in the North East Essex
CCG area was 6.8%. This is higher than the average for England (6.5%) and Essex (6.6%)
was the second highest prevalence rate out of the 5 CCGs in Essex. It is estimated that up
to 9% of residents in this CCG area may have diabetes including those who are currently
undiagnosed,

72
Diabetes can reduce the blood supply to feet and cause a loss of feeling known as peripheral neuropathy. This can mean foot injuries don't heal well and you may not notice if your foot is sore or injured. Annual foot checks for people with diabetes are therefore an essential part of care monitoring procedures. In the North East Essex CCG area, an estimated 81.8% of people with Type 1 diabetes and 85.5% of people with type 2 diabetes have received an annual foot check. This is higher than the average for England and is the only area to have rates well below the national average.
Diabetes:
QOF prevalence
(17+)
Estimated prevalence of
diabetes (undiagnosed
and diagnosed)
People with type 1 diabetes who have received an annual foot
check
People with type 2
diabetes who have received an annual foot
check
England 6.5% 8.5% 70.1% 79.4%
Essex 6.6% 8.5%
NHS Basildon And Brentwood CCG
6.4% 8.2% 61.8% 65.9%
NHS Castle Point and Rochford CCG
7.2% 8.6% 54.4% 61.8%
NHS Mid Essex CCG
6.4% 8.1% 58.3% 65.7%
NHS North East Essex CCG
6.8% 9.0% 81.8% 85.5%
NHS West Essex CCG
6.2% 8.1% 64.0% 72.4%
VACCINATIONS
Vaccinations are one of the most important interventions in place to prevent the spread of
avoidable diseases amongst the population. In the UK the majority of vaccinations are given
childhood, with a number of boosters and additional vaccinations also given to people of
different ages who might be at higher risk from certain diseases.
Across the UK vaccination rates are declining with fewer people completing full courses of
vaccinations compared to recent years leading to increased potential for outbreaks of
diseases within an area. According to the NHS "If 95% of children receive the MMR vaccine,
it's possible to get rid of measles. However, measles, mumps and rubella can quickly spread
again if fewer than 90% of people are vaccinated."
Vaccine Preventable Conditions Variation in incidence rates for certain conditions which are considered vaccine preventable may reflect differences in underlying population including the uptake of vaccination. Public Health England suggests that high prevalence of the following conditions "should prompt a review of routine immunisation uptake and vaccination of high risk groups".

73
Mumps 5-year
incidence rate/100,000
Mumps incidence
rate/100,000
Pertussis incidence
rate/100,000
Measles 5-year
incidence rate/100,000
Measles incidence
rate/100,000
Basildon 1.33 0.55 0.54 0.00 0.54
Braintree 2.27 0.00 9.89 0.27 0.66
Brentwood 2.39 0.00 3.92 0.80 0.00
Castle Point 1.80 1.11 4.45 1.57 11.13
Chelmsford 3.26 1.15 0.57 0.12 0.00
Colchester 3.10 2.14 14.20 0.11 0.00
England 3.60 3.25 7.80 1.49 1.74
Epping Forest 2.49 0.77 1.53 1.09 3.83
Essex 2.07 1.10 5.45 0.38 1.50
Harlow 2.13 2.33 3.48 0.00 3.48
Maldon 0.32 0.00 1.56 0.00 0.00
Rochford 2.36 3.50 1.16 0.24 1.16
Tendring 1.43 0.70 6.22 0.29 0.69
Uttlesford 0.00 1.16 14.83 0.72 0.00
Measles In 2018 the rate of measles per 100,000 people in Colchester was 0 and was lower than the England average of 1.7. Mumps The incidence rate of Mumps in 2017 was 2.14 per 100,000 and was below the rate for England (3.2) but higher than Essex (1.1). Pertussis (Whooping Cough) The incidence rate of pertussis in 2017 was 14.20 per 100,000 people and was significantly worse than the average for Essex (5.4 per 100,000) and England (7.8 per 100,000) and the second highest level in the county.
Childhood Vaccination Coverage
Data on Childhood Vaccinations is largely presented as the average for the CCG area, using
data amalgamated up from individual GP practices. These averages can be positively
skewed by figures higher performing practices in the area and mask coverage issues at a
more local level. As such we have also analysed vaccination coverage levels within relevant
age groups against two additional criteria recorded by NHS England;
• The number and percentage of GP practices meeting the minimum of 90% of
patients vaccinated
• The number and percentage of GP practices meeting the target of 95% or more
patients vaccinated

74
Tables at the end of this chapter provide a full breakdown of current childhood vaccination
coverage levels by CCG area.
Measles, Mumps and Rubella (MMR) By age 5 it is estimated that 96.5% of the GP registered children in the North East Essex CCG have received one of the two MMR vaccination injections required to achieve full vaccination coverage. This is higher than the average for England of 94.9% and similar to the Essex average of 96.5%, with 31 out of 37 GP practices (83.8%) in the area achieving at least 95% coverage or Higher. By comparison the rate of GP registered children who have received both of MMR vaccination injections by age five drops to 86.6%, which is lower than the England (87.2%) and Essex (89.4%) averages and well below the 95% needed to eliminate measles within the population. NHS England Child Vaccination coverage statistics identified 22 out of 37 GP practices (79.5%) in the CCG area with less than 90% vaccination coverage of the eligible population, and only 2 practices (5.4%) which were achieving coverage of 95% or higher. The level practices achieving less than 90% coverage is far higher than the county average (45.5%) and is the lowest performing CCG in Essex (Lowest: Mid Essex CCG = 22.8%; Highest: West Essex CCG = 60.6%). Diphtheria, Tetanus, Pertussis (Whooping Cough), Polio, Haemophilus Influenzae Type B (hib): DTaP/IPV/Hib 96.2% of GP registered children in the North East Essex CCG area had recieved the full course of DTaP/IPV/Hib injections by Age 5. This is just below the Essex average of 97.1%, just above the average for England (95.6%) and is the second lowest vaccination coverage level out of the 5 CCG areas in Essex (Highest: Castle Point & Rochford CCG = 98.3%; Lowest: West Essex CCG = 94.6%). At indivual practice level the NHS vaccination coverage statistics identified no practices which had coverage levels below 90% and 30 out of 37 (81.1%) which were achieving coverage levels of 95% or higher; this is similar to the averages for Essex (3%, 83.7%). Rotavirus An estimated 88.5% of GP registered children in the North East Essex CCG area had received their vaccinations against Rotavirus by 12 months; lower than the average for Essex (92.4%) and England (90.1%). Compared to the other CCG areas in Essex this is the lowest coverage level out of five areas (Highest: Mid Essex CCG = 95.1%). Looking at coverage levels across individual GP practices, NHS England statistics identified 18 practices (48.6%) which had coverage levels below 90% and 5 practices (13.5%) achieving coverage of 95% or higher. This is worse than the Essex average for both measures (22.5%, 35.4%) and is significantly lower than the highest performing area for GP surgeries achieving 95% coverage or higher (Highest: Castle Point and Rochford CCG = 62.5%). Pneumococcal Vaccine (PCV) The pneumococcal vaccine protects against serious and potentially fatal pneumococcal infections such as pneumonia, septicaemia (a kind of blood poisoning) and meningitis and is given to infants over three separate doses at 8 weeks, 16 weeks and 1 year. By 24 months 89% of the GP registered children in the North East Essex CCG area have recived their PCV vaccinations; lower than the Essex (92.8%) and England (91%) average coverage levels. This is the lowest coverage level out of 5 CCG areas (Highest: Castle Point and Rochford CCG = 96.2%) with 15 out of 37 GP practices (37.8%) achieving coverage levels of less than 90% and 7 practices (18.9%) achieving coverage levels of 95% or higher. These coverage levels worse than the Essex average for both measures (77.5%, 41.6%) and has the lowest proportion achieving 95% or higher in the County (Highest: Castle Point and Rochford CCG = 70.8%).

75
Meningitis According to the NHS Meningitis can be caused by a number of different infections, as such a number of different vaccinations are used to offer protection against this including the MMR, DTaP/IPV/Hib, and Pneumococcal Vaccine already mentioned in this report. In addition, the NHS also includes separate vaccinations against Meningitis C (and Hib) at one year old and also Meningitis B which takes place at 8 weeks, 16 weeks and booster at 1 year. Coverage levels of the Hib & Meningitis C vaccination across the North East Essex CCG area is 93.8% of eligible GP registered children by age 5, just below the Essex average of 94.8% and higher than the rate for England of 92.4%. This is the lowest coverage level out of the 5 CCGs in Essex (Highest: Castle Point and Rochford CCG = 96.5%), with 5 out of 37 GP practices (13.5%) with coverage levels below 90% and 18 practices (48.6%) achieving 95% coverage or higher. This is similar to the Essex average for practices achieving less than 90% coverage (15.2%) and lower for those achieving 95% or higher (59%). Coverage levels of the new Meningitis B vaccination across the North East Essex CCG area is 92.4% of eligible GP registered children at 12 months, just below the Essex average of 94.2% and similar to the rate for England of 92.5%. This is the lowest coverage level out of the 5 CCGs in Essex (Highest: Castle Point and Rochford CCG = 95.8%) with 9 out of 37 GP practices (24.3%) with coverage levels below 90% and 14 practices (37.8%) achieving 95% coverage or higher. This is worse than the Essex average for both measures (16.9%, 46.1%) and is the second lowest CCG area for the percentage of GP practices achieving 95% coverage (Highest: Castle Point and Rochford CCG = 70.8%; Lowest: West Essex CCG = 30.3%). Children in Care Immunisations According to figures from the Department for Education in 2018, 77.6% of children in care are up to date with the vaccinations in the NHS routine list across the whole of Essex. This is lower than the average for England (85.3%) and the East of England (85.1%) and is the 4th lowest rate out of 11 upper tier and unitary authorities in the eastern region (Highest: Norfolk = 96.3%; Lowest: Thurrock = 65.4%).

76
EN
GL
AN
D
ES
SE
X
BA
SIL
DO
N A
ND
BR
EN
TW
OO
D C
CG
CA
ST
LE
PO
INT
AN
D
RO
CH
FO
RD
CC
G
MID
ES
SE
X C
CG
NO
RT
H E
AS
T E
SS
EX
CC
G
WE
ST
ES
SE
X C
CG
Total no. GPs 178 39 24 45 37 33
MMR 1 injection coverage at age 5 (% of eligible population) 94.9 96.5 96.2 97.1 97.0 96.5 95.5
No. GP Practices meeting the minimum 90% vaccination coverage level for MMR1at 5y 173 38.0 23.0 44.0 37.0 31.0
% GP Practices meeting the minimum 90% vaccination coverage level for MMR1 at 5y 97.2% 97.4% 95.8% 97.8% 100.0% 93.9%
No. GP Practices meeting the target 95% vaccination coverage level for MMR1 at 5y 139 29.0 19.0 38.0 31.0 22.0
% GP Practices meeting the target 95% vaccination coverage level for MMR1 at 5y 78.1% 74.4% 79.2% 84.4% 83.8% 66.7%
MMR 2 Injections coverage at age 5 (% of eligible population) 87.2 89.4 90.1 91.5 91.9 86.6 87.8
No. GP Practices meeting the minimum 90% vaccination coverage level for MMR2 at 5y 97 22 12 35 15 13
% GP Practices meeting the minimum 90% vaccination coverage level for MMR2 at 5y 54.5% 56.4% 50.0% 77.8% 40.5% 39.4%
No. GP Practices meeting the target 95% vaccination coverage level for MMR2 at 5y 22 6 4 10 2 0
% GP Practices meeting the target 95% vaccination coverage level for MMR2 at 5y 12.4% 15.4% 16.7% 22.2% 5.4% 0.0%

77
EN
GL
AN
D
ES
SE
X
BA
SIL
DO
N A
ND
BR
EN
TW
OO
D C
CG
CA
ST
LE
PO
INT
AN
D
RO
CH
FO
RD
CC
G
MID
ES
SE
X C
CG
NO
RT
H E
AS
T E
SS
EX
CC
G
WE
ST
ES
SE
X C
CG
Total no. GPs 178 39 24 45 37 33
PCV coverage at 24 months (% of eligible population) 91 92.8 93.0 96.2 94.3 89.9 92.0
No. GP Practices meeting the minimum 90% vaccination coverage level for PCV Booster at 24m 138 30.0 21 41.0 23.0 23.0
% GP Practices meeting the minimum 90% vaccination coverage level for PCV Booster at 24m 77.5% 76.9% 87.5% 91.1% 62.2% 69.7%
No. GP Practices meeting the target 95% vaccination coverage level for PCV Booster at 24m 74 19.0 17 22.0 7.0 9.0
% GP Practices meeting the target 95% vaccination coverage level for PCV Booster at 24m 41.6% 48.7% 70.8% 48.9% 18.9% 27.3%
Rotavirus vaccinations at 12 months (% of eligible population) 90.1 92.4 92.6 94.9 95.1 88.5 90.1
No. GP Practices meeting the minimum 90% vaccination coverage level for Rotavirus at 12m 138 34 23 41 19 21
% GP Practices meeting the minimum 90% vaccination coverage level for Rotavirus at 12m 77.5% 87.2% 95.8% 91.1% 51.4% 63.6%
No. GP Practices meeting the target 95% vaccination coverage level for Rotavirus at 12m 63 9.0 15 27.0 5.0 7.0
% GP Practices meeting the target 95% vaccination coverage level for Rotavirus at 12m 35.4% 23.1% 62.5% 60.0% 13.5% 21.2%

78
EN
GL
AN
D
ES
SE
X
BA
SIL
DO
N A
ND
BR
EN
TW
OO
D C
CG
CA
ST
LE
PO
INT
AN
D
RO
CH
FO
RD
CC
G
MID
ES
SE
X C
CG
NO
RT
H E
AS
T E
SS
EX
CC
G
WE
ST
ES
SE
X C
CG
Total no. GPs 178 39 24 45 37 33
Hib & MenC vaccinations at 24 months (% of eligible population) 91.2 92.7 93.1 96.1 94.6 89.8 91.8
No GP Practices meeting the minimum 90% vaccination coverage level for Hib & Men C at 5y 142 31 21 42 24 24
% GP Practices meeting the minimum 90% vaccination coverage level for Hib & Men C at 5y 79.8% 79.5% 87.5% 93.3% 64.9% 72.7%
No. GP Practices meeting the target 95% vaccination coverage level for Hib & Men C at 5y 68 17 15 22 7 7
% GP Practices meeting the target 95% vaccination coverage level for Hib & Men C at 5y 38.2% 43.6% 62.5% 48.9% 18.9% 21.2%
Hib & MenC vaccinations at 5 years (% of eligible population) 92.4 94.8 95.2 96.5 95.6 93.8 93.9
No GP Practices meeting the minimum 90% vaccination coverage level for Hib & Men C at 5y 160 35 22 43 32 28
% GP Practices meeting the minimum 90% vaccination coverage level for Hib & Men C at 5y 89.9% 89.7% 91.7% 95.6% 86.5% 84.8%
No. GP Practices meeting the target 95% vaccination coverage level for Hib & Men C at 5y 105 25 17 30 18 15
% GP Practices meeting the target 95% vaccination coverage level for Hib & Men C at 5y 59.0% 64.1% 70.8% 66.7% 48.6% 45.5%

79
EN
GL
AN
D
ES
SE
X
BA
SIL
DO
N A
ND
BR
EN
TW
OO
D C
CG
CA
ST
LE
PO
INT
AN
D
RO
CH
FO
RD
CC
G
MID
ES
SE
X C
CG
NO
RT
H E
AS
T E
SS
EX
CC
G
WE
ST
ES
SE
X C
CG
Total no. GPs 178 39 24 45 37 33
DTaP/IPV/Hib Vaccinations at 5 years (% of Eligible Population) 95.6 97.1 97.0 98.3 98.0 96.2 94.6
No GP Practices meeting the minimum 90% vaccination coverage level for DTaP/IPV/Hib at 5y 173 37.0 24.0 45.0 37.0 30.0
% GP Practices meeting the minimum 90% vaccination coverage level for DTaP/IPV/Hib at 5y 97% 95% 100% 100% 100% 91%
No. GP Practices meeting the target 95% vaccination coverage level for DTaP/IPV/Hib at 5y 149 32.0 21.0 44.0 30.0 22.0
% GP Practices meeting the target 95% vaccination coverage level for DTaP/IPV/Hib at 5y 83.7% 82.1% 87.5% 97.8% 81.1% 66.7%
MenB vaccinations at 12 months (% of eligible population) 92.5 94.2 93.2 95.8 95.6 92.4 92.8
No GP Practices meeting the minimum 90% vaccination coverage level for Men B at 12m 148 32 22 41 28 25
% GP Practices meeting the minimum 90% vaccination coverage level for Men B at 12m 83.1% 82.1% 91.7% 91.1% 75.7% 75.8%
No. GP Practices meeting the target 95% vaccination coverage level for Men B at 12m 82 19 17 22 14 10
% GP Practices meeting the target 95% vaccination coverage level for Men B at 12m 46.1% 48.7% 70.8% 48.9% 37.8% 30.3%
80

81
MENTAL HEALTH
Common Mental Health Conditions According to the General Practice Patient Survey (GPPS; NHS England) in 2016/17, the prevalence of depression and anxiety among persons aged over 18 years in NHS North East Essex CCG in Essex was 14.30%. This was higher than the prevalence across Essex (12.49%) and across England (13.74%) and was ranked as being the higher prevalence compared across that of the other CCGs in Essex (lowest: NHS Mid Essex CCG 11.23%). Severe Mental Health Conditions Severe mental health conditions include schizophrenia, bipolar affective disorder and other psychoses. The prevalence of these as recorded on general practise disease registers in the Colchester area in 2017/18 was 0.93. This was the second highest prevalence compared across the other Districts in Essex and was also significantly higher than the prevalence across Essex as a whole (0.80), but similar to that for England (0.94). Long Term Mental Health Conditions The prevalence of reporting a long-term mental health condition among persons aged over 18 years in the NHS North East Essex CCG, according to the GPPS, was 9.63% in 2017/18. This was slightly higher than the prevalence across Essex (8.23%) and was ranked as being the highest prevalence compared across the CCGs of Essex (lowest: NHS West Essex CCG 7.19%) but was similar to that across England (9.06%). Children & Young People’s Mental Health The Colchester area had the 6th highest estimated prevalence of any mental health disorder among children aged between 5 to 16 years across the Districts of Essex in 2015, with a prevalence of was 8.75. This was similar to the estimated prevalence across the whole of Essex (8.71) and slightly lower than that for England (9.23). This estimate was based on the prevalence’s previously given in the Office for National Statistics survey Mental Health of Children and Young People in Great Britain (2004).
Depression and Anxiety prevalence (GP
Patient Survey): % of respondents aged 18+
Prevalence of Severe Mental Health
Conditions
Estimated prevalence of mental health
disorders in children and young people:
% population aged 5-16
Essex 12.49 0.80 8.71
England 13.74 0.94 9.23
Basildon 13.28 0.92 9.29
Braintree 11.23 0.75 8.80
Brentwood 13.28 0.66 7.82
Castle Point 12.48 0.68 8.89
Chelmsford 11.23 0.72 8.24
Colchester 14.30 0.93 8.75
Epping 11.31 0.78 8.22
Harlow 11.31 0.81 9.65
Maldon 11.23 0.76 8.38
Rochford 12.48 0.63 8.24
Tendring 14.30 1.00 9.76
Uttlesford 11.31 0.63 7.67
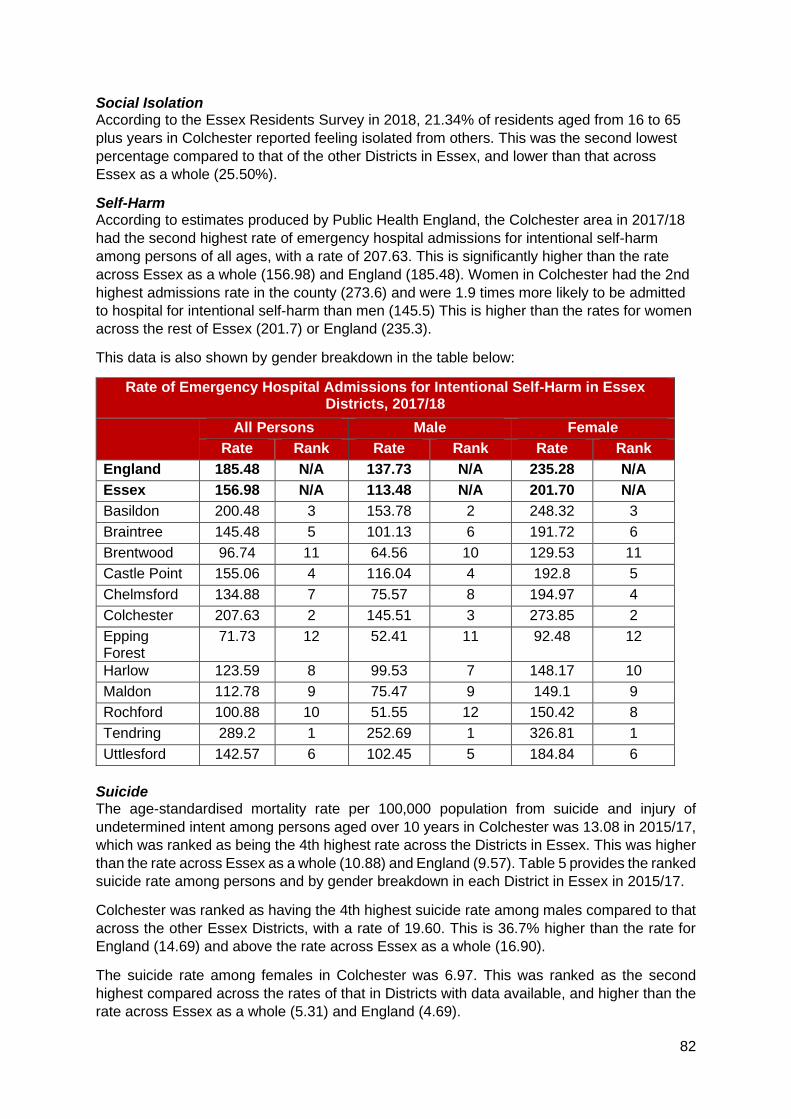
82
Social Isolation According to the Essex Residents Survey in 2018, 21.34% of residents aged from 16 to 65
plus years in Colchester reported feeling isolated from others. This was the second lowest
percentage compared to that of the other Districts in Essex, and lower than that across
Essex as a whole (25.50%).
Self-Harm According to estimates produced by Public Health England, the Colchester area in 2017/18
had the second highest rate of emergency hospital admissions for intentional self-harm
among persons of all ages, with a rate of 207.63. This is significantly higher than the rate
across Essex as a whole (156.98) and England (185.48). Women in Colchester had the 2nd
highest admissions rate in the county (273.6) and were 1.9 times more likely to be admitted
to hospital for intentional self-harm than men (145.5) This is higher than the rates for women
across the rest of Essex (201.7) or England (235.3).
This data is also shown by gender breakdown in the table below:
Rate of Emergency Hospital Admissions for Intentional Self-Harm in Essex Districts, 2017/18
All Persons Male Female
Rate Rank Rate Rank Rate Rank
England 185.48 N/A 137.73 N/A 235.28 N/A
Essex 156.98 N/A 113.48 N/A 201.70 N/A
Basildon 200.48 3 153.78 2 248.32 3
Braintree 145.48 5 101.13 6 191.72 6
Brentwood 96.74 11 64.56 10 129.53 11
Castle Point 155.06 4 116.04 4 192.8 5
Chelmsford 134.88 7 75.57 8 194.97 4
Colchester 207.63 2 145.51 3 273.85 2
Epping Forest
71.73 12 52.41 11 92.48 12
Harlow 123.59 8 99.53 7 148.17 10
Maldon 112.78 9 75.47 9 149.1 9
Rochford 100.88 10 51.55 12 150.42 8
Tendring 289.2 1 252.69 1 326.81 1
Uttlesford 142.57 6 102.45 5 184.84 6
Suicide The age-standardised mortality rate per 100,000 population from suicide and injury of
undetermined intent among persons aged over 10 years in Colchester was 13.08 in 2015/17,
which was ranked as being the 4th highest rate across the Districts in Essex. This was higher
than the rate across Essex as a whole (10.88) and England (9.57). Table 5 provides the ranked
suicide rate among persons and by gender breakdown in each District in Essex in 2015/17.
Colchester was ranked as having the 4th highest suicide rate among males compared to that
across the other Essex Districts, with a rate of 19.60. This is 36.7% higher than the rate for
England (14.69) and above the rate across Essex as a whole (16.90).
The suicide rate among females in Colchester was 6.97. This was ranked as the second
highest compared across the rates of that in Districts with data available, and higher than the
rate across Essex as a whole (5.31) and England (4.69).

83
Suicide Rate across Essex Districts among persons, males
and females in 2015 / 17
Persons Male Female
Rate Rank Rate Rank Rate Rank
England 9.57 N/A 14.69 N/A 4.69 N/A
Essex 10.88 N/A 16.90 N/A 5.31 N/A
Basildon 9.69 7 16.94 7 - -
Braintree 11.12 6 17.61 6 5.86 3
Brentwood 7.78 10 12.03 11 - -
Castle Point 8.34 8 13.91 9 - -
Chelmsford 11.78 5 17.97 5 5.72 4
Colchester 13.08 4 19.6 4 6.97 2
Epping Forest 5.24 12 7.26 12 - -
Harlow 14.9 2 23.34 3 - -
Maldon 14.52 3 23.64 1 - -
Rochford 8.02 9 12.36 10 - -
Tendring 15.96 1 23.39 2 8.89 1
Uttlesford 7.74 11 13.94 8 - -
Data Sources and Further Information *There are several caveats to the estimates of prevalence of depression and anxiety, severe mental health conditions, and prevalence of reporting long-term health conditions in the Districts across Essex. The prevalence of depression and anxiety, and the reporting of long-term health conditions among residents were produced by aggregating data available from CCG level upwards to the District which the CCG is located. The prevalence of severe mental health conditions at District level was estimated through aggregating data of General Practitioner (GP) surgeries located in that District. The district level estimates were then aggregated together to provide Essex level estimates for these three indicators.
84