Introduction 簡介
41
崑崑崑崑崑崑崑崑崑崑崑崑崑崑崑崑崑 Kun Shan University, Information Engineering Department Introduction 簡簡 Object Oriented Programming 簡簡簡簡簡簡簡簡
-
Upload
xyla-cantu -
Category
Documents
-
view
71 -
download
0
description
Introduction 簡介. Object Oriented Programming 物件導向程式設計. Outline. Course Introduction ( 課程簡介 ) Course Target ( 課程目標 ) What you can learn in the lesson. ( 課程中將學習到甚麼 ) What you must learn in the lesson. ( 課程中必須學會甚麼 ) Criterion ( 評量標準 ) UML&OOP Introduction ( 簡介 UML 與物件導向程式設計 ) - PowerPoint PPT Presentation
Transcript of Introduction 簡介

崑山科技大學資訊科技學院資訊工程系Kun Shan University, Information Engineering Department
Introduction簡介
Object Oriented Programming 物件導向程式設計

崑山科技大學資訊科技學院資訊工程系Kun Shan University, Information Engineering Department
Outline• Course Introduction ( 課程簡介 )
– Course Target ( 課程目標 )
• What you can learn in the lesson. ( 課程中將學習到甚麼 )
• What you must learn in the lesson. ( 課程中必須學會甚麼 )
– Criterion ( 評量標準 )
• UML&OOP Introduction ( 簡介 UML 與物件導向程式設計 )– UML Concept ( 統一塑模語言概述 )
• What is UML ( 何謂統一塑模語言 )
• The history of UML ( 統一塑模語言的發展歷史 )
– UML to OOP ( 統一塑模語言與 OOP 的關係 )
• A simple OOP procedure ( 一個使用統一塑模語言以 OO 方式發展系統的簡單流程範例 )
2

崑山科技大學資訊科技學院資訊工程系Kun Shan University, Information Engineering Department
課程簡介• 課程目標
– 暸解物件導向程式設計方法的概念與流程。• 能夠說明物件與類別的定義與關係。• 能夠描述物件導向程式設計的基本流程。• 能夠使用 UML 做為物件導向程式設計的表達工具。
– 學會使用 UML2.0 。• 能夠閱讀 UML 文件,暸解其所表達的意思。• 能夠用 UML 表達自己的想法。
• 教學方式– 藉由學習使用 UML2.0 的過程,暸解物件導向程式設計方法的概念與流
程。
3
崑山科技大學資訊科技學院資訊工程系Kun Shan University, Information Engineering Department
課程簡介• 教科書
– UML2.0 學習手冊• Russ Miles & Kim Hamilton
• 楊仁和 編譯• O’Reilly 出版 , ISBN986-7794-89-3
• 參考書籍– UML2.0 技術手冊
• Dan Pilone & Neil Pitman
• 蔡學鏞編譯• O’Reilly 出版 , ISBN986-7794-74-5
– ( 接下頁 )
4

崑山科技大學資訊科技學院資訊工程系Kun Shan University, Information Engineering Department
課程簡介• 參考書籍 (cont.)
– 寫給 C++ 程式設計師的 UML 實務手冊• 邱郁惠着• 博碩文化出版 , ISBN978-986-201-080-8
– 深入淺出設計模式• Eric Freeman & Elisabeth Freeman
• 蔡學鏞 譯• O’Reilly 出版, ISBN 986-7794-52-4
– 物件導向程式設計—使用 Java 與 UML
• Richard C. Lee & William M. Tepfenhart
• 陳盈潔 譯• 基峯 , PEARSON 出版 , ISBN 986-7594-91-6
5

崑山科技大學資訊科技學院資訊工程系Kun Shan University, Information Engineering Department
課程簡介– Criterion ( 評量標準 )
• Pass: You have learned what you must learn.
– According to your score of final and midterm exam.
» Final exam score: 40%
» Midterm exam score: 30%
6

崑山科技大學資訊科技學院資訊工程系Kun Shan University, Information Engineering Department
Introduction to UML
Object-Oriented Programming
物件導向程式設計

崑山科技大學資訊科技學院資訊工程系Kun Shan University, Information Engineering Department
What is UML?• Unified Modeling Language(UML)( 統一塑模語言 / 統一建模語
言 )– Unified Modeling Language (UML) is a standardized general-purpose
modeling language in the field of software engineering. (Wikipedia)
– UML includes a set of graphical notation techniques to create abstract models of specific systems. (Wikipedia)
– 統一塑模語言是一個用來表達軟體設計與模式的語言。 (Pilone & Pitman, UML 2.0 技術手冊 )
• 塑模 (Modeling)– 建立模型 (Create model)
8

崑山科技大學資訊科技學院資訊工程系Kun Shan University, Information Engineering Department
What is a model?• A model is a pattern, plan, representation (especially in miniature),
or description designed to show the main object or workings of an object, system, or concept. (Wikipedia)
• 模型是– 一種模式– 一個設計圖– 一個表示法– 或 一個
• 用於展現一個物體或系統或概念其主要的目的或工作方法的說明。
9

崑山科技大學資訊科技學院資訊工程系Kun Shan University, Information Engineering Department
Examples of Model• Ex.
– 牛頓第二運動定律 : Σ F = ma
• 為物體的質量與運動狀態的關係建立量化的模型。– 室內設計的藍圖
• 使用符號與數字表現與描繪出室內的空間佈置。
10

崑山科技大學資訊科技學院資訊工程系Kun Shan University, Information Engineering Department
Examples of Model– 流程圖
• 使用特定的圖案與文字表現出工作的執行流程。– 狀態圖
• 使用特定的圖案與文字符號表現出系統的狀態與彼此間的轉換關係。
11

崑山科技大學資訊科技學院資訊工程系Kun Shan University, Information Engineering Department
Thinking• 請你從日常生活經驗中也想一個塑模的例子。
12

崑山科技大學資訊科技學院資訊工程系Kun Shan University, Information Engineering Department
Logo of UML
13

崑山科技大學資訊科技學院資訊工程系Kun Shan University, Information Engineering Department
What can UML do?• UML 融入了
– Grady Booch 的 OOAD (Object Oriented Analysis & Design)
• Class & Object Diagram (Static View)
– James Rambaugh 的 OMT (Object Modeling Technique)
• Sequence Diagram (Dynamic View)
– Ivar Jacobson 的 OOSE (Object Oriented Software Engineering)
• Use case (Requirements Object Oriented Software Design)
• UML 可以描述– 靜態觀點 (Static View)
• 系統有哪些東西以及它們之間的關係為何• 例如描述汽車的各部元件連接關係
– 動態觀點 (Dynamic View)
• 描述系統如何運作• 例如描述汽車各部分元件如何互動
14

崑山科技大學資訊科技學院資訊工程系Kun Shan University, Information Engineering Department
Why do we use UML?• 直接使用程式塑模
– 優點• 將所有的細節都呈現出來
– 缺點• 細節超載
– 過多的細節導致過於複雜與不夠簡明。• 只聚焦於軟體本身,忽略系統的其他部分。
– 軟體如何使用– 如何部署– …
• 使用非正式語言塑模– 例如 : 自然語言– 不精確– 冗贅
15

崑山科技大學資訊科技學院資訊工程系Kun Shan University, Information Engineering Department
What does UML consist of?• UML 包含有許多種類的圖
– 依據 Armin Zimmermann (2007). Stochastic Discrete Event Systems: Modeling, Evaluation, Applications. Springer, 2007. ISBN 3540741720. p.52 所言,有 13 種圖 (Diagram) 分屬於三大類中。
Ref: Wikipedia, UML
* *
*
**
*: 2.0Communication Diagram >= Collaboration Diagram (1.x)
16

崑山科技大學資訊科技學院資訊工程系Kun Shan University, Information Engineering Department
UML 的三大類別• Structure Diagram
– 6 種• Behavior Diagram
– 3 種 ( 扣除 Interaction Diagram)
• Interaction Diagram– 4 種
• 每種 Diagram– 是由 UML 元素 (element) 所構成
• Note: UML沒有限定哪些元素一定要用在哪些圖內。
17

崑山科技大學資訊科技學院資訊工程系Kun Shan University, Information Engineering Department
Diagrams of UML• Structure Diagrams (結構圖 , 靜態觀點 )
– Class Diagrams ( 類別圖 )
• describes the structure of a system by showing the system's classes, their attributes, and the relationships among the classes.
• 藉由系統的類別、屬性、類別間的關係,描述系統的結構。
18
崑山科技大學資訊科技學院資訊工程系Kun Shan University, Information Engineering Department
Diagrams of UML• Structure Diagrams (結構圖 , 靜態觀點 ) (cont.)
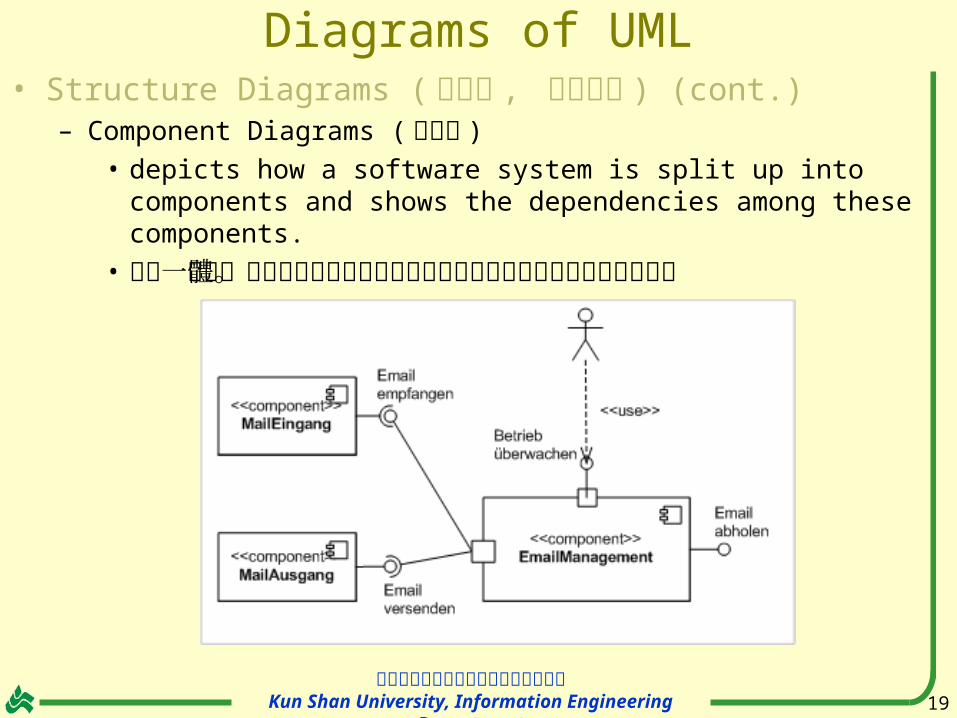
– Component Diagrams ( 元件圖 )
• depicts how a software system is split up into components and shows the dependencies among these components.
• 說明一個軟體系統如何被分割成為元件以及展示這些元件之間的相依關係。
19

崑山科技大學資訊科技學院資訊工程系Kun Shan University, Information Engineering Department
Diagrams of UML• Structure Diagrams (結構圖 , 靜態觀點 ) (cont.)
– Composite structure diagram: describes the internal structure of a class and the collaborations that this structure makes possible.
– 合成結構圖:描述系統內的元件如何結合以實現複雜的模式。
20

崑山科技大學資訊科技學院資訊工程系Kun Shan University, Information Engineering Department
Diagrams of UML• Structure Diagrams (結構圖 , 靜態觀點 ) (cont.)
– Deployment diagram serves to model the hardware used in system implementations, the components deployed on the hardware, and the associations among those components.
– 部署圖用於塑模系統實現使用的硬體、佈建於該硬體上的元件、及這些元件間的關連。
21

崑山科技大學資訊科技學院資訊工程系Kun Shan University, Information Engineering Department
Diagrams of UML• Structure Diagrams (結構圖 , 靜態觀點 ) (cont.)
– Object diagram: shows a complete or partial view of the structure of a modeled system at a specific time.
– 物件圖 : 表現一個被塑模系統結構在特定時間之完整的或部分的觀點。
22
崑山科技大學資訊科技學院資訊工程系Kun Shan University, Information Engineering Department
Diagrams of UML• Structure Diagrams (結構圖 , 靜態觀點 ) (cont.)
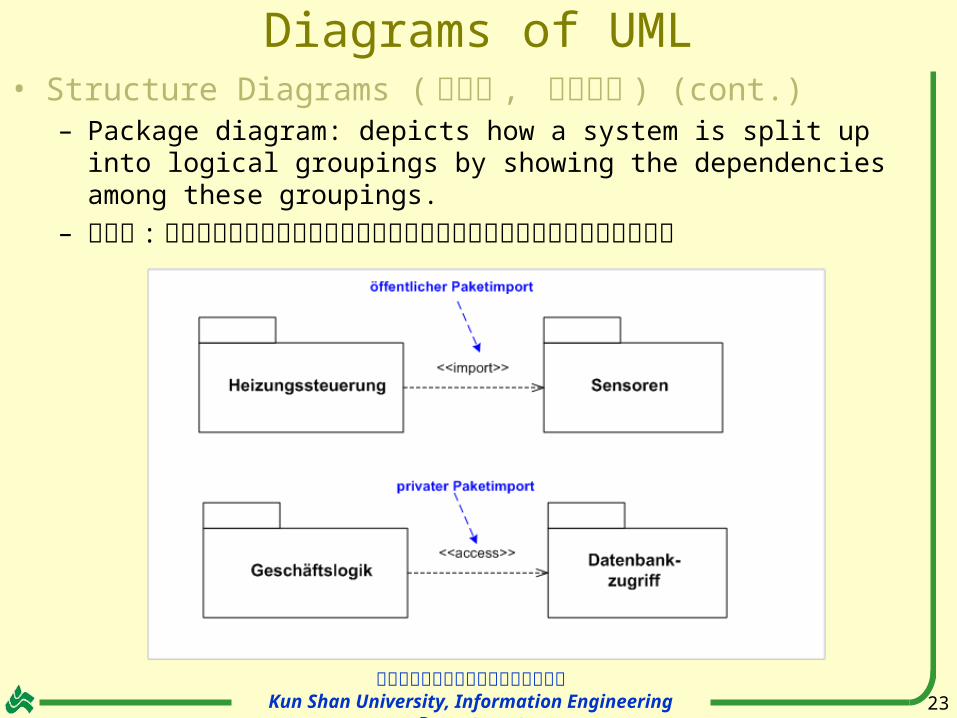
– Package diagram: depicts how a system is split up into logical groupings by showing the dependencies among these groupings.
– 包裹圖 : 藉由展示邏輯上群體間的相依關係來說明一個系統如何被分成這些群體。
23

崑山科技大學資訊科技學院資訊工程系Kun Shan University, Information Engineering Department
Diagrams of UML• Behavior Diagrams ( 行為圖,動態觀點 )
– Behavior diagrams emphasize what must happen in the system being modeled:
– 行為圖強調在被塑模的系統中哪些事必須要發生。• Include ( 包含 ):
– Activity diagram, State diagram, Use case diagram
24

崑山科技大學資訊科技學院資訊工程系Kun Shan University, Information Engineering Department
Diagrams of UML• Behavior Diagrams ( 行為圖,動態觀點 ) (cont.)
• Activity diagram: represents the business and operational step-by-step workflows of components in a system. An activity diagram shows the overall flow of control.
• 活動圖 : 表示系統中的狀況和元件們逐步運作的工作流程。這類圖展示控制的整體流程。
25

崑山科技大學資訊科技學院資訊工程系Kun Shan University, Information Engineering Department
Diagrams of UML• Behavior Diagrams ( 行為圖,動態觀點 ) (cont.)
• State diagram: standardized notation to describe many systems, from computer programs to business processes.
• 狀態圖 : 其以標準化的符號描述系統的行為。涵蓋的描述範圍由電腦程序到運轉過程。
26

崑山科技大學資訊科技學院資訊工程系Kun Shan University, Information Engineering Department
Diagrams of UML• Behavior Diagrams ( 行為圖,動態觀點 ) (cont.)
• Use case diagram: shows the functionality provided by a system in terms of actors, their goals represented as use cases, and any dependencies among those use cases.
• 使用案例圖 : 使用活動者、活動者的目標 ( 使用案例 ) 、及這些使用案例間的相依關係,展示一個系統所提供的功能性。
27

崑山科技大學資訊科技學院資訊工程系Kun Shan University, Information Engineering Department
Diagrams of UML• Interaction diagrams (互動圖 )
– Interaction diagrams, a subset of behavior diagrams, emphasize the flow of control and data among the things in the system being modeled:
– 互動圖:是行為圖的子集合,其強調在被塑模系統中的控制流程和事件的資料。
– 互動圖包括 :
• Communication diagram (Collaboration diagram)、• Interaction overview diagram、• Sequence diagram、• Timing diagrams
28

崑山科技大學資訊科技學院資訊工程系Kun Shan University, Information Engineering Department
Diagrams of UML• Interaction diagrams (互動圖 ) (cont.)
• Communication diagram: shows the interactions between objects or parts in terms of sequenced messages. – They represent a combination of information taken from Class, Sequence,
and Use Case Diagrams describing both the static structure and dynamic behavior of a system.
• 溝通圖:以有序的訊息來展示物件們或零件們彼此間的互動。– 其表現取自類別圖、循序圖、使用案例圖之資訊的結合。
29

崑山科技大學資訊科技學院資訊工程系Kun Shan University, Information Engineering Department
Diagrams of UML• Interaction diagrams (互動圖 ) (cont.)
• Interaction overview diagram: are a type of activity diagram in which the nodes represent interaction diagrams.
• 互動概觀圖:是一種活動圖,於此概觀圖中的這些節點們展現出互動的焦點。
30

崑山科技大學資訊科技學院資訊工程系Kun Shan University, Information Engineering Department
Diagrams of UML• Interaction diagrams (互動圖 ) (cont.)
• Sequence diagram: shows how objects communicate with each other in terms of a sequence of messages. Also indicates the lifespans of objects relative to those messages.
• 循序圖:展現物件們彼此間如何透過一系列的訊息來溝通。其也指出物件與訊息間的相對壽命。
31

崑山科技大學資訊科技學院資訊工程系Kun Shan University, Information Engineering Department
Diagrams of UML• Interaction diagrams (互動圖 ) (cont.)
• Timing diagrams: are a specific type of interaction diagram, where the focus is on timing constraints.
• 時序圖:是一種特殊的互動圖,其焦點在於時序上的限制。
32

崑山科技大學資訊科技學院資訊工程系Kun Shan University, Information Engineering Department
Philippe Kruchten 4+1 View• Philippe Kruchten 4+1 View
Ref: Wikipedia Kruchten, Philippe (1995, November). Architectural Blueprints — The “4+1” View Model of Software Architecture. IEEE Software 12 (6), pp. 42-50.
33

崑山科技大學資訊科技學院資訊工程系Kun Shan University, Information Engineering Department
Philippe Kruchten 4+1 View• Logical view :
– The logical view is concerned with the functionality that the system provides to end-users.
– UML Diagrams to represent logical view include
• Class Diagram,
• Communication diagram,
• Sequence diagram.
– Ref:• Mikko Kontio (2005, February)
Architectural manifesto: Designing software architectures, Part 5 .
• Wikipedia
34

崑山科技大學資訊科技學院資訊工程系Kun Shan University, Information Engineering Department
Philippe Kruchten 4+1 View• Development view :
– The development view illustrates a system from a programmers perspective and is concerned with software management.
– This view is also known as the implementation view.
– It uses the UML component diagram to describe system components.
– UML Diagrams to represent development view include the Package diagram.
– Ref:
• Mikko Kontio (2005, February) Architectural manifesto: Designing software architectures, Part 5 .
• Wikipedia
35

崑山科技大學資訊科技學院資訊工程系Kun Shan University, Information Engineering Department
Philippe Kruchten 4+1 View• Process view :
– The process model deals with the dynamic aspect of the system, explains the system processes and how they communicate, and focuses on the runtime behavior of the system.
– The process view addresses concurrency, distribution, integrators, performance, and scalability, etc.
– UML Diagrams to represent process view include the Model-view-controller and Activity diagram.
– Ref:
• Mikko Kontio (2005, February) Architectural manifesto: Designing software architectures, Part 5 .
– Wikipedia
36

崑山科技大學資訊科技學院資訊工程系Kun Shan University, Information Engineering Department
Philippe Kruchten 4+1 View• Physical view :
– The physical view depicts the system from a system engineer's point-of-view.
– It is concerned with the topology of software components on the physical layer, as well as communication between these components.
– This view is also known as the deployment view.
– UML Diagrams to represent physical view include the Deployment diagram.
– Ref:
• Mikko Kontio (2005, February) Architectural manifesto: Designing software architectures, Part 5 .
– Wikipedia
37

崑山科技大學資訊科技學院資訊工程系Kun Shan University, Information Engineering Department
Philippe Kruchten 4+1 View• Scenarios :
– The description of an architecture is illustrated using a small set of use cases, or scenarios which become a fifth view.
– The scenarios describe sequences of interactions between objects, and between processes.
– They are used to identify architectural elements and to illustrate and validate the architecture design.
– They also serve as a starting point for tests of an architecture prototype.
– UML Diagram(s) used to represent scenario view include the Use case diagram.
– Ref:• Mikko Kontio (2005, February) Architectural manifesto:
Designing software architectures, Part 5 . • Wikipedia
38

崑山科技大學資訊科技學院資訊工程系Kun Shan University, Information Engineering Department
Philippe Kruchten 4+1 View• UML 4+1 View
Logical View(Design View)(邏輯觀點 )(設計觀點 )
Physical View(Deployment View)
(實踐觀點 )(部署觀點 )
Process View(程序觀點 )
Development View(Implementation View)
(開發觀點 )(實作觀點 )
Scenarios(Use Case)
(使用案例觀點 )
Programmer/Software ManagerSystem Engineering
(Deployment Diagram)
(Activity Diagram)
(Component Diagram)(Package Diagram)
(Class Diagram)(Communication Diagram)(Sequence Diagram)
(Use case Diagram)
39
崑山科技大學資訊科技學院資訊工程系Kun Shan University, Information Engineering Department
Another Description• Ref.
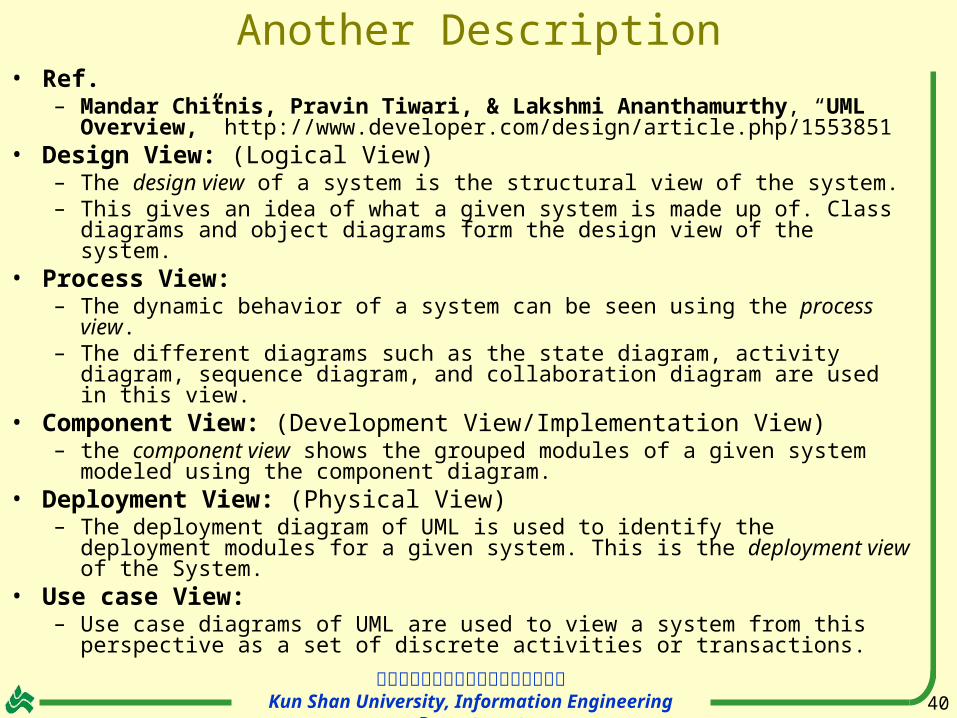
– Mandar Chitnis, Pravin Tiwari, & Lakshmi Ananthamurthy, “UML Overview,” http://www.developer.com/design/article.php/1553851
• Design View: (Logical View)– The design view of a system is the structural view of the system. – This gives an idea of what a given system is made up of. Class diagrams and object
diagrams form the design view of the system. • Process View:
– The dynamic behavior of a system can be seen using the process view. – The different diagrams such as the state diagram, activity diagram, sequence diagram,
and collaboration diagram are used in this view. • Component View: (Development View/Implementation View)
– the component view shows the grouped modules of a given system modeled using the component diagram.
• Deployment View: (Physical View)– The deployment diagram of UML is used to identify the deployment modules for a
given system. This is the deployment view of the System.• Use case View:
– Use case diagrams of UML are used to view a system from this perspective as a set of discrete activities or transactions.
40

崑山科技大學資訊科技學院資訊工程系Kun Shan University, Information Engineering Department
UML Tools • 可以繪製 UML 的軟體工具 :
– StarUML
• Free
• www.staruml.com
– Rational Software Architecture (RSA)
• IBM
– NetBean 5.0
• Free
• Sun
– Case Complete
• Serlio Co., U.S.A.
– VP-UML
• Has a Free version
• http://www.visual-paradigm.com/product/vpuml/communityedition.jsp
41


![20110525[Taipei GTUG] titanium mobile簡介](https://static.fdocuments.in/doc/165x107/54c806414a79599c148b458c/20110525taipei-gtug-titanium-mobile.jpg)