
Introducing Harvest ESG Scores
34
Introducing Harvest ESG Scores Harvest Foresight Technology March 2021
Transcript of Introducing Harvest ESG Scores
Introducing Harvest ESG
Scores
Harvest Foresight Technology
March 2021
ESG trends in China
3
0
2,000
4,000
6,000
8,000
10,000
12,000
14,000
16,000
1994 1996 1998 2000 2002 2004 2006 2008 2010 2012 2014 2016 2018 2020 2022 2024 2026 2028 2030 2032 2034
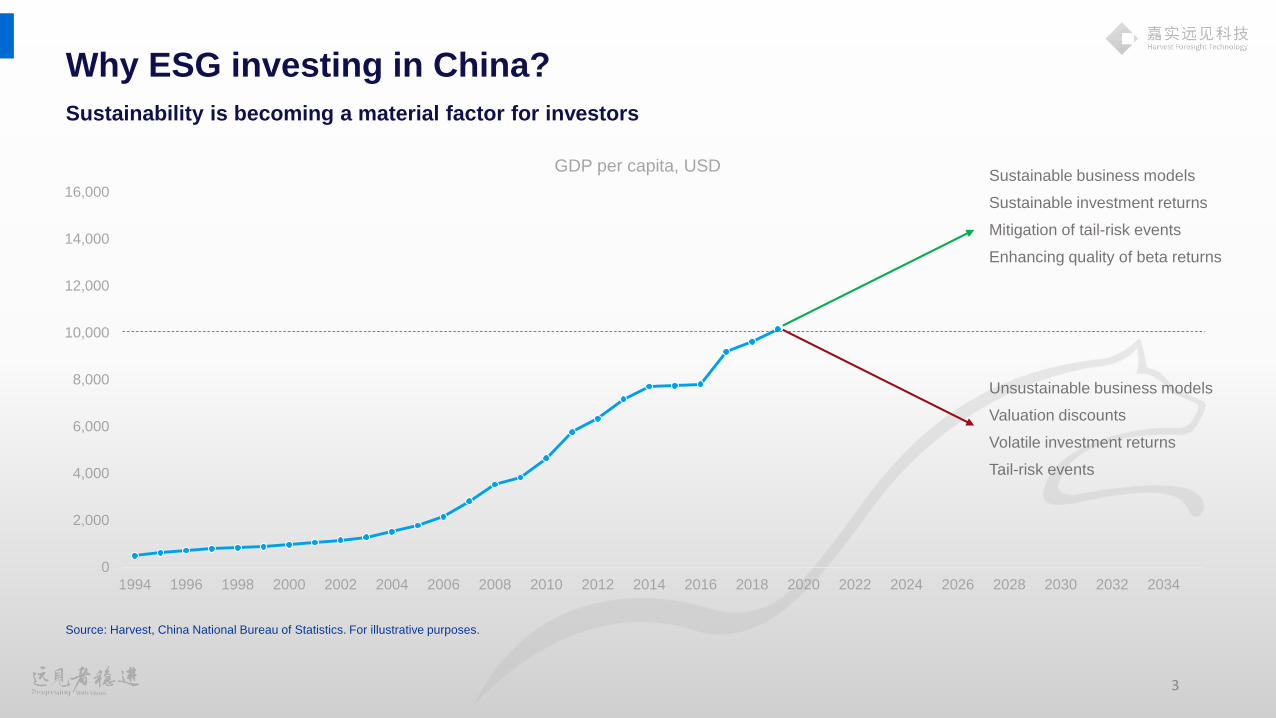
GDP per capita, USD
Why ESG investing in China?
Sustainability is becoming a material factor for investors
Source: Harvest, China National Bureau of Statistics. For illustrative purposes.
Sustainable business models
Sustainable investment returns
Mitigation of tail-risk events
Enhancing quality of beta returns
Unsustainable business models
Valuation discounts
Volatile investment returns
Tail-risk events

4
ESG is a key element for China’s long-term well beingChina’s transition towards quality growth prompts a shift towards ESG investments
Green Finance
SystemCoporate Governance
Code
Green Investment
Guidance
Mandatory Environmental
Disclosure
PBOC: Guidelines
for establishing the green
financials system
CSRC: Revised Corporate
Governance Code
AMAC: Green Investment
Guidance for Fund Managers
IAMAC: Green Investment Proposal
for Insurance Asset Managers
Stock Exchanges: environmental
disclsoure becomes mandatory
for all listed companies
2016.08 2018.06 2018.11 2020
5
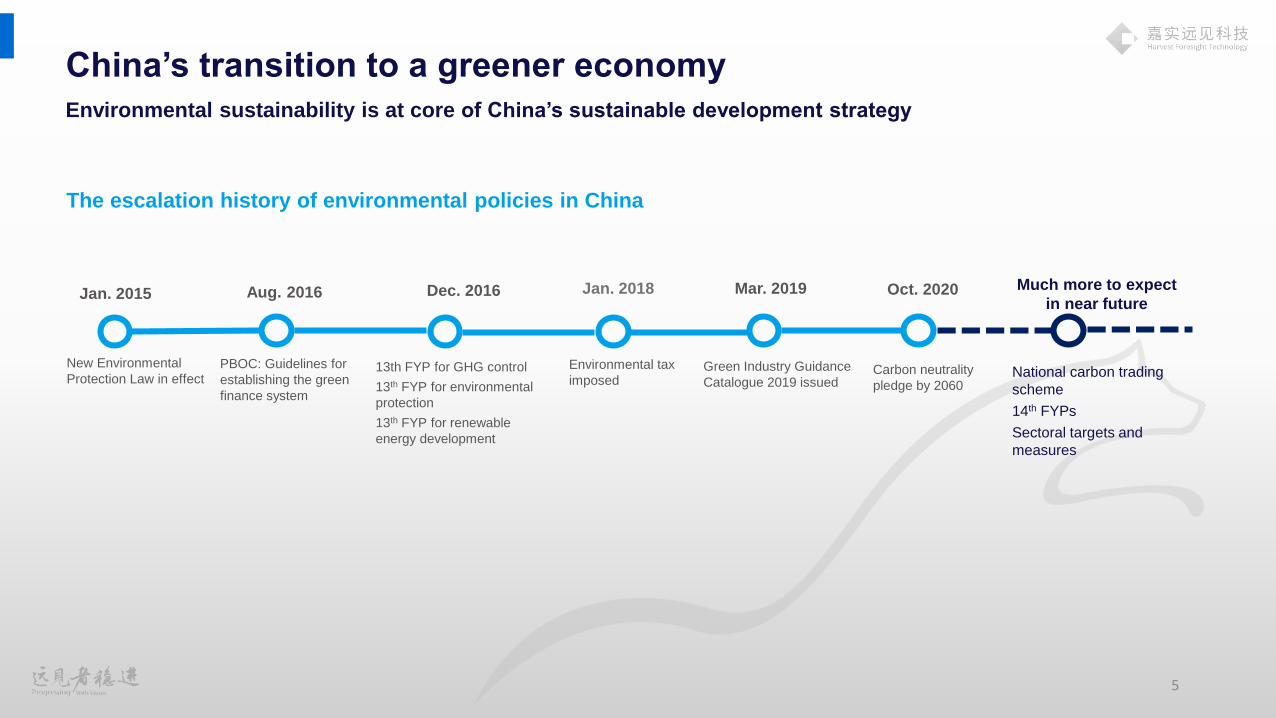
Green Industry Guidance
Catalogue 2019 issued
New Environmental
Protection Law in effect13th FYP for GHG control
13th FYP for environmental
protection
13th FYP for renewable
energy development
Jan. 2015 Aug. 2016 Dec. 2016 Oct. 2020
Carbon neutrality
pledge by 2060
Much more to expect
in near future
National carbon trading
scheme
14th FYPs
Sectoral targets and
measures
Mar. 2019Jan. 2018
Environmental tax
imposed
PBOC: Guidelines for
establishing the green
finance system
China’s transition to a greener economy Environmental sustainability is at core of China’s sustainable development strategy
The escalation history of environmental policies in China
6
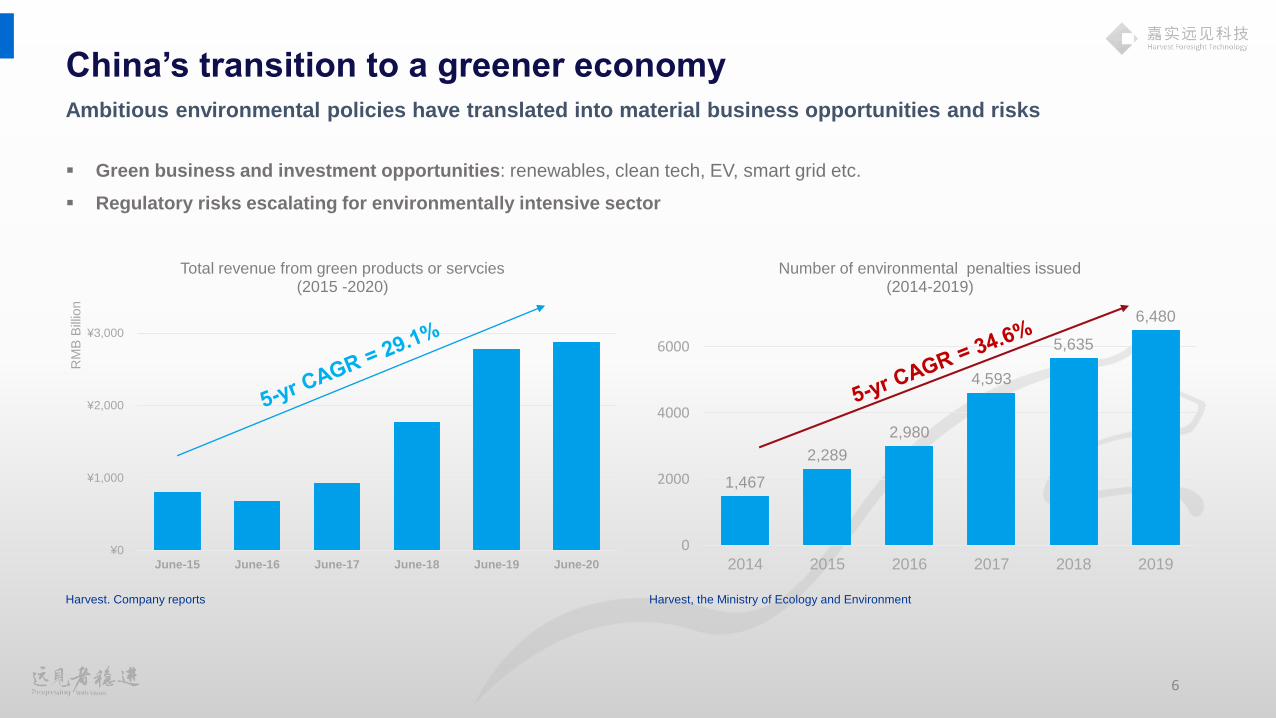
China’s transition to a greener economy Ambitious environmental policies have translated into material business opportunities and risks
Harvest. Company reports Harvest, the Ministry of Ecology and Environment
Green business and investment opportunities: renewables, clean tech, EV, smart grid etc.
Regulatory risks escalating for environmentally intensive sector
1,467
2,289
2,980
4,593
5,635
6,480
0
2000
4000
6000
2014 2015 2016 2017 2018 2019
Number of environmental penalties issued (2014-2019)
¥0
¥1,000
¥2,000
¥3,000
June-15 June-16 June-17 June-18 June-19 June-20
RM
B B
illio
n
Total revenue from green products or servcies (2015 -2020)
7
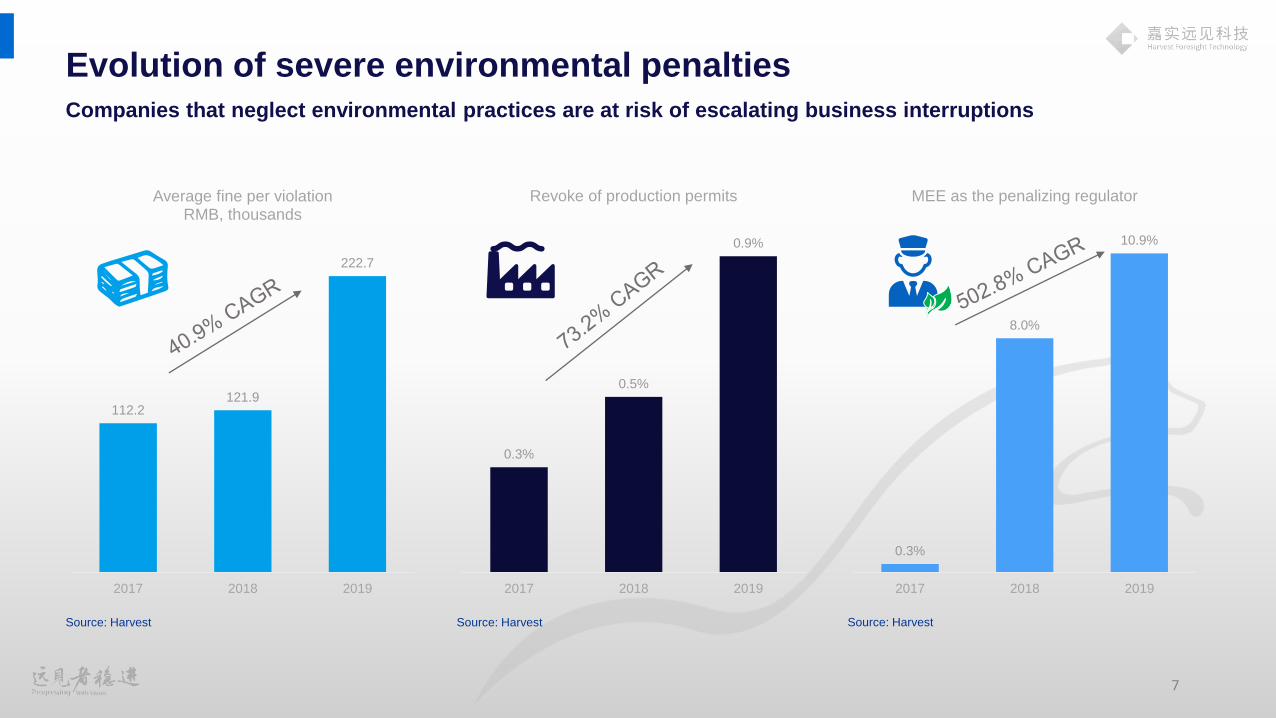
Evolution of severe environmental penaltiesCompanies that neglect environmental practices are at risk of escalating business interruptions
Source: Harvest
112.2 121.9
222.7
2017 2018 2019
Average fine per violationRMB, thousands
0.3%
0.5%
0.9%
2017 2018 2019
Revoke of production permits
0.3%
8.0%
10.9%
2017 2018 2019
MEE as the penalizing regulator
Source: Harvest Source: Harvest
8
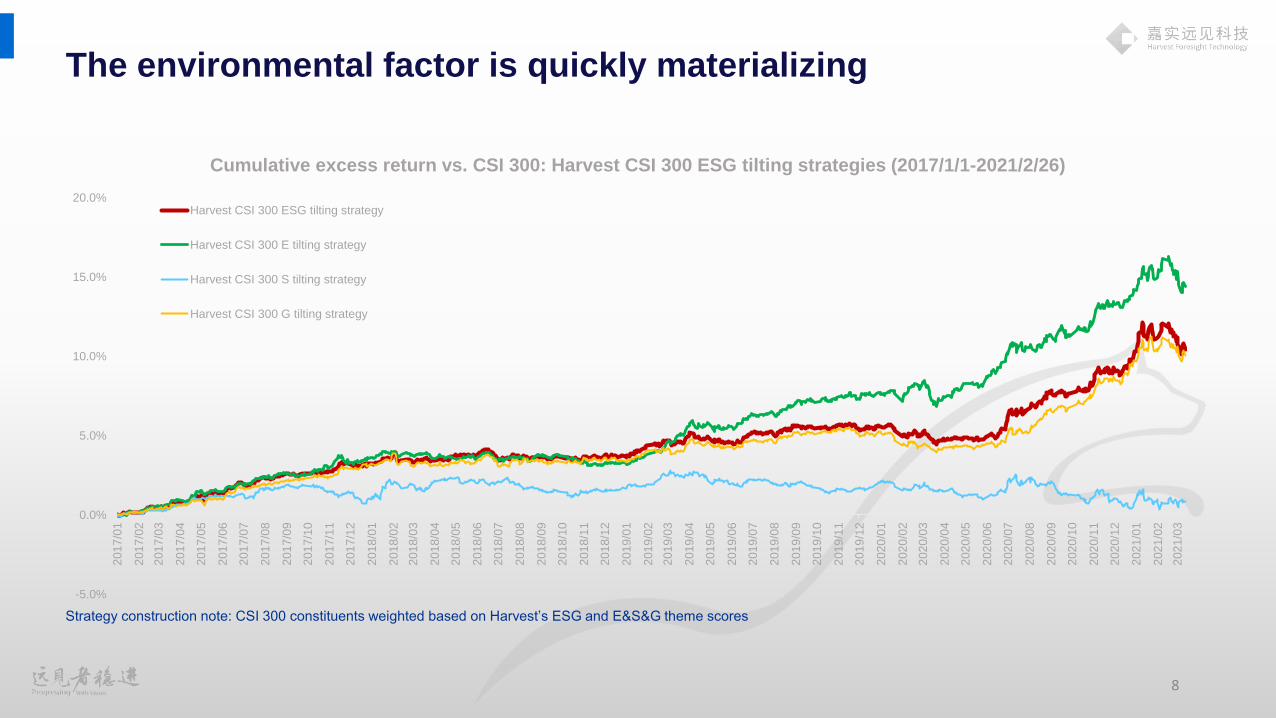
The environmental factor is quickly materializing
Strategy construction note: CSI 300 constituents weighted based on Harvest’s ESG and E&S&G theme scores
-5.0%
0.0%
5.0%
10.0%
15.0%
20.0%
201
7/0
1
201
7/0
2
201
7/0
3
201
7/0
4
201
7/0
5
201
7/0
6
201
7/0
7
201
7/0
8
201
7/0
9
201
7/1
0
201
7/1
1
201
7/1
2
201
8/0
1
201
8/0
2
201
8/0
3
201
8/0
4
201
8/0
5
201
8/0
6
201
8/0
7
201
8/0
8
201
8/0
9
201
8/1
0
201
8/1
1
201
8/1
2
201
9/0
1
201
9/0
2
201
9/0
3
201
9/0
4
201
9/0
5
201
9/0
6
201
9/0
7
201
9/0
8
201
9/0
9
201
9/1
0
201
9/1
1
201
9/1
2
202
0/0
1
202
0/0
2
202
0/0
3
202
0/0
4
202
0/0
5
202
0/0
6
202
0/0
7
202
0/0
8
202
0/0
9
202
0/1
0
202
0/1
1
202
0/1
2
202
1/0
1
202
1/0
2
202
1/0
3
Cumulative excess return vs. CSI 300: Harvest CSI 300 ESG tilting strategies (2017/1/1-2021/2/26)
Harvest CSI 300 ESG tilting strategy
Harvest CSI 300 E tilting strategy
Harvest CSI 300 S tilting strategy
Harvest CSI 300 G tilting strategy
9
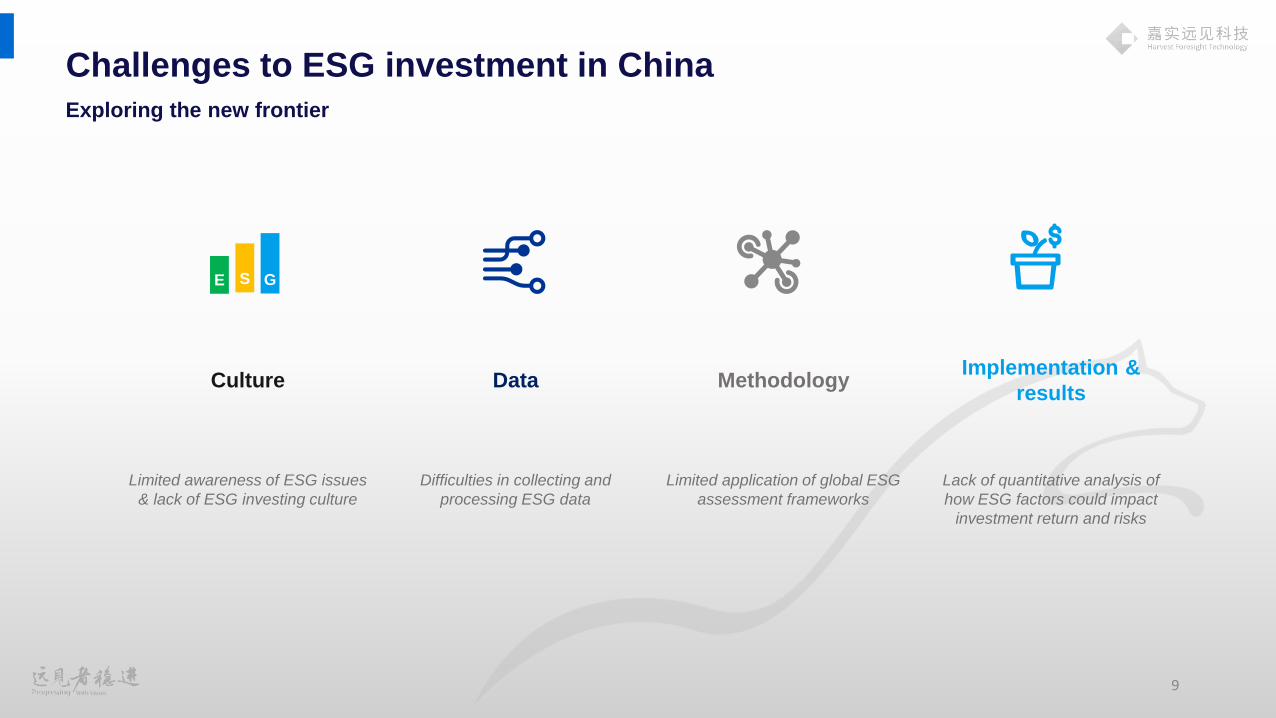
Challenges to ESG investment in ChinaExploring the new frontier
Culture Data MethodologyImplementation &
results
Limited awareness of ESG issues
& lack of ESG investing culture
Difficulties in collecting and
processing ESG data
Limited application of global ESG
assessment frameworks
Lack of quantitative analysis of
how ESG factors could impact
investment return and risks
E S G
10
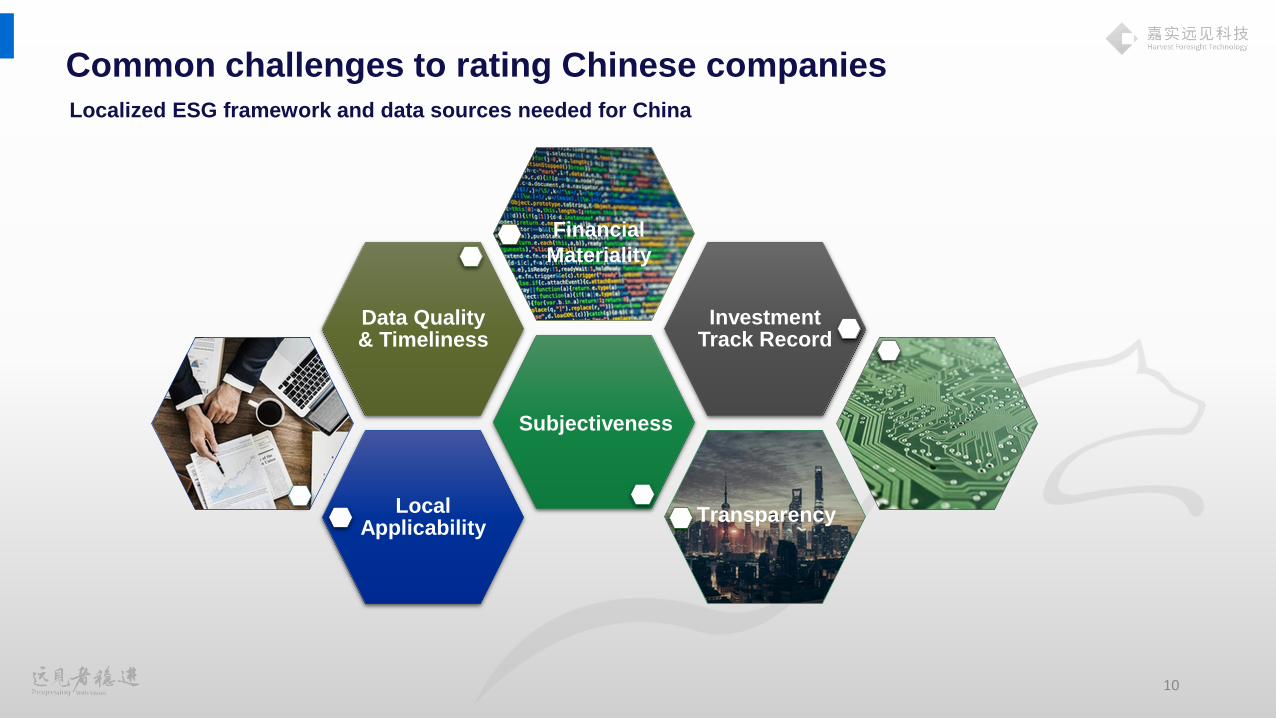
Common challenges to rating Chinese companies
Local Applicability
Data Quality & Timeliness
InvestmentTrack Record
Financial
Materiality
Transparency
Localized ESG framework and data sources needed for China
Subjectiveness

Introducing Harvest ESG Scores

Dedicated ESG research analysts with extensive fundamental and quantitative investment background
Harvest ESG research capabilities
Thematic ESG research ESG integration ESG monitoring & risk
alerts
Portfolio ESG analytics
Deep dive ESG reports ESG training & capacity building Negative & norm-based screening Portfolio ESG analysis & reporting
Proprietary ESG assessments Company engagement Real time ESG risk monitoring &
alerts
ESG factor analysis
The Harvest ESG Research team consists of ESG researchers and investment professionals with extensive experience and background in global and local
ESG research, ESG consulting, fundamental and quantitative investment analysis in China, as well as data science and NLP technologies. Harvest’s ESG
research is supported by Harvest’s industry leading investment teams and their extensive experience and insights on China’s A shares market. The ESG
team could support investment professionals and institutions to systematically integrate ESG factors throughout the investment value chain , monitor ESG
risks and develop ESG themed strategies.
12
13
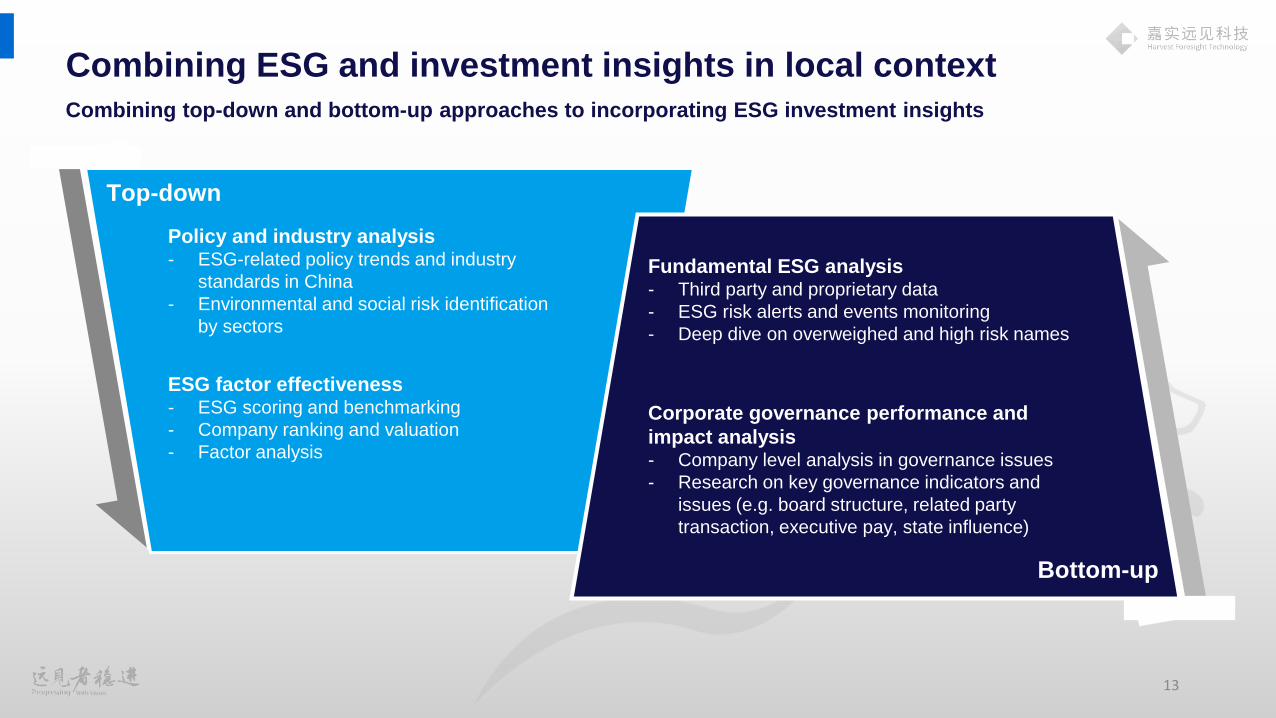
Combining ESG and investment insights in local contextCombining top-down and bottom-up approaches to incorporating ESG investment insights
Bottom-up
Top-down
Fundamental ESG analysis- Third party and proprietary data
- ESG risk alerts and events monitoring
- Deep dive on overweighed and high risk names
Corporate governance performance and
impact analysis- Company level analysis in governance issues
- Research on key governance indicators and
issues (e.g. board structure, related party
transaction, executive pay, state influence)
Policy and industry analysis- ESG-related policy trends and industry
standards in China
- Environmental and social risk identification
by sectors
ESG factor effectiveness- ESG scoring and benchmarking
- Company ranking and valuation
- Factor analysis
14
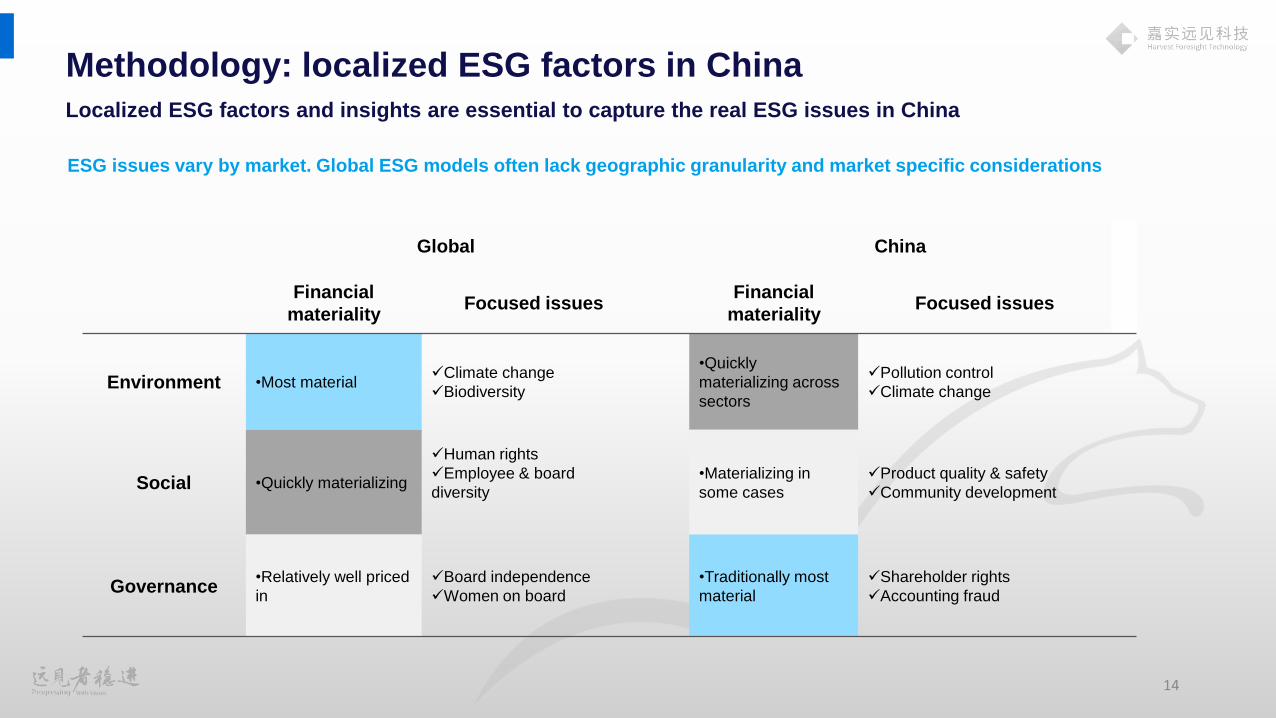
Methodology: localized ESG factors in ChinaLocalized ESG factors and insights are essential to capture the real ESG issues in China
ESG issues vary by market. Global ESG models often lack geographic granularity and market specific considerations
Global China
Financial
materialityFocused issues
Financial
materialityFocused issues
Environment •Most materialClimate change
Biodiversity
•Quickly
materializing across
sectors
Pollution control
Climate change
Social •Quickly materializing
Human rights
Employee & board
diversity
•Materializing in
some cases
Product quality & safety
Community development
Governance•Relatively well priced
in
Board independence
Women on board
•Traditionally most
material
Shareholder rights
Accounting fraud
15
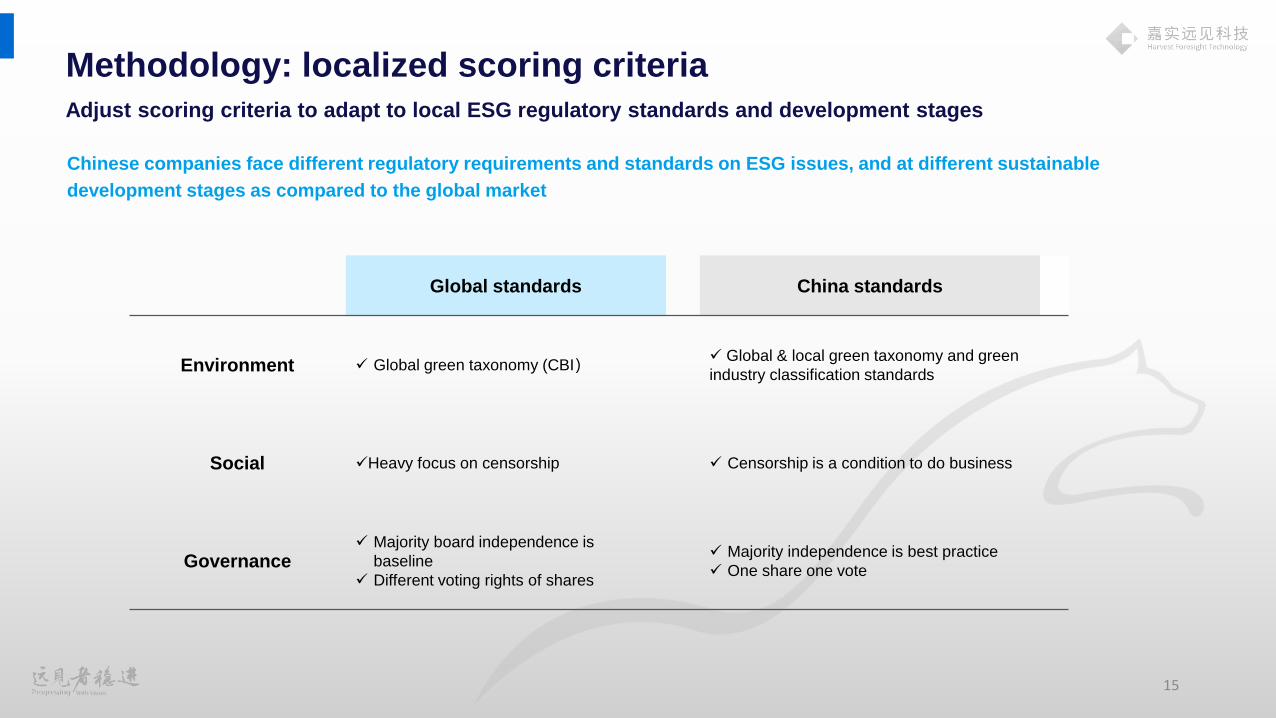
Methodology: localized scoring criteriaAdjust scoring criteria to adapt to local ESG regulatory standards and development stages
Chinese companies face different regulatory requirements and standards on ESG issues, and at different sustainable
development stages as compared to the global market
Global standards China standards
Environment Global green taxonomy (CBI) Global & local green taxonomy and green
industry classification standards
Social Heavy focus on censorship Censorship is a condition to do business
Governance Majority board independence is
baseline
Different voting rights of shares
Majority independence is best practice
One share one vote
16
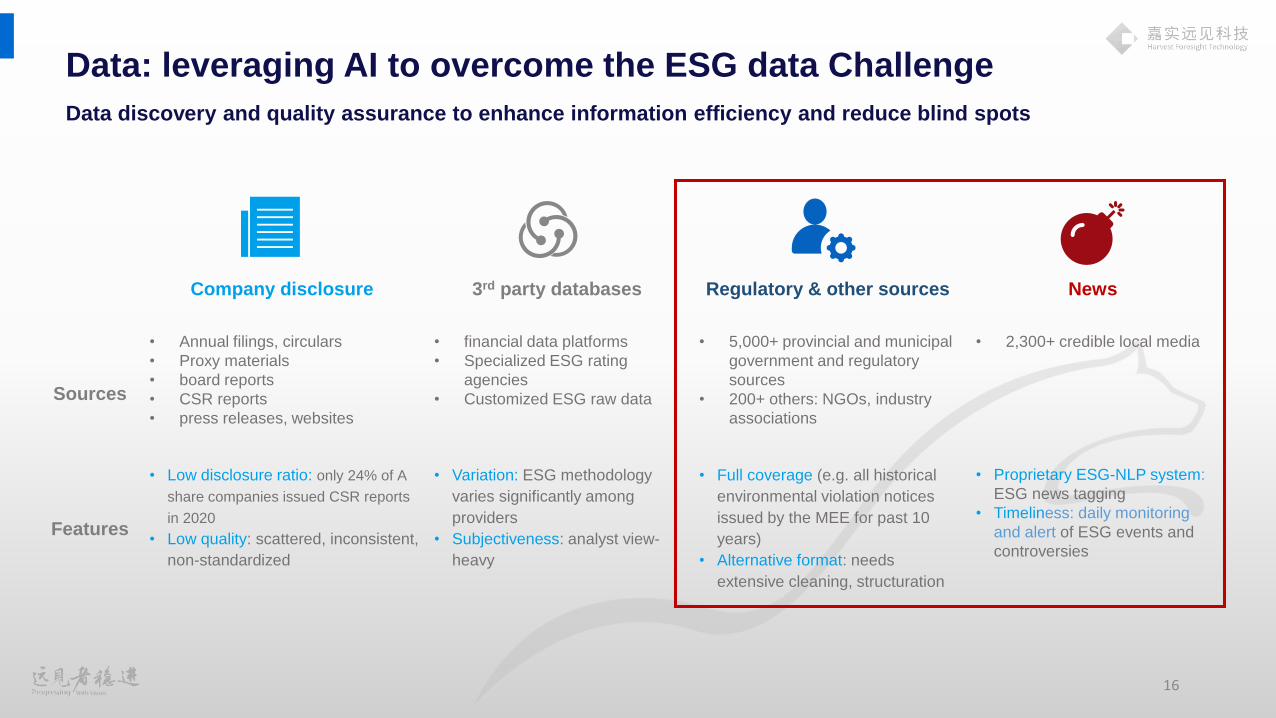
Company disclosure 3rd party databases Regulatory & other sources News
Sources
• Annual filings, circulars
• Proxy materials
• board reports
• CSR reports
• press releases, websites
• financial data platforms
• Specialized ESG rating
agencies
• Customized ESG raw data
• 5,000+ provincial and municipal
government and regulatory
sources
• 200+ others: NGOs, industry
associations
• 2,300+ credible local media
Features
• Low disclosure ratio: only 24% of A
share companies issued CSR reports
in 2020
• Low quality: scattered, inconsistent,
non-standardized
• Variation: ESG methodology
varies significantly among
providers
• Subjectiveness: analyst view-
heavy
• Full coverage (e.g. all historical
environmental violation notices
issued by the MEE for past 10
years)
• Alternative format: needs
extensive cleaning, structuration
• Proprietary ESG-NLP system:
ESG news tagging
• Timeliness: daily monitoring
and alert of ESG events and
controversies
Data discovery and quality assurance to enhance information efficiency and reduce blind spots
Data: leveraging AI to overcome the ESG data Challenge

Harvest ESG Framework
Theme (3) Environment Social Governance
Topic (8)Environmental risk exposure
Pollution & emission control
Natural resources & ecological
impactHuman capital
Product & service quality
Community development &
contribution
Corporate governance
structure
Governancebehavior
Issue (23)
Geographic risk exposure
Climate change Natural resources
use
Labor management & employee
benefits
Product safety &quality
Community development
Shareholderstructure & rights
Business ethics & anticorruption
Business risk exposure
Pollutant emissionsCircular & green
economyEmployee health &
safetyBusiness innovation
Supply chain responsibility
Board composition & oversight
Governance related controversies
Environmentalviolations &
controversies
Talent development &
engagement
Customer privacy & data security
Accounting practices
Labor related controversies
Product related controversies
Executive pay & incentives
Metrics 110+ underlying ESG metrics
17
Harvest ESG frameworkProprietarily developed by Harvest to capture material ESG issues in a quant & data-driven manner
As of June 2020
ESG signals in the A shares market are under-discovered. Developing an globally-aligned ESG framework which is adapted to China’s market condition is
essential to enhance granularity and investment relevance of the ESG signal in China.
18
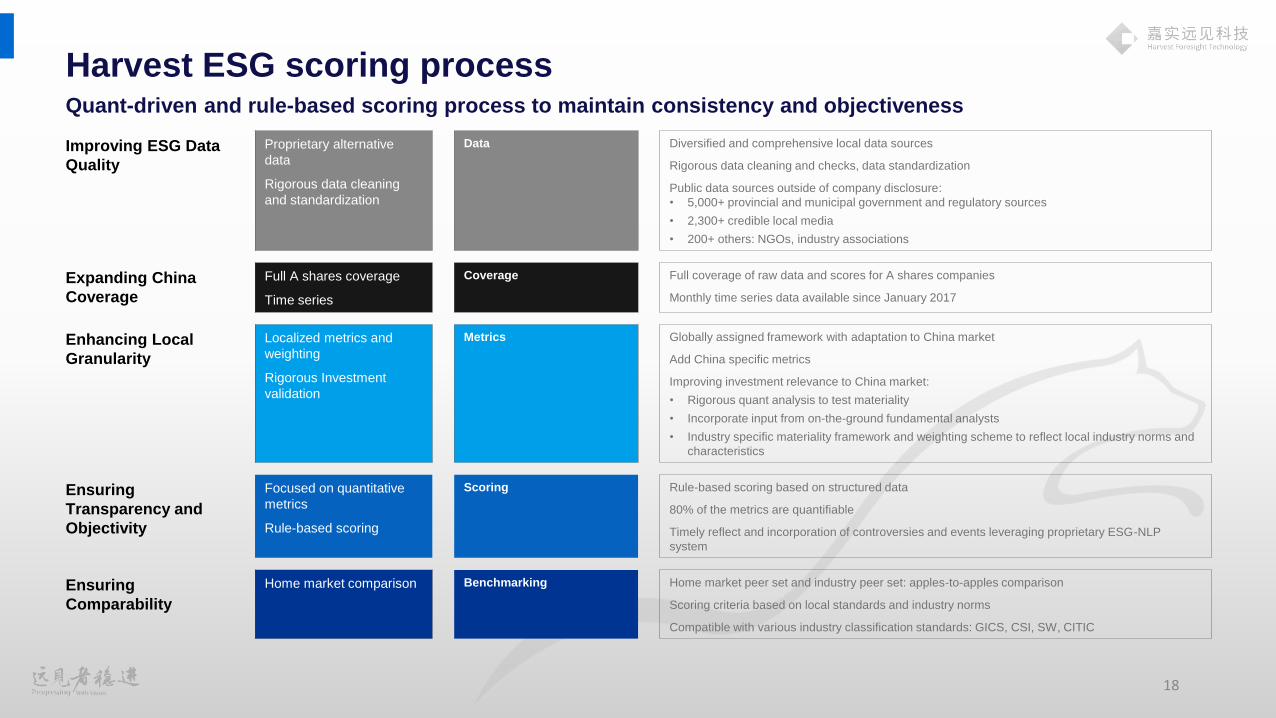
Harvest ESG scoring processQuant-driven and rule-based scoring process to maintain consistency and objectiveness
Improving ESG Data
Quality
Proprietary alternative
data
Rigorous data cleaning
and standardization
Data Diversified and comprehensive local data sources
Rigorous data cleaning and checks, data standardization
Public data sources outside of company disclosure:
• 5,000+ provincial and municipal government and regulatory sources
• 2,300+ credible local media
• 200+ others: NGOs, industry associations
Expanding China
Coverage
Full A shares coverage
Time series
Coverage Full coverage of raw data and scores for A shares companies
Monthly time series data available since January 2017
Enhancing Local
Granularity
Localized metrics and
weighting
Rigorous Investment
validation
Metrics Globally assigned framework with adaptation to China market
Add China specific metrics
Improving investment relevance to China market:
• Rigorous quant analysis to test materiality
• Incorporate input from on-the-ground fundamental analysts
• Industry specific materiality framework and weighting scheme to reflect local industry norms and
characteristics
Ensuring
Transparency and
Objectivity
Focused on quantitative
metrics
Rule-based scoring
Scoring Rule-based scoring based on structured data
80% of the metrics are quantifiable
Timely reflect and incorporation of controversies and events leveraging proprietary ESG-NLP
system
Ensuring
Comparability
Home market comparison Benchmarking Home market peer set and industry peer set: apples-to-apples comparison
Scoring criteria based on local standards and industry norms
Compatible with various industry classification standards: GICS, CSI, SW, CITIC
19
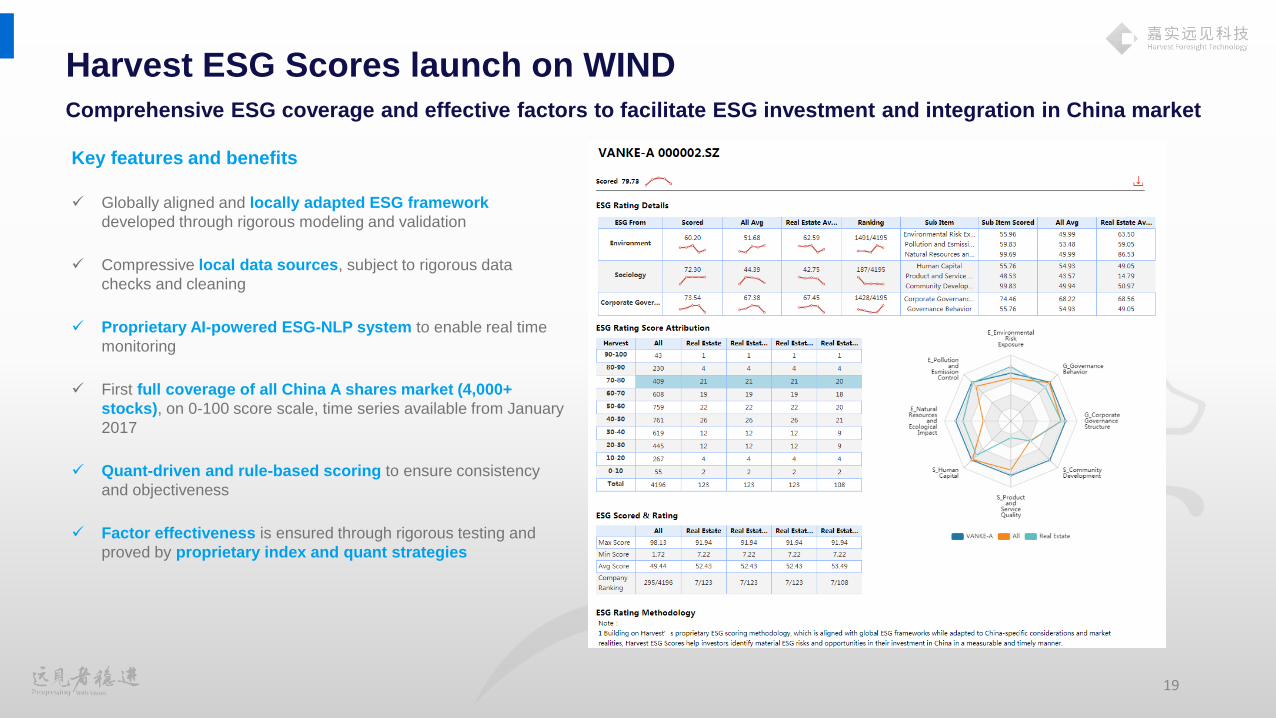
Harvest ESG Scores launch on WINDComprehensive ESG coverage and effective factors to facilitate ESG investment and integration in China market
Key features and benefits
Globally aligned and locally adapted ESG framework
developed through rigorous modeling and validation
Compressive local data sources, subject to rigorous data
checks and cleaning
Proprietary AI-powered ESG-NLP system to enable real time
monitoring
First full coverage of all China A shares market (4,000+
stocks), on 0-100 score scale, time series available from January
2017
Quant-driven and rule-based scoring to ensure consistency
and objectiveness
Factor effectiveness is ensured through rigorous testing and
proved by proprietary index and quant strategies
20
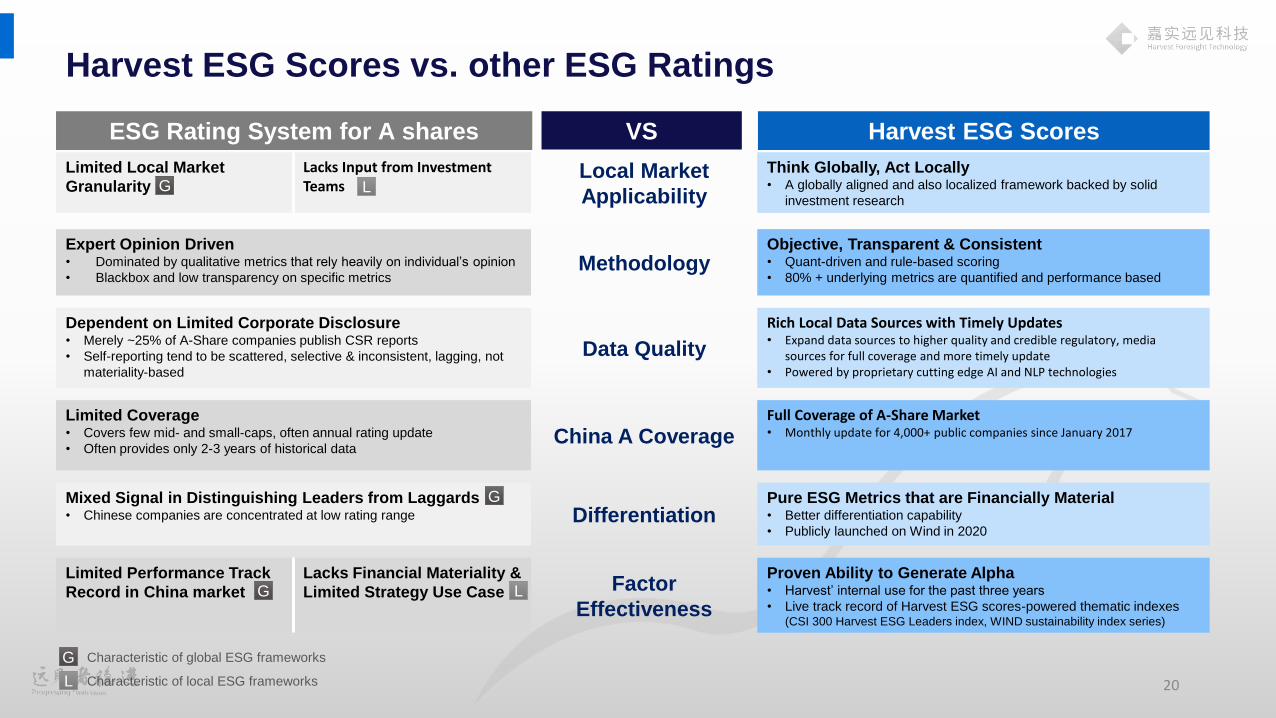
Harvest ESG Scores vs. other ESG Ratings
Limited Local Market
Granularity
Lacks Input from Investment Teams
Local Market
Applicability
Think Globally, Act Locally• A globally aligned and also localized framework backed by solid
investment research
Expert Opinion Driven• Dominated by qualitative metrics that rely heavily on individual’s opinion
• Blackbox and low transparency on specific metricsMethodology
Objective, Transparent & Consistent• Quant-driven and rule-based scoring
• 80% + underlying metrics are quantified and performance based
Dependent on Limited Corporate Disclosure• Merely ~25% of A-Share companies publish CSR reports
• Self-reporting tend to be scattered, selective & inconsistent, lagging, not
materiality-based
Data Quality
Rich Local Data Sources with Timely Updates• Expand data sources to higher quality and credible regulatory, media
sources for full coverage and more timely update• Powered by proprietary cutting edge AI and NLP technologies
Limited Coverage• Covers few mid- and small-caps, often annual rating update
• Often provides only 2-3 years of historical dataChina A Coverage
Full Coverage of A-Share Market• Monthly update for 4,000+ public companies since January 2017
Mixed Signal in Distinguishing Leaders from Laggards• Chinese companies are concentrated at low rating range Differentiation
Pure ESG Metrics that are Financially Material• Better differentiation capability
• Publicly launched on Wind in 2020
Limited Performance Track
Record in China market
Lacks Financial Materiality &
Limited Strategy Use Case Factor
Effectiveness
Proven Ability to Generate Alpha• Harvest’ internal use for the past three years
• Live track record of Harvest ESG scores-powered thematic indexes(CSI 300 Harvest ESG Leaders index, WIND sustainability index series)
ESG Rating System for A shares Harvest ESG ScoresVS
G L
G
G L
G Characteristic of global ESG frameworks
Characteristic of local ESG frameworksL

-30%
-20%
-10%
0%
10%
20%
30%
40%
50%
201
6/1
2
201
7/0
2
201
7/0
4
201
7/0
6
201
7/0
8
201
7/1
0
201
7/1
2
201
8/0
2
201
8/0
4
201
8/0
6
201
8/0
8
201
8/1
0
201
8/1
2
201
9/0
2
201
9/0
4
201
9/0
6
201
9/0
8
201
9/1
0
201
9/1
2
202
0/0
2
202
0/0
4
202
0/0
6
202
0/0
8
All A-shares ESG quintile analysis, Total returns
5th quintile
4th quintile
3rd quintile
2nd quintile
1st quintile
21
Harvest ESG Scores can effectively capture alpha Harvest ESG scores connect ESG materiality with long-term performance in China A shares market
Harvest, ESG scores for All-A shares companies as of 2020/12/31
Harvest ESG scores excel in differentiating between ESG
leaders and laggards in China A shares market
0%
5%
10%
15%
20%
25%
90~100 80~90 70~80 60~70 50~60 40~50 30~40 20~30 10~20 0~10
Harvest ESG score distribution 2020/12/31
Leaders LaggardsMedian
Harvest ESG scores as a factor have shown to be material for
risk and returns among the quintiles
Source: Harvest, simulated performance from January 1, 2017 to September 21, 2020.
Quintile 5th 4th 3rd 2nd 1st
Ann. Return 0.80% 3.09% 4.53% 6.36% 7.98%
22
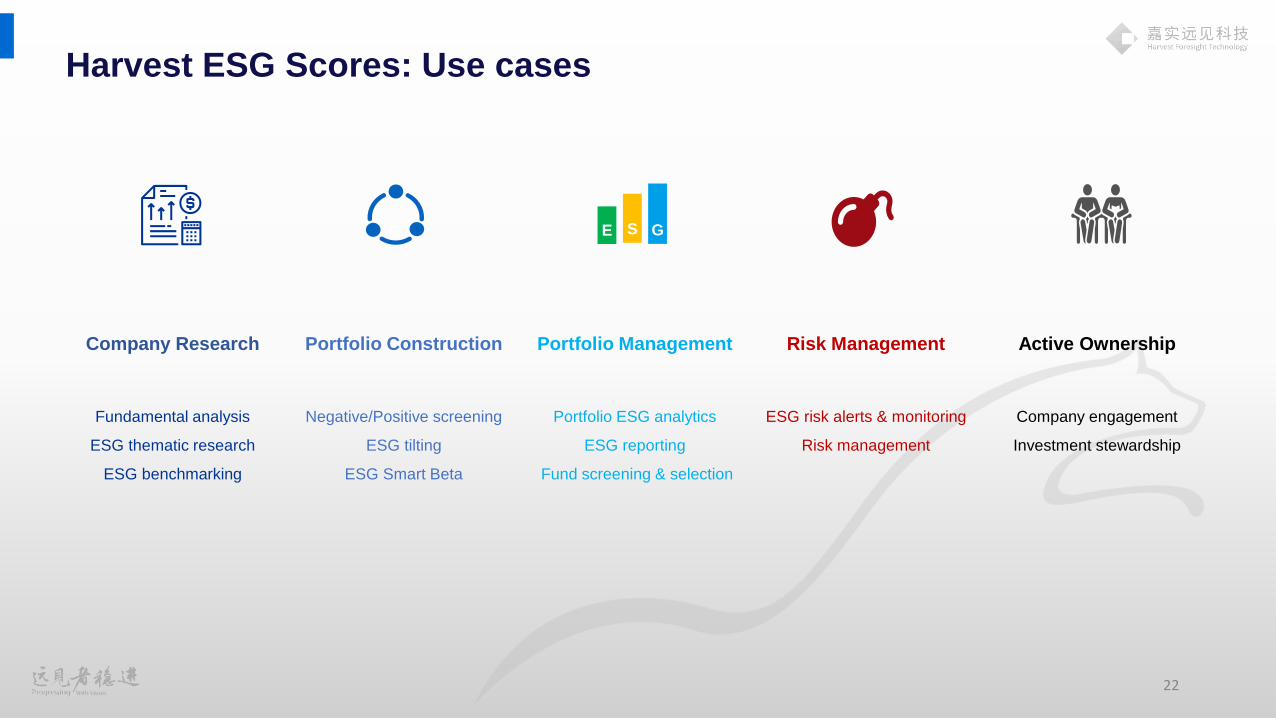
Harvest ESG Scores: Use cases
Company Research Portfolio Construction Portfolio Management Risk Management Active Ownership
Fundamental analysis
ESG thematic research
ESG benchmarking
Negative/Positive screening
ESG tilting
ESG Smart Beta
Portfolio ESG analytics
ESG reporting
Fund screening & selection
ESG risk alerts & monitoring
Risk management
Company engagement
Investment stewardship
G E S G
23
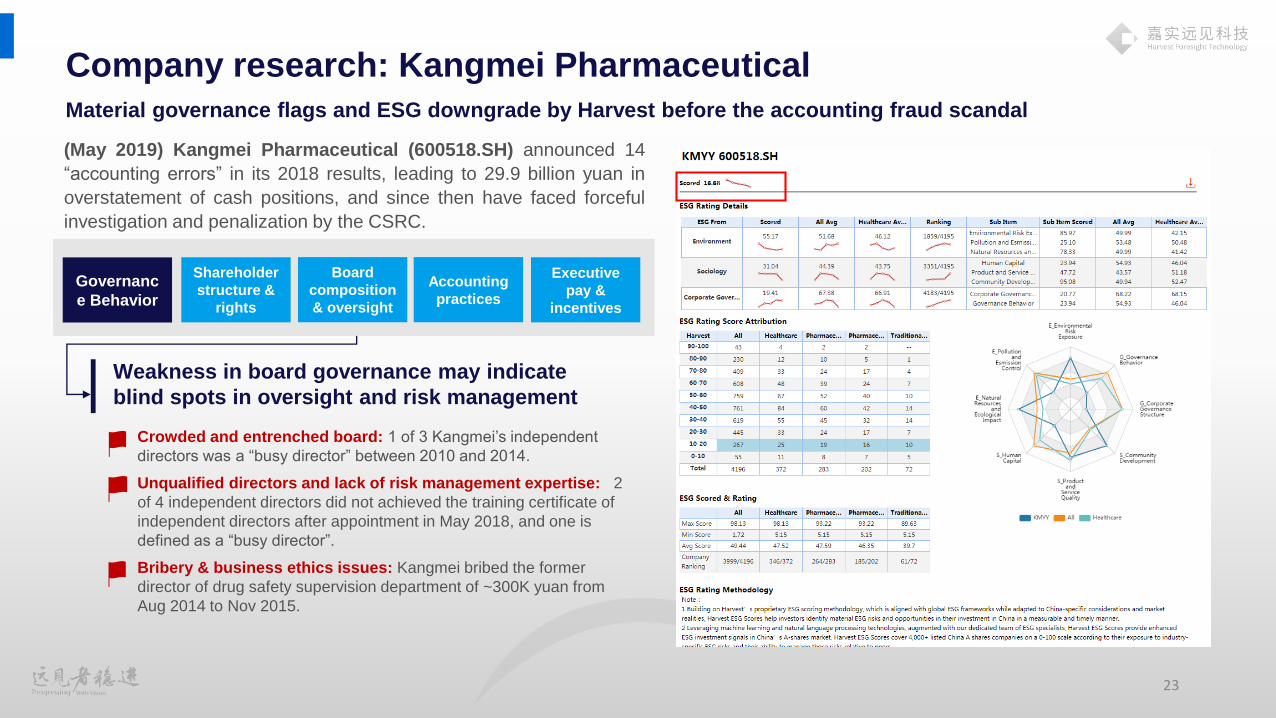
Company research: Kangmei PharmaceuticalMaterial governance flags and ESG downgrade by Harvest before the accounting fraud scandal
Crowded and entrenched board: 1 of 3 Kangmei’s independent
directors was a “busy director” between 2010 and 2014.
Unqualified directors and lack of risk management expertise: 2
of 4 independent directors did not achieved the training certificate of
independent directors after appointment in May 2018, and one is
defined as a “busy director”.
Bribery & business ethics issues: Kangmei bribed the former
director of drug safety supervision department of ~300K yuan from
Aug 2014 to Nov 2015.
(May 2019) Kangmei Pharmaceutical (600518.SH) announced 14
“accounting errors” in its 2018 results, leading to 29.9 billion yuan in
overstatement of cash positions, and since then have faced forceful
investigation and penalization by the CSRC.
Weakness in board governance may indicate
blind spots in oversight and risk management
Board
composition
& oversight
Accounting
practices
Governanc
e Behavior
Shareholder
structure &
rights
Executive
pay &
incentives
24
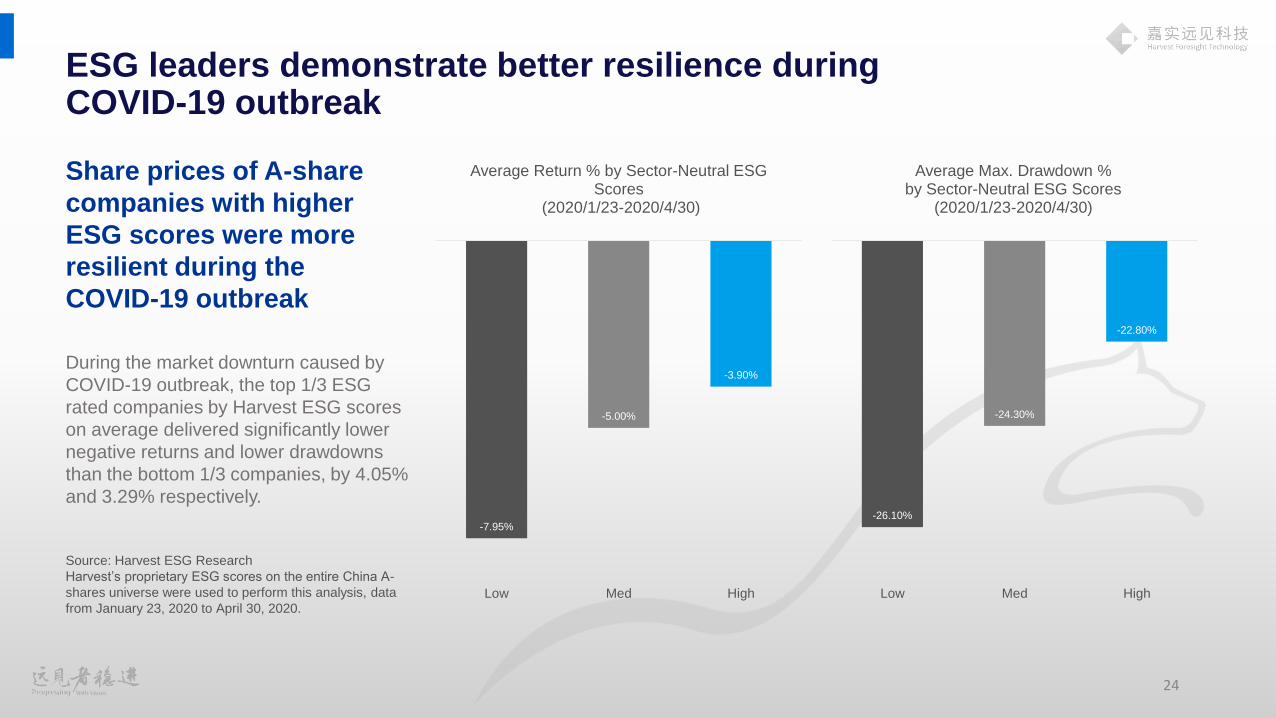
ESG leaders demonstrate better resilience during COVID-19 outbreak
-26.10%
-24.30%
-22.80%
Low Med High
Average Max. Drawdown % by Sector-Neutral ESG Scores
(2020/1/23-2020/4/30)
-7.95%
-5.00%
-3.90%
Low Med High
Average Return % by Sector-Neutral ESG Scores
(2020/1/23-2020/4/30)
During the market downturn caused by
COVID-19 outbreak, the top 1/3 ESG
rated companies by Harvest ESG scores
on average delivered significantly lower
negative returns and lower drawdowns
than the bottom 1/3 companies, by 4.05%
and 3.29% respectively.
Share prices of A-share
companies with higher
ESG scores were more
resilient during the
COVID-19 outbreak
Source: Harvest ESG Research
Harvest’s proprietary ESG scores on the entire China A-
shares universe were used to perform this analysis, data
from January 23, 2020 to April 30, 2020.
25
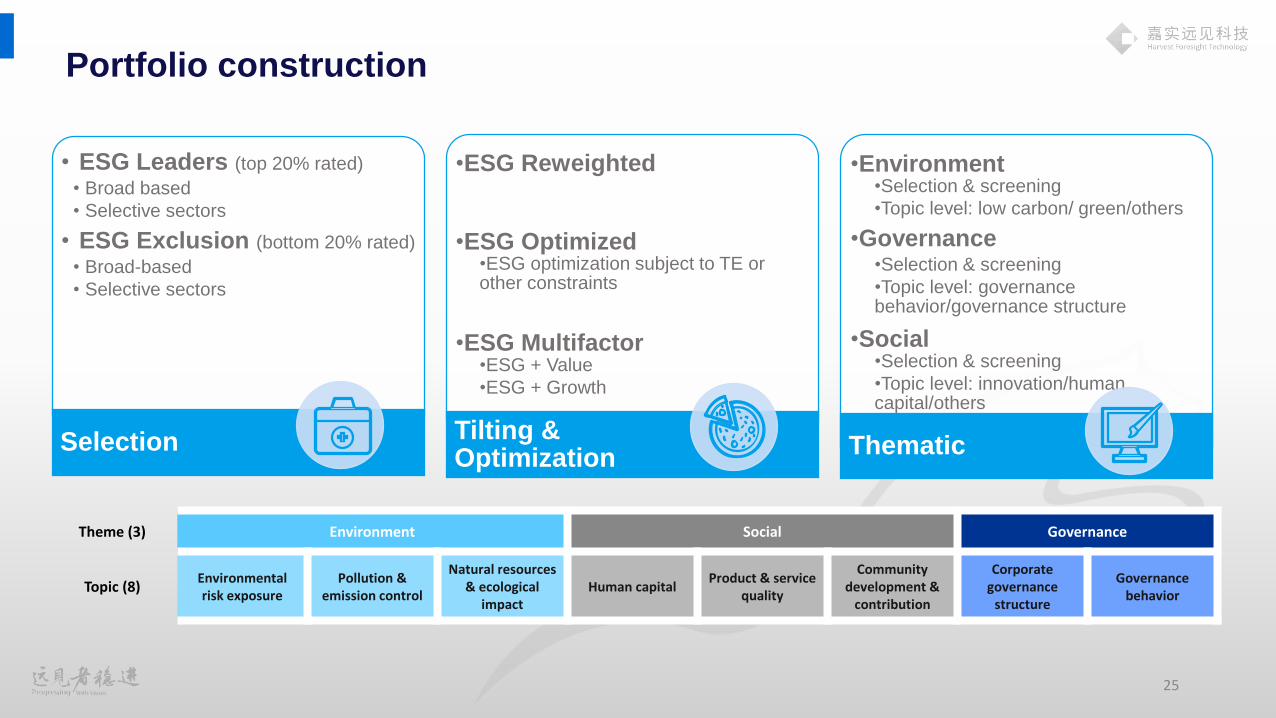
Portfolio construction
• ESG Leaders (top 20% rated)
• Broad based
• Selective sectors
• ESG Exclusion (bottom 20% rated)
• Broad-based
• Selective sectors
Selection
•ESG Reweighted
•ESG Optimized•ESG optimization subject to TE or other constraints
•ESG Multifactor•ESG + Value
•ESG + Growth
Tilting & Optimization
•Environment•Selection & screening
•Topic level: low carbon/ green/others
•Governance•Selection & screening
•Topic level: governance behavior/governance structure
•Social•Selection & screening
•Topic level: innovation/human capital/others
Thematic
Theme (3) Environment Social Governance
Topic (8)Environmental risk exposure
Pollution & emission control
Natural resources & ecological
impactHuman capital
Product & service quality
Community development &
contribution
Corporate governance
structure
Governancebehavior
Seeking sustainable alpha in China leveraging Harvest ESG Scores
27
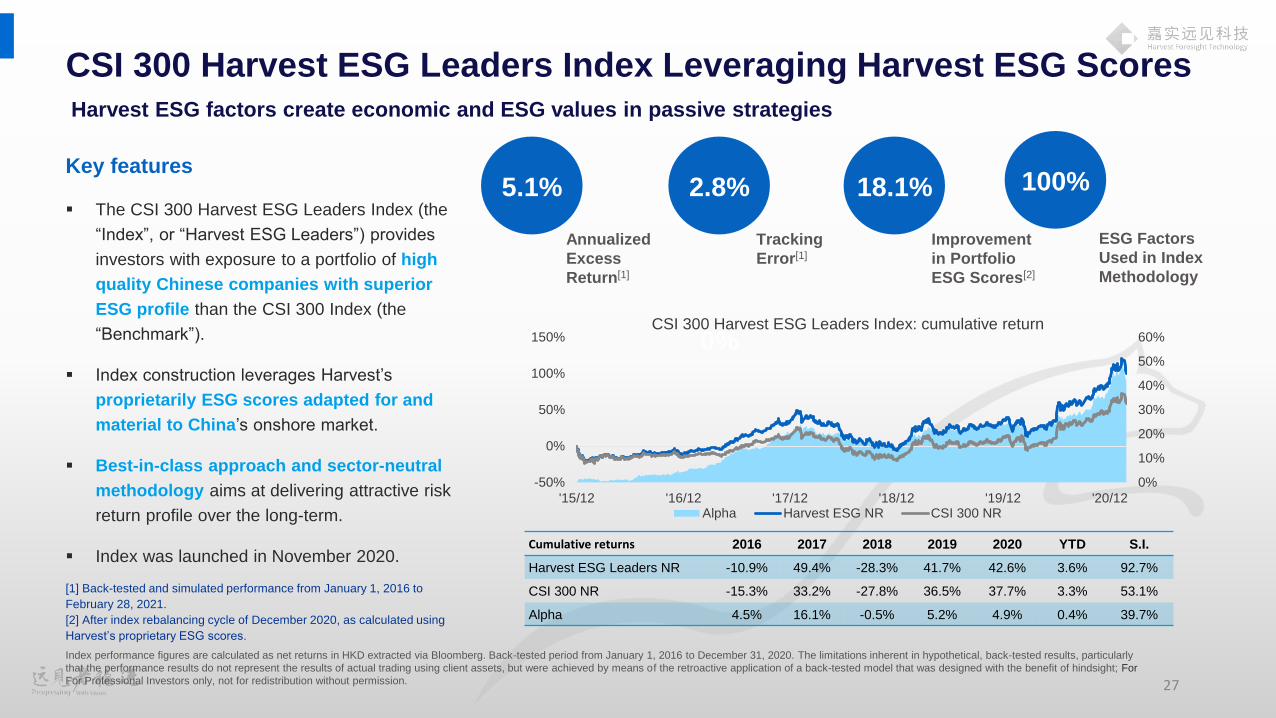
5.1% 2.8% 100%
0%
Annualized
Excess
Return[1]
Tracking
Error[1]
ESG Factors
Used in Index
Methodology
18.1%
Improvement
in Portfolio
ESG Scores[2]
0%
10%
20%
30%
40%
50%
60%
-50%
0%
50%
100%
150%
'15/12 '16/12 '17/12 '18/12 '19/12 '20/12
CSI 300 Harvest ESG Leaders Index: cumulative return
Alpha Harvest ESG NR CSI 300 NR
Key features
The CSI 300 Harvest ESG Leaders Index (the
“Index”, or “Harvest ESG Leaders”) provides
investors with exposure to a portfolio of high
quality Chinese companies with superior
ESG profile than the CSI 300 Index (the
“Benchmark”).
Index construction leverages Harvest’s
proprietarily ESG scores adapted for and
material to China’s onshore market.
Best-in-class approach and sector-neutral
methodology aims at delivering attractive risk
return profile over the long-term.
Index was launched in November 2020.
CSI 300 Harvest ESG Leaders Index Leveraging Harvest ESG Scores
[1] Back-tested and simulated performance from January 1, 2016 to
February 28, 2021.
[2] After index rebalancing cycle of December 2020, as calculated using
Harvest’s proprietary ESG scores.
Index performance figures are calculated as net returns in HKD extracted via Bloomberg. Back-tested period from January 1, 2016 to December 31, 2020. The limitations inherent in hypothetical, back-tested results, particularly
that the performance results do not represent the results of actual trading using client assets, but were achieved by means of the retroactive application of a back-tested model that was designed with the benefit of hindsight; For
For Professional Investors only, not for redistribution without permission.
Cumulative returns 2016 2017 2018 2019 2020 YTD S.I.
Harvest ESG Leaders NR -10.9% 49.4% -28.3% 41.7% 42.6% 3.6% 92.7%
CSI 300 NR -15.3% 33.2% -27.8% 36.5% 37.7% 3.3% 53.1%
Alpha 4.5% 16.1% -0.5% 5.2% 4.9% 0.4% 39.7%
Harvest ESG factors create economic and ESG values in passive strategies
28
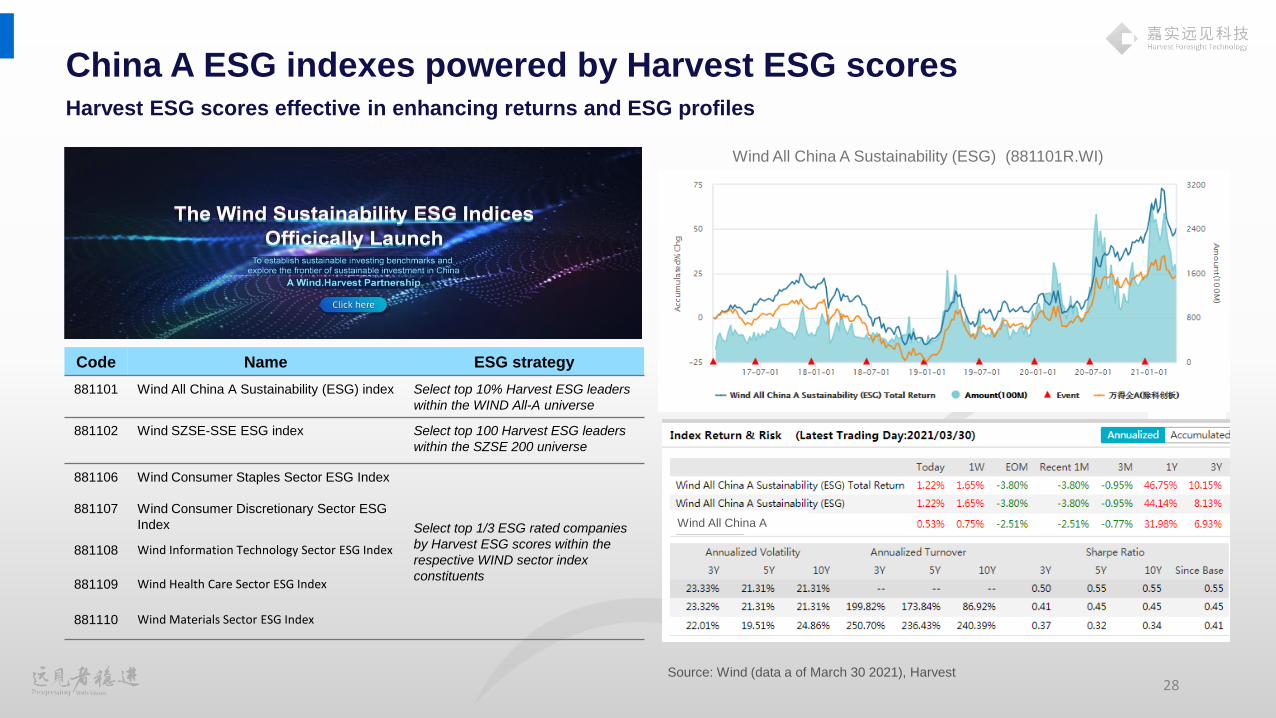
China A ESG indexes powered by Harvest ESG scores
Code Name ESG strategy
881101 Wind All China A Sustainability (ESG) index Select top 10% Harvest ESG leaders
within the WIND All-A universe
881102 Wind SZSE-SSE ESG index Select top 100 Harvest ESG leaders
within the SZSE 200 universe
881106 Wind Consumer Staples Sector ESG Index
Select top 1/3 ESG rated companies
by Harvest ESG scores within the
respective WIND sector index
constituents
881107 Wind Consumer Discretionary Sector ESG
Index
881108 Wind Information Technology Sector ESG Index
881109 Wind Health Care Sector ESG Index
881110 Wind Materials Sector ESG Index
Wind All China A Sustainability (ESG) (881101R.WI)
Harvest ESG scores effective in enhancing returns and ESG profiles
Wind All China A
Source: Wind (data a of March 30 2021), Harvest
29
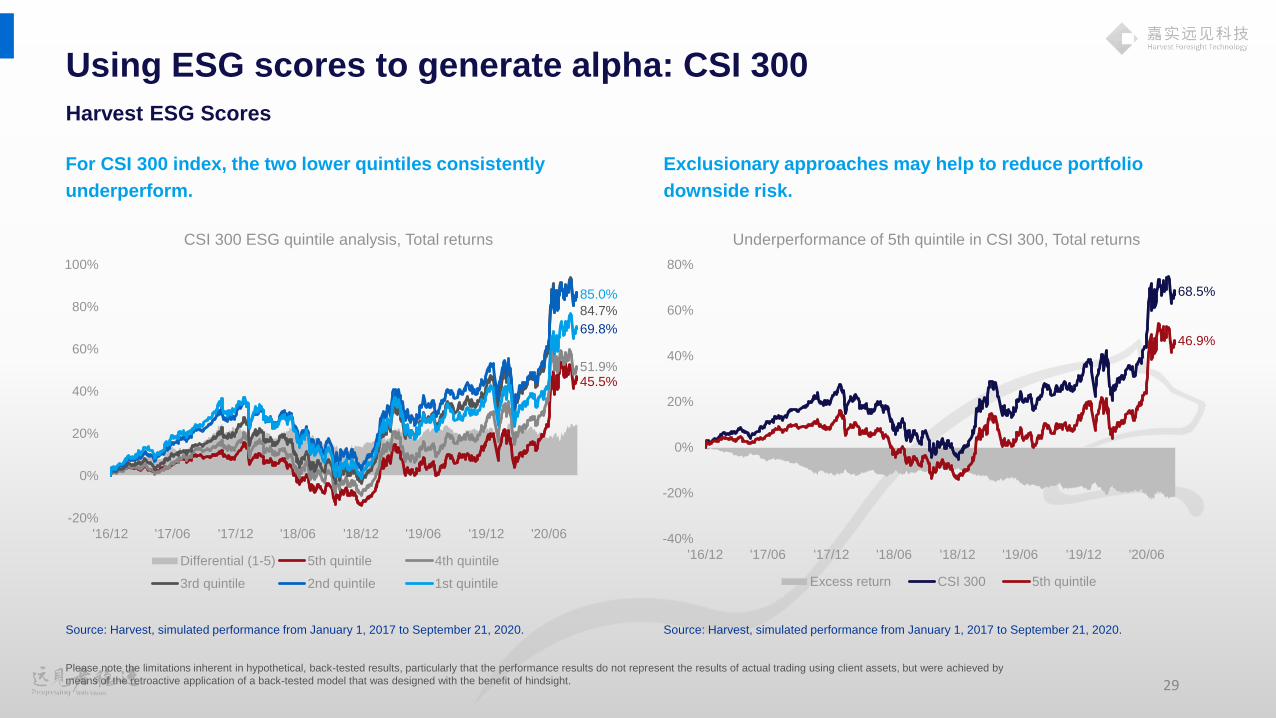
Using ESG scores to generate alpha: CSI 300
Harvest ESG Scores
Source: Harvest, simulated performance from January 1, 2017 to September 21, 2020.
Please note the limitations inherent in hypothetical, back-tested results, particularly that the performance results do not represent the results of actual trading using client assets, but were achieved by
means of the retroactive application of a back-tested model that was designed with the benefit of hindsight.
For CSI 300 index, the two lower quintiles consistently
underperform.
Exclusionary approaches may help to reduce portfolio
downside risk.
Source: Harvest, simulated performance from January 1, 2017 to September 21, 2020.
45.5%51.9%
84.7%
85.0%
69.8%
-20%
0%
20%
40%
60%
80%
100%
'16/12 '17/06 '17/12 '18/06 '18/12 '19/06 '19/12 '20/06
CSI 300 ESG quintile analysis, Total returns
Differential (1-5) 5th quintile 4th quintile
3rd quintile 2nd quintile 1st quintile
68.5%
46.9%
-40%
-20%
0%
20%
40%
60%
80%
'16/12 '17/06 '17/12 '18/06 '18/12 '19/06 '19/12 '20/06
Underperformance of 5th quintile in CSI 300, Total returns
Excess return CSI 300 5th quintile
30
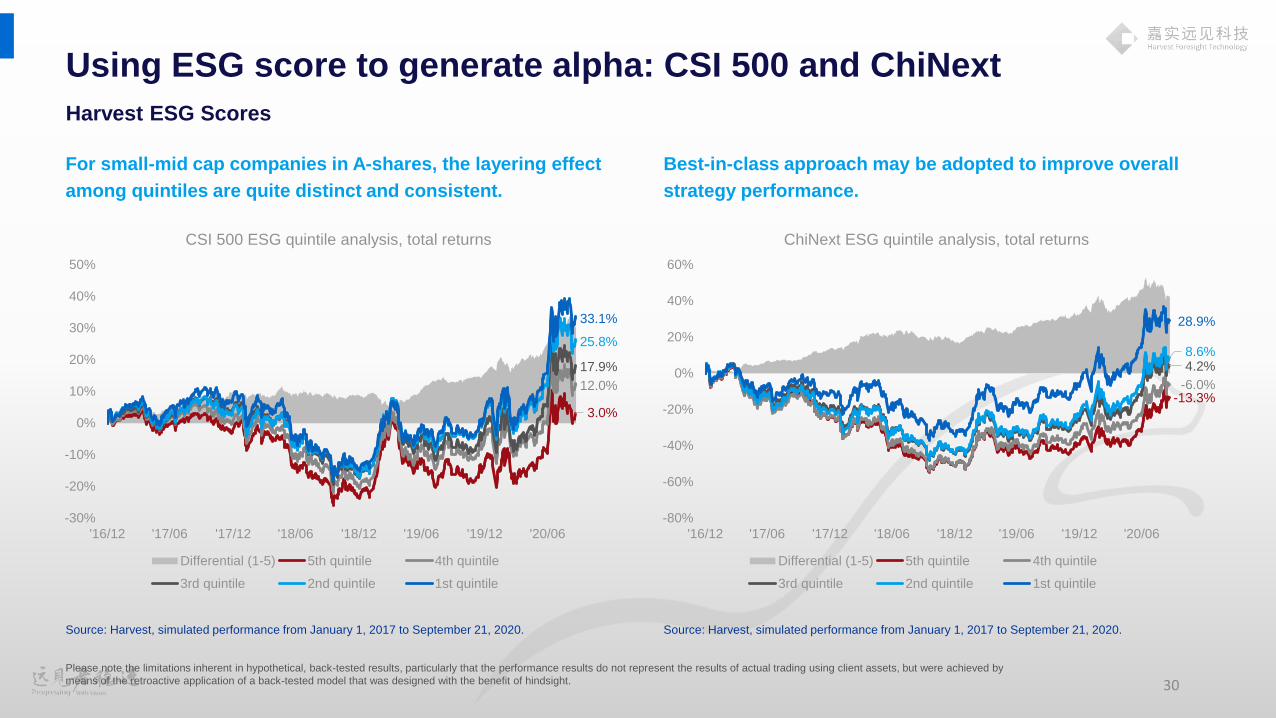
3.0%
12.0%
17.9%
25.8%
33.1%
-30%
-20%
-10%
0%
10%
20%
30%
40%
50%
'16/12 '17/06 '17/12 '18/06 '18/12 '19/06 '19/12 '20/06
CSI 500 ESG quintile analysis, total returns
Differential (1-5) 5th quintile 4th quintile
3rd quintile 2nd quintile 1st quintile
Using ESG score to generate alpha: CSI 500 and ChiNext
Harvest ESG Scores
Source: Harvest, simulated performance from January 1, 2017 to September 21, 2020.
Please note the limitations inherent in hypothetical, back-tested results, particularly that the performance results do not represent the results of actual trading using client assets, but were achieved by
means of the retroactive application of a back-tested model that was designed with the benefit of hindsight.
For small-mid cap companies in A-shares, the layering effect
among quintiles are quite distinct and consistent.
-13.3%-6.0%
4.2%8.6%
28.9%
-80%
-60%
-40%
-20%
0%
20%
40%
60%
'16/12 '17/06 '17/12 '18/06 '18/12 '19/06 '19/12 '20/06
ChiNext ESG quintile analysis, total returns
Differential (1-5) 5th quintile 4th quintile
3rd quintile 2nd quintile 1st quintile
Best-in-class approach may be adopted to improve overall
strategy performance.
Source: Harvest, simulated performance from January 1, 2017 to September 21, 2020.
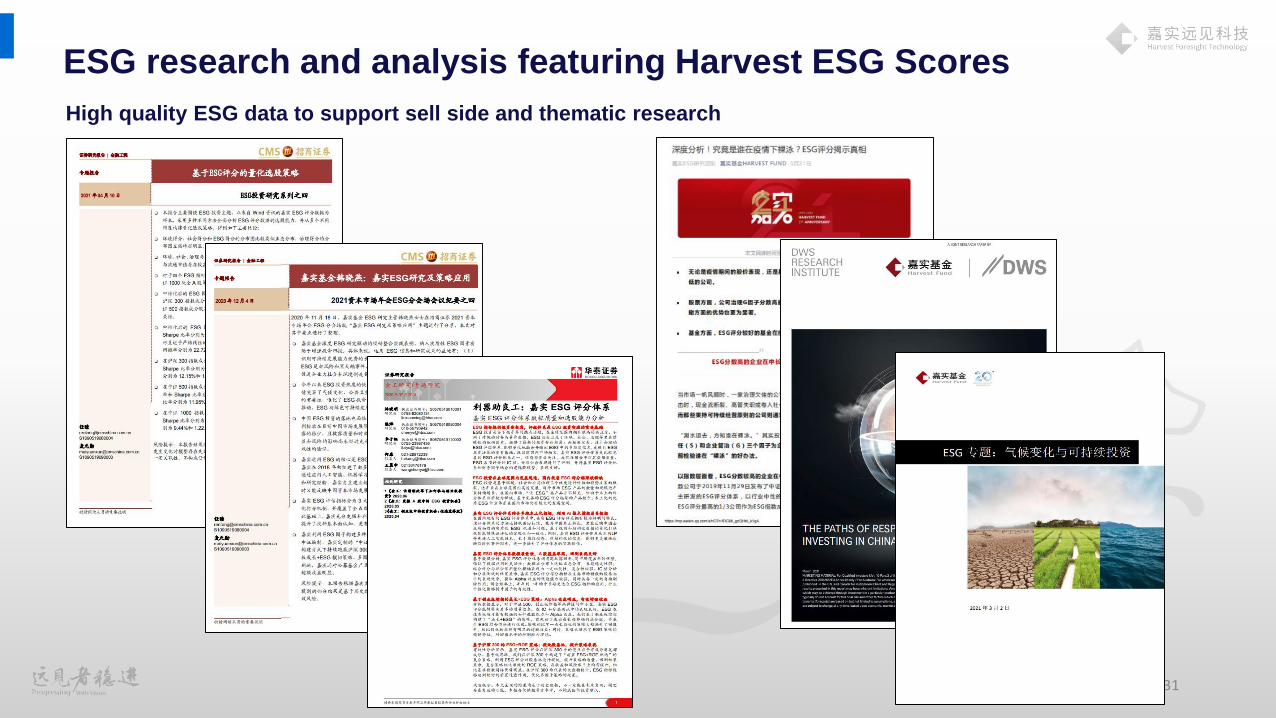
ESG research and analysis featuring Harvest ESG Scores
31
High quality ESG data to support sell side and thematic research
Appendix
33
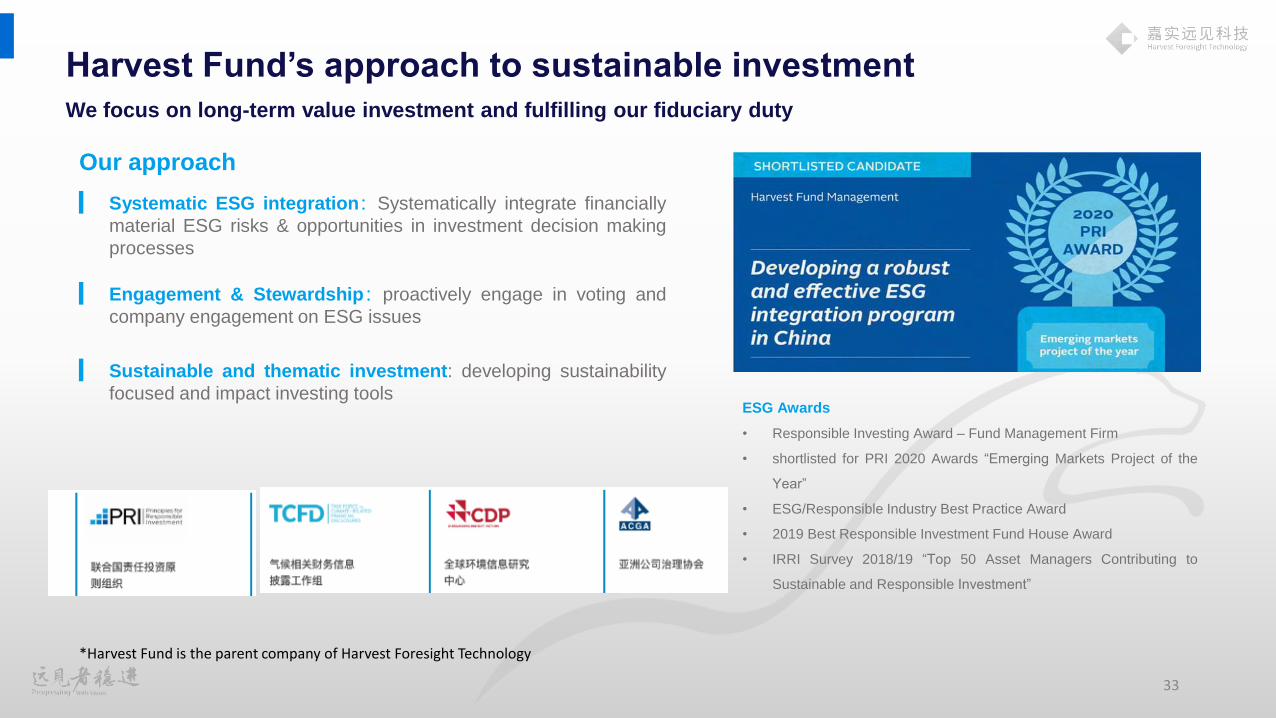
Harvest Fund’s approach to sustainable investmentWe focus on long-term value investment and fulfilling our fiduciary duty
ESG Awards
• Responsible Investing Award – Fund Management Firm
• shortlisted for PRI 2020 Awards “Emerging Markets Project of the
Year”
• ESG/Responsible Industry Best Practice Award
• 2019 Best Responsible Investment Fund House Award
• IRRI Survey 2018/19 “Top 50 Asset Managers Contributing to
Sustainable and Responsible Investment”
Our approach
▍ Systematic ESG integration:Systematically integrate financially
material ESG risks & opportunities in investment decision making
processes
▍ Engagement & Stewardship:proactively engage in voting and
company engagement on ESG issues
▍ Sustainable and thematic investment: developing sustainability
focused and impact investing tools
*Harvest Fund is the parent company of Harvest Foresight Technology
Disclaimer
34
This document is the property and copyright of Harvest Foresight Technology (Beijing) Co., Ltd., and its parent company Harvest Fund Management Co., Ltd
(“HFM”) and its affiliates. It is prepared for specific persons only and for informational purposes only. Any person, including the specific persons are prohibited
to modify, reverse-engineer, reproduce, redistribute or publicly disclose the information in this document in whole or in part to any 3rd parties without written
consent of Harvest Foresight Technology (Beijing) Co., Ltd., or its parent company HFM or affiliates. All rights reserved.
This document shall not be construed as the making of any offer or invitation to anyone in any jurisdiction in which such offer or invitation is not authorized or
unlawful. None of the information contained here constitutes an offer to sell (or a solicitation of an offer to buy), any security, financial product or other
investment vehicle or any trading strategy, and is not the basis for any contract to deal in any security or instrument, or for Harvest Foresight
Technology (Beijing) Co., Ltd., its parent company HFM, or affiliates to enter into or arrange any type of transaction as a consequence of any information
contained here.
The information contained in the document may not be used to create derivative works or to verify or correct other data or information. For example (but
without limitation), the information may not be used to create indexes, databases, risk models, analytics, software, or in connection with the issuing, offering,
sponsoring, managing or marketing of any securities, portfolios, financial products or other investment vehicles.
Although the information provided by third party was compiled from sources believed to be reliable, no liability for any error or omissions is acceptable by
Harvest Foresight Technology (Beijing) Co., Ltd. or approved distributors, or its parent company HFM, affiliates or any of its directors or employees. The
information and opinions contained herein is for general reference only and may change without notice, and should not be relied upon for any investment
decision.
Information containing any historical information, data or analysis should not be taken as an indication or guarantee of any future performance, analysis,
forecast or prediction. Past performance does not guarantee future results.


