Introducing greenhouse gas mitigation as a development ...€¦ · 1 Introducing greenhouse gas...
32
1 Introducing greenhouse gas mitigation as a development objective in rice-based agriculture: I. Generation of Technical Coefficients H. Pathak 1,2,* and R. Wassmann 2 1 Unit of Simulation and Informatics, Indian Agricultural Research Institute, New Delhi, India 2 Institute for Meteorology and Climate Research (IMK-IFU), Forschungszentrum Karlsruhe, Garmisch-Partenkirchen, Germany Abstract This study assesses land-use and residue utilization options for mitigating emission of greenhouse gases (GHG) from the agricultural sector. The overall objective was to develop a decision support system to explore mitigation options by computing GHG emissions alongside with economic returns for rice-based cropping systems. This tool, named TCMGAS (Technical Coefficient Generator for Mitigation Technologies of Greenhouse Gas Emissions from Agricultural Sectors), integrates analytical and expert knowledge with regional databases on bio-physical, agronomic and socio-economic features to establish input-output relationships (‘Technical Coefficients’) related to GHG emissions in agriculture. The approach included emissions of methane (CH 4 ) from rice fields, rice straw burning and cattle; carbon dioxide (CO 2 ) from fossil fuel and soil organic carbon decline as well as nitrous oxide (N 2 O) from soil, rice straw burning and fertilizer use. Technical coefficients were generated for an entire rice-wheat cropping cycle in the state of Haryana in northern India as a case study. Twenty technologies of rice production, which can be adopted by farmers, were analysed for their global warming potential (GWP) and economic return. The technologies differed in terms of water regime, residue management/utilization, soil management and additives, which represented different mitigation options for GHG emissions. With the current farmers’ practice in various districts in Haryana, soil-borne emissions were the major source of GHG contributing 48% of the average GWP (3,136 kg CO 2 equivalent ha −1 ) in rice * Corresponding author: E-mail address: [email protected] Paper presented at First Asia-Europe Workshop on Sustainable Resource Management and Policy Options for Rice Ecosystems (SUMAPOL 2005), 11-14 May 2005, Hangzhou, Zhejiang Province, P.R. China
Transcript of Introducing greenhouse gas mitigation as a development ...€¦ · 1 Introducing greenhouse gas...

1
Introducing greenhouse gas mitigation as a development objective in rice-based agriculture: I. Generation of Technical Coefficients H. Pathak1,2,* and R. Wassmann2 1 Unit of Simulation and Informatics, Indian Agricultural Research Institute, New Delhi,
India 2 Institute for Meteorology and Climate Research (IMK-IFU), Forschungszentrum
Karlsruhe, Garmisch-Partenkirchen, Germany Abstract This study assesses land-use and residue utilization options for mitigating emission of greenhouse gases (GHG) from the agricultural sector. The overall objective was to develop a decision support system to explore mitigation options by computing GHG emissions alongside with economic returns for rice-based cropping systems. This tool, named TCMGAS (Technical Coefficient Generator for Mitigation Technologies of Greenhouse Gas Emissions from Agricultural Sectors), integrates analytical and expert knowledge with regional databases on bio-physical, agronomic and socio-economic features to establish input-output relationships (‘Technical Coefficients’) related to GHG emissions in agriculture. The approach included emissions of methane (CH4) from rice fields, rice straw burning and cattle; carbon dioxide (CO2) from fossil fuel and soil organic carbon decline as well as nitrous oxide (N2O) from soil, rice straw burning and fertilizer use. Technical coefficients were generated for an entire rice-wheat cropping cycle in the state of Haryana in northern India as a case study. Twenty technologies of rice production, which can be adopted by farmers, were analysed for their global warming potential (GWP) and economic return. The technologies differed in terms of water regime, residue management/utilization, soil management and additives, which represented different mitigation options for GHG emissions. With the current farmers’ practice in various districts in Haryana, soil-borne emissions were the major source of GHG contributing 48% of the average GWP (3,136 kg CO2 equivalent ha−1) in rice
* Corresponding author: E-mail address: [email protected] Paper presented at First Asia-Europe Workshop on Sustainable Resource Management and Policy Options for Rice Ecosystems (SUMAPOL 2005), 11-14 May 2005, Hangzhou, Zhejiang Province, P.R. China

2
followed by indirect sources, i.e., production of farm inputs and farm operations (25% of the GWP). Burning of rice straw, animal and inorganic fertilizer contributed 13, 12 and 2% of the GWP, respectively. Emissions from wheat were relatively low (1,369 kg CO2 equivalent ha−1) as there was no CH4 emission and wheat straw is not burnt. Different mitigation technologies had pronounced effects on the GWP of the rice crop and varied between 1,715 kg CO2 equivalent ha−1 with continuous flooding, urea and rice straw used for building materials and 10,020 kg CO2 equivalent ha−1 with continuous flooding, and application of nutrients through organic manure. Compared to current farmers’ practice 13 technologies have the potential to reduce the GWP by 8 to 51%, but they also reduce the net income of farmers. Upscaling of the estimates to the entire state of Haryana showed that the GWP with the current farmers’ practice in rice is 2617 Gg CO2 equivalent. Modification of water management from continuous flooding to alternate flooding or application of urea alone instead of urea plus FYM will reduce the GWP by 15 and 29%, respectively, while feeding of rice straw to animals and supplying N through urea will reduce it by 41% compared the current practice of burning rice straw and use of FYM. The study showed that the TCMGAS tool could be used for estimating GHG emission from various land-use types and for identifying mitigation options. A detailed cost/benefit analysis is supplied in Vol. II of the paper. Keywords: Carbon dioxide; Land-use planning; Methane; Nitrous oxide; Rice-wheat
systems; Systems analysis 1. Introduction There is scientific consensus that global warming poses one of the major environmental challenges in the future. While the bulk of the so-called greenhouse gases (GHG) originate from fossil fuel consumption, the agricultural sector collectively contributes approximately 20% of the GHG emissions, e.g. carbon dioxide (CO2) through decline in soil organic carbon, methane (CH4) from flooded rice fields and cattle, and nitrous oxide (N2O) through fertilizer application (Watson et al., 1996). Using general circulation models, it has been predicted that a doubling of the current CO2 level in the atmosphere will cause an increase of 1.5 to 4.0 °C in average global surface air temperature, with accompanying changes in rainfall pattern by the end of the 21st century (Adams et al., 1995). In a recent study IPCC (2000) has projected a mean warming of about 3.1 °C till the 2050s and about 4.6 °C till the 2080s in Asia as a consequence of increase in concentration of GHGs in the atmosphere. Mean temperature in South Asia is

3
projected to increase by 0.1 to 0.3 °C in kharif (June to October) and 0.3 to 0.7 °C during rabi (November to April) by 2010 and by 0.4 to 2.0 °C during kharif and by 1.1 to 4.5 °C in rabi by 2070 (IPCC, 2000). As yields in some of the most productive regions of the world are approaching a plateau or even are declining (Ladha et al., 2003; Pathak et al., 2003), the likely effect of climate change on crop production adds to the already complex problem of food security. On the one hand, an increase in the CO2 level in the atmosphere would increase crop yield mainly by stimulating photosynthetic processes and improving water use efficiency (Matthews et al., 1995). On the other hand, the effect of increased temperature would largely be negative for rice production because of increased respiration and a shortened vegetative and grain-filling period (Horie et al., 1995; Peng et al., 2004). At the same time, intensity and patterns of land-use are undergoing drastic changes in developing countries – often leading to substantial degradation of the natural resource base and thus, threatening the regional food security. Rice-based production systems in Asia (including rice-wheat rotation as the most important cropping system of the world) are characterized by increasing conflicts in economic, social, ecological and production-related land use objectives (Aggarwal et al., 2001). The interest of farmers to achieve maximum profit from the (often poor) land resources generally collides with the increasing water demand from the industrial/urban sector. Moreover, policy targets are generally biased towards national self-sufficiency in rice production at the expense of locally marketed cash crops. Identification and analysis of production systems with high resource use efficiency would be the key for resolving such conflicts (Roetter et al., 2000). New tools for land use analysis and planning, therefore, are needed to reconcile the legitimate aims of (i) enhancing food production with (ii) environmental concerns on soil, water and air quality. The objectives of the present study were to (i) develop and evaluate a technical coefficient generator (TCG) using inventory of natural and other production resources for GHG emission, (ii) evaluate the global warming potential (GWP) of various land-use types, and (iii) explore future land-use options to mitigate GHG emission using the TCG. The usefulness of the TCG has been illustrated for the state of Haryana in northern India, which has contributed tremendously to the success of the Green Revolution in India.

4
2. Materials and methods 2.1. TCMGAS, the tool and the concept The TCMGAS (Technical Coefficient Generator for Mitigation Technologies of Greenhouse Gas Emissions from Agricultural Sectors), allows integration of different types of information on crop production and quantification of inputs and outputs in current and prospective cropping systems. In TCMGAS inputs and outputs are calculated for different crops, land units and production techniques (Van Ittersum and Rabbinge, 1997). The inputs and outputs are calculated on a seasonal basis. Emission of GHGs in different crops is the main focus of TCMGAS. Besides economic products and crop residues, soil nutrient emissions (leaching, volatilization and denitrification) and a biocide index are calculated. However, the present paper focuses only on GHG emission. One important objective of the study was to develop a technical coefficient generator (TCG) to explore future land-use options to mitigate GHG emission. The term technical coefficient (TC) refers to the inputs and outputs of land-use systems in economic and physical terms as quantified by this type of tool (Bouman et al., 1998; 1999; Ponsioen et al., 2005). In TCMGAS, TCGs are specifically developed to quantify differences in resource use of conventional and future land-use options aimed at mitigating GHG emission. The TCMGAS quantifies the relationships of inputs and outputs based on interpretation of survey, experimental data, published literature, required objectives and yield levels (Hengsdijk and Van Ittersum, 2002). Key in calculating TCs in TCMGAS is the target-oriented approach implying that first a target output (i.e., yield) level is determined, based on the biophysical conditions and the objectives for future crop production in the area under study. Subsequently, the optimal combination of inputs required to realise this target yield is calculated. This target-oriented approach enables to quantify the minimum required amount of various inputs such as labour, water, and fertilizer for a well-defined output such as GHG emission. In TCMGAS target yields are set equal to yields under current practices by the farmers. 2.2. Structure, data requirement and production techniques in TCMGAS The TCMGAS is programmed in Microsoft Excel and contains different types of data sets, organized into different worksheets for crops, land units, prices and technologies. The main sheet uses these data as inputs and calculates the outputs. A simplified schematic representation of the structure of the TCMGAS is shown in Fig. 1.

5
Data requirement of the TCMGAS are listed in Table 1. From these input data the model calculates the use of fertilizer, irrigation, biocides, human labour, machines, draft animals and seeds and various outputs such as GHG emission and the corresponding economic costs for a target yield using simple relationships. These input data sets require Fig. 1. Schematic diagram of the structure of the TCMGAS (Technical Coefficient Generator for Mitigation Technologies of Greenhouse Gas Emissions from Agricultural Sectors) model. Table 1. Data requirements per data sheet in the TCMGAS (Technical Coefficient Generator for Mitigation Technologies of Greenhouse Gas Emissions from Agricultural Sectors) model. Data sheet Data requirements Land units Soil organic carbon (%), Olsen P (kg ha−1), exchangeable K (kg ha−1), clay
content (%), EC (dS m−1), pH, water holding capacity (fraction), soil depth (cm), seasonal rainfall (mm), potential evapo-transpiration (cm), agricultural area of the land unit (ha)
Crops Harvest index, N, P and K requirements (kg Mg−1 grain yield), seed rate (kg ha−1), machinery use (tractor hour), draft animal use (bullock day), labour requirement (man day), crop duration, irrigation efficiency, and N, P and K use efficiencies.
Prices Prices in (any currency) for N, P, K and Zn fertilizer (kg), human labour (day), tractor (hour), FYM (kg), irrigation (mm), phosphogypsum (kg), nitrification inhibitor (kg), biogas slurry (kg), urea super granule (kg), seed of crops and green manure crops (kg), fixed cost, machine cost for rent (hour), residue (kg), biocide (kg), procurement process of economic product (kg)
Technology Relative yield, irrigation efficiency, nutrient use efficiency, manure use, machine and human labour use, emission of methane, nitrous oxide and carbon dioxide, additional investment and saving
Note: Information regarding the GHG mitigation technologies such as phosphogypsum, nitrification inhibitor, biogas slurry, urea super granule, and green manure crops are optional depending upon the interest of the user.
Databases:
• Land-use types
• Crops
• Technologies
• Prices
Main file:
• Calculations for land-use types, crops, technologies and prices
• Output analysis
Technical coefficients:
• Yields
• Fertilizer, irrigation, biocide, labour, machine and animal use
• GHG emission
• Cost and income

6
information from typical farmers reflecting the current practice and various GHG mitigation techniques in the same study area or in similar circumstances. By using relative factors in the technology sheet (Table 1), the TCs can be easily modified for another technology and associated outputs. Generated TCs are stored in the main file and can be exported to separate files, to be used for further analysis. 2.3. Technologies As the goal of our study was to explore the options for mitigating GHG emission under sustained production levels, twenty technologies, which can be adopted by the farmers, were analysed for GHG emission and their global warming potential (GWP). The technologies differed in terms of water regime, residue management/utilization, soil management and additives, which represented different mitigation options for GHG emissions. The differences in the technologies were achieved in the model using different coefficients for yield, N use efficiency, human and machine labour use, organic manure use, irrigation use and coefficients of CO2, CH4 and N2O emissions (Table 2). 2.4. Calculations A simplified scheme of various calculations, the inputs used, driving variables and resultant outputs in the TCMGAS is shown in Fig. 2. The sources of information/data used for obtaining various equations and coefficients are given in Table 3. 2.4.1. Nutrient supply from soil The following relationship was used to calculate N supplying capacity of soil (kg N ha−1). Soil_N_supply = SOC*1000*60*BD*0.000085/10*0.6*crop duration Where, SOC is soil organic C (%), 1000 and 60 are the coefficients used to calculate the weight of soil up to 60 cm depth, BD is soil bulk density (Mg m−3), 10 is the C:N of soil organic matter, 0.6 is the efficiency of mineralized N and 0.000085 is the rate of decomposition of SOC per day (Seligman and Van Keulen, 1981). Bulk density (Mg m−3) of soil was calculated using the formula give by Manrique and Jones (1991): Bulk_density = 1.51 − 0.113*SOC The following relationships were used to calculate soil P and K supplies (kg ha−1) (Pathak et al., 2003).

7
Table 2. Indices used for adjusting yields, N use efficiency, human and machine labour used, greenhouse gas emissions and irrigation use efficiency in various technologies. Technologya Yield N use Manure Machine
labour Human labour
Methane Nitrous oxide
Irrigation use
cf_ur_an 1.00 1.00 0.00 1.05 1.05 1.00 1.00 0.40 md_fp_bu 1.00 0.95 0.20 1.05 1.10 0.70 1.10 0.55 af_fp_bu 0.95 0.95 0.00 1.05 1.15 0.50 1.20 1.00 cf_mi_bu 1.10 1.05 0.50 1.10 1.10 1.00 0.90 0.40 cf_or_an 0.90 0.90 1.00 1.25 1.20 1.00 0.85 0.40 af_mi_bu 1.00 1.00 0.50 1.10 1.15 0.50 1.20 1.00 cf_bg_bu 1.10 1.05 0.50 1.20 1.10 0.80 0.90 0.40 cf_ur_bu_Pho 1.00 1.00 0.00 1.00 1.00 0.70 1.00 0.40 cf_ur_bu_Nit 1.10 1.20 0.00 1.00 1.00 0.80 0.80 0.40 cf_ur_bu_Tab 1.20 1.20 0.00 1.00 1.05 1.00 0.80 0.40 cf_fp_bu_Hu 1.00 1.00 0.00 1.05 1.05 1.00 1.00 0.40 cf_fp_bu_Dir 1.00 1.00 0.00 0.90 0.90 0.90 1.00 0.40 cf_mi_bu_Cul 1.10 1.05 0.00 1.10 1.10 0.25 1.00 0.40 cf_ur_in_Up 1.00 1.00 0.50 1.05 1.05 1.00 1.00 0.40 cf_ur_sq 1.00 1.00 0.00 1.10 1.10 1.00 1.10 0.40 cf_ur_in_Ri 0.90 0.90 1.00 1.10 1.10 0.70 1.10 0.40 cf_ur_bu 1.00 1.00 0.00 1.00 1.00 1.00 1.00 0.40 cf_ur_bu_Sp 1.20 1.10 0.00 1.10 1.10 1.00 1.00 0.40 cf_gm_bu 1.10 1.05 0.50 1.20 1.10 1.00 1.00 0.40 cf_fp_bu 1.00 1.00 0.20 1.05 1.05 1.00 1.00 0.40 a 1st identifier (irrigation): cf = continuous flooding; md = midseason drainage; af = alternate
flooding; 2nd identifier (N supply): ur = urea; fm = farmers’ practice; mi = mixed use of urea and FYM;
or = entirely organic; bg = biogas slurry; gm = green manure; 3rd identifier (straw management): an = rice straw fed to animal; bu = rice straw burnt; in =
incorporated; sq = rice straw used for construction material; 4th identifier (miscellaneous): Pho = phosphogypsum; Nit = nitrification inhibitor; Tab = urea
tablets; Hu = rice husk burnt for fuel; Dir = direct wet seeding; Cul = new cultivar; Wh = rice straw incorporated in wheat crop (no CH4 source); Ri = rice straw incorporated in rice (CH4 source); Sp = site-specific nutrient management.

8
Fig. 2. Schematic overview of the inputs, driving variables and outputs in the TCMGAS. Soil_P_supply = 1.81 + 0.83*Olsen_P − 0.01* (Olsen_P)2 Soil_K_supply = 2.73 + 0.93*Ex_K − 0.0014*(Ex_K)2 Where, Olsen P (kg ha−1) and Ex-K (kg ha−1) are 0.5M NaHCO3 (pH 8.5) extractable P and ammonium acetate extractable K, respectively. These methods are commonly used for estimation of soil P and K supplies, respectively in Asia (Dhawan et al., 1992; Dobermann et al., 1996). 2.4.2. Recovery efficiency of nutrients Apparent recovery efficiency (RE) of fertilizer nutrients is an important aspect of calculating fertilizer application rate. A precise estimation of RE needs use of isotopes but such studies are limited (Ladha et al., 2005). However, for various crops a reasonable estimate can be obtained from various field experiments. Ladha et al. (2005) compiled a large volume of data and estimated that N use efficiency (NUE) for rice is 35−40% and for other crops such as wheat and maize it is 45-50%. For the technology with continuous
NH3Volatilization
N2OEmission
CH4Emission
Target yield
Potential yield Current yield
Nutrient requirement
Waterrequirement
Manure/residue
Denitrific-ation
Soil supply
Fertilizers
Irrigation
Technology
Potential evapo-transpiration
CO2Emission
Land use type
DepositionPrecipitation
Soil organic C
Global Warming Potential
Technology
Manure/residues
Root exudates
Fertilizer N
Seed
Machine
Human labour
Animal labour
NO3Leaching
Biocides
Inputs
Outputs
Factors
Legends:

9
flooding and chemical fertilizer the NUE was taken as 35% for rice. The efficiencies of P (PUE) and K (KUE) were taken as 25% and 50%, respectively (Tandon and Taondon, 1995). For the other levels of technology the nutrient use efficiencies were adjusted using some coefficients (Table 2). Table 3. Sources of data and information for deriving various parameters/equations and coefficients. Parameters/equations/coefficients Source Rate of decomposition of SOC Seligman and van Keulen, 1981 Relation between bulk density and SOC Manrique and Jones, 1991 N, P and K requirement in rice Witt et al., 1999 N, P and K requirement in wheat Pathak et al., 2003 Soil P supply Pathak et al., 2003 Soil K supply Pathak et al., 2003 N use efficiency Ladha et al., 2005 P use efficiency Tandon and Tandon, 1995 K use efficiency Tandon and Tandon, 1995 N, P and K contents in irrigation and rain water Brown et al., 1999 Coefficients for methane production from available C Huang et al., 1998 Temperature correction factor for GHG emissions Li, 2000 Contribution of C from roots Mathews et al., 2000 GHG emissions from rice straw burning Yoshinori and Kanno, 1997 Methane emission from animal IINC, 2004 Nitrous oxide emission coefficient Li, 2000 CO2 emission due to farm operations Singh et al., 1999 CO2 emission due to production of farm inputs Schlesinger, 1999; Lal, 2004 Equation for estimating GWP Watson et al., 1996 Soil properties of Haryana Sachdev et al., 1995 Land use types, area, cropping systems in Haryana Yadav and Rao, 2001 Yields, input use and prices in Haryana Surveys; FAI, 2000 Coefficients for methane mitigation Wassmann et al., 2000 Coefficients for yields, manure use, N2O mitigation, irrigation and labour use in different technologies
Expert knowledge, literature, primary surveys

10
2.4.3. Fertilizer requirement Fertilizer requirement (kg ha−1) was calculated by deducting the supply of nutrient from soil, manure or residues, biological fixation, irrigation water and atmospheric deposition from the nutrient requirement of crop using the following equation.
Fertilizer_N = (Crop_N-Soil_N_supply-N_Manure-N_fix-Irri_water*0.003− Rainfall*0.001)/REN*Tech_NUE
Where, Crop_N is the N requirement of the crop (kg ha−1), N_Manure (kg ha−1) and N_fix (kg ha−1) are N supplies through manure and biological N fixation, respectively; Irri_water is amount of irrigation water (mm); 0.003 and 0.001 are the N concentrations in irrigation and rainwater in kg mm−1 ha−1 (Brown et al., 1999); REN is recovery efficiency of N and Tech_NUE is the adjustment coefficient for NUE in a particular technology. Nitrogen input from biological N fixation was considered at the rate of 10 kg ha−1 in rice and 5 kg ha−1 in other crops (Brown et al., 1999). Fertilizer P and K requirements (kg ha−1) were calculated using the following equations. Fertilizer_P = (Crop_P-Soil_P_supply-P_Manure)/REP*Tech_PUE Fertilizer_K = (Crop_K-Soil_K_supply-K_Manure)/REK*Tech_KUE However, farmers often apply a minimum amount of N irrespective of the technology levels. Therefore, in the present analysis the state average fertilizer consumption (80 kg N ha−1) was taken as the minimum amount of N a farmer would apply. 2.4.4. Emission of greenhouse gases Methane In soil CH4 is formed from organic C present in soil and C added through organic residues, dead roots and root exudates. Indigenous CH4 emission (CH4_em_ind, kg C ha−1 d−1) was calculated as a function of available C substrate, i.e., dissolved organic C, which in turn is related to SOC (%) of soil, bulk density (g cm−3), soil depth (cm), crop duration (days), the rate of decomposition (0.000085 per day) of SOC (Seligman and van Keulen, 1981; Matthews et al., 2000): CH4_em_ind = SOC * 1000 * bulk_density * soil_depth * 0.000085 * crop_duration * 0.27 *0.55

11
Where, 0.27 is the ratio of the molecular weights of methane and carbohydrate assuming that three moles of CH4 is derived from one carbohydrate unit (0.27 = 3 CH4/C6H12O6) (Huang et al., 1998) and 0.55 represents the initial fraction of produced CH4 which is emitted as a considerable amount of methane produced in soil gets oxidized while emitting to the atmosphere (Huang et al., 1998). Actual CH4 emission (CH4_em_ac, kg C ha−1 d−1) was then calculated as CH4_em_ac = (CH4_em_ind * Tech_CH4 + (root_input + manure_input * 0.5) 0.27 * 0.55 * 0.4) * 2**(Temp − 25)/10 Where, Tech_CH4 is a technology dependent factor for CH4 emission (Wassmann et al. (2000); root_input and manure_input correspond to the respective organic input (kg); 0.5 represents the fraction of manure mineralized during the growing season (assuming that 50% of the manure will be decomposed during the fallow period); 0.27 is the ratio of the molecular weights of methane and carbohydrate; 0.55 is the initial fraction of produced methane which is emitted; 0.4 is the C content of the root and manure inputs; 2**(Temp − 25)/10 is the temperature correction factor (Li, 2000), where Temp is seasonal average temperature (°C). While manure inputs are documented for all technologies, the root inputs (composed of exudates and dead roots) had to be derived from above ground biomass, which was calculated by the model in kg ha−1: root_input = above_ground_biomass * 0.1 * (0.02 + 0.001) where, 0.1 is the fraction of total above ground biomass considered as root mass; 0.02 corresponding to the senescence rate of roots (2% of existing root dry weight per day) and 0.001 to the root exudation rate which has been considered to be 1 mg C g−1 root day-1 over a 100 days crop duration (Mathews et al., 2000). Emission had been linked to various technologies based on inputs of organic C and their impact on soil aerobicity. Methane emission due to burning of rice straw has been calculated using the data given by Yoshinori and Kanno (1997). Methane emission from animal Microbial fermentation in the gut of animals results in the production of volatile fatty acids, microbial cells, CO2 and methane. Ruminant livestock contribute about 94% of total global methane produced by animals. Methane production is an integral part of anaerobic fermentation in the rumen helping in removal of hydrogen from the system to avoid its fermentation rate limiting effect (Bryant, 1979). Methane is a hydrogen sink in rumen eco-system. The following reaction is the most common mode of

12
methane production in the rumen by bacteria such as Methanobacterium ruminantium, Methanobacterium formicicum and Methanomicrobium mobile. In Haryana most of the households keep 2−3 cattle for milk. Production of CH4 from ruminants and manure was calculated based upon India’s Initial National Communication to the United Nations Framework Convention on Climate Change (IINC, 2004), which reported that about 30 g CH4 is emitted per animal per day and CH4 produced from animal waste is about 1/10th of that produced by the animal. Nitrous oxide Nitrous oxide emission (N2O_em_ac, kg N ha−1) was related to mineralization of organic N (from soil, residues and manure) into inorganic pool (NH4
+), which was in turn related to mineralization of C, addition of inorganic fertilizer either NH4
+ or urea forms and rates of nitrification and denitrification (0.0024 kg kg−1) (Li, 2000). Similar approach has been used in the denitrification and decomposition (DNDC) model for estimating N2O emission from soil (Li, 2000). N2O_em_ac = [(CO2_em_ac + CH4_em_ac)/10 + Fertilizer N] *0.0024*N2O_Tech where, CO2_em_ac is emission of CO2 (kg C ha−1) (see below) and N2O_Tech was the N2O emission coefficient in different technology levels. Emission of N2O due to burning of rice straw has been calculated using the data given by Yoshinori and Kanno (1997). Carbon dioxide Emission of CO2 (CO2_em_ac, kg C ha−1) i.e., change in SOC has been related to SOC (%) of soil, bulk density (g cm−3), soil depth (cm), crop duration (days), the rate of decomposition (0.000085 per day) of SOC (Seligman and van Keulen (1981; Matthews et al., 2000) and temperature correction factor.
CO2_em_ac = SOC * 1000 * bulk_density * soil_depth * 0.000085 * crop_duration * 2 ** ((Temp − 25)/10)
Emission of GHG from various farm operations and input use, burning of residues and handling of animal manure were estimated using the emission coefficients from literature. With reference to CO2 emission agricultural practices are grouped into primary sources such as mobile operations (tillage, sowing, harvesting and transport) and stationary operations (pumping water, drying grain), secondary sources (manufacturing, packaging and storing fertilizer and pesticides) and tertiary sources (acquisition of raw materials, fabrication of equipment and construction of farm buildings). Carbon emission from different operations and input use in agriculture are presented in Table 4.

13
Table 4. Carbon dioxide emissions due to the production of different farm inputs and operations. Input Carbon dioxide emission (kg C kg−1 input) Nitrogen 1.3a Phosphorus 0.2 Potassium 0.2 Herbicides 6.3 Insecticides 5.1 Fungicides 3.9 Operations Carbon dioxide emission (kg C ha−1) Mouldboard ploughing 15.2b Field cultivation 4.0 Sowing 3.2 Fertilizer spreading 7.6 Spray pesticides 1.4 Irrigation per 100 mm 5.0** Harvesting 10
Source: a Schlesinger (1999), Lal (2004) b Singh et al. (1999) The following equation was used for the calculation of CO2 emission (kg C ha−1) due to farm operations.
CO2_em = Moulboard_ploughing (1) * 15.2 + Cultivation (2) * 4 + Sowing (1) * 3.2 + Fertilizer_application (2) * 7.6 + Biocide_use (100 g) * 1.4
+ Irrigation (100 mm) * 5 + Manure_use (1000 kg) * 3.2 + Harvesting (1) * 10
Emission of CO2 (kg C kg−1 input) for production of the various farm inputs (kg) was calculated using the following equation. CO2_em = N_fertilizer * 1.3 + (P_fertilizer + K_fertilizer) * 0.2 + Biocide * 6.3 The coefficients are the emissions for each operation and the number or volume of operations is given in the brackets.

14
Fig. 3. Location of the state of Haryana in India. (a) State boundaries of India, (b) district boundaries of Haryana. 2.4.5. Global warming potential Global warming potential (GWP) is an index defined as the cumulative radiative forcing between the present and a chosen later time ‘horizon’ caused by a unit mass of gas emitted now. It is used to compare the effectiveness of each greenhouse gas to trap heat in the atmosphere relative to a standard gas, by convention CO2. The GWP for CH4 (based on a 100-year time horizon) is 21, while that for N2O it is 310 when GWP value for CO2 is taken as 1. Global warming potential (kg CO2 equivalent ha−1) of a system was calculated as GWP = CH4_em_ac * 16/12 * 21 + N2O_em_ac * 44/28 * 310 + CO2_em_ac * 44/12 2.5. Application to the case study of Haryana 2.5.1. Study site Haryana, located in a semi-arid, sub-tropical environment between 27.4 to 30.6 °N and 74.3 to 77.4 °E., in northwest India has an area of 4,421,000 ha with a population of 21 million as per 2001 census (Fig. 3). The agricultural area comprises 81% of the total area, and 47% of agricultural area is sown more than once. It consists of 16 administrative
(b)
(a)

15
regions (districts) made of 108 blocks and 7073 villages. Sirsa, Bhiwani, Rohtak and Hisar in the western and central parts of the state are the largest districts (Fig. 3). Kurukshetra and Karnal, the two fully irrigated districts are major rice and wheat producers. Since many of the statistical data were district-based, district was chosen as the basic geographic unit of the database to maintain the maximum accuracy of the original data sets. The required input parameters of the TCMGAS model (Table 1) consisting of soil properties and field area under rice and wheat were compiled for the districts in a GIS (ArcView) database. A detailed resource inventory of soil, climate, fertilizer use, biocide use and land-use types was prepared for the study region using primary surveys, Government Statistics (ESO, 1996) and published literature. Information about soils was collected from the National Bureau of Soil Survey and Land Use Planning (NBSS and LUP), Nagpur, India (Sachdev et al., 1995) while information about climate was obtained from Indian Meteorological Department. Data on fertilizer use was collected from FAI (2000) and biocide use from Pathak et al. (2001). The district-wise area under the important land-use types was obtained from Yadav and Rao (2001). 2.5.2. Biophysical input-output estimation Technical coefficients were generated for the major land-use systems in Haryana using the target-oriented-approach based on the physical environment and the production technique Hengsdijk et al. (1998). With this an optimal combination of inputs is identified to realize a particular yield (output) level, based on knowledge of crop growth (Van Ittersum and Rabbinge, 1997). Outputs like GHG emissions, leaching and volatilization of ammonia are then calculated based on the amount of input used and related output generation mechanism. Input and output relationships were expressed per hectare and were scale independent. In our approach, inputs and outputs for a given land-use systems were determined by the physical environment and the production technique. Soil and climate represented the physical environment and production technique was the means that determine how a certain yield level was attained and included the required inputs. 2.5.3. Target yield First step for such a target-oriented-approach of input-output estimation is to decide the yield target. In the current study the current yields in the various districts of the state were obtained from FAI (2000) and were taken as the base yields. Yields in the various technologies were determined using the technology-dependent yield coefficients given in Table 2.

16
2.5.4. Nitrogen, P, and K requirements of crops The requirements of N, P, and K of rice and wheat were calculated using the values given by Witt et al. (1999) and Pathak et al. (2003), respectively. 2.5.5. Labour A survey, conducted by Haryana Agricultural University, provided information related to manure use, and human and machine labour uses in the state. For mitigation technologies machine labour and human labour were adjusted using the coefficients given in Table 2. 2.5.6. Prices of inputs and outputs Costs of fertilizers, manure, human labour, hiring of tractor and procurement price of produce as well as residues were derived from the Government statistics. Total cost of production included costs of seeds, human labour, machine labour, irrigation, fertilizers, manure, biocides, fixed cost and miscellaneous (10% of operational costs) costs. Some technologies, for example, use of biogas residue (cf_bg_bu), urea tablet (cf_ur_bu_Tab), rice husk (cf_fm_bu_HU) and incorporation of rice in upland crops with reduced tillage (cf_ur_in_Up) would involve some extra recurring and non-recurring expenditures (HPKV, 2004). These costs were taken as the technology costs for calculation of total costs. Gross income was the value of main produce and residue. Net income of the farmers was calculated as the difference between gross income and total cost. 2.5.7. Emission of greenhouse gases Emissions of GHG from various districts were calculated using the equations described above. Total GWP from rice-wheat systems of different districts of Haryana was estimated using the total area under the system and the emission at current farmers’ practice. The carbon efficiency ratio (CER) in various districts was calculated using the following equation. CER = Grain_yield (kg C ha-1) of the rice-wheat system/GWP
(CO2 equiv. ha−1 *12/44)
3. Results and discussion 3.1. Resource inventory Haryana soils can be broadly classified into three main textural classes. Light textured

17
soils (sandy and coarse loamy) prevail in the western parts, whereas the central and eastern parts are occupied by medium to heavy textures (sandy loam and silty clay loam). Soils contain low amounts of organic carbon ranging from 0.20 to 0.65%. Olsen P and ammonium acetate exchangeable K contents ranged from 9−15 and 150−250 kg ha−1, respectively, while clay contents ranged from 14.6 to 27.2% and pH from 6.6 to 8.4. Haryana has large variation in climatic features, especially rainfall (Kalra et al., 2001). The latter is unimodal and varies from 300 mm to 891 mm per annum depending upon the region. The northern districts receive relatively higher rainfall and the western districts receive lowest rainfall. Average rainfall of the state varies over the years with a coefficient of variation between 30 to 40%. One can therefore, observe arid, semi-arid as well as sub-humid types of weather in the state. The temperatures are generally very warm during summer reaching a maximum of 45 ºC to very cool during winters (reaching a minimum of 1 ºC. Monthly distribution of rainfall, temperature and sunshine hours of Karnal district of Haryana are presented in (Fig. 4). The gross irrigated area (which includes the area irrigated more than once in a year) in Haryana is 4.78 Mha (Kalra et al., 2001). Out of net irrigated area of 2.7 Mha, wells and tubewells (drawing waters from groundwater) cover 50% each. Most districts in western Haryana have large canal irrigation systems whereas in the eastern part both surface and groundwater are used for irrigation. Since the soils in the state are light to medium textured, relatively more irrigation water is required. As a consequence, the number of pumps and tubewells has increased dramatically in last three decades. At the same time this excessive pumping to meet water requirements of paddy has resulted in the declining water tables, in particular where rice-wheat cropping system is followed. Consumption of plant nutrients (N, P and K) per unit of cropped area of the state during 2001−02 was 156 kg ha−1 yr−1 in comparison to 90 kg ha−1 of the national average. The western regions, being rainfed and with limited irrigation facility has lower application of the nutrients in comparison to the eastern and central regions, which are mainly dominated by the rice based cropping system. In Haryana, the use of plant protection chemicals has been on rise from 3608 tons (1985−86) to 5164 tons (1990−91) and thereafter has stabilized (5100 tons during 2000−01). Hisar and Sirsa districts consume the highest amount of pesticides mainly used for cotton. However, the spectrum of chemicals used in the state has shifted from total dependence on organo-chlorine chemicals to the introduction of newer chemicals, which are relatively safer and leave only degradable residues (Pathak et al., 2001). There are various combinations of crops, which form the major land use types of the state. Some are practiced extensively while few are in localized pockets. After the Green

18
Fig. 4. Monthly total rainfall, mean maximum and minimum temperatures and mean sunshine hour at Karnal, Haryana during 1996 to 2000. Revolution, there is a shift in cropping pattern due to better infrastructure facilities, higher yield potential of crops and profitability (Singh et al., 1994; Hooda, 1994). The area under traditional cereals (sorghum, pearl millet, barley, etc.) was diverted to rice during monsoon season, while there was a shift from winter pulses to wheat in those areas. Thus, currently most double cropping is with rice-wheat systems. However, in areas with assured irrigation triple cropping with summer rice-rice-wheat is also followed. The shift of cropping pattern towards rice, wheat or sugarcane based cropping system in the northern region is due to higher yield and higher profitability from these crops. For the present study the most dominant land-use type i.e., rice-wheat occupying 0.8 million ha of land was selected (Yadav and Rao, 2001). This cropping system is followed in 13 out of total 16 districts of the state. 3.2. Emission of greenhouse gases 3.2.1. Emission in the current farmers’ practice Emissions of GHGs from soil, burning of rice straw, cattle, manure management, farm operations and production of various agricultural inputs were estimated in the study.
00
05
10
15
20
25
30
35
40
45
Jan Feb Mar Apr May Jun Jul Aug Sep Oct Nov Dec
Tota
l rai
nfal
l (m
m
00
50
100
150
200
250
Ave
rage
tem
p. (o C
) and
suns
hine
(hr d-1
)
RainfallMax. temp.Min. temp.Sunshine hours

19
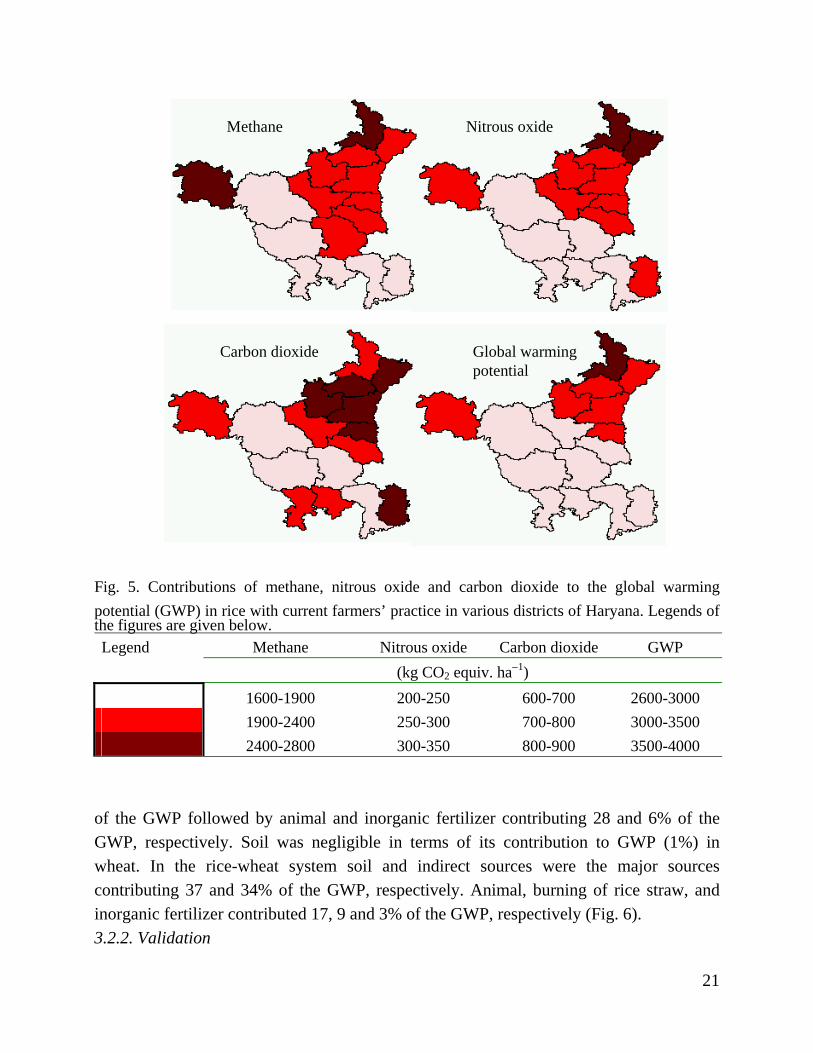
While burning of rice straw contributed to the emissions of CH4 and N2O, cattle and manure management contributed to CH4 emission only, farm operations and production of agricultural inputs emitted CO2 only and soil contributed to the emissions of all the 3 GHGs (CO2, CH4 and N2O). The study showed that soil was the major contributor of CH4 and burning of rice straw contributed most of the N2O. Fluxes of CH4 from soil in rice ranged from 59 to 109 kg ha−1 in various districts of Haryana (Table 5). The spatial distribution of GWP due to CH4 emission is shown in Fig. 5. Emission of N2O-N from soil in rice varied between 0.05 and 0.14 kg ha−1 while from fertilizer it was between0.03 and 0.16 kg ha−1 (Table 5). Burning of rice straw emitted 10 to 13 kg CH4 and 0.33 to 0.43 kg N2O-N ha−1. Farm operations and off farm practices such as production of fertilizer and biocides contributed 80 to 98 and 16 to 91 kg CO2-C ha−1, respectively. Cattle and manure management together contributed 18 kg CH4 ha−1. Contribution of soil towards CO2 emission was taken as zero in the present study. This is based upon the observation in several long-term fertility experiments in rice-wheat cropping systems in northwest India, which showed more or less static organic C status for the last 25−30 years (Rekhi et al., 2000; Ladha et al., 2003). In soils under rice-rice cropping systems of south Asia also organic C status is reported to remain stable (Dawe et al., 2000). Total GWP from rice in various districts was between 2766 and 4054 kg CO2 equivalent ha−1 depending upon soil organic C, fertilizer and biocide use, and on- and off-farm operations. Wheat is grown under aerobic conditions, therefore soil emission of CH4 is zero. As wheat straw is used for animal feed in Haryana, it is not burnt in situ and does not contribute to GHG emission. Therefore, in wheat the contribution to GHG emissions stemmed from soil (N2O), cattle and manure management (CH4) and farm operations and off farm production of agricultural inputs (CO2). Emission of N2O-N from soil ranged from 0.02 to 0.05 kg ha−1 while from fertilizer it was between 0.05 and 0.26 kg ha−1 (Table 5). Farm operations and off farm practices contributed 83 to 100 and 26 to 141 kg CO2-C ha−1, respectively, in wheat. Like in rice, cattle and manure management together contributed 18 kg CH4 ha−1. Soil CO2 emission was assumed zero because of observed stability of soil organic carbon under rice-wheat systems (Rekhi et al., 2000; Ladha et al., 2003). Total GWP in various districts was between 1038 and 1624 kg CO2 equivalent ha−1. Thus, compared to rice, the GWP in wheat was much lower. In rice, soil was the major source contributing 48% of the GWP (Fig. 6) followed by indirect sources i.e., production of fertilizer and biocides and farm operations (25% of the GWP). Burning of rice straw, animal and inorganic fertilizer contributed 13, 12 and 2% of the GWP, respectively. In wheat, indirect sources were the major source contributing 65%

20
Dis
trict
St
raw
burn
ing
Soil
Ferti
lizer
C
attle
Fa
rm o
pera
tion
Off
farm
To
tal G
WP
C
H4
N2O
-N
CH
4 N
2O-N
N
2O-N
C
H4
CO
2-C
C
O2-
C
CO
2 eq
ui.
Am
bala
13
0.
43
109
0.14
0.
05
0.13
0.
21
18
18
80
83
73
113
4054
14
47
Yam
unan
agar
11
0.
37
81
0.09
0.
03
0.16
0.
26
18
18
93
99
90
139
3512
16
15
Kur
uksh
etra
11
0.
37
70
0.07
0.
02
0.16
0.
26
18
18
93
100
91
141
3275
16
24
Kai
thal
11
0.
37
70
0.07
0.
02
0.12
0.
20
18
18
90
94
69
106
3162
14
42
Sirs
a 10
0.
33
93
0.11
0.
04
0.09
0.
14
18
18
98
92
49
78
3568
13
16
Kar
nal
11
0.37
70
0.
07
0.02
0.
16
0.25
18
18
93
99
87
13
5 32
56
1593
Jind
11
0.
37
70
0.07
0.
02
0.11
0.
17
18
18
89
92
60
91
3116
13
69
His
sar
10
0.33
64
0.
06
0.02
0.
06
0.10
18
18
96
88
34
54
28
55
1181
Pani
pat
11
0.37
70
0.
07
0.02
0.
14
0.22
18
18
91
97
78
12
0 32
07
1515
Sone
pat
11
0.37
70
0.
07
0.02
0.
11
0.17
18
18
89
93
62
94
31
25
1384
Bhi
wan
i 10
0.
33
64
0.06
0.
02
0.03
0.
05
18
18
93
84
16
26
2766
10
38
Roh
tak
11
0.37
70
0.
07
0.02
0.
05
0.09
18
18
85
86
32
47
29
75
1143
Gur
gaon
11
0.
37
59
0.05
0.
02
0.07
0.
11
18
18
86
88
42
62
2774
12
17
Farid
abad
11
0.
37
59
0.05
0.
02
0.13
0.
20
18
18
90
95
71
109
2925
14
58
Mah
endr
agar
h 10
0.
33
59
0.05
0.
02
0.08
0.
13
18
18
97
91
44
70
2781
12
60
Rew
ari
11
0.37
59
0.
05
0.02
0.
09
0.14
18
18
87
90
52
78
28
25
1298
Tabl
e 5.
Em
issi
on o
f GH
Gs (
in k
g ha
−1) i
n ric
e (s
hade
d ce
lls) a
nd w
heat
(bla
ck c
ells
) in
diff
eren
t dis
trict
s in
Har
yana
.
21
Fig. 5. Contributions of methane, nitrous oxide and carbon dioxide to the global warming potential (GWP) in rice with current farmers’ practice in various districts of Haryana. Legends of the figures are given below. Legend Methane Nitrous oxide Carbon dioxide GWP (kg CO2 equiv. ha−1) 1600-1900 200-250 600-700 2600-3000 1900-2400 250-300 700-800 3000-3500 2400-2800 300-350 800-900 3500-4000
of the GWP followed by animal and inorganic fertilizer contributing 28 and 6% of the GWP, respectively. Soil was negligible in terms of its contribution to GWP (1%) in wheat. In the rice-wheat system soil and indirect sources were the major sources contributing 37 and 34% of the GWP, respectively. Animal, burning of rice straw, and inorganic fertilizer contributed 17, 9 and 3% of the GWP, respectively (Fig. 6). 3.2.2. Validation
Methane Nitrous oxide
Carbon dioxide Global warming potential
Methane Nitrous oxide
Carbon dioxide Global warming potential

22
The calculated GHG emission from soil were compared against the data observed in field experiments conducted in New Delhi, situated adjacent to the state of Haryana at 28°40’ N and 77°12’ E, at an altitude of 228 m above mean sea level and Karnal, Haryana. Observed CH4 emission from soil in the experiments in New Delhi under continuous flooding averaged 50 kg ha−1 (Jain et al., 2004). Emission of CH4 from rice in Karnal, Haryana was 81 kg ha−1 (Bhattacharya and Mitra, 1998). The calculated CH4 emissions with similar SOC ranged from 59 to 81 kg ha−1 (Table 5). Methane emissions from soils of Haryana calculated using the relationship between soil organic C and CH4 emission, developed by Yan et al. (2003), were similar as calculated by the TCMGAS. Studies (Kumar et al., 2000; Majumdar et al., 2000) conducted in New Delhi showed that the emissions of N2O-N from rice fields ranged from 0.06 to 0.30 kg N ha−1 while the calculated emissions in rice ranged from 0.09 to 0.29 kg N ha−1. Thus, there was a fairly good agreement between the observed and the predicted values of GHG emissions. In wheat the N2O-N emissions were 0.31 to 0.71 kg N ha−1 and the calculated values were between 0.07 to 0.31 kg N ha−1 (Table 5). Lower calculated values in wheat were due to application of low amount of N used by the farmers compared to that used Fig. 6. Contribution of soil, rice straw burning, animal and indirect sources of emission in rice, wheat and rice-wheat system with the current farmers’ practice on global warming potential in Haryana.
0
1000
2000
3000
4000
5000
Rice Wheat Rice-wheat system
GW
P (k
g C
O 2 e
quiv
. ha-1
)
FertilizerIndirectAnimalSoilRice straw burning

23
in the experiments. Emission of GHG from farm operations and production of inputs could not be validated because of lacking data. 3.2.3. Emission under various technologies Different mitigation technologies in rice had pronounced effects on the GWP, which varied between 1715 kg CO2 equivalent ha−1 with continuous flooding, urea and rice straw used for building materials and 10020 kg CO2 equivalent ha−1 with continuous flooding and application of 100% nutrients through organic manure (Table 6). Compared to the current farmers’ practice 13 technologies have the potential to reduce the GWP by 8 to 51% (Table 6). Following five technologies with continuous flooding and urea with (1) rice straw sequestered, (2) straw fed to animal, (3) rice straw incorporated in upland crops, (4) phosphogypsum, and (5) nitrification inhibitor were superior to others in reducing GWP (Fig. 7). Relative contributions of various sources such as soil, fertilizer, straw burning and animal in some of the potential technologies are presented in Fig. 7. In all the technologies soil was the major source of GHG followed by indirect sources, except the technology with phosphogypsum, where the later was dominant. However, the mitigation technologies involved extra expenditure and reduced the net income of farmers, which will hinder their adoption. Eventually the cost/benefit of each technology will decide its adoptability by the farmers. Detailed economic analysis of each technology has been discussed in the Vol. II of the paper (Wassmann and Pathak, this volume). 3.2.4.Upscaling of GWP in the state of Haryana Global warming potential in rice in different districts of Haryana on the basis of current farmers’ practice ranged from 19 to 524 Gg (109 g) CO2 equivalent (Table 7). The variations depend upon area under rice, which varied between 7 and 161 thousand ha, soil organic C, fertilizer and biocide use, and on- and off-farm operations. Karnal district had the highest GWP in rice followed by Kaithal and Ambala. In wheat GWP varied in a narrow range of 8 to 12 Gg CO2 equivalent. The carbon efficiency ratio (CER) ranged from 0.54 to 0.74. Higher CER indicates more efficient use of C. Thus in Gurgaon district C is used most efficiently while in Ambala it is used least efficient. The impact of GHG mitigating technologies compared to the current farmers’ practice on the total GWP of the state was analysed using 3 potential technologies, which varied in terms of management of rice straw, water and nutrient (Table 8). It was observed that change of N management i.e., N is supplied through urea alone (technology cf_ur_bu) instead of the current practice of partially substituting inorganic N with FYM will reduce

24
Table 6. Global warming potential, cost and returns with the various technologies in rice. Technologya GWP (kg CO2
equi. ha−1) Total cost (Rs. ha−1)
Gross return(Rs. ha−1)
Net return (Rs. ha−1)
GWP indexb Net return index
cf_ur_an 2252 17240 19932 2692 0.64 0.96 md_fp_bu 3190 16263 18813 2551 0.91 0.91 af_fp_bu 2935 14832 17116 2284 0.84 0.81 cf_mi_bu 5128 18975 21636 2661 1.46 0.95 cf_or_an 10020 16176 21441 5265 2.86 1.88 af_mi_bu 4268 15321 17985 2664 1.22 0.95 cf_bg_bu 2939 19893 21634 1741 0.84 0.62 cf_ur_bu_Pho 2373 16827 19724 2897 0.68 1.03 cf_ur_bu_Nit 2527 18734 21636 2903 0.72 1.03 cf_ur_bu_Tab 2804 21189 23549 2360 0.80 0.84 cf_fp_bu_Hu 2599 18569 21224 2655 0.74 0.95 cf_fp_bu_Dir 3218 16364 18813 2449 0.92 0.87 cf_mi_bu_Cul 4419 19305 21636 2331 1.26 0.83 cf_ur_in_Up 2267 17240 19724 2484 0.65 0.89 cf_ur_sq 1715 17718 20141 2423 0.49 0.86 cf_ur_in_Ri 4668 15778 17811 2034 1.33 0.73 cf_ur_bu 2664 16762 19724 2962 0.76 1.06 cf_ur_bu_Sp 2827 21589 23549 1959 0.81 0.70 cf_gm_bu 3875 20030 21636 1606 1.10 0.57 cf_fp_bu 3508 16919 19724 2805 1.00 1.00 a Refer to Table 2 for the descriptions of the technologies. b Index is compared to the farmers’ practice taken as 1. the GWP from 2617 to 1866 Gg CO2 equivalent i.e., a reduction of 29% (Table 8). Similarly, if the water management is modified from continuous flooding to alternate flooding (technology af_fp_bu) the GWP will be reduced by 15%. Feeding of rice straw to the animal and supplying N through urea (technology cf_ur_an) instead of the current practice of burning rice straw and use of FYM, the GWP will be reduced to 1535 Gg CO2 equivalent from its current value of 2617 Gg CO2 equivalent i.e., a reduction of 41%. Thus, a significant reduction of GWP is possible by adopting these technologies.

25
Fig. 7. Contribution of fertilizer, indirect sources, animal, soil and rice straw burning on the global warming potential of 10 selected technologies in rice compared to that of the current farmers’ practice. Refer to Table 2 for the descriptions of the technologies. 4. Conclusion The TCMGAS has been developed to evaluate the GWP of various land-use types and explore the mitigation options alongside with economic returns for rice-based cropping systems by integrating analytical and expert knowledge with regional databases on bio-physical, agronomic and socio-economical features. With current farmers’ practice, soil-borne emissions were the major source of GHG contributing 48% of the average GWP in rice followed by indirect sources i.e., production of farm inputs and farm operations (25% of the GWP). Burning of rice straw, animal and inorganic fertilizer contributed 13, 12 and 2% of the GWP, respectively. Average GHG emissions in wheat were 44% of that in rice. Different mitigation technologies had pronounced effects on the GWP of the rice crop and 13 technologies have the potential to reduce the GWP compared to current farmers’ practice. Upscaling of the estimates showed that the current GWP of the entire state of
0
1000
2000
3000
4000
cf_u
r_sq
cf_u
r_an
cf_u
r_in
_Wh
cf_u
r_bu
_Pho
cf_u
r_bu
_Nit
cf_f
p_bu
_Hu
cf_u
r_bu
cf_u
r_bu
_Tab
cf_u
r_bu
_Sp
cf_f
p_bu
GW
P (k
g C
O 2 e
quiv
. ha-1
)
FertilizerIndirectAnimal SoilStraw burning

26
Table 7. Area, yield, global warming potential (GWP) and C efficiency ratio in rice-wheat system in the various districts of Haryana. District Area
(000 ha) Yield
(Mg ha−1) GWP of the district
(Gg CO2 equi.) C efficiency
ratio Rice Wheat System Ambala 65 7.49 263 11 274 0.54 Yamunanagar 20 7.43 70 12 82 0.58 Kurukshetra 97 7.43 318 12 330 0.61 Kaithal 150 7.43 474 11 485 0.65 Sirsa 32 7.01 114 9 123 0.57 Karnal 161 7.43 524 12 536 0.61 Jind 81 7.43 252 10 263 0.66 Hissar 22 7.01 63 8 71 0.69 Panipat 69 7.43 221 11 233 0.63 Sonepat 62 7.43 194 10 204 0.66 Bhiwani -a - - - - - Rohtak 17 7.43 51 8 59 0.72 Gurgaon 7 7.43 19 9 28 0.74 Faridabad 18 7.43 53 11 63 0.68 Mahendragarh - - - - - - Rewari - - - - - - a - indicates no area under rice-wheat system. Haryana is 2,617 Gg CO2 equivalent. Modifications of water, nutrient and rice straw management could reduce the GWP by 15 to 41%. However, the technologies involve extra expenditure and reduce the net income of farmers. Eventually the cost/benefit of each technology will decide its adoptability by the farmers. The study showed that the TCMGAS could be used for estimating GHG emission from various land-use types and identifying the mitigation options. Detailed economic analysis of each technology has been discussed in the Vol. II of the paper (Wassmann and Pathak, this volume).

27
Table 8. Global warming potential (GWP) in rice with four different technologies in the various districts of Haryana. District GWP (Gg CO2 equi.) cf_fp_bua cf_ur_anb af_fp_buc cf_ur_bud Ambala 263 172 209 203 Yamunanagar 70 43 59 52 Kurukshetra 318 187 273 227 Kaithal 474 272 405 334 Sirsa 114 72 91 84 Karnal 524 307 450 373 Jind 252 143 215 176 Hissar 63 34 53 42 Panipat 221 128 189 157 Sonepat 194 110 165 136 Rohtak 51 28 43 35 Gurgaon 19 10 17 13 Faridabad 53 28 46 36 Total 2617 1535 2214 1866 a cf_fp_bu, continuous flooding, farmers’ practice and rice straw burnt; b cf_ur_an, continuous flooding, urea and rice straw fed to animal; c af_fp_bu, alternate flooding, farmers’ practice and rice straw burnt; d cf_ur_bu, continuous flooding, urea and rice straw burnt. Availability of TCMGAS The model can be obtained from H. Pathak, Unit of Simulation and Informatics, Indian Agricultural Research Institute, New Delhi, India ([email protected], [email protected]) or R. Wassmann, Institute for Meteorology and Climate Research (IMK-IFU), Forschungszentrum Karlsruhe, Garmisch-Partenkirchen, Germany ([email protected]). Acknowledgements The first author is thankful to the Alexander von Humboldt Foundation, Germany for providing a fellowship and the Forschungszentrum Karlsruhe, Institut für Meteorologie ünd Klimaforschung (IMK-IFU), Garmisch-Partenkirchen, Germany for providing facilities to carry out the work. Help and guidance of Dr. P.K. Aggarwal and Dr. N. Kalra,

28
Indian Agricultural Research Institute, New Delhi and Dr. Reimund Roetter, Alterra, Wageningen University and Research Centre, the Netherlands in developing the TCMGAS are duly acknowledged. References Adams, R.M., Flemming, R.A., Chang, C.C., McCarl, B.A., Rosenzweig, C., 1995. A
reassessment of the economic effects of global climate change on U.S. agriculture. Climatic Change 30, 147–167.
Aggarwal, P.K., Sujith Kumar, Vashisth, A.K., Hoanh, C.T., Van Keulen, H., Kalra, N., Pathak, H., Roetter, R.P., 2001. Balancing food demand. In: Land use analysis and planning for sustainable food security: with an illustration for the state of Haryana, India. Eds Aggarwal P.K., Roetter, R.P. Kalra, N., Van Keulen, H., Hoanh, C.T. and Van Laar, H.H., Indian Agricultural Research Institute, New Delhi; International Rice Research Institute, Los Baños; Wageningen University and Research Center, Wageningen, pp. 33–60.
Bhattacharya, S., Mitra, A.P., 1998. Greenhouse gas emission India for the base year 1990, Center on Global Change, National Physical Laboratory, New Delhi, 118 pp.
Bouman, B.A.M., Nieuwenhuyse, A., Hengsdijk, H., 1998. PASTOR: A technical coefficient generator for pasture and livestock systems in the humid tropics, version 2.0. Quantitative Approaches in Systems Analysis No. 18. AB-DLO/C.T. de Wit Graduate school for Production ecology, Wageningen, The Netherlands.
Bouman, B.A.M., Jansen, H.G.P., Schipper, R.A., Nieuwenhuyse, A., Hengsdijk, H., Bouma, J., 1999. A framework for integrated biophysical and economic land use analysis at different scales. Agriculture, Ecosystems and Environment 75, 55–73.
Brown, S., Schreier, H., Shah, P.B., Lavkulich, L.M., 1999. Modelling soil nutrient budgets: an assessment of agricultural sustainability in Nepal. Soil Use Management 15, 101–108.
Bryant, M.P., 1979. Microbial methane production-theoretical aspects. Journal Animal Science 48, 193–200.
Dawe, D., Dobermann, A., Moya, P., Abdulrachman, S., Bijay Singh, Lal, P., Li, S.Y., Lin, B., Panaullah, G., Sariam, O., Singh, Y., Swarup, A., Tan, P.S., Zhen, Q.X., 2000. How widespread are yield declines in long-term rice experiments in Asia? Field Crops Research 66, 175–193.
Dhawan, A.S., Singh, K.D., Goswami, N.N., 1992. Suitability of soil tests methods for rice & wheat under field conditions. Journal Indian Society Soil Science 40, 216–217.
Dobermann, A., Sta Cruz, Adviento, P.C., Pumpoelno, M.F., 1996. Fertilizer input,

29
nutrient balance and soil -nutrient -supplying power in intensive irrigated rice system. III. Phosphorus. Nutrient Cycling Agroecosystems 46, 111–125.
ESO, 1996 Economic and Statistical Organisation. Statistical abstracts of Haryana. Government of Haryana publication. India
FAI, 2000. Fertilizer Association of India Regional Statistics (2000), Fertilizer Association of India, New Delhi.
Hengsdijk, H., Nieuwenhuyse, A., Bouman, B.A.M., 1998. LUCTOR: Land use crop technical coefficient generator; version 2.0. A model to quantify cropping systems in the Northern Atlantic zone of Costa Rica. Quantitative Approaches in Systems Analysis No. 17. AB-DLO/C.T. de Wit Graduate school for Production ecology, Wageningen, The Netherlands.
Hengsdijk, H., Van Ittersum, M.K., 2002. A goal-oriented approach to identify and engineer land use systems. Agricultural Systems 71, 231–247.
Hooda, R.S., 1994. Delineation of crop combination regions- a new technique. Haryana Journal Agronomy 10, 141–144.
Horie, T., Nakagawa, H., Ceneno, H.G.S., Kropff, M.J., 1995. The rice crop simulation model SIMRIW and its testing. In: Modelling the impact of climate change on rice production in Asia. Eds Matthews, R.B., Kropff, M.J., Bachelet, D. and Van Laar, H.H., CAB International and International Rice Research Institute, the Philippines, pp. 51–66.
HPKV, 2004. Promising renewable energy technology III. CSK Himachal Pradesh Krishi Viswavidyalaya, Palampur, Himachal Pradesh, www.techno-preneur.net
Huang, Y., Sass, R.L., Fisher, F.M. Jr., 1998. A semi-empirical model of methane emission from flooded rice paddy soils. Global Change Biology 4(3), 247–268.
IINC, 2004. India’s Initial National Communication to the United Nations Framework Convention on Climate Change. Ministry of Environment and Forests, Government of India, 2004, 392 pp.
IPCC – Intergovernmental Panel on Climate Change, Emissions Scenarios, Special Report of the Intergovernmental Panel on Climate Change, (Cambridge University Press, UK) 2000 available at: http:// www.ipcc.ch/pub/pub.htm
Irrigation Department Haryana, 1995. Water resource studies under the proposed the proposed Haryana water resources consolidation project. Haryana water resources framework plan. Part 2. PP 107. Government of Haryana.
Jain, N., Pathak, H., Mitra, S., Bhatia, A., 2004. Emission of methane from rice fields – a review. Journal Scientific Industrial Research 63, 101–115.
Kalra, N., Aggarwal, P.K., Pathak, H., Sujith Kumar, Bandyopadhyay, S.K., Dadhwal,

30
V.K., Sehgal, V.K., Harith, R., Krishna, M., Roetter, R.P., 2001. Evaluation of regional resources and constraints. In: Land use analysis and planning for sustainable food security: with an illustration for the state of Haryana, India. Eds Aggarwal P.K., Roetter, R.P. Kalra, N., Van Keulen, H., Hoanh, C.T. and Van Laar, H.H., Indian Agricultural Research Institute, New Delhi; International Rice Research Institute, Los Baños; Wageningen University and Research Center, Wageningen, pp. 33–60.
Kumar, U., Jain, M.C., Pathak, H., Kumar, S., Majumdar, D., 2000. Nitrous oxide emissions from different fertilizers and its mitigation by nitrification inhibitors in irrigated rice. Biology Fertility of Soils 32, 474–478.
Ladha, J.K., Pathak, H., Padre, A.T., Dawe, D., Gupta, R.K., 2003. Productivity trends in intensive rice-wheat cropping systems in Asia. In: Improving the productivity and sustainability of rice-wheat systems: Issues and impacts. Eds J.K. Ladha, J.E. Hill, J.M. Duxbury, Raj, K. Gupta and R.J. Buresh, ASA Special Publication 65, ASA-CSSA-SSSA, Madison, USA, pp. 45–76.
Ladha, J.K., Pathak, H., Krupnik, T.J., Six, J., van Kessel, C., 2005. Efficiency of fertilizer nitrogen in cereal production: retrospect and prospects. Advances in Agronomy (in press).
Lal, R., 2004. Carbon emission from farm operations. Environmental International 30, 981–990.
Li, C., 2000. Modeling trace gas emissions from agricultural ecosystems, Nutrient Cycling Agroecosystems 58, 259–276.
Majumdar, D., Kumar, S., Pathak, H., Jain, M.C., Kumar, U., 2000. Reducing nitrous oxide emission from rice field with nitrification inhibitors. Agriculture Ecosystems and Environment 81, 163–169.
Manrique, L.A., Jones, C.A., 1991. Bulk density of soil in relation to soil physical and chemical properties. Soil Science Society America Journal 55, 476–481.
Matthews, R.B., Kropff, M.J., Bachelet, D., 1995. Introduction. In: Modeling the impact of climate change on rice production in Asia. Eds Matthews, R.B., Kropff, M.J., Bachelet, D. and Van Laar, H.H., CAB International and International Rice Research Institute, the Philippines, pp. 3–9.
Matthews, R.B., Wassmann, R., Arah, J., 2000. Using a crop/soil simulation model and GIS techniques to assess methane emsissions from rice fields in Asia. I. Model development. Nutrient Cycling Agroecosystems 58, 141–159.
Pathak, H. Aggarwal, P.K., Roetter, R., Kalra, N., Bandyopadhaya, S.K., Prasad, S., Van Keulen, H., 2003. Modelling the quantitative evaluation of soil nutrient supply, nutrient use efficiency, and fertilizer requirements of wheat in India. Nutrient Cycling

31
Agroecosystems 65, 105–113. Pathak, H., Joshi, H.C., Choudhary, R., Bandyopadhyay, S.K., Kalra, N., Aggarwal, P.K.,
Roetter, R.P., 2001, Environmental impact assessment. In: Land use analysis and planning for sustainable food security: with an illustration for the state of Haryana, India. Eds P.K. Aggarwal, Roetter, R.P. Kalra, N., Van Keulen, H., Hoanh, C.T. and Van Laar, H.H., Indian Agricultural Research Institute, New Delhi; International Rice Research Institute, Los Baños; Wageningen University and Research Center, Wageningen, pp. 91–104.
Pathak, H., Ladha, J.K., Aggarwal, P.K., Peng, S., Das, S., Yadvinder Singh, Bijay-Singh, Kamra, S.K., Mishra, B., Sastri, A.S.R.A.S., Aggarwal, H.P., Das, D.K., Gupta, R.K., 2003. Climatic potential and on-farm yield trends of rice and wheat in the Indo- Gangetic plains. Field Crops Research 80, 223–234.
Peng, S., Huang, J., Sheehy, J.E., Laza, R.C., Visperas, R.M., Zhong, X., Centeno, G.S., Khush, G.S., Cassman, K.G., 2004. Rice yields decline with higher night temperature from global warming. PNAS 101, 9971–9975.
Ponsioen, T.C., Hengsdijk, H., Wolf, J., Van Ittersum, M.K., Roetter, R.P., Thuc Son, T., Laborte, A.G., 2005. TechnoGIN, a tool for exploring and evaluating resource use efficiency of cropping systems in East and Southeast Asia. Agricultural Systems (in press)
Rekhi, R.S., Benbi, D.K., Singh, B., 2000. In: Long-term soil fertility experiments in rice-wheat cropping systems. Eds I.P. Abrol, K.F. Bronson, J.M. Duxbury and R.K. Gupta, RWC Research Series #6. New Delhi, pp. 1–6.
Roetter, R.P., Laborte, A.G., Hoanh, C.T., Van Keulen, H., Van Diepen, C.A., 2000. Options for future agricultural land use in South and Southeast Asia: cross-site experiences at sub-national scale. IRRI, The Philippines.
Sachdev, C.B., Tarsem lal, Rana, K.P.C., Sehgal, J., 1995. Soils of Haryana for optimizing land use. National Bureau of Soil Survey and Land Use Planning, Nagpur, India, 59 pp. + 2 maps.
Seligman, N.G., Van Keulen, H., 1981. PAPRAN: A simulation model of annual pasture production limited by rainfall and nitrogen. In: Simulation of N behaviour of soil-plant systems. Eds M.J. Frissel and J.A. Van Veen, Pudoc, Wageningen, pp. 60–97.
Schlesinger, W.H., 1999. Carbon sequestration in soils. Science 284, 2095. Singh, N., Malik, R.S., Punia, R.K., 1994. Socio-economic determinants of cropping
pattern. Haryana Journal Agronomy 10, 225–228. Singh, S., Singh, S., Pannu, C.J.S., Singh J., 1999. Energy input and yield relations for
wheat in different agro-climatic zones of the Punjab. Applied Energy 63, 287–298.

32
Tandon, H.L.S., Tandon, K.S., 1995. State-wise and crop-wise recommendations. In: Fertilizer and integrated nutrient recommendations for balance and efficiency. Ed. H.L.S. Tandon, FDCO, New Delhi, India, pp. 35–103.
Van Ittersum, M.K., Rabbinge, R., 1997. Concepts in production ecology for analysis and quantification of agricultural input–output combinations. Field Crops Research 52, 197–208.
Wassmann, R., Lantin, R.S., Neue, H.U., Buendia, L.V., Corton, T.M., Lu, Y., 2000. Characterization of methane emissions from rice fields in Asia. III. Mitigation options and future research needs. Nutrient Cycling Agroecosystems 58, 23–36.
Wassmann, R., Pathak, H., 2005. Introducing greenhouse gas mitigation as a development objective in rice-based agriculture: I. Cost-benefit Assessment for different technologies, regions and scales. this volume
Watson, R.T., Zinyowera, M.C., Moss, R.H., Dokken, D.J., 1996. Climate change 1995, impacts, adaptations and mitigation of climate change: scientific-technical analyses. Intergovernmental Panel on Climate Change, Cambridge University Press, USA, pp. 879.
Witt, C., Dobermann, A., Abdulrachman, S., Gines, H.C., Guanghuo, W., Nagarajan, R., Satawathananont, S., Tran Thuc Son, Pham Sy Tan, Le Van Tiem, Simbahan, G., Olk, D.C., 1999. Internal nutrient efficiencies in irrigated lowland rice of tropical and subtropical Asia. Field Crops Research 63, 113–138.
Yadav, R.L., Subba Rao, A.V.M., 2001. Atlas of Cropping Systems in India. PDCSR Bulletin No. 2001-02, pp. 96 Project Directorate for Cropping Systems Research. Modipuram, Meerut 250 110, India.
Yan, X., Ohara, T., Akimoto, H., 2003. Development of region specific emission factors and estimation of methane emission from rice fields in the East, Southeast and South Asian countries. Global Change Biology 9, 1–18.
Yoshinori, M., Kanno, T., 1997. Emission of trace gases resulting from rice straw burning. Soil Science Plant Nutrition 43, 849–854.