Introducing external costs for Local Atmospheric Pollution in TIAM-MACRO to study synergies and...
18
WIR SCHAFFEN WISSEN – HEUTE FÜR MORGEN Introducing external costs for Local Atmospheric Pollution in TIAM-MACRO to study synergies and co- benefits of climate change mitigation Socrates Kypreos 1 , Evangelos Panos 1 , George Giannidakis 2 , James Glynn 3 , and Kathrin Volkart 1 1 Energy Economics group, Laboratory for Energy Systems Analysis, PSI, Switzerland, 2 ETSAP Project Leader, 3 University College Cork, Ireland Semi-Annual ETSAP meeting in Cork Ireland, May 2016
-
Upload
iea-etsap -
Category
Data & Analytics
-
view
158 -
download
0
Transcript of Introducing external costs for Local Atmospheric Pollution in TIAM-MACRO to study synergies and...

WIR SCHAFFEN WISSEN – HEUTE FÜR MORGEN
Introducing external costs for Local Atmospheric Pollution in TIAM-MACRO to study synergies and co-benefits of climate change mitigation
Socrates Kypreos1, Evangelos Panos1, George Giannidakis2, James Glynn3, and Kathrin Volkart1
1Energy Economics group, Laboratory for Energy Systems Analysis, PSI, Switzerland,2ETSAP Project Leader, 3University College Cork, Ireland
Semi-Annual ETSAP meeting in Cork Ireland, May 2016

• Quantification of synergies and co-benefits of LAP while solving for GCC
(The present assessment of climate change gives unbalanced C/B results
excluding the benefits of LAP contol).
• Improvement of the global model TIAM-MACRO including LAP databases
• Selection of the proper modeling approach for LAP in TIAM-MACRO
• Develop ETSAP software for Post Optimal Analysis (POA) for Burden Sharing (BS)
following different rules
Scope of the IEA-ETSAP Project on Local Atmospheric pollution (LAP) andGlobal Climate Change (GCC)
Page 2

Project Stucture
Page 3

• After a period of time making some experiments with the MERGE version of
Johannes Bollen, I concluded that this option is not convenient for TIAM MACRO.
• The main reason being the strong non-linearities of the method to address
PM2.5 (only). One of the basic requirements for TIAM-MACRO to converge is to
solve a linear energy problem in TIAM, with linear constraints.
• Non-liner relations for LAP sould have been included in the MACRO part.
• Such an approach is not sure that converges and requires experimentation and
heuristic methods, but there was not time available for such experiments.
Net-benefits of LAP control could have been defined in the welfare function, but…
Page 4
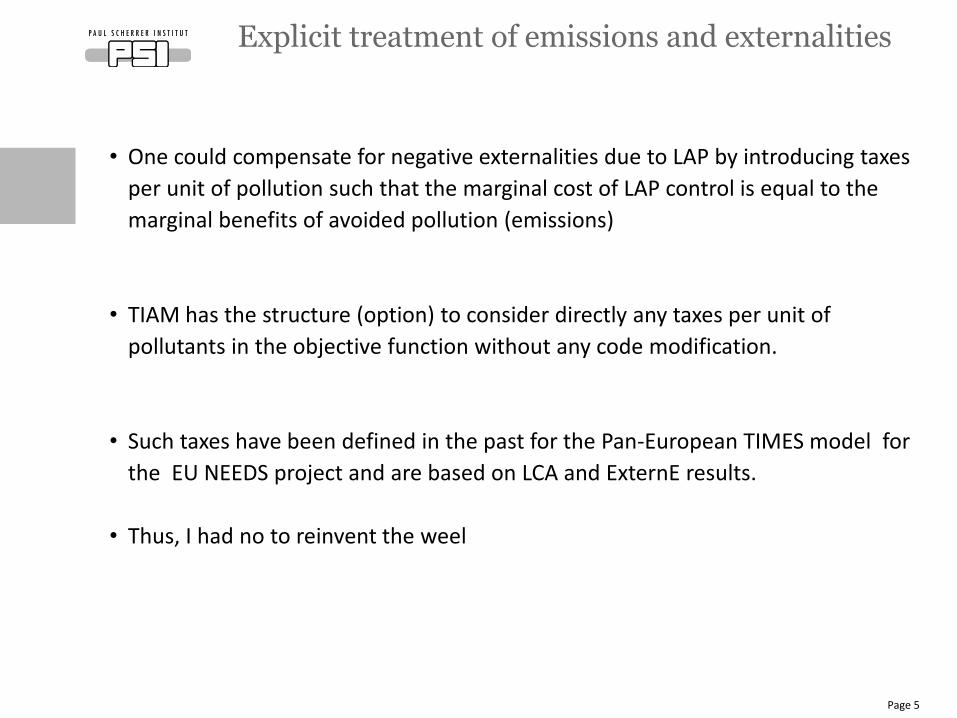
• One could compensate for negative externalities due to LAP by introducing taxes
per unit of pollution such that the marginal cost of LAP control is equal to the
marginal benefits of avoided pollution (emissions)
• TIAM has the structure (option) to consider directly any taxes per unit of
pollutants in the objective function without any code modification.
• Such taxes have been defined in the past for the Pan-European TIMES model for
the EU NEEDS project and are based on LCA and ExternE results.
• Thus, I had no to reinvent the weel
Explicit treatment of emissions and externalities
Page 5

• PSI has developed an approach to extend the NEEDS Externality taxes for EU2010
to the 15 world regions and up to the time horizon of analysis
• CRES was able to specify specific emission data for existing and new technologies
following either energy flows in a sector or technology specific activities
• SK (PSI) has developed a GAMS code for Burden Sharing and 4 rules with and
without externalities
• JG (UCC) has extented the approach for two more rules of BS in the direction of
the Brazilian approach
• The final project report is in preparation
Explicit treatment of emissions and externalities
Page 6

Adjustment factors for externalities based on PSI methodology(WTP,GDP, Population, Urbanization)
Page 7
0
1
2
3
4
5
6
2010 2020 2030 2040 2050 2060 2070 2080 2090 2100
AFR
AUS
CAN
CHI
CSA
EEU
FSU
IND
JPN
MEA
MEX
ODA
SKO
USA
WEU
Figure 1: Total (combined) adjustment factors fr,t [-] for the 15 regions in the TIAM model and the time periods 2010-2100. 1 = WEU in 2010.
Externality taxes are defined as follows: EX-TAX(rg,yr) = EX-TAX(rg,2010)*f(rg,yr)
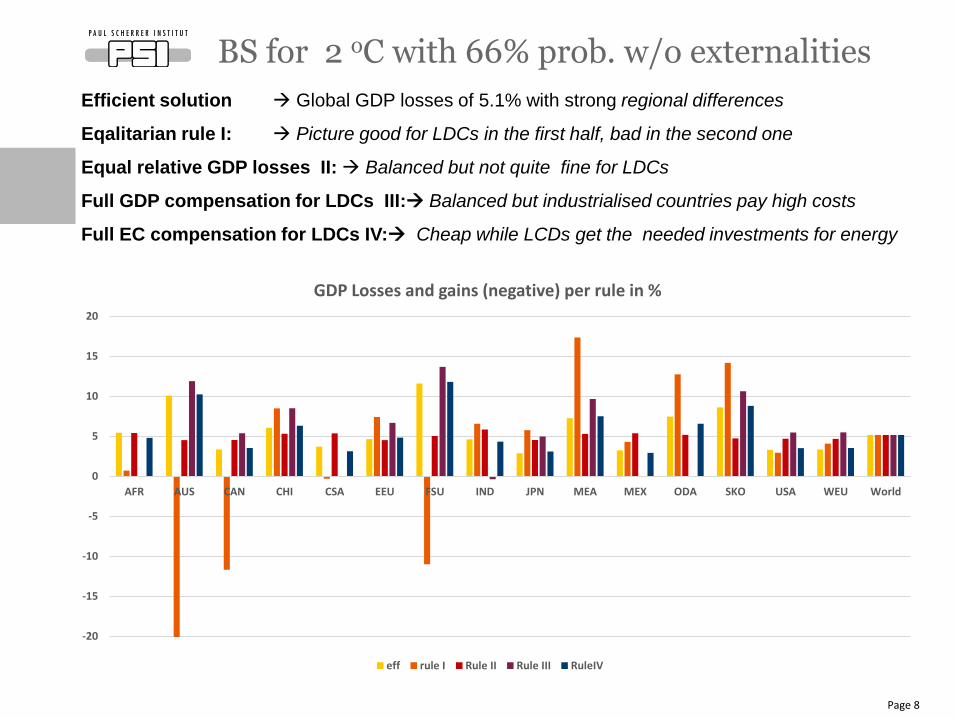
BS for 2 oC with 66% prob. w/o externalities
Page 8
Efficient solution Global GDP losses of 5.1% with strong regional differences
Eqalitarian rule I: Picture good for LDCs in the first half, bad in the second one
Equal relative GDP losses II: Balanced but not quite fine for LDCs
Full GDP compensation for LDCs III: Balanced but industrialised countries pay high costs
Full EC compensation for LDCs IV: Cheap while LCDs get the needed investments for energy
-20
-15
-10
-5
0
5
10
15
20
AFR AUS CAN CHI CSA EEU FSU IND JPN MEA MEX ODA SKO USA WEU World
GDP Losses and gains (negative) per rule in %
eff rule I Rule II Rule III RuleIV
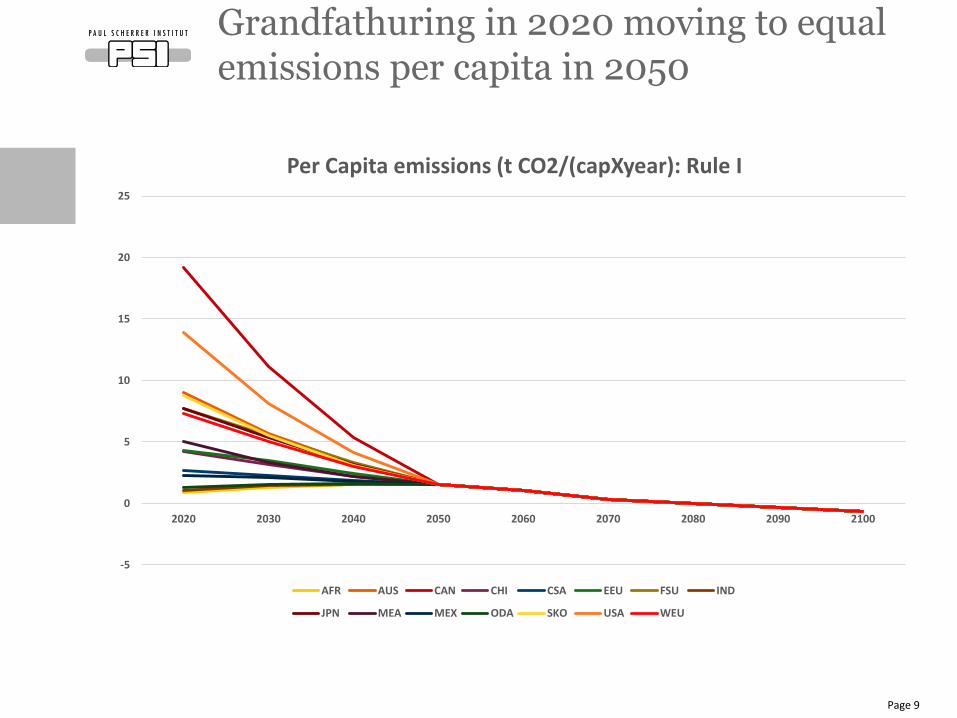
Grandfathuring in 2020 moving to equalemissions per capita in 2050
Page 9
-5
0
5
10
15
20
25
2020 2030 2040 2050 2060 2070 2080 2090 2100
Per Capita emissions (t CO2/(capXyear): Rule I
AFR AUS CAN CHI CSA EEU FSU IND
JPN MEA MEX ODA SKO USA WEU
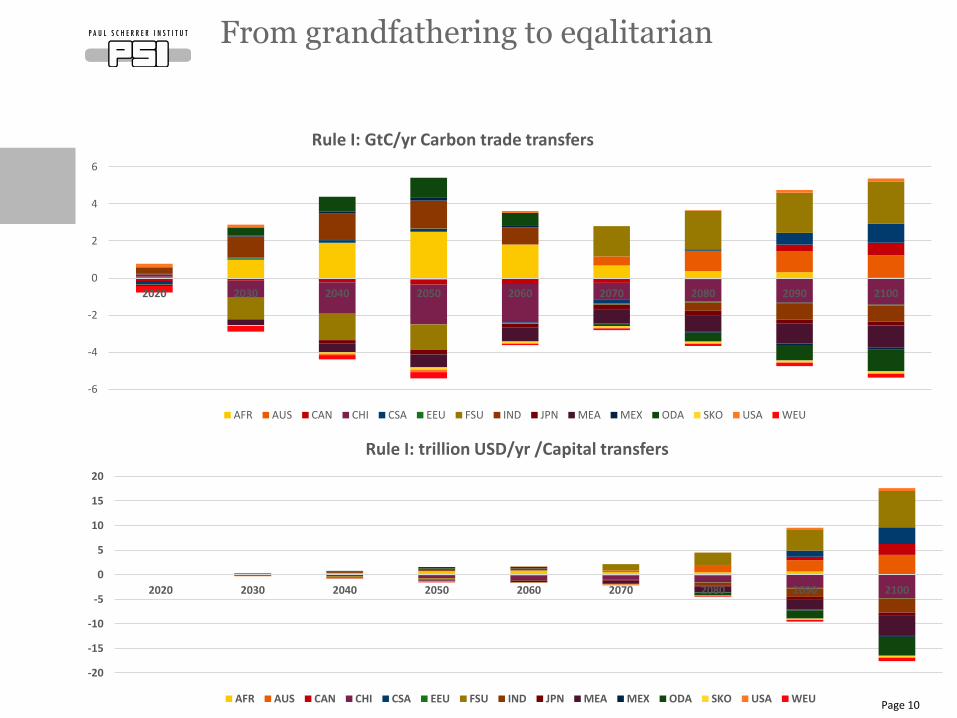
From grandfathering to eqalitarian
Page 10
-6
-4
-2
0
2
4
6
2020 2030 2040 2050 2060 2070 2080 2090 2100
Rule I: GtC/yr Carbon trade transfers
AFR AUS CAN CHI CSA EEU FSU IND JPN MEA MEX ODA SKO USA WEU
-20
-15
-10
-5
0
5
10
15
20
2020 2030 2040 2050 2060 2070 2080 2090 2100
Rule I: trillion USD/yr /Capital transfers
AFR AUS CAN CHI CSA EEU FSU IND JPN MEA MEX ODA SKO USA WEU
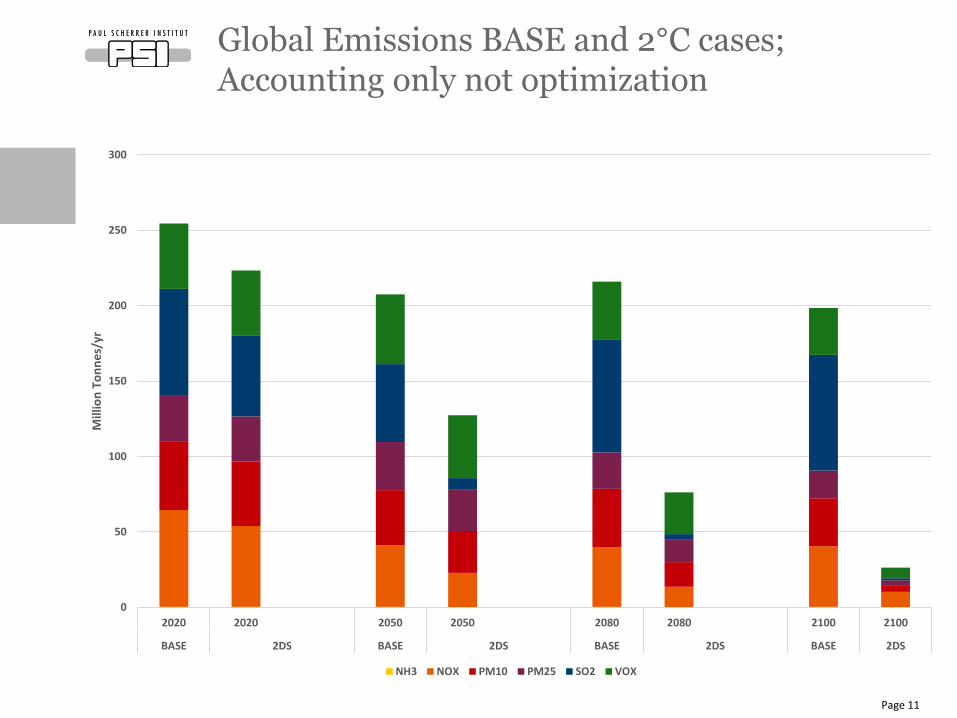
Global Emissions BASE and 2°C cases; Accounting only not optimization
Page 11
0
50
100
150
200
250
300
2020 2020 2050 2050 2080 2080 2100 2100
BASE 2DS BASE 2DS BASE 2DS BASE 2DS
Mill
ion
To
nn
es/
yr
NH3 NOX PM10 PM25 SO2 VOX
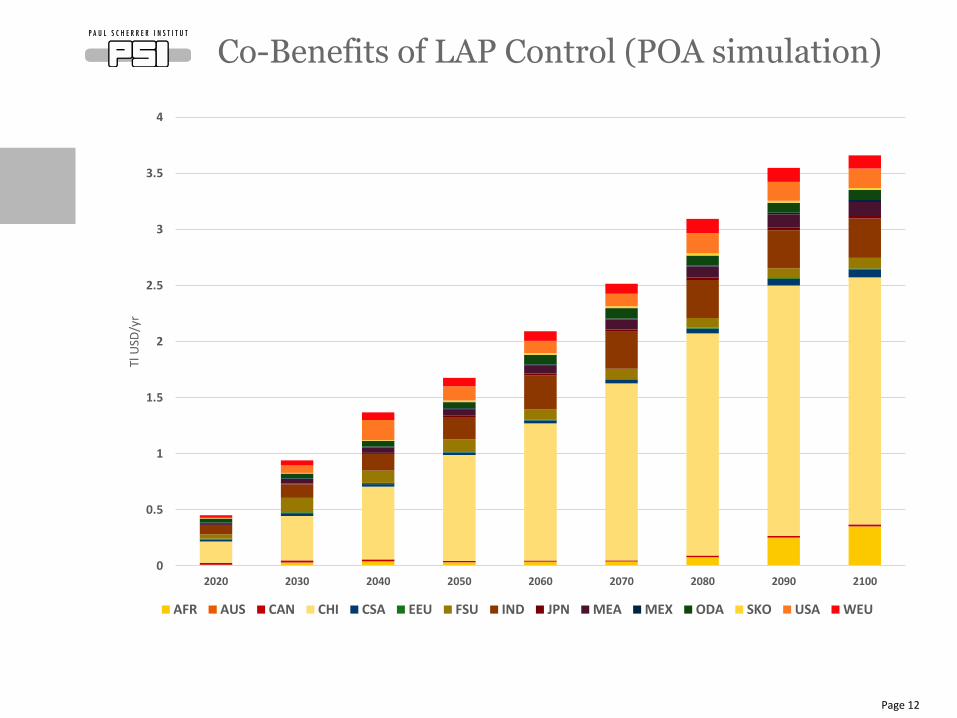
Co-Benefits of LAP Control (POA simulation)
Page 12
0
0.5
1
1.5
2
2.5
3
3.5
4
2020 2030 2040 2050 2060 2070 2080 2090 2100
Tl U
SD/y
r
AFR AUS CAN CHI CSA EEU FSU IND JPN MEA MEX ODA SKO USA WEU

Co-Benefits of LAP Control (POA simulation)
Page 13
0
0.5
1
1.5
2
2.5
3
3.5
AFR AUS CAN CHI CSA EEU FSU IND JPN MEA MEX ODA SKO USA WEU
Mean global benefits are 1.05 % of GDP
2020 2030 2040 2050 2060 2070 2080 2090 2100
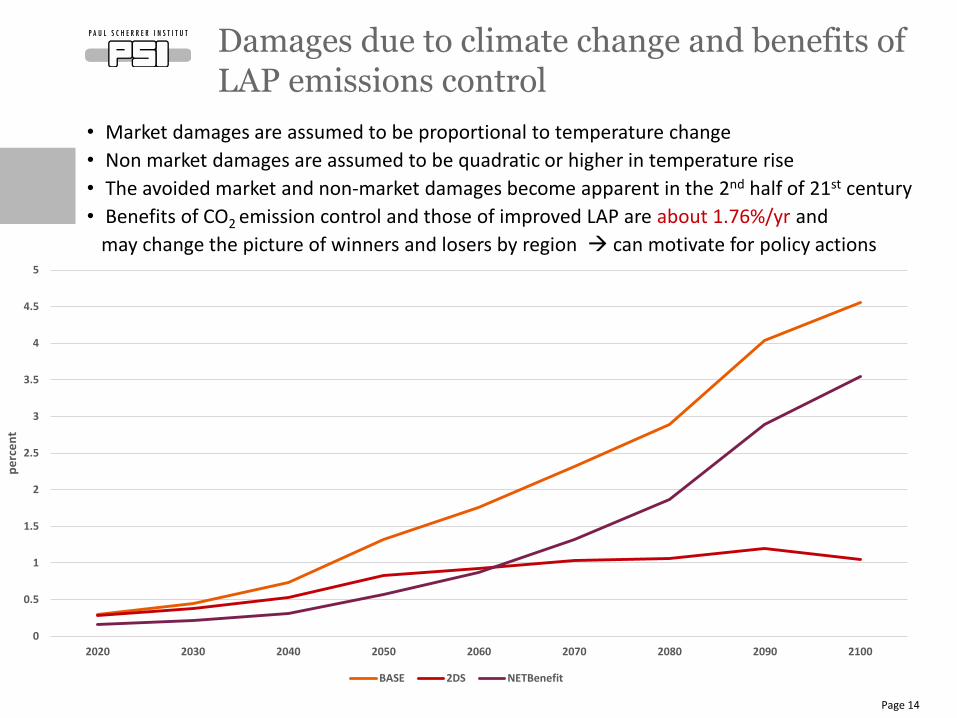
• Market damages are assumed to be proportional to temperature change
• Non market damages are assumed to be quadratic or higher in temperature rise
• The avoided market and non-market damages become apparent in the 2nd half of 21st century
• Benefits of CO2 emission control and those of improved LAP are about 1.76%/yr and
may change the picture of winners and losers by region can motivate for policy actions
Damages due to climate change and benefits ofLAP emissions control
Page 14
0
0.5
1
1.5
2
2.5
3
3.5
4
4.5
5
2020 2030 2040 2050 2060 2070 2080 2090 2100
pe
rce
nt
BASE 2DS NETBenefit
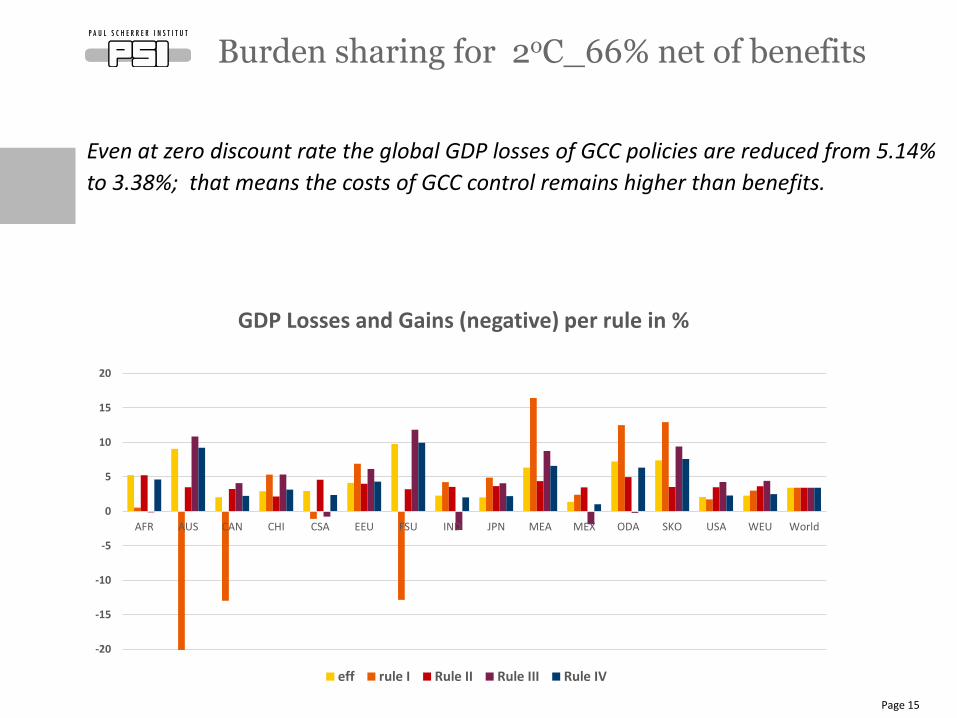
Even at zero discount rate the global GDP losses of GCC policies are reduced from 5.14%
to 3.38%; that means the costs of GCC control remains higher than benefits.
Burden sharing for 2oC_66% net of benefits
Page 15
-20
-15
-10
-5
0
5
10
15
20
AFR AUS CAN CHI CSA EEU FSU IND JPN MEA MEX ODA SKO USA WEU World
GDP Losses and Gains (negative) per rule in %
eff rule I Rule II Rule III Rule IV

Reduced relative GDP losses by region = GCC Benefits and LAP-Co-Benefits
Page 16
0
0.5
1
1.5
2
2.5
3
3.5
AFR AUS CAN CHI CSA EEU FSU IND JPN MEA MEX ODA SKO USA WEU World
per
cen
t o
f G
DP
BA
SE
eff rule I Rule II Rule III RuleIV

• The 2oC is technically feasible and if we choose the proper burden sharing rule it can
also be equitable while the mean GDP gains due to LAP control are about 1% originated
mostly in China followed by Africa.
• Equal relative GDP losses is a balanced burden sharing allocation:
Full compensation of the energy cost for the South is less expensive for the
industrialised countries.
Perhaps a combination of both could convince DCs to participate but it must be clear
they will not go beyond the INDC commitments without compensation
• The climate change mitigation costs can be reduced if benefits of climate change
mitigation (avoided damages) and the co-benefits of LAP control are considered
but control costs are not fully balanced and remain high
• Key technologies for power generation and LAP reduction are wind, solar PV, Nuclear,
coal and gas with CCS; BECCS, synfuel and H2 from biomass while good for CO2
reduction, generate PM
Conclusions
Page 17
Page 18
Wir schaffen Wissen – heute für morgen
Thank you for your attention !