Introducing Explorer of Taxon Concepts with a case … ARTICLE Open Access Introducing Explorer of...
22
RESEARCH ARTICLE Open Access Introducing Explorer of Taxon Concepts with a case study on spider measurement matrix building Hong Cui 1* , Dongfang Xu 1 , Steven S. Chong 1 , Martin Ramirez 2 , Thomas Rodenhausen 1 , James A. Macklin 3 , Bertram Ludäscher 4 , Robert A. Morris 5 , Eduardo M. Soto 6 and Nicolás Mongiardino Koch 6 Abstract Background: Taxonomic descriptions are traditionally composed in natural language and published in a format that cannot be directly used by computers. The Exploring Taxon Concepts (ETC) project has been developing a set of web-based software tools that convert morphological descriptions published in telegraphic style to character data that can be reused and repurposed. This paper introduces the first semi-automated pipeline, to our knowledge, that converts morphological descriptions into taxon-character matrices to support systematics and evolutionary biology research. We then demonstrate and evaluate the use of the ETC Input Creation - Text Capture - Matrix Generation pipeline to generate body part measurement matrices from a set of 188 spider morphological descriptions and report the findings. Results: From the given set of spider taxonomic publications, two versions of input (original and normalized) were generated and used by the ETC Text Capture and ETC Matrix Generation tools. The tools produced two corresponding spider body part measurement matrices, and the matrix from the normalized input was found to be much more similar to a gold standard matrix hand-curated by the scientist co-authors. Special conventions utilized in the original descriptions (e.g., the omission of measurement units) were attributed to the lower performance of using the original input. The results show that simple normalization of the description text greatly increased the quality of the machine-generated matrix and reduced edit effort. The machine-generated matrix also helped identify issues in the gold standard matrix. Conclusions: ETC Text Capture and ETC Matrix Generation are low-barrier and effective tools for extracting measurement values from spider taxonomic descriptions and are more effective when the descriptions are self-contained. Special conventions that make the description text less self-contained challenge automated extraction of data from biodiversity descriptions and hinder the automated reuse of the published knowledge. The tools will be updated to support new requirements revealed in this case study. Keywords: Information extraction, Text mining, Natural language processing, Taxonomic morphological descriptions, Phenotypic characters, Phenotypic traits, Evaluation, Spiders, ETC, Explorer of Taxon Concepts * Correspondence: [email protected] 1 University of Arizona, Tucson, AZ, USA Full list of author information is available at the end of the article © The Author(s). 2016 Open Access This article is distributed under the terms of the Creative Commons Attribution 4.0 International License (http://creativecommons.org/licenses/by/4.0/), which permits unrestricted use, distribution, and reproduction in any medium, provided you give appropriate credit to the original author(s) and the source, provide a link to the Creative Commons license, and indicate if changes were made. The Creative Commons Public Domain Dedication waiver (http://creativecommons.org/publicdomain/zero/1.0/) applies to the data made available in this article, unless otherwise stated. Cui et al. BMC Bioinformatics (2016) 17:471 DOI 10.1186/s12859-016-1352-7
-
Upload
hoangxuyen -
Category
Documents
-
view
218 -
download
0
Transcript of Introducing Explorer of Taxon Concepts with a case … ARTICLE Open Access Introducing Explorer of...

Cui et al. BMC Bioinformatics (2016) 17:471 DOI 10.1186/s12859-016-1352-7
RESEARCH ARTICLE Open Access
Introducing Explorer of Taxon Conceptswith a case study on spider measurementmatrix building
Hong Cui1* , Dongfang Xu1, Steven S. Chong1, Martin Ramirez2, Thomas Rodenhausen1, James A. Macklin3,Bertram Ludäscher4, Robert A. Morris5, Eduardo M. Soto6 and Nicolás Mongiardino Koch6Abstract
Background: Taxonomic descriptions are traditionally composed in natural language and published in a formatthat cannot be directly used by computers. The Exploring Taxon Concepts (ETC) project has been developing aset of web-based software tools that convert morphological descriptions published in telegraphic style to characterdata that can be reused and repurposed. This paper introduces the first semi-automated pipeline, to our knowledge,that converts morphological descriptions into taxon-character matrices to support systematics and evolutionary biologyresearch. We then demonstrate and evaluate the use of the ETC Input Creation - Text Capture - Matrix Generationpipeline to generate body part measurement matrices from a set of 188 spider morphological descriptions and reportthe findings.
Results: From the given set of spider taxonomic publications, two versions of input (original and normalized) weregenerated and used by the ETC Text Capture and ETC Matrix Generation tools. The tools produced two correspondingspider body part measurement matrices, and the matrix from the normalized input was found to be much more similarto a gold standard matrix hand-curated by the scientist co-authors. Special conventions utilized in the originaldescriptions (e.g., the omission of measurement units) were attributed to the lower performance of using theoriginal input. The results show that simple normalization of the description text greatly increased the quality ofthe machine-generated matrix and reduced edit effort. The machine-generated matrix also helped identify issuesin the gold standard matrix.
Conclusions: ETC Text Capture and ETC Matrix Generation are low-barrier and effective tools for extractingmeasurement values from spider taxonomic descriptions and are more effective when the descriptions areself-contained. Special conventions that make the description text less self-contained challenge automatedextraction of data from biodiversity descriptions and hinder the automated reuse of the published knowledge.The tools will be updated to support new requirements revealed in this case study.
Keywords: Information extraction, Text mining, Natural language processing, Taxonomic morphologicaldescriptions, Phenotypic characters, Phenotypic traits, Evaluation, Spiders, ETC, Explorer of Taxon Concepts
* Correspondence: [email protected] of Arizona, Tucson, AZ, USAFull list of author information is available at the end of the article
© The Author(s). 2016 Open Access This article is distributed under the terms of the Creative Commons Attribution 4.0International License (http://creativecommons.org/licenses/by/4.0/), which permits unrestricted use, distribution, andreproduction in any medium, provided you give appropriate credit to the original author(s) and the source, provide a link tothe Creative Commons license, and indicate if changes were made. The Creative Commons Public Domain Dedication waiver(http://creativecommons.org/publicdomain/zero/1.0/) applies to the data made available in this article, unless otherwise stated.

Cui et al. BMC Bioinformatics (2016) 17:471 Page 2 of 22
BackgroundBiologists rely heavily on a variety of publications (jour-nals, monographs, faunas/floras, etc.) to discover priorknowledge about organisms of interest. Scientific namesare the primary identifiers for organisms used withinthese information resources. Due to different taxonomicperspectives of authors through time, scientific namesand their associated descriptions in these works are notstatic but represent taxonomic concepts [1]. This con-tinuous change in taxonomic concepts thus brings intoquestion the validity of using scientific names alone as abasis of comparison. However, taxonomic works oftencontain detailed morphological, distributional, and otherevidence that can assist with analyzing the evolution intaxonomic concepts over time.This morphological evidence can be managed in
taxon-character matrices, a research tool widely used inbiological research, ranging from taxonomy to phylogen-etic studies. Traditionally, these matrices are createdmanually by biologists within their taxonomic area ofexpertise. It is a tedious and laborious process becausethe matrix author(s) must manually select relevant char-acter information from published literature and/or othersources and populate the matrix with their associatedcharacter states or values. By far the most commonmethod of making taxon-character matrices is using aspreadsheet, although other software tools, for exampleMacClade [2] and Mesquite [3], have been also used tomake the matrix creation process more efficient. Morerecently MorphoBank has made a web-based matrix edi-tor available for researchers to collaboratively developlarge matrices [4].The challenge of efficiently extracting character infor-
mation from systematics publications into a structuredformat, such as taxon-character matrices, remains open.The Phenoscape knowledgebase and a number of modelorganism databases employ human curators to convertnatural language phenotype character descriptions into amachine-readable form by using Phenex [5] or otherweb-based platforms [6–9]. These manual approacheseffectively capture high quality character data. However,they are time consuming and expensive.Automated extraction of factual information from text
remains an active research area after decades of research.It was previously called message understanding in theeighties, but is now better known as information extrac-tion, and sometimes also semantic role labelling, semanticparsing, or more generally text mining. Algorithms andsoftware have been developed for general domains (e.g.,news articles, Wikipedia articles, e-commerce), for specificdomains (e.g., biomedical, engineering, patents), for differ-ent extraction targets (e.g. sentiment/emotion extraction),and for text in different human languages. Currently, thedominant overall approach is using various machine
learning methods (supervised and/or unsupervised) withtext syntactic analyses, various knowledge resources (e.g.frame templates, glossaries, ontologies), and when avail-able, large corpus of unlabelled data, as well [10–12].Portability, the ability of a natural language processing
system to perform equally well in a domain differentfrom the one for which it was trained/developed,remains the greatest challenge [10]. In-domain vs.out-domain performance differences were consistentlyfound in all systems participated in the Semantic RoleLabelling shared tasks of CoNLL 2005 and 2009 [10, 13].This is because texts in different domains containdifferent features that computers need to learn. Thisexplains the need to develop various information ex-traction systems for different domains and differenttasks, see for example, the shared tasks offered byCoNLL for general domain (http://ifarm.nl/signll/conll/), BioCreative for biomedical domains [14–17],and BioNLP Shared Tasks (http://2016.bionlp-st.org/)for biodiversity domains.Extracting morphological characters from taxonomic
descriptions received relatively little attention, but it hasmade significant progress in the past decades. Taylor[18] used grammar rules and a lexicon to extract plantcharacters from several floras. The performance was notscientifically evaluated but estimated at 60–80% recall.Taylor noted also that different parsers (grammar +lexicons) may be needed to parse characters for othertaxon groups, suggesting variations within biodiversity.Diedrich, Foruner, & Milton’s Terminator [19] was aninteractive system that used fuzzy keyword matching, aset of heuristic rules, and a handcrafted dictionary ofstructures, characters and character states. The systemwas evaluated with one random description, whichshowed that 55% of the time a perfect structure-character-state triple was among the first five candidates extracted bythe system. This work suggests that morphological descrip-tions are not as structured as many had expected. Woodet al., [20] sampled 42 descriptions from five plant speciesand their genera described in six different floras in English.They lumped all non-numerical characters, such as colorand shape into one Plant Feature character. Evaluated on18 descriptions, the system showed 66/74% recall/precisionin character extraction. The first system that used a ma-chine learning method to process plant descriptions wasCui [21] but she only parsed the text at the sentence level.Tang and Heidorn [22] subsequently advanced the researchto the character level. They adapted Soderland’s supervisedlearning system, WHISK [23], to extract leaf charactersand fruit/nut shapes from 1600 Flora of North America(FNA) species descriptions. The system scored 33–80% inrecall and 75–100% in precision depending on the cha-racters. The lower recall indicates the training examplesused may not have covered the characters in the test
Cui et al. BMC Bioinformatics (2016) 17:471 Page 3 of 22
descriptions well, suggesting a weakness in the supervisedlearning approach for this task. Cui, Boufford, & Selden[24] showed that an unsupervised learning algorithm wasable to learn 50–93% of the structure and character stateterms directly from text morphological descriptions with-out any training examples. At the same time, Cui [25]showed that linguistic resources – machine-readable lexi-cons, glossaries, or ontologies – for extracting biodiversitycharacters were lacking. She examined three linguistic re-sources for plant domain and one for biology overall, andfound that they lacked coverage of domain terms, an issuethat still exists today: the Phenotype Quality Ontology [26]currently contains 2300+ terms, roughly the same size asFNA Categorical Glossary [27]. In contrast, Huang et al.[28] used CharaParser [29] and extracted over 7000 uniquephenotype terms from 30 volumes of FNA and Flora ofChina alone. These resources also lack agreement in theirterm categorizations (e.g. is apex a structure or a feature?Is erect an orientation or position?). The four glossaries/on-tologies agreed only 19% of the time on a set of 64 corecharacter terms extracted from two plant description re-sources. Research further shows there is a high likelihoodof an unlimited number of character terms needed to de-scribe the entire scope of the biodiversity domains [30].This suggests a supervised learning approach may not bethe best choice for extracting morphological characters[25]. At the same time, learning and growing consensus-based linguistic/knowledge resources for phenotype char-acters of biodiversity are relatively urgent tasks.CharaParser [29] was developed to address these is-
sues. It uses an unsupervised learning algorithm [24] tolearn domain terms and the mature general-purposeparser, Stanford Parser [31], to analyze sentence struc-tures. The learned domain terms inform Stanford Parserwhat the Part of Speech tags for the domain terms areto help it adapt to the domain of morphological descrip-tions. Evaluated on FNA and invertebrate treatises, thesystem performed at 85 to over 90% precision andrecall on character extraction, when provided with acomprehensive glossary.CharaParser semi-automatically extracts character in-
formation from taxonomic descriptions of various taxongroups and in the process involves biologists in categor-izing domain terms (e.g. leg is a structure, erect is orien-tation). The categorized terms are saved in a glossaryand can be used in current and future character extrac-tion processes. Similar to other automated informationextraction systems, software that extracts character in-formation requires external knowledge to extract tar-get information. This external knowledge may comefrom training examples (e.g. expert annotated exam-ples for the software to follow) as employed in Tangand Heidorn [22], extraction rules defined by users,such as for PaleoDeepDive [32], or the application of
glossaries or ontologies [19, 20]. CharaParser was de-signed to extract character information and build do-main glossaries simultaneously. Being domain experts,users are familiar with term usages and are capable ofcategorizing the terms with confidence, especiallywhen source sentences and other contextual informa-tion are made available to them. Furthermore, categor-ical glossaries are reusable knowledge that will benefitother natural language processing applications in thebiodiversity domain and are valuable resources forconstructing phenotype ontologies. In contrast, theutility of training examples and extraction rules areoften limited to the taxon groups or description collec-tions for which they were created [33, 34]. CharaParseralso differs from other information extraction systemsin that it comprehensively extracts all characters foundin a description, not just a predefined set of characters,making it more suitable for generating taxon-charactermatrices from morphological descriptions.Other biodiversity information extraction systems,
including those extracting taxon names, are reviewed inThessen, Cui, and Mozzherin [34]. Information extrac-tion systems for biomedical domains that extract genementions, protein-protein interactions, etc. are reportedand reviewed by the BioCreative workshops [14–17].Work on information extraction from medical records isalso fruitful, for example, in [35, 36]. Related work incomputer vision and image processing algorithms hasextracted characters from high resolution images oforganisms, for example, in [37, 38]. While automaticidentification of taxa has been called for [39], trainingcomputers to score characters from images is challen-ging as algorithms have to be crafted to extract differenttypes of characters and the target characters may beclustered with other (non)characters in images.In this paper, we introduce the Explorer of Taxon
Concepts (ETC) toolkit, which has been developed inthe Exploring Taxon Concepts project to offer a suite ofweb-based software tools for morphological characterextraction, taxon-character matrix building, interactivetaxonomic key generation, and taxonomic concept ana-lyses. The tools attempt to work towards a number ofchallenges, especially on open, computable data, and ad-vance understanding of the evolution of taxonomicnames. The toolkit currently consists of Text Capture(powered by CharaParser [29]), Ontology Building (indevelopment), Matrix Generation, Key Generation, andTaxonomy Comparison (powered by Euler [1]) tools, inaddition to supporting functionalities for input file cre-ation, file management, task management, and user ac-count management. The tools expect input in English.The tools can be used individually or collectively as apipeline. We share the belief of Hardisty and Roberts[40] for projects to “release their service early and update

Cui et al. BMC Bioinformatics (2016) 17:471 Page 4 of 22
often, in response to user feedback”. The ETC tools aremade available when implemented and are updated fre-quently with new or improved features. The ETC Toolkit iscurrently in beta test and publicly available at http://etc.c-s.umb.edu/etcsite/. A different development site is usedinternally to test new functions and conduct evaluationexperiments, including the one reported in this paper.Taxon-character matrices produced by ETC tools are
raw matrices as the character states (i.e., values of the char-acters) are extracted from taxonomic descriptions withoutbeing refined (e.g., as described in [41]) or scored. Somephylogenetic analysis software [2, 3] requires that characterstates be scored, that is, to convert the raw values to sym-bols such as 0, 1, and 2, where 0 = small, 1 =medium, and2 = large, for example. Matrix Converter [42], an opensource program software, can be used to score ETC rawmatrices to phylogenetic matrices. ETC Matrix Generationallows characters described at a higher rank (e.g. family) tobe automatically propagated to lower ranks (e.g. genera)when the characters are missing at the lower ranks. It alsosupports inferred presence and absence characters forstructures (i.e. organs/parts) similar to [43].ETC is the first set of tools, to our knowledge, that
converts morphological descriptions to taxon-charactermatrices. The main differences between this tool andother information extraction systems are:
(1)It does not have a set of pre-defined target charactersto be extracted; rather, it is designed to parse anddiscover all characters described in input descriptions.Given the variety of biodiversity descriptions, thesystem cannot predict the characters it mayencounter.
(2)It targets organism morphological descriptions,but is not limited to any taxon groups.
(3)It takes an unsupervised learning approach toextract characters so its extraction targets are notlimited to those included in the training examplesand the users do not need to provide trainingexamples.
(4)It consolidates extracted characters to a taxon-character matrix, allowing character inheritancefrom higher to lower taxa and absence/presencecharacter reasoning.
(5)Because of (1), it also outputs reusable knowledgeentities such, as categorical glossaries/ontologies(e.g. using the Ontology Building tool not discussedin this paper).
Although still under continued enhancement, ETCText Capture and Matrix Generation tools are used by asmall number of biologists to generate matrices orcompare taxonomic concepts for systematics and evolu-tionary research [1]. In this paper, we introduce these
two tools through a case study, in which body partmeasurements from spider taxonomic descriptions areextracted and consolidated as a taxon-character matrix.We compare matrices generated from original and nor-malized inputs to a hand-curated gold standard matrix.The spider work is an appropriate case study for threereasons. First, the gold standard matrix has been manu-ally curated by experts from the same set of descriptionsprior to this study and is used in actual biological re-search [44–46]. Second, the spider work provides a rela-tively straightforward numerical measurement extractiontask that allows us to focus the discussion on a set ofcommon issues with automated character extraction,leaving the challenges of matrix making with categor-ical characters for a future paper. Third, the spider casestudy permits a comparison experiment design thatillustrates significant improvements normalized de-scriptions could bring to the resulting matrix. It alsoprovides an opportunity to discuss steps that authors oftaxonomic descriptions can take to prevent someextraction issues.The paper is organized as follows: ETC tools used in
this case study are first described, followed by the ex-perimental design, material preparation, matrix gener-ation procedure, and evaluation metrics in the Methodssection. We report the comparison results in the Resultssection and analyze the differences in the Discussionsection, where we also discuss sources of errors andpotential solutions. The paper concludes with futuredevelopment plans.
ETC tools for matrix generationThe ETC toolkit site (Fig. 1) hosts a set of five tools:Text Capture, Ontology Building, Matrix Generation,Key Generation, and Taxonomy Comparison. Thesetools are supported by utilities including Task Manager,File Manager, and user account settings. The site Menu,along with Login/out, Get Started, and Help functions,is always available at the top of the screen regardless ofthe user’s current location. Hovering the mouse overthe Menu will provide access to all functions and toolsprovided by the site.ETC toolkit users can utilize the Text Capture and
Matrix Generation tools to create taxon-character matri-ces from taxonomic descriptions. A high level logic flowof the matrix generation pipeline is displayed in Fig. 2.
Input creationSince ETC Text Capture is only concerned with mor-phological descriptions, it does not directly accept fullarticles as input. The descriptions to be processedshould be manually selected by the user from sourcepublications, and the input files for Text Capture maythen be created in the File Manager before starting the

Fig. 1 ETC site homepage with expanded menu
Cui et al. BMC Bioinformatics (2016) 17:471 Page 5 of 22
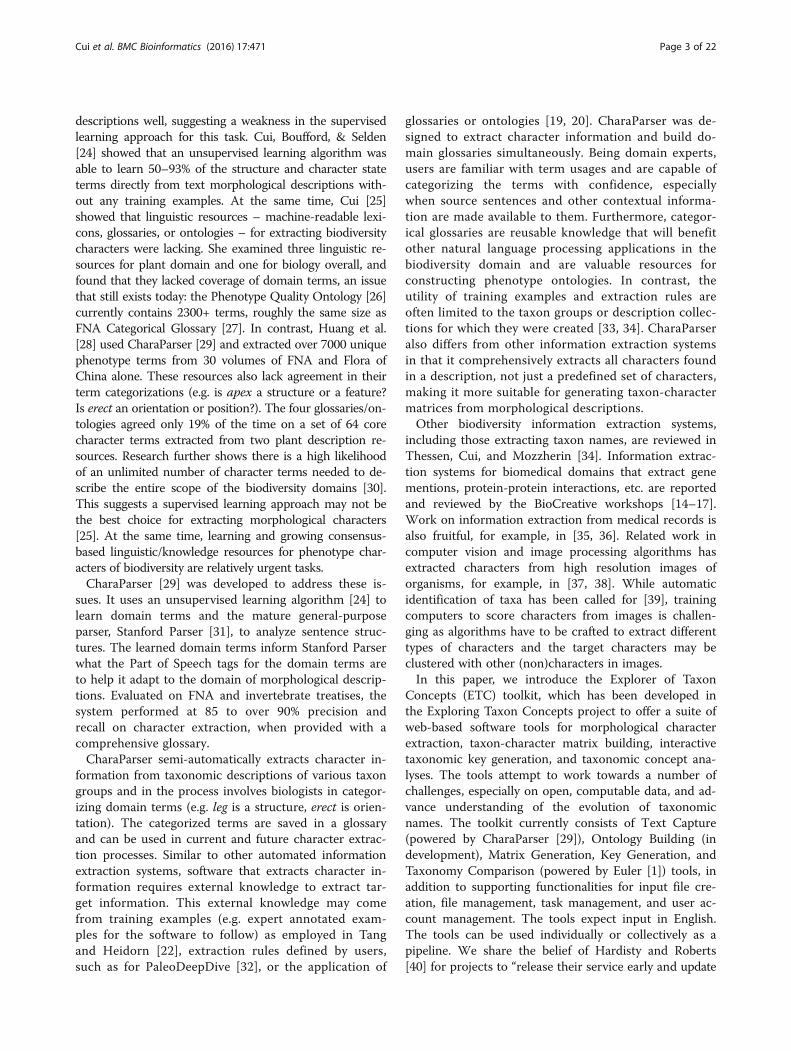
tool or within the first step (Create Input) of runningthe tool, using the Single-File Creation (to create one fileat a time) or the Batch Creation (to create multiple filesat once) tab. Either tab provides users with a form toenter bibliographic information and paste in plain texttaxonomic descriptions, but in Batch Creation, users canformat multiple descriptions according to the instruc-tions and paste them into the Taxonomic TreatmentArea section to generate multiple input files (Fig. 3).The Input Creation function wraps bibliographic infor-
mation and descriptions with XML (Extensible MarkupLanguage) tags [47] required by the Text Capture tool.Input files are saved in the File Manager, where the con-tent of a file may be viewed/edited, as shown in Fig. 4.
Text capture toolThe Text Capture tool employs seven steps to processtaxonomic descriptions: Create Input (mentioned above),Define Task, and Preprocess are the preparation steps;Learn, Review, and Parse are processing steps; and Outputis the last step (Fig. 9). The Learn and Parse steps arecomputationally intensive (for algorithmic details, see
Fig. 2 ETC logic flow for generating matrix
[29]), while the Review step is where the user interactswith the system to review and categorize character-relatedterms for the system. These categorizations are reusablefor future tasks. In a description, the Text Capture toolannotates structures (labelled as “biological_entity”), char-acters, character values, and relationships among struc-tures. Figure 9 shows an example of an output file withdetailed annotations in XML, conforming to the ETCoutput schema [48]. These annotations are used by theMatrix Generation tool to produce a matrix. By compar-ing the XML input (Fig. 4) and the output (Fig. 9), onecan see the Text Capture tool breaks down the textdescriptions into a series of characters marked up in XML(Note: reading the XML file details is inconsequential tounderstanding the remainder of the paper).Users start a Text Capture task by generating input
files (Create Input, described above) and then define thetask by assigning it a name and selecting appropriatesettings (Define Task, Fig. 5). The task name is used toname output folders and track the progress of the task.Tasks may be performed asynchronously and users arenotified via email or in the Task Manager when the task
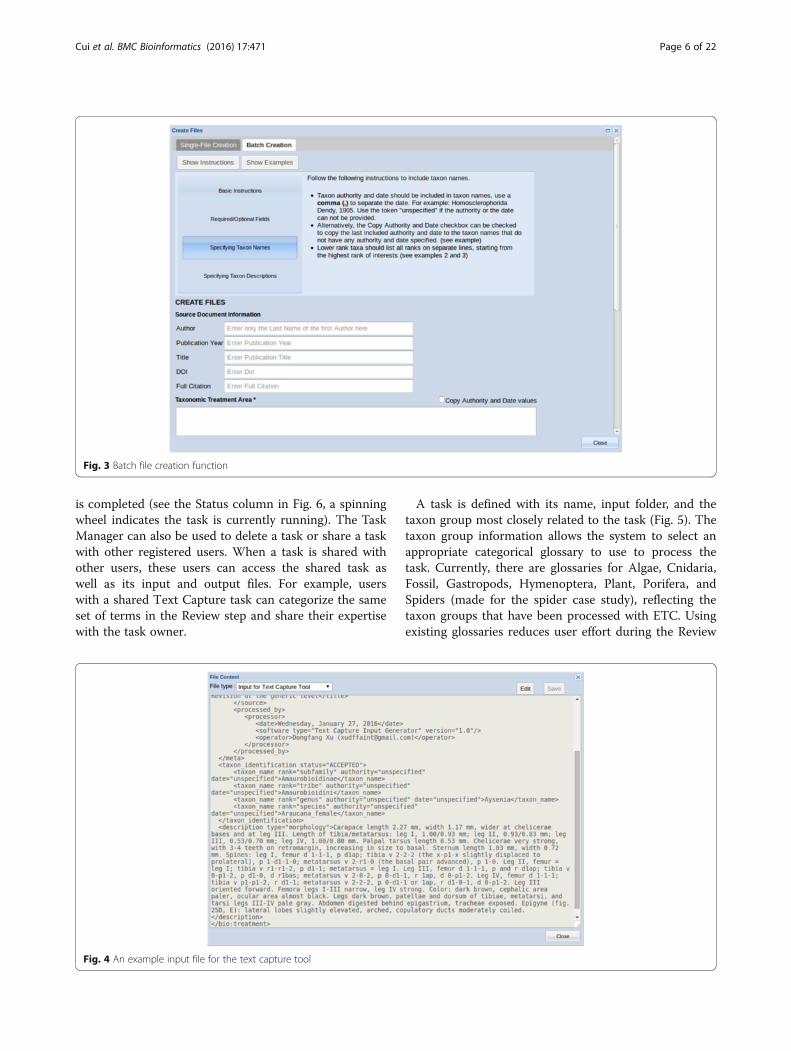
Fig. 3 Batch file creation function
Cui et al. BMC Bioinformatics (2016) 17:471 Page 6 of 22
is completed (see the Status column in Fig. 6, a spinningwheel indicates the task is currently running). The TaskManager can also be used to delete a task or share a taskwith other registered users. When a task is shared withother users, these users can access the shared task aswell as its input and output files. For example, userswith a shared Text Capture task can categorize the sameset of terms in the Review step and share their expertisewith the task owner.
Fig. 4 An example input file for the text capture tool
A task is defined with its name, input folder, and thetaxon group most closely related to the task (Fig. 5). Thetaxon group information allows the system to select anappropriate categorical glossary to use to process thetask. Currently, there are glossaries for Algae, Cnidaria,Fossil, Gastropods, Hymenoptera, Plant, Porifera, andSpiders (made for the spider case study), reflecting thetaxon groups that have been processed with ETC. Usingexisting glossaries reduces user effort during the Review

Fig. 5 The define task step in the text capture tool
Cui et al. BMC Bioinformatics (2016) 17:471 Page 7 of 22
step. If ETC does not have a needed glossary, the UseEmpty Glossary option will make Text Capture learn theterminology from scratch. With the user’s permission,categorizations are exported to OTO (Ontology TermOrganizer) [28], reviewed by multiple domain experts,integrated into ETC categorical glossaries, and madepublicly available at the ETC Glossary Git Repository[49]. The user’s ownership of the terms set and its cate-gorizations is acknowledged in OTO and in the finalglossary. The linkage of the ETC Text Capture tool toOTO allows the collective and incremental building ofconsensus-based domain controlled vocabularies fromsource descriptions.The Preprocess step checks for editing errors in the
input description text for the user to correct (i.e., un-matched brackets). In the Learn step, the tool analyzesinput descriptions and categorizes terms as structures,
Fig. 6 ETC task manager. Shown five tasks with their names (Name), task s(Task Type), and task progress/current step (Status). The green spinning wh
characters/states, and other terms. With the built-in cat-egorical glossary, it further categorizes character/stateterms (e.g., round, large) to specific categories, such asshape and size. Users are then presented with a screenin the Review step to examine system categorizationsand categorize remaining terms (Fig. 7). Numericalvalues are handled automatically by the software and arenot presented for review.In the Review interface (Fig. 7), terms to be catego-
rized appear in the pane on the left, while categorizedterms are in the category boxes on the right. Tocategorize a term, the user can drag and drop the termon the heading of its proper category, or use the drop-down menu invoked by right-clicking on the term. Theuser can indicate two terms are synonyms by droppingone on top of the other, making the latter a primaryterm (called “preferred term” or “label” in controlled
tart time (Created), how the tasks are shared (Access), type of taskseel indicates the task is currently running at a specific step

Fig. 7 The review step in the text capture tool
Cui et al. BMC Bioinformatics (2016) 17:471 Page 8 of 22
vocabularies or ontologies). This signals the software toreplace occurrences of the synonyms with the primaryterm in the output, making the matrix result cleaner andless sparse. Terms that are neither structures nor charac-ters/states should be left uncategorized in the left pane.The categories are used in Text Capture tool as a flat listof categories without hierarchical relationships. Severaluser-friendly features are provided: users can add/re-move/merge categories, multiple terms can be selectedand categorized to one category as a batch, missingterms can be added, misspelled terms can be corrected,terms can be marked as “not useful” and grayed out, andcomments can be left on a term. The Term Informationpane located at the lower portion of the screen providesuseful information about a term. Clicking on a termdisplays its current categories in the Location tab, itssource sentences in the Context tab, and its matchingentries from user selected ontologies in the Ontologiestab. The user can make their ontology selections fromNCBO BioPortal [50] using the Ontologies menu. TheFile menu allows users to download their categorizationresults or upload a set of categorized terms to thesystem (Fig. 8).The Review stage is the only step where substantial
user input is needed. Term categorizations affect the for-mulation of characters in the final matrix. For example,if long is categorized as a shape, the matrix will containcharacters such as “leg shape: long”, as opposed to long
as a size, which results in “leg size: long”. In the spidercase study presented in this paper, our focus was onnumerical measurements; numerical values do not needto be categorized by users, thus, the importance of theReview step is minimized in this particular case.After the Review step, the system parses the descrip-
tions and produces valid XML files (Fig. 9) with struc-ture and character information finely marked upaccording to the ETC output schema [48]. This schemawas developed because existing XML schemas, such asTaxPub [51] or NeXML [52] cannot accommodate thefine-grained markup produced by Text Capture. Fur-thermore, the XML schemas used in ETC are intendedfor internal use only, not for data exchange amongdifferent systems.
Matrix generation toolThe output XML files from Text Capture are used as in-put for the Matrix Generation tool, which consolidatesthe annotated character information into a taxon-character matrix for users to review and edit (Figs. 11,12 and 13). The matrix output is a CSV (comma sepa-rated values) file (Fig. 14).Matrix Generation consists of five steps: Select Input,
Define Task, Generate, Review, and Output, with Generatebeing the key processing step.The Select Input and Define Tasks steps (Fig. 10) serve
similar functions as the first two steps in Text Capture.

Fig. 8 Importing term categorizations in the text capture review step
Cui et al. BMC Bioinformatics (2016) 17:471 Page 9 of 22
The Inherit Values enables automatic propagation ofcharacters from a higher taxon to lower taxon members.The Infer Absent/Present States option enables thesoftware to infer the presence or absence of organs andother anatomical parts, aside from what is stated expli-citly within the descriptions. For example, if a leg cuspleis present, then the leg must be present, as the SpiderOntology [53] indicates leg cusple is part of some legarticle and leg article is part of some leg.The Generate step extracts character information from
XML files and assembles them into a taxon-character
Fig. 9 Example output file of the text capture tool
matrix. The matrix will contain more characters/statesthan those explicitly stated in the descriptions when theInherit and/or Infer option is selected.After the matrix is produced, users proceed to the Re-
view step, which has two views: the Preview and SelectionView and Spreadsheet View. The Preview and SelectionView provides an overview of the taxa and charactersproduced and allows users to select a set to upload and re-view (Fig. 11). The Spreadsheet View presents the selectedtaxa and characters in a matrix format with taxa displayedas rows and characters as columns (Fig. 12).

Fig. 10 The define task step in the matrix generation tool
Cui et al. BMC Bioinformatics (2016) 17:471 Page 10 of 22
Web browsers cannot handle large spreadsheets effi-ciently, therefore it is recommended to review in sec-tions matrices larger than 500 taxa and 500 characters.The selection feature is also useful when the user isinterested in only a portion of extracted characters, forexample, numerical characters in the spider case study.
Fig. 11 The preview and selection view at the matrix review step
In the Preview and Selection view (Fig. 11), users arepresented with an interface where the left half of thescreen is dedicated to information about taxa and theright half to character information. The leftmost panelallows users to select taxa of interest. By right-clickingon each taxon, users may add, modify, remove, or
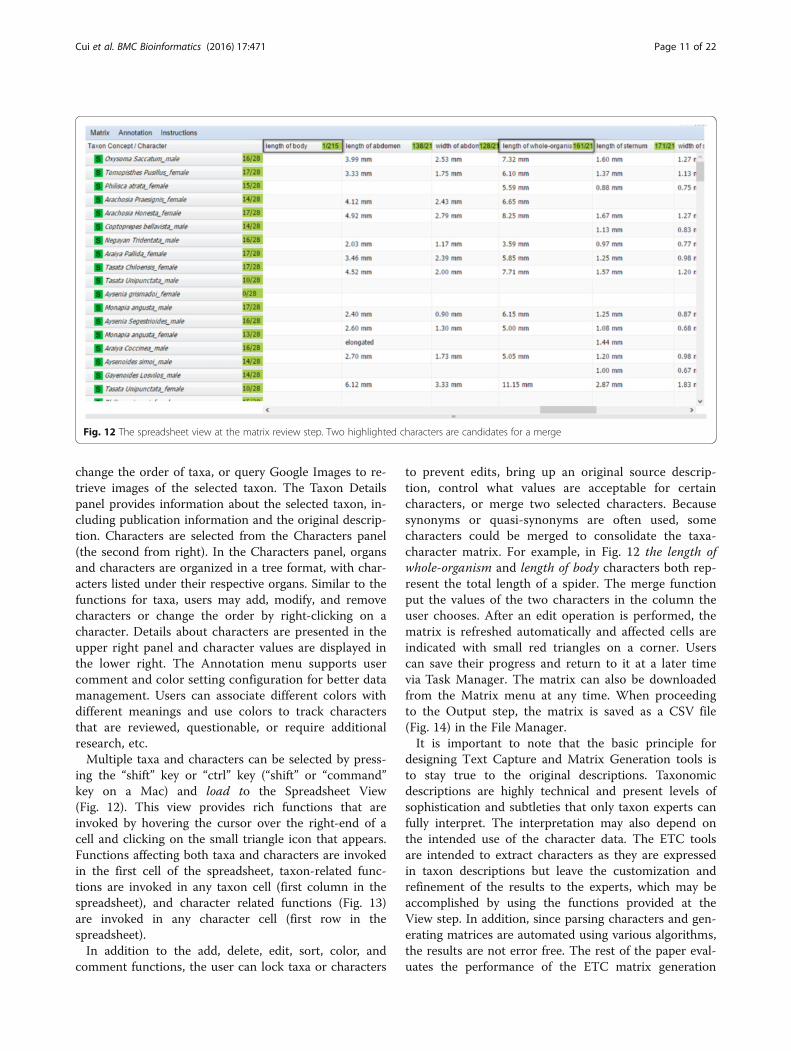
Fig. 12 The spreadsheet view at the matrix review step. Two highlighted characters are candidates for a merge
Cui et al. BMC Bioinformatics (2016) 17:471 Page 11 of 22
change the order of taxa, or query Google Images to re-trieve images of the selected taxon. The Taxon Detailspanel provides information about the selected taxon, in-cluding publication information and the original descrip-tion. Characters are selected from the Characters panel(the second from right). In the Characters panel, organsand characters are organized in a tree format, with char-acters listed under their respective organs. Similar to thefunctions for taxa, users may add, modify, and removecharacters or change the order by right-clicking on acharacter. Details about characters are presented in theupper right panel and character values are displayed inthe lower right. The Annotation menu supports usercomment and color setting configuration for better datamanagement. Users can associate different colors withdifferent meanings and use colors to track charactersthat are reviewed, questionable, or require additionalresearch, etc.Multiple taxa and characters can be selected by press-
ing the “shift” key or “ctrl” key (“shift” or “command”key on a Mac) and load to the Spreadsheet View(Fig. 12). This view provides rich functions that areinvoked by hovering the cursor over the right-end of acell and clicking on the small triangle icon that appears.Functions affecting both taxa and characters are invokedin the first cell of the spreadsheet, taxon-related func-tions are invoked in any taxon cell (first column in thespreadsheet), and character related functions (Fig. 13)are invoked in any character cell (first row in thespreadsheet).In addition to the add, delete, edit, sort, color, and
comment functions, the user can lock taxa or characters
to prevent edits, bring up an original source descrip-tion, control what values are acceptable for certaincharacters, or merge two selected characters. Becausesynonyms or quasi-synonyms are often used, somecharacters could be merged to consolidate the taxa-character matrix. For example, in Fig. 12 the length ofwhole-organism and length of body characters both rep-resent the total length of a spider. The merge functionput the values of the two characters in the column theuser chooses. After an edit operation is performed, thematrix is refreshed automatically and affected cells areindicated with small red triangles on a corner. Userscan save their progress and return to it at a later timevia Task Manager. The matrix can also be downloadedfrom the Matrix menu at any time. When proceedingto the Output step, the matrix is saved as a CSV file(Fig. 14) in the File Manager.It is important to note that the basic principle for
designing Text Capture and Matrix Generation tools isto stay true to the original descriptions. Taxonomicdescriptions are highly technical and present levels ofsophistication and subtleties that only taxon experts canfully interpret. The interpretation may also depend onthe intended use of the character data. The ETC toolsare intended to extract characters as they are expressedin taxon descriptions but leave the customization andrefinement of the results to the experts, which may beaccomplished by using the functions provided at theView step. In addition, since parsing characters and gen-erating matrices are automated using various algorithms,the results are not error free. The rest of the paper eval-uates the performance of the ETC matrix generation

Fig. 13 Character-related functions for the first column of the spreadsheet
Cui et al. BMC Bioinformatics (2016) 17:471 Page 12 of 22
pipeline using the spider body part measurement as acase study.
MethodsExperimental designThe experiment was designed as a comparison study.The same ETC tools and same settings were applied tothe set of original input descriptions and the normalizedset, then machine-generated matrices were compared to
Fig. 14 Example output (CSV) file of the matrix generation tool
a gold standard matrix. Both versions of the inputdescriptions were generated from the same source publi-cations on spiders (see the Materials section). Thehypothesis was that the normalized input would resultin a taxon-character matrix that is more similar to thegold standard than when using the original input. Theoriginal input and the normalized input used in the ex-periment are included in the Additional file 1 as OriginalInput and Additional file 2 as Normalized Input.

Cui et al. BMC Bioinformatics (2016) 17:471 Page 13 of 22
The Gold Standard matrix was built by the three spidersystematists who co-authored the paper. The building ofthe gold standard matrix was blind to all the other co-authors. Two other co-authors normalized the text, andone of them generated the matrices using ETC tools.
MaterialsThe gold standard matrix was derived from a matrixinitially composed in Ramírez [44] and successivelyenriched/used in Aisen and Ramírez [45] and Labarqueet al. [46]. This expert-curated matrix contained 234descriptions of exemplars (an exemplar is a male or a fe-male of a given species) of 122 species (not all specieshave both exemplars known) and 21 characters. To cre-ate the gold standard matrix for this study, 26 specieswith no descriptions or with non-English descriptionsand three redundant characters were removed from theexpert matrix. In addition, character names in the expertmatrix were standardized to the character of structurestyle (e.g., “length of tibia”), making them comparableto machine-generated character names. When thismatrix was used to evaluate the machine-generatedmatrices, a handful of incorrect states/values werefound and subsequently corrected. The final goldstandard matrix consisted of 188 exemplars of 96 spe-cies, 18 characters and 2921 character states. The goldstandard matrix is included in the Additional file 3 asGold Standard Matrix.All 799 terms representing anatomical parts in the
Spider Ontology [53] and 6970 terms representing char-acter/character states from the Plant Glossary [54] wereused to create a new categorical glossary for spiders.Although the character/character state terms from thePlant Glossary do not affect the machine-generatednumerical measurement matrices, they were included toreduce the number of terms for review/categorizationin Text Capture. The spider glossary files, one forterm categorization and the other for synonyms, canbe found at: https://github.com/biosemantics/glossaries/tree/master/Spider.Two versions of the input descriptions, original and
normalized, were generated from the source publicationsprovided by the spider systematist co-authors. Contentof male and female exemplar descriptions of the spiderspecies were manually copied from PDF (Portable Docu-ment Format) files and formatted as required by theETC Input Creation utility. Errors in pasted text weremanually corrected (e.g., an “=” being pasted as a “5”),and different characters appearing as hyphens (“-”) wereconverted to standard ASCII (American Standard Codefor Information Interchange) hyphens. The resultingclean text descriptions were considered as the originalinput. A normalized version was formed by adding omit-ted measurement units (i.e., “mm”) and the omitted
word “leg” to the original input. For example, an originalstatement “tibia/metatarsus: I, 0.42/0.32” was normalizedto “tibia/metatarsus:leg I, 0.42/0.32mm”. Two of the co-authors created the normalized input programmaticallyand independently cross-validated the results. Whilenormalization is a typical step in text processing, thespecific normalization step taken in this experiment wasmeant to put the missing information (units and legs)back to the text to make the descriptions more self-contained. In the results we examine the differentperformance results from using the self-contained (nor-malized) vs. the original descriptions. The automaticmodification of text method used in [55] (replacing “…”with real drug names) achieved the same goal of makingthe text self-contained.
Generation of the matrices using software toolsThe Input Creation, Text Capture, and Matrix Gener-ation tools on the ETC-development site were used as apipeline to generate a matrix for each of the two inputtexts. For the Text Capture tool, the “Spider” glossarywas used (Fig. 5). Terms pertaining to structures weremostly categorized correctly by the software while somestructure terms, such as “coxae” and “membrane”, weremanually categorized (Fig. 7). Because this study wasprimarily concerned with the numerical measurementsof morphological structures, categorical character terms(e.g., present, robust) were placed in an arbitrarycategory (“architecture”) and essentially ignored. Nosynonyms were made in the Review step. Term categori-zations made in this experiment is included in theAdditional file 4 as Term Categorization. In the MatrixGeneration tool, the Inherit Values and Infer Absent/Present States options were not selected (Fig. 10) becausethey were not relevant for this case study. After morpho-logical characters were extracted by the Matrix Generationtool, body part characters with numerical measurementswere manually selected in the Preview and Selection Viewto form the final output matrix (Fig. 14).
Comparing ETC matrices to the gold standard matrixTo evaluate the effectiveness of the Matrix Generationworkflow, we measured the accuracy of the extractedcharacters, the effort needed to edit the matrices, andthe similarity of the edited matrices to the gold stand-ard matrix.Accuracy measures the correctness of extracted data
items. An extracted data item is correct if it is consistentwith the original description. A data item may be con-sidered correct while not matching the gold standard asthe latter represents the expert’s consolidation andrefinement of original characters present in the de-scriptions. For example, if the system extracts lengthof ii = 1.35 mm from the description I, II, III, IV length:

Cui et al. BMC Bioinformatics (2016) 17:471 Page 14 of 22
1.23, 1.35, 1.27, 1.28 mm, it will be considered correct,even though the gold standard may have length of legii = 1.35 mm. However, if the system extracts size ofii = 1.35 mm, length of ii = 1.35(missing unit), orlength of ii = 1.27 mm, it would be considered wrong.
accuracy ¼ correct data itemsj j = extracted data itemsj j
Edit effort is the minimal number of column-basedmerge, rename, and deletion operations needed to makea machine-generated matrix as similar as possible to thegold standard matrix. Specifically, character columnsmostly containing incorrect values (i.e. values notpresent in the gold standard) are deleted; and charactercolumns mostly containing correct values are eithermerged into a valid column/character (i.e., matchingcharacters present in the gold standard) or renamed witha valid column/character name. Although merge opera-tions place character values under a different charactername, they are not counted again as rename operations.We also note that some characters extracted by the ma-chine need splitting to match the gold standard, for ex-ample, length of tibia/metatarsus = 0.52/0.44 mm needsto be split into length of tibia = 0.52 mm and length ofmetatarsus = 0.44 mm. Since a split character feature hasnot been implemented in the matrix review step, in thisstudy, split operations were counted separately from editeffort. Edit efforts were counted manually. Edits madeon machine-generated matrices are documented inMatrix Edits in the Additional file 5.The similarity of an edited matrix to the gold standard is
evaluated via precision, recall, and F1 metrics that are rou-tinely used in the evaluation of information retrieval andinformation extraction systems. Precision is the proportionof machine-generated data items that match the goldstandard. Recall is the proportion of gold standard dataitems that are extracted by the machine. In other words,precision measures the soundness of machine-generateditems, while recall measures the exhaustiveness of themachine results as compared to the gold standard. Bothmetrics result in a value between 0 and 1. If the machine-generated matrix is identical to the gold standard, bothprecision and recall will have a value of 1. The F1 score isthe harmonic mean of precision and recall, meaning it putsequal weights to precision and recall. To summarize:
Table 1 Summary of the matrices generated from the original and
Original input matrix
Before edits After edit
Rows/Exemplars 188 188
Columns/Characters 41 18
Non-empty cells 2942 2864
Fullness of matrix (%) 38.17% populated 85.00% p
Precision = |matched data items| / |data items outputby the software, excluding null values|Recall = |matched data items| / |data items in the goldstandard matrix, including null values|F1 score = 2 * Precision * Recall / (Precision + Recall)
Note that accuracy is based on the correctness of theextracted characters as compared to the input text, whileprecision is based on the “matchness” of the extractedcharacters to the gold standard.
ResultsTable 1 describes the matrices generated from the ori-ginal and normalized inputs, before and after the edits.For all matrices, the number of rows is 188, consistentwith the input exemplars. The matrix from the originalinput initially had 41 characters and 2942 non-emptydata items, making the matrix 38.17% populated, whilethe matrix from the normalized input initially had 43characters and 2914 non-empty data items, or 36.05%populated. After the edits, both matrices were betterpopulated at approximately 85%.Table 2 below summarizes the accuracy, edit effort,
and precision/recall-based similarity scores for thematrices generated from the original input and the nor-malized input. The pre-edit accuracy of the matrix fromthe original input is 1.46%, and after 46 column-basededits, its precision, recall, and F1 scores were 99.79,98.82, and 99.35% respectively. The pre-edit accuracy ofthe matrix from the normalized input was 98.83%, andafter 28 edits, its precision, recall, and F1 scores were99.91, 99.65, and 99.78%, respectively. The pre-edit ac-curacy of normalized input matrix was 67 times betterthan that of the original input matrix, and normalizedinput matrix required 39% less edit effort.Table 3 summarizes the edits made to the two matri-
ces. Details are included in Tables 4 and 5. For thematrix resulting from the original input, eight of the 41characters were first split because they contained dataitems with combined character values. After that, 46edits (=9 characters (i.e., columns) deleted + 15 charac-ters renamed + 22 characters merged) were made on thematrix. These edits affected 3593 values in the matrix.Three characters out of the original 41 were retainedwithout edits.
the normalized inputs
Normalized input matrix
s Before edits After edits
188 188
43 18
2914 2913
opulated 36.05% populated 86.08% populated

Table 2 Accuracy, edit effort, and precision/recall/F1-basedsimilarity scores of the matrices generated from the original andnormalized inputs
Original input matrix Normalized input matrix
Pre-edit accuracy (%) 1.46% = 43/2942 98.83% = 2880/2914
Number of edits (splits) 46 (8) 28 (3)
Post-edit precision (%) 99.79% 99.91%
Post-edit recall (%) 98.92% 99.65%
Post-edit F1 score (%) 99.35% 99.78%
Cui et al. BMC Bioinformatics (2016) 17:471 Page 15 of 22
For the matrix generated from the normalized in-put, three of the 43 initial characters were split atfirst, and then 28 edits were made (including threedeletions and 25 merges), with a total of 162 valuesaffected by the edits.Precision, recall, and F1 scores of the edited matrices
as compared to the gold standard are shown in Tables 6,7, 8 and 9. Tables 6 and 7 display the exemplar-basedand character-based precision and recall scores of thematrix generated from the original input, while Tables 8and 9 show the scores of the matrix generated from thenormalized input. The scores are very similar betweenthe two matrices. In Table 2, the precision/recall scoresof all data items in post-edit matrices from the originaland normalized inputs are 99.79%/98.92% and 99.91%/99.65%, respectively. It indicates that 0.21% and 0.09% ofthe data items in these two matrices are incorrect,respectively, and 1.08% and 0.35% of the data items in thegold matrix were missing from these matrices, respectively.
DiscussionDomain conventions and automated character extractionThe accuracy scores of the original input and normalizedinput matrices were dramatically different, 1.46% vs.98.83%, respectively (Table 2). The lower accuracy of thedata items extracted from the original input can almostbe exclusively attributed to its omitting units in mea-surements (“mm”). Measurement units and other in-dicators, such as “long”, “length”, and “wide”, are amongthe clues the software uses to identify measurement
Table 3 Summary of edit efforts made to the original andnormalized input matrices
Original inputmatrix
Normalized inputmatrix
Splits 8 3
Deletions 9 3
Renames 15 0
Merges 22 25
Unedited 3 18
Values affected by edits 3593 162
characters. When measurement indicators are absent,the software labels the character with a more generallabel (e.g. “size”) in place of a more specific label of“length” or “width”. When both units and measurementindicator clues are absent, as was the case for the ma-jority of the numerical values in the original input, thesoftware could only name the character with the mostgeneral label (“quantity”). These quantity charactersaccount for the difference in accuracy scores, which isalso reflected in the rename and merge edits for thematrix (Table 4).Adding the word “leg” in front of Roman numerals “I”,
“II”, “III”, or “IV” in the original input did not affect theaccuracy score because other cues in the text can beused in its place (in this case, the categorization ofRoman numerals as structures at the Term Review step).One can take this as a sign of the system’s robustness,but it should be noted that omitting “leg” made charac-ter names for the leg measurements less understandablefor the user (e.g., “length of ii”), and introduced termcategorizations that are domain specific (e.g., categoriz-ing Roman numerals as structures). We would recom-mend that future description authors not omit the word“leg”, or other structure terms (e.g., ribs) under similarcircumstances.The performance differences between normalized and
original descriptions in terms of accuracy and edit ef-forts shows less self-contained morphological descrip-tions present a challenge for automated characterextraction. It may be argued that software can be madefor users to provide missing information during dataprocessing. This approach is not viable in our task for atleast three reasons: (1) It is infeasible to collect all spe-cial conventions used in describing biodiversity and newconventions may continue to be introduced (e.g., [41]);(2) accommodating a large number of special conven-tions useful only for specific domains harms the usabilityof the software for all users – it requires all users to beaware of conventions used in other domains to discernthe ones that are applicable to the task at hand; (3) italso makes the software difficult to develop or maintainin the long run, especially in the presence of conflictingconventions. To assist with automated character extrac-tion and reduce human effort, we encourage systematicsauthors to write more self-contained morphological de-scriptions [56].Although not included in this experiment, we would
like to note that descriptions codified according to cer-tain conventions are difficult to parse automatically forthe same reason – the needed information on how to in-terpret them is not in the description text. For example,“Spines: leg I, femur d 1-1-1, p d1ap; tibia v 2-2-2 (thex-p1-x displaced to prolateral), p 1-1-1 or 1-0-1, r 1-0-1;metatarsus v 2-0-2, p d1-d1-0-1, r 0-1-0, d 0-p1-0.”

Table 4 Edit operations performed in the matrix generated from the original input
Edit type Characters affected Operations Edit effort
Delete quantity of leg [15], character of carapace [4], length of carapace [147],width of carapace [76], length of abdomen [133], length of sternum [168],quantity of iii tibia/metatarsu [1], quantity of iii [8], quantity of leg-3 [1]
delete column 9
Rename quantity of whole-organism [162] Rename as "length of whole-organism (new)" 1
quantity of carapace (split, length) [139] Rename as "length of carapace (new)" 1
quantity of carapace (split, width) [129] Rename as "width of carapace (new)" 1
quantity of abdomen (split, length) [133] Rename as "length of abdomen (new)" 1
quantity of sternum (split, length) [165] Rename as "length of sternum (new)" 1
quantity of spiracle-epigastrium [138] Rename as "distance of spiracle-epigastrium (new)" 1
quantity of spiracle-spinneret [155] Rename as "distance of spiracle-spinneret (new)" 1
quantity of i tibia [189] Rename as "length of leg i tibia (new)" 1
quantity of i metatarsus [189] Rename as "length of leg i metatarsus (new)" 1
quantity of ii tibia [188] Rename as "length of leg ii tibia (new)" 1
quantity of ii metatarsus [188] Rename as "length of leg ii metatarsus (new)" 1
quantity of iii tibia [185] Rename as "length of leg iii tibia (new)" 1
quantity of iii metatarsus [185] Rename as "length of leg iii metatarsus (new)" 1
quantity of iv tibia [186] Rename as "length of leg iv tibia (new)" 1
quantity of iv metatarsus [186] Rename as "length of leg iv metatarsus (new)" 1
Merge length of whole-organism (new) [162], quantity of body [1] Merge into length of whole-organism (new)" 1
length of carapace(new) [129], quantity of prosoma(split, length) [37],quantity of thoracic-groove [6], quantity of cephalic-area [1], quantityof front [2], quantity of ocular-area(split, length) [2]
Merge into “length of carapace (new)” 5
width of carapace (new) [139], quantity of prosoma(split, width) [37],quantity of ocular-area(split, width) [1]
Merge into “width of carapace (new)” 2
length of palpal-tarsus [5]*, quantity of palpal-tarsus [57] Merge into “length of palpal-tarsus” 1
length of abdomen (new) [133], quantity of opisthosomum(split, length) [44] Merge into “length of abdomen (new)” 1
width of abdomen [2]*, quantity of opisthosomum(split, width) [7],quantity of abdomen (split, width) [128]
Merge into “width of abdomen” 2
quantity of sternum (split, width) [160], width of sternum [1]* Merge into “width of sternum” 1
distance of spiracle-spinneret (new) [155], quantity of spiracle [1],quantity of spiracle spinneret [2]
Merge into “distance of spinneret-spiracle(new)” 2
quantity of epigastric-furrow [1], distance of spiracle-epigastrium (new) [138],quantity of epigastrium-epigastrium [1], quantity of epigastrium-spiracle [20]
Merge into “distance of epigastrium-spiracle (new)” 3
length of leg ii tibia (new) [188], quantity of ii (split, tibia) [5] Merge into ”length of leg ii tibia(new)“ 1
length of leg ii metatarsus (new) [188], quantity of ii (split, metatarsus) [3] Merge into “length of leg ii metatarsus(new)” 1
length of leg iv tibia (new) [186], quantity of iv (split, tibia) [4] Merge into "length of leg iv tibia(new)" 1
length of leg iv metatarsus (new) [186], quantity of iv (split, metatarsus) [3] Merge into "length of leg iv metatarsus(new)" 1
Total edits 46
The numbers in “[]” indicate the number of values affected by an edit operation. Characters indicated with an “*” were retained without edits
Cui et al. BMC Bioinformatics (2016) 17:471 Page 16 of 22
Matrix generation pipeline performanceAlthough both machine generated matrices had becomevery similar to the gold standard matrix after editing(99% precision and recall, Table 2), the matrix from theoriginal input needed nine deletions, 15 renames, and 22merges while the matrix from the normalized inputneeded much fewer edits (three deletions, 0 renames,and 25 merges). The latter edits affected fewer values
(see the counts in “[]” in Tables 4 and 5): it was oftenthe case a few values were merged to a correct characteralready present, suggesting the matrix generated fromthe normalized input was already quite similar to thegold standard. The merges were sometimes needed forcharacters that were correctly extracted. For example,length of abdomen and length of opisthosoma were dis-tinct characters correctly extracted from the original

Table 5 Edit operations performed in the matrix generated from the normalized input
Edit type Characters affected Operation Edit effort
Merge 1. length of whole-organism [161], length of body$1 [1] Merge into length of whole-organism 1
2. length of carapace [147], size of carapace [4], length of prosoma$2 [37],length of ocular-area [1], length of thoracic-groove [2], length of cephalic-area [1]
Merge into length of carapace 5
3. width of carapace [152], width of prosoma$3 [37], width of ocular-area [1],width of thoracic-groove [2], width of cephalic-area [1]
Merge into width of carapace 4
4. length of abdomen [138], length of opisthosomum$4 [44] Merge into length of abdomen 1
5. width of abdomen [128], width of opisthosomum$5 [6] Merge into width of abdomen 1
6. location of spiracle [1], size of spiracle spinneret [2], distance of spinneret-spiracle [155] Merge into distance of spinneret-spiracle 2
7. distance of epigastric-furrow [1], distance of epigastrium-epigastrium$6 [1],distance of epigastrium-spiracle [158]
Merge into distance of epigastrium-spiracle 2
8. length of leg-2 tibia [189], length of leg-2 [1], size_or_shape of leg-2 (split, tibia) [2] Merge into length of leg-2 tibia 2
9. length of leg-2 metatarsus [189], size_or_shape of leg-2 (split, metatarsus) [2] Merge into length of leg-2 metatarsus 1
10. length of leg-iii tibia [186], length of leg-ii [1]i, size_or_shape of leg-iii(split, tibia) [1]
Merge into length of leg-iii tibia 2
11. length of leg-iii metatarsus [186], size_or_shape of leg-iii (split, metatarsus) [1] Merge into length of leg-iii metatarsus 1
12. length of leg-4 tibia [187], length of leg-4 [1], size_or_shape of leg-4 (split) [2] Merge into length of leg-4 tibia 2
13. length of leg-4 metatarsus [187], size_or_shape of leg-4 (split) [2] Merge into length of leg-4 metatarsus 1
Delete 14. length of leg [3] delete length of leg 1
15. size of abdomen [3] (values are non-numerical, e.g. tiny) delete size of abdomen 1
16. length of leg-iii tibia/metatarsu [1] delete length of leg-iii tibia/metatarsu 1
Total edits 28
The numbers in “[]” indicate the number of values affected by an edit operation. The 18 characters in the gold standard were all included in the machine-generatedmatrix. The characters superscripted with “$N” are considered equivalent to a corresponding character in the gold standard, either by their semantic equivalence(i.e.. $1), or by the experts’ decisions (i.e., $2–$6)
Cui et al. BMC Bioinformatics (2016) 17:471 Page 17 of 22
description, but for the specific use of the matrix in[44–46], the spider experts considered them as equiva-lent characters (note: opisthosoma and abdomen werenot treated as synonyms in the Spider Ontology [53]).This phenomenon confirms our design rationale for themerge operation in the matrix review interface. Inaddition, the character distance of epigastrium-epigastrium(Table 5) was also correct according to the original de-scriptions, but the experts identified it as a typo in theoriginal publication (should be epigastrium-spiracle).ETC provides functions to control equivalent character
issues, for example, synonymizing terms or importingsynonyms in the Review step of Text Capture (Fig. 7),and the ETC Ontology Building tool that is being imple-mented. True synonyms can be included in the ontology,while terms that need to be treated as synonyms for acertain task may be synonymized in the Review step.
Table 6 Exemplar-based precision, recall, and F1 scores of thematrix generated from the original input
Mean Sd Min Max Number
Precision 0.9981 0.01063 0.9333 1 188
recall 0.9805 0.05153 0.7222 1 188
F1 score 0.9886 0.03055 0.8387 1 188
Making use of these tools could reduce the effort ofmerging characters during the Matrix Review step.The precision and recall scores (Tables 6, 7, 8, and 9)
of the exemplar-based and character-based evaluation ofedited matrices indicate that character values were ex-tracted from the descriptions correctly (high precision)and not many were missed (high recall), even afterdeletions of some characters. Character/column-basedediting seems to be effective in bringing machine-generated matrices close to the gold standard matrix.The low standard deviations of precision and recallscores in Tables 6 and 8 suggest that the softwareperforms consistently on each exemplar and across allcharacters, as shown by the similar precision and recallscores for each of the characters in Tables 7 and 9.
Error analysesIncorrect decisions in character markup made byText Capture (parse step) propagate into the matricesgenerated. In this section, we discuss the errors andtheir causes, which include one caused by a typo inthe original source PDF file where “width” was misspelledas “with”.ISSUE I: There were several mistakes that led to a
number of merge operations (e.g., in rows two and three

Table 7 Character-based precision and recall of the matrix generated from the original input
Character Precision Recall F1-score Character Precision Recall F1-score
Length of whole-organism 0.9947 0.9894 0.992 distance of spinneret-spiracle 1 1 1
Length of carapace 0.9883 0.8989 0.9415 length of leg-i tibia 1 0.9947 0.9973
Width of carapace 1 0.9149 0.9556 length of leg-i metatarsus 1 0.9947 0.9973
Length of palpal-tarsus 1 1 1 length of leg-ii tibia 1 1 1
Length of sternum 1 0.9681 0.9838 length of leg-ii metatarsus 1 1 1
Width of sternum 1 0.9787 0.9892 length of leg-iii tibia 1 0.9787 0.9892
Length of abdomen 0.9836 0.9574 0.9704 length of leg-iii metatarsus 1 0.9840 0.9920
Width of abdomen 0.9947 0.9894 0.992 length of leg-iv tibia 1 0.9947 0.9973
Distance of epigastrium-spiracle 1 1 1 length of leg-iv metatarsus 1 1 1
Cui et al. BMC Bioinformatics (2016) 17:471 Page 18 of 22
in Table 5). If analyzed carefully, it can be seen thedescription sentences were ambiguously written. Threesuch examples are given below:
1. Carapace globose, thoracic groove on depressedarea, length 3.27 mm, width 2.70 mm.
2. Carapace very wide in front, ocular area slightlyprotruding, length 2.30 mm, width 1.57 mm.
3. Abdomen extremely elongate, legs very long,including leg III. Total length 7.58 mm.
In each example, the length/width measurementscould be associated with any structure shown in bold (athoracic groove or ocular area could have a length and awidth, and leg iii could have a total length). This type ofambiguity is difficult to resolve, even by a non-experthuman reader. These sentences can be simply revised asbelow to remove the ambiguity.
1. (Revised) Carapace globose, length 3.27 mm, width2.70 mm, thoracic groove on depressed area.
2. (Revised) Carapace very wide in front, length2.30 mm, width 1.57 mm, ocular area slightlyprotruding.
3. (Revised) Total length 7.58 mm. Abdomen extremelyelongate, legs very long, including leg III.
Semantic ambiguity in taxonomic descriptions is awidespread issue, as we have seen it in all taxon groupswe have processed. Sometimes a domain expert is notable to interpret a descriptive statement with certainty,
Table 8 Exemplar-based precision, recall, and F1 scores of thematrix generated from the normalized input
Mean Sd Min Max Number
Precision 0.9991 0.00698 0.9444 1 188
Recall 0.9965 0.01872 0.8333 1 188
F1 score 0.9977 0.01158 0.9091 1 188
however, it is not always easy for description authors tonotice the ambiguity.ISSUE II: Another error was caused by the software’s
inability to translate the following sentence to “distanceof spiracle-epigastrium” (this is related to the mergeoperation on row 7, Table 5).
4. Epigastric furrow 0.74 mm from tracheal spiracle.
This translation requires several approximations: epi-gastric furrow approximates epigastrium, and trachealspiracle approximates spiracle. As indicated before,such approximations are purposefully excluded fromthe design goals of the system; however, the softwaredid recognize that some distance is expressed in thesentence.ISSUE III: Text Capture needs to be improved in its
ability to accurately generate individual characters fromcompound expressions similar to those included inSentences 5 and 6 below. The problem was alleviated tosome extent by the normalizations, reducing the numberof splits by over 50% (from eight splits in the originalversion down to three in normalized version).
5. Length of tibia/metatarsus: leg I, 0.52/0.44 mm;leg II, 0.50/0.40 mm; leg III, 0.24 mm; leg IV, 0.40/0.30 mm.
6. Tibial lengths and indices: leg I missing; leg II1.73 mm,7; leg III0.96 mm, 13; leg IV2.02 mm, 7.
Sentences 5 and 6 are challenging because the charac-ters (e.g., length of leg i tibia) and their values (e.g.0.52 mm) are separated by other elements and they re-quire information external to the text itself for accurateinterpretation, for example, knowing the tibia and meta-tarsus are parts of each leg, knowing the correspondenceof multiple characters (e.g., length and index) to theirlisted values, and knowing how to deal with exceptions,such as missing values (e.g., Sentence 5, the length valuefor leg iii metatarsus is missing). While specific rules can

Table 9 Character-based precision, recall, and F1 scores of the matrix generated from the normalized input
Character Precision Recall F1 score Character Precision Recall F1 score
Length of whole-organism 1 0.9947 0.9973 distance of spinneret-spiracle 1 1 1
Length of carapace 1 0.9947 0.9973 length of leg-i tibia 1 0.9947 0.9973
Width of carapace 0.9947 0.9894 0.992 length of leg-i metatarsus 1 0.9947 0.9973
Length of palpal-tarsus 1 1 1 length of leg-ii tibia 1 1 1
Length of sternum 1 1 1 length of leg-ii metatarsus 1 1 1
Width of sternum 1 0.9947 0.9973 length of leg-iii tibia 1 0.9947 0.9973
Length of abdomen 0.9894 0.9894 0.9894 length of leg-iii metatarsus 1 0.9947 0.9973
Width of abdomen 1 1 1 length of leg-iv tibia 1 0.9947 0.9973
Distance of epigastrium-spiracle 1 1 1 length of leg-iv metatarsus 1 1 1
Cui et al. BMC Bioinformatics (2016) 17:471 Page 19 of 22
be programmed to parse the sentences seen in thisexperiment, the applicability of the rules to otherdescriptions is highly questionable, as they could havetheir own special conventions.
Error identificationOne practical question is how to quickly identify errors,whether in character names or in values, at the MatrixReview step. The names of the characters themselves aregood clues, for example quantity of leg would seemsuspicious to a spider expert. In addition, the Reviewinterface supports different ways of sorting characters.Assuming erroneous characters would have values infewer taxa, sort by character coverage (i.e., the numberof taxa having a value for a character) can help identifybad characters. The original descriptions can also bebrought up from the Matrix Review interface, allowingthe user to check the original descriptions. An upcomingfeature will highlight characters in the original text tofacilitate scanning of text by the user.
Other types of charactersIssues discussed here are also applicable to extractingand matricizing categorical characters. We know that acharacter consists of a structure name (e.g., leg), a char-acter name (e.g., length) and a character value (e.g.,0.7 mm). ISSUE I discussed in Error Analysis will affectwhether a correct structure name is identified, regardlessof types of characters. ISSUE II and III are similarlyapplicable to categorical characters.A major challenge specific to categorical characters is
with the determination of the character names. Descrip-tions often state character values without explicitlymention character names. For example, in ocular areaslightly protruding (Example 2 in Error Analysis), pro-truding is the character value, but what is its character?Does protruding describe the size, orientation, promin-ence, or relief of the ocular area? Character names areimportant because they determine how the characterswill be named in the matrix (e.g., size/orientation/
prominence/relief of ocular area). Since a standard char-acter dictionary does not exist, the system has to ask theuser to indicate what character name protruding refersto in the Term Review step (Fig. 7). In fact, Term Reviewcould be the most time consuming step when dealingwith categorical characters because the user will need tocategorize the terms that are not in the system’s glossary.Synonymizing structure/organ names at this step is alsocritical for producing high quality matrices to avoid thesame characters being scattered in multiple columns.Cardinal characters, such as counts or quantities, are
often easier to extract. Our experience suggests thattheir extraction accuracy from taxonomic descriptionscan be expected at the same level as the numerical mea-surements reported here. However, when the cardinalcharacters are not expressed in numbers, but in phrases,such as few, many, and numerous, the semantics of thecharacter values will need human interpretation. Whilethe systematics community has discouraged this practice,it still exists in descriptions.
ConclusionsIn this paper, we introduced the ETC matrix generationpipeline, Input Creation -Text Capture - Matrix Gener-ation, for semi-automatic production of raw taxon-character matrices from morphological descriptions ofvarious taxon groups. This is to our knowledge the firstpipeline that produces taxon-character matrices frommorphological descriptions. We reported a case studywhere the tools were used to generate two measurementmatrices from the original and normalized descriptionsof 188 spider exemplars. The quality of the machine-generated matrices were compared to the hand-curatedgold standard matrices, in terms of data extraction accur-acy, efforts required to edit a matrix, and the similarity ofan edited matrix to the gold standard.As demonstrated in the paper, ETC matrix generation
pipeline is a low-barrier workflow, in that it does notrequire training examples or user-crafted extractionrules. The inputs required are the minimal necessary
Cui et al. BMC Bioinformatics (2016) 17:471 Page 20 of 22
requirements to perform the task – clean text descrip-tions and domain knowledge in the form of termcategorization. As shown in [29] and confirmed in thiscase study, the character extraction works well on fact-rich, self-contained morphological descriptions withrelatively simple syntactic structures. Besides generatingtaxon-character matrices, evidence from this case studysuggests other benefits of using the tools: (1) helping toidentify errors in the source descriptions (two cases), (2)helping to identify errors in the human-curated matrix(five cases), and (3) checking for parallelism in thedescriptions. These errors can be corrected and the canbe data re-harvested using tools/infrastructure such asthe one described in [57].The spider body part measurement experiment pro-
vided quantitative support for several findings that weargue are not limited to this case study but aregeneralizable across character information extraction inbiodiversity domains:
1. With full respect for any domain conventions,we showed the conventions that make taxonomicdescriptions less self-contained have negative impactson machine-processed results. The accuracy of thedata items (i.e., character/value pairs) extracted wasimproved from 1.46% using the original input to98.83% using the normalized input (essentially byadding the missing measurement units).
2. Semantic ambiguity exists in morphologicaldescriptions (also see [58]). It is often not easy fordescription authors to see the ambiguity. We planto adapt the CharaParser algorithm to highlight thepotential semantic ambiguities in the descriptionsfor the authors.
3. We also showed that accurately extracted data itemsmay not match exactly with the independently-created gold standard, the ideal result desired bybiologists. The matrix from the normalized inputcontained 98.83% accurate data items, but it stillrequired 28 edits to be 99% similar to the goldstandard (188 exemplar × 18 character, 2921 values).The analyses of the experimental results revealedtwo reasons for this: (a) the differences betweencharacter expressions used in the original descriptionsand the form of characters the user desires in thematrix, and (b) less-parallel descriptions or user/usepreferences sometimes lead to the synonymization ofan original character to something close. In addition,as elaborated in [41], selecting and constructingcharacters for certain biological research is a nontrivialtask even for domain experts.
In addition, the case study showed that character/col-umn-based edits were sufficient to bring the matrices
99% similar to the gold matrix. Although this resultconfirms our experience, additional empirical studies areneeded to verify this result.Future work will further improve the character extrac-
tion performance and improve the robustness of thesystem for various inputs. We also hope to enhance theinput functionality by taking HTML, DOC, or PDF filesas input. PDF is a challenging format for text processing,but promising software is being developed and tested[59]. This experiment suggested that editing facilities areneeded for users to identify, select, merge, split, rename,or delete machine-generated characters. The ETCMatrix Review interface already provided a suite of fea-tures in this regard, but additional improvement isneeded. Some of the features can be easily added, forexample, support for quick splitting of a compoundcharacter, or color-coding the original text to visualizethe machine-identified characters. Other features willneed additional research, for example, suggest potentiallyproblematic characters for the user to review.
Additional files
Additional file 1: Original input. The original input used in theexperiment. (TXT 296 kb)
Additional file 2: Normalized input. The normalized input used in theexperiment. (TXT 308 kb)
Additional file 3: Gold standard matrix. The expert hand-curated matrixused as the ground truth to evaluate the ETC generated matrices.(XLSX 31 kb)
Additional file 4: Term categorization. This text file shows how theterms were categorized in the Review step of ETC Text Capture in theexperiment. (TXT 12 kb)
Additional file 5: Matrix edits. List all the edits made in the ETCgenerated matrices. (DOCX 19 kb)
AbbreviationsASCII: American Standard Code for Information Interchange; CSV: Commaseparated values; ETC: Explorer of Taxon Concepts; OTO: Ontology TermOrganizer; PDF: Portable Document Format; XML: Extensible MarkupLanguage;
AcknowledgementsGraduate student Fengqiong Huang and undergraduate student AndrewGreenwood Stockton participated in the design and the implementation ofthe ETC toolkit described in this paper. Various users, especially Dr. LorenaEndara of the University of Florida, Dr. Robert Thacker of Stony Brook Universityand other students, have provided valuable feedback on the ETC tools reportedin this paper.
FundingThis material is based upon work supported by the National ScienceFoundation under Grant No. DBI-1147266 and CONICET Grant No. PIP-2012-0943. Any opinions, findings, and conclusions or recommendations expressedin this material are those of the authors and do not necessarily reflect the viewsof the granting organizations.
Availability of data and materialsThe ETC Toolkit is currently in beta test and publically available at http://etc.cs.umb.edu/etcsite/.The spider glossary files can be found at https://github.com/biosemantics/glossaries/tree/master/Spider.

Cui et al. BMC Bioinformatics (2016) 17:471 Page 21 of 22
Data that can be used to reproduce the experiment can be found in thesupplementary materials:(1) Original Input(2) Normalized Input(3) Gold Standard Matrix(4) Term categorizations used (this is provided for reader’s reference, the usercan use File > Import Categorizations in the Term Review to import thesecategorizations, or the user can follow the instruction in the paper tocategorize the terms), and(5) Edits made in the ETC output matrices (this is provided for reader’s reference).Note: The results reported there was produced using http://etc-dev.cs.umb.edu/etcsite/. Being a development server, it may not be available for test at all times.Using http://etc.cs.umb.edu/etcsite/ is recommended, although the results maydiffer slightly.
Authors’ contributionsConceived ETC Toolkits: JAM, HC, BL, RAM. Designed and implemented ETCToolkit: TR, HC. Designed and implemented the spider experiment: HC, MR,DX, SSC; Provided the experiment data: MR, EMS, NMK; Analyzed experimentresult: DX, HC; Drafted the manuscript: SSC, HC, DX. All authors reviewed andapproved the final version of the manuscript.
Competing interestsThe authors declare that they have no competing interests.
Consent for publicationNot applicable.
Ethics approval and consent to participateNot applicable.
Author details1University of Arizona, Tucson, AZ, USA. 2Museo Argentino de Ciencias,Naturales, CONICET, Buenos Aires, Argentina. 3Agriculture and Agri-FoodCanada, Ottawa, Canada. 4University of Illinois at Urbana-Champaign,Champaign, USA. 5University of Massachusetts at Boston and HarvardUniversity Herbaria, Massachusetts, USA. 6Department of Geology &Geophysics, Yale University, New Haven, Connecticut, USA.
Received: 1 April 2016 Accepted: 11 November 2016
References1. Franz NM, Chen M, Yu S, Bowers S, Ludäscher B. Names are not good
enough: reasoning over taxonomic change in the Andropogon complex.Semantic Web Journal–Interoperability, Usability, Applicability-Special Issueon Semantics for Biodiversity. 2014;1(1). http://www.semantic-web-journal.net/content/names-are-not-good-enough-reasoning-over-taxonomic-change-andropogon-complex. Accessed 10 Feb 2016.
2. Maddison DR, Maddison WP. MacClade 4: Analysis of phylogeny andcharacter evolution. 2005. http://macclade.org. Accessed 2 Feb 2016.
3. Maddison WP, Maddison DR. Mesquite: A modular system for evolutionaryanalysis. Version 3.01. 2014. http://mesquiteproject.org. Accessed 2 Feb 2016.
4. O’Lear MA, Kaufman SG. MorphoBank 3.0: Web application for morphologicalphylogenetics and taxonomy. 2012. http://www.morphobank.org.Accessed 2 Feb 2016.
5. Balhoff JP, Dahdul WM, Kothari CR, Lapp H, Lundberg JG, Mabee P, et al.Phenex: ontological annotation of phenotypic diversity. PLoS One. 2010;5(5),e10500. doi:10.1371/journal.pone.0010500.
6. Howe DG, Frazer K, Fashena D, Ruzicka L, Bradford Y, Ramachandran S, et al.Data extraction, transformation, and dissemination through ZFIN. MethodsCell Biol. 2011;104:311–25. doi:10.1016/B978-0-12-374814-0.00017-3.
7. Bradford Y, Conlin T, Dunn N, Fashena D, Frazer K, Howe DG, et al. ZFIN:enhancements and updates to the Zebrafish model organism database.Nucleic Acids Res. 2011;39 (Suppl 1):D822–9. doi:10.1093/nar/gkq1077.
8. Bowes JB, Snyder KA, Segerdell E, Gibb R, Jarabek C, Noumen E, et al.Xenbase: a Xenopus biology and genomics resource. Nucleic Acids Res.2008;36 (Suppl 1):D761–7. doi:10.1093/nar/gkm826.
9. Blake JA, Bult CJ, Eppig JT, Kadin JA, Richardson JE, the Mouse GenomeDatabase Group. The mouse genome database genotypes: phenotypes.Nucleic Acids Res. 2009;37 (Suppl 1):D712–9. doi:10.1093/nar/gkn886.
10. Màrquez L, Carreras X, Litkowski K, Stevenson S. Semantic role labeling:an introduction to the special issue. Comput Linguist. 2008;34(2):145–59.doi:10.1162/coli.2008.34.2.145.
11. Palmer M, Gildea D, Xue N. Semantic role labeling. Synthesis Lectureson Human Language Technologies. 2010;3(1):1–103. doi:10.2200/S00239ED1V01Y200912HLT006.
12. Grishman R. Information Extraction. In The Oxford Handbook ofComputational Linguistics. Oxford University Press. 2012. doi:10.1093/oxfordhb/9780199276349.013.0030.
13. Zhou J, Xu W. End-to-end learning of semantic role labeling using recurrentneural networks. In: Proceedings of the Annual Meeting of the Associationfor Computational Linguistics. 2015. http://www.aclweb.org/anthology/P/P15/P15-1109.pdf. Accessed 12 Aug 2016.
14. BioCreative WorkShop. Proceedings of 2012 BioCreative WorkShop. 2012.http://www.biocreative.org/media/store/files/2012/Proceedings_BC2012_.pdf. Accessed 2 Feb 2016.
15. BioCreative WorkShop. Proceedings of the Fourth BioCreative ChallengeEvaluation Workshop vol. 1. 2013. http://www.biocreative.org/media/store/files/2013/ProceedingsBioCreativeIV_vol1_.pdf. Accessed 2 Feb 2016.
16. BioCreative WorkShop. Proceedings of the Fourth BioCreative ChallengeEvaluation Workshop vol. 2. 2013. http://www.biocreative.org/media/store/files/2013/ProceedingsBioCreativeIV_vol2-1.pdf. Accessed 2 Feb 2016.
17. WorkShop BC. Workshop 1 - BioCreative Workshop on Text MiningApplications. 2014. http://www.biocreative.org/events/BCBioCuration2014/biocreative-text-mining-worksh/. Accessed 2 Feb 2016.
18. Taylor A. Extracting knowledge from biological descriptions. In: Mars NJI,editor. Proceedings of Second International Conference on BuildingandSharing Very Large-Scale Knowledge Bases. IOS press; 1995. P. 114-119.
19. Diederich J, Fortuner R, Milton J. Computer-assisted dataextraction from thetaxonomical literature. 1999. Virtual publication on web site: http://math.ucdavis.edu/~milton/genisys.html. Accessed 12 Aug 2016.
20. Wood MM, Lydon SJ, Tablan V, Maynard D, Cunningham H. Using paralleltexts to improve recall in IE. In: Nicolov N, Bontcheva K, Angelova G, Mitkov R,editors. Proceedings ofRecent Advances in Natural Language Processing.Amsterdam: JohnBenjamins; 2003. p. 70–7.
21. Cui H. MARTT: Using induced knowledge base to automatically mark upplant taxonomic descriptions with XML. Proceedings of the AmericanSociety for Information Science and Technology. 2005;42(1). doi:10.1002/meet.1450420170.
22. Tang X, Heidorn PB. Using Automatically Extracted Information in SpeciesPage Retrieval. In: Abstracts of the 2007 Annual Conference of theTaxonomic Databases Working Group. TDWG. 2007. http://www.tdwg.org/fileadmin/2007meeting/documents/Proceedings_of_TDWG_2007.pdf.Accessed 2 Feb 2016.
23. Soderland S. Learning information extraction rules for semi-structured and freetext. Machine learning. 1999;34(1-3):233–72. doi:10.1023/A:1007562322031.
24. Cui H, Boufford D, Selden P. Semantic annotation of biosystematics literaturewithout training examples. J Am Soc Inf Sci Tec. 2010;61(3):522–42. doi:10.1002/asi.21246.
25. Cui H. Competency evaluation of plant character ontologies against domainliterature. J Am Soc Inf Sci Tec. 2010;61(6):1144–65. doi:10.1002/asi.21325.
26. BioPortal. Phenotype Quality Ontology. 2016. https://bioportal.bioontology.org/ontologies/PATO. Accessed 12 Aug 2016.
27. Kiger RW, Porter DM. Categorical glossary for the flora of North Americaproject. Hunt Institute for Botanical Documentation: Carnegie MellonUniversity; 2001. http://www.huntbotanical.org/publications/show.php?=158.Accessed 12 Aug 2016.
28. Huang F, Macklin J, Morris PJ, Sanyal PP, Morris RA, Cui H. OTO: Ontologyterm organizer. Proc Am Soc Inf Sci Tech. 2012;49(1):1–3. doi:10.1002/meet.14504901246.
29. Cui H. CharaParser for fine-grained semantic annotation of organismmorphological descriptions. J Am Soc Inf Sci. 2012;63:738–54. doi:10.1002/asi.22618.
30. Cui H. Semantic annotation of morphological descriptions: an overallstrategy. BMC bioinformatics. 2010;11:278. doi:10.1186/1471-2105-11-278.
31. Klein D, Manning CD. Accurate Unlexicalized Parsing. Proceedings of the41st Meeting of the Association for Computational Linguistics. 2003;p. 423-30. doi:10.3115/1075096.1075150.

Cui et al. BMC Bioinformatics (2016) 17:471 Page 22 of 22
32. Hazy Research Group. DeepDive. 2015. http://deepdive.stanford.edu.Accessed 2 Feb 2016.
33. Müller HM, Kenny EE, Sternberg PW. Textpresso: an ontology-basedinformation retrieval and extraction system for biological literature. PLoSBiol, 2(11), e309. http://dx.doi.org/10.1371/journal.pbio.0020309.
34. Thessen AE, Cui H, Mozzherin D. Applications of natural languageprocessing in biodiversity science. Adv Bioinformatics. 2012. doi:10.1155/2012/391574.
35. Sevenster M, Bozeman J, Cowhy A, Trost W. A natural language processingpipeline for pairing measurements uniquely across free-text CT reports.J Biomed Inform. 2015;53:36–48. doi:10.1016/j.jbi.2014.08.015.
36. Uzuner O, Solti I, Cadag E. Extracting medication information from clinicaltext. J Am Med Inform Assoc. 2010;17:514-. http://dx.doi.org/10.1136/jamia.2010.003947.
37. Arbuckle T. Automatic identification of bees’ species from images of theirwings. Proc. 9th Int. Workshop on Systems, Signals and Image Processing.2002; P. 509–511. doi: 10.1142/9789812776266_0077.
38. Lam M, Rao Doppa J, Todorovic S, Dietterich TG. HC-Search for structuredprediction in computer vision. In: Proceedings of the IEEE Conference onComputer Vision and Pattern Recognition. 2015; P. 4923-4932.
39. Salle JL, Wheeler Q, Jackway P, Winterton S, Hobern D, Lovell D. Acceleratingtaxonomic discovery through automated character extraction. Zootaxa.2009;2217:43–55.
40. Hardisty A, Roberts D. A decadal view of biodiversity informatics: challengesand priorities. BMC Ecol. 2013;13(1):1. doi:10.1186/1472-6785-13-16.
41. Sereno PC. Comparative cladistics. Cladistics. 2009;25(6):624–59. doi:10.1111/j.1096-0031.2009.00265.x.
42. Liu J, Endara L, Burleigh JG. MatrixConverter: facilitating construction ofphenomic character matrices. Appl Plant Sci. 2015. doi:10.3732/apps.1400088.
43. Dececchi TA, Balhoff JP, Lapp H. Toward synthesizing our knowledge ofmorphology: Using ontologies and machine reasoning to extract presence/absence evolutionary phenotypes across studies. Syst Biol. 2015.doi:10.1093/sysbio/syv031.
44. Ramírez MJ. The spider subfamily Amaurobioidinae (Araneae, Anyphaenidae):a phylogenetic revision at the generic level. Bull Am Mus Nat Hist. 2003;277:1–262. http://dx.doi.org/10.1206/0003-0090(2003)277<0001:TSSAAA>2.0.CO;2.
45. Aisen S, Ramírez MJ. A revision and phylogenetic analysis of the spidergenus Oxysoma Nicolet (Araneae: Anyphaenidae, Amaurobioidinae).Zootaxa. 2015;3997(1):1–61. doi:10.11646/zootaxa.3997.1.1.
46. Labarque FM, Soto EM, Ramírez MJ, Arnedo MA. Chasing ghosts: thephylogeny of Amaurobioidinae ghost spiders (Araneae, Anyphaenidae).Zoologica Scripta. 2015;44(5):550–61. doi:10.1111/zsc.12119.
47. Cui H, Rodenhausen T. ETC semantic Markup Input Schema. 2015.https://raw.githubusercontent.com/biosemantics/schemas/master/semanticMarkupInput.xsd. Accessed 2 Feb 2016.
48. Cui H, Rodenhausen T. ETC semantic Markup Output Schema. 2015.https://raw.githubusercontent.com/biosemantics/schemas/master/semanticMarkupOutput.xsd. Accessed 2 Feb 2016.
49. Community. ETC Glossary Git Repository. 2015. https://github.com/biosemantics/glossaries. Accessed 2 Feb 2016.
50. BioPortal. 2015. https://bioportal.bioontology.org. Accessed 12 Nov 2016.51. Catapano T. TaxPub: An Extension of the NLM/NCBI Journal Publishing DTD
for Taxonomic Descriptions. In: Journal Article Tag Suite Conference (JATS-Con) Proceedings 2010. Bethesda: National Center for BiotechnologyInformation (US); 2010. http://www.ncbi.nlm.nih.gov/books/NBK47081/.Accessed 2 Feb 2016.
52. Vos RA, Balhoff JP, Caravas JA, Holder MT, Lapp H, Maddison WP, et al.NeXML: rich, extensible, and verifiable representation of comparative dataand metadata. Syst Biol. 2012;61(4):675–89. doi:10.1093/sysbio/sys025.
53. Ramírez MJ, Michalik PM. Spider ontology. An ontology for spider comparativebiology. NCBO BioPortal. 2007-2014. http://bioportal.bioontology.org/ontologies/SPD. Accessed 20 Nov 2015.
54. Endara L, Cole H, Burleigh JG, Nagalingum N, Macklin JA, Liu J, Cui H. BuildingA Community Plant Glossary Using Taxonomic Descriptions. TAXON. In prep.
55. Névéol A, Lu Z. Automatic integration of drug indications from multiple healthresources. In: Veinot TC, Ümit V Çatalyürek, Luo G, Andrade H, Smalheiser NR,editors. Proceedings of the 1st ACM international health informaticssymposium. ACM; 2010, pp. 666–73. Doi: 10.1145/1882992.1883096.
56. Deans AR, Yoder MJ, Balhoff JP. Time to change how we describe biodiversity.Trends Ecol Evol. 2012;27(2):78–84. doi:10.1016/j.tree.2011.11.007.
57. Miller JA, Georgiev T, Stoev P, Sautter G, Penev L. Corrected data re-harvested:curating literature in the era of networked biodiversity informatics. BiodiversityData Journal. 2015;3, e4552. doi:10.3897/BDJ.3.e4552.
58. Cui H, Dahdul W, Dececchi A, Ibrahim N, Mabee P, Balhoff J, GopalakrishnanH. CharaPaser+EQ: Performance Evaluation Without Gold Standard.Proceeding of Annual Meeting of American Society for Information Scienceand Technology. 2015. https://www.asist.org/files/meetings/am15/proceedings/submissions/papers/9paper.pdf. Accessed 2 Nov 2016.
59. Miller J, Agosti D, Sauter G, Catapano T, Klingenberg C. GoldenGATE ImagineXML Markup Editor. 2016. http://plazi.org/api-tools/source-code/goldengate-editor/. Accessed 12 Nov 2016.
• We accept pre-submission inquiries
• Our selector tool helps you to find the most relevant journal
• We provide round the clock customer support
• Convenient online submission
• Thorough peer review
• Inclusion in PubMed and all major indexing services
• Maximum visibility for your research
Submit your manuscript atwww.biomedcentral.com/submit
Submit your next manuscript to BioMed Central and we will help you at every step: