Introducing Africa GreenCo April 2017 - Startseite ... · Introducing Africa GreenCo April 2017 Ana...
19
Introducing Africa GreenCo April 2017 Ana Hajduka (Founder & CEO) [email protected] Cathy Oxby (Commercial Director) [email protected]
Transcript of Introducing Africa GreenCo April 2017 - Startseite ... · Introducing Africa GreenCo April 2017 Ana...
Introducing Africa GreenCo
April 2017
Ana Hajduka (Founder & CEO)
Cathy Oxby (Commercial Director)

GreenCo Partners
Grant Support Provided By:
Supported By:
Financial Advisor:

Overview of Africa’s Need and Current Reality
Public
funds
insufficient.
Private
Sector
investment
required
Reality
• Current funding
US$4.6bn p.a. (50%
public sector)
• Only 59 IPPs >5MW in
SSA (excl. RSA)
• 1990 to 2013, only 24.85
GW in SSA (RSA = 9.2
GW)
• AfDB: 160GW
by 2025
• COP 21/AREI:
300GW by 2030
• AfDB: US$60
- 90bn p.a.

The current power purchase paradigm
� Long term bilateral contracts between power producers and
utilities
� Many utilities cash constrained / depend on government for
budgetary support
� Without a creditworthy counterparty or a liquid power market,
developers and lenders require sovereign and/or Development
Finance Institution (DFI) guarantees
� This project-by-project approach is unsustainable:
– DFI resources are insufficient to address Africa’s funding need of
$60-90bn p.a. to achieve universal access by 2025
– Credit enhancement of projects on a one-off basis adds cost and
delays
– Requiring governments to provide guarantees shifts the
creditworthiness issue to the sovereign level
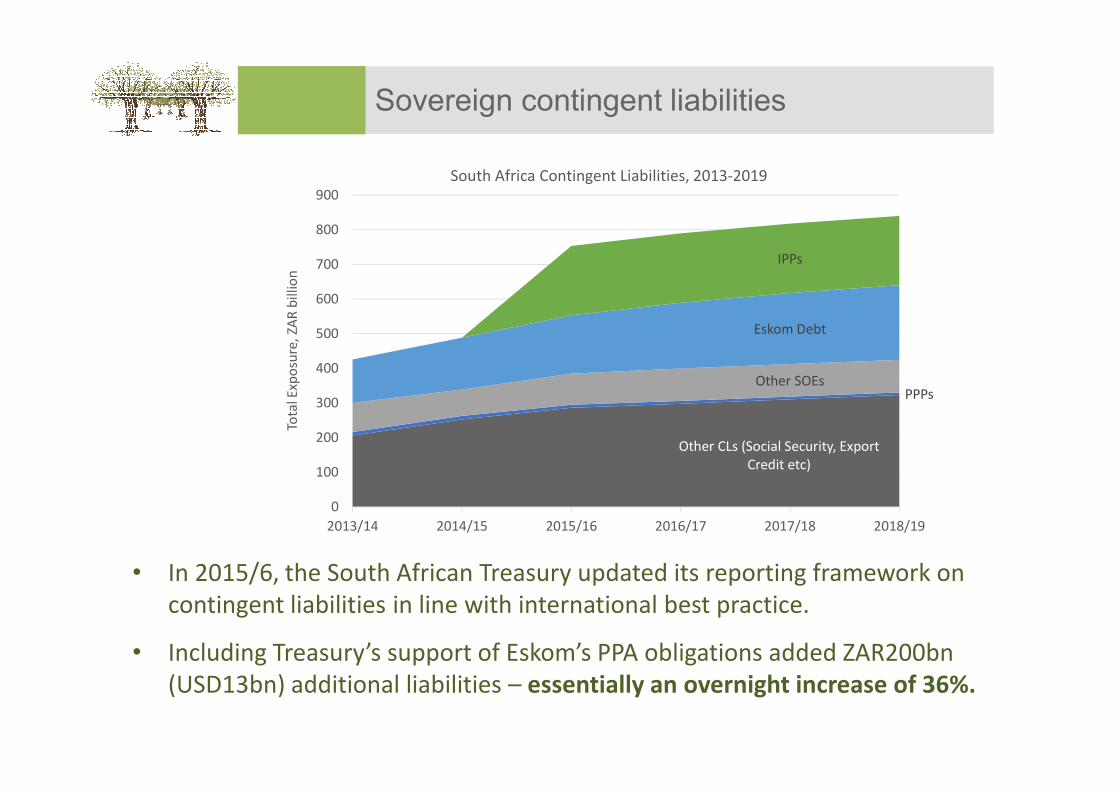
Sovereign contingent liabilities
Other CLs (Social Security, Export
Credit etc)
PPPsOther SOEs
Eskom Debt
IPPs
0
100
200
300
400
500
600
700
800
900
2013/14 2014/15 2015/16 2016/17 2017/18 2018/19
Tota
l Exp
osu
re,
ZAR
bil
lion
South Africa Contingent Liabilities, 2013-2019
• In 2015/6, the South African Treasury updated its reporting framework on
contingent liabilities in line with international best practice.
• Including Treasury’s support of Eskom’s PPA obligations added ZAR200bn
(USD13bn) additional liabilities – essentially an overnight increase of 36%.

Moving away from long-term liabilities – the role
of Regional Electricity Markets
There is already substantial cross-border power trading activity through long term fixed
contracts and short term competitive power markets
� Bilateral contracts dominate
– 18+ contracts in 2015
– 8m MWh traded in 2015
– 94% market share in 2014-15, falling to 80-85% market share in 2016
� Active competitive market
– DAM, IDM and now FPM
– 50-100,000MWh / $3.5-5m traded per month
– Deficit: only 20% of buy orders, and 70% of supply orders transacted
– SAPP forecast 10% growth y-o-y
Ap
r 1
3
Jun
13
Au
g 1
3
Okt
13
De
z 1
3
Feb
14
Ap
r 1
4
Jun
14
Au
g 1
4
Okt
14
De
z 1
4
Feb
15
Ap
r 1
5
Jun
15
Au
g 1
5
Okt
15
De
z 1
5
Feb
16
Ap
r 1
6
0
20
40
60
80
100
120
140
Tra
nsa
cte
d v
olu
me
MW
hT
au
sen
de
SAPP Competitive Trading Activity
No. Supplier Buyer Capacity (MW)
1 HCB Eskom 1600
2 Eskom MOTRACO 950
3 ZESA NamPower 150-80
4 Aggreko ZESCO 148-40
5 Aggreko NamPower 108
6 APR BPC 70 + 35
7 Eskom BPC 300
8 Eskom NamPower As required
9 EDM BPC 50
10 HCB ZESA 150
11 Eskom LEC As required
12 Eskom SEC As required
13 EDM SEC As required
14 EDM ZESCO 150
15 HCB Eskom 250
16 Eskom ZESCO 300
17 Karpowership ZESCO 100 + 300
18 ZESCO NamPower 50

Precedent: Power Trading Corporation of India
Purchased electricity from
independent power projects
(IPPs)
Purchased electricity from
independent power projects
(IPPs)
Sold to State Electricity
Boards, regional utilities &
industrial users
Sold to State Electricity
Boards, regional utilities &
industrial users
Creditworthy one-stop-shop
for IPPs, reducing risk and therefore
tariff
Creditworthy one-stop-shop
for IPPs, reducing risk and therefore
tariff
Diversified risk through
portfolio approach
Diversified risk through
portfolio approach
Provided route to market for surplus power and in case of
default
Provided route to market for surplus power and in case of
default
Helped develop a liquid power market in India
and neighbouring
countries
Helped develop a liquid power market in India
and neighbouring
countries
Attracted private sector investment in IPPs and PTC
itself
Attracted private sector investment in IPPs and PTC
itself
Evolved from creditworthy intermediary
to power trader
Evolved from creditworthy intermediary
to power trader

What is Africa GreenCo?
AND
Intermediary
Creditworthy
Offtaker
Power Pool Participant
(Trader)
o A catalyst to unlock private sector investment in renewable energy
generation projects
o Representing a paradigm shift in the cooperation with international
partners
o A public-private partnership entity
Africa Green Regional Energy: Efficient, New and Creditworthy Offtaker

A Principal in the Market
Host Government
and other investors
AFRICA
GREENCOIPP
PPA
Investors
(& Lenders)
Offtaker End UsersPSA
Host
Government
� Interposed between IPPs and Offtakers
� Creditworthy and independently managed
� Reducing the perceived risk of the project for investors
� Increase the number of bankable projects
� Crowding in commercial capital, including local institutional investors
� Improving the availability and cost of capital
� Technical and legal capacity and framework to execute transactions more efficiently

Operating on a Portfolio Basis
AFRICA
GREENCOInvestors IPP
Capital Utility 2 End Users
PPA PSA Power
Utility 1 End UsersPSA
Power
Private
Offtaker
Industrial
UserPSA Power
IPP
IPP
PPA
PPA
InvestorsCapital
InvestorsCapital
� Achieving structural risk mitigation
� An aggregator and diversifier of risks
� Addressing the inefficiencies of the ‘single buyer, single seller’ model
� Channeling Donor / DFI / MDB willingness to take sovereign risk
Trade
SAPP
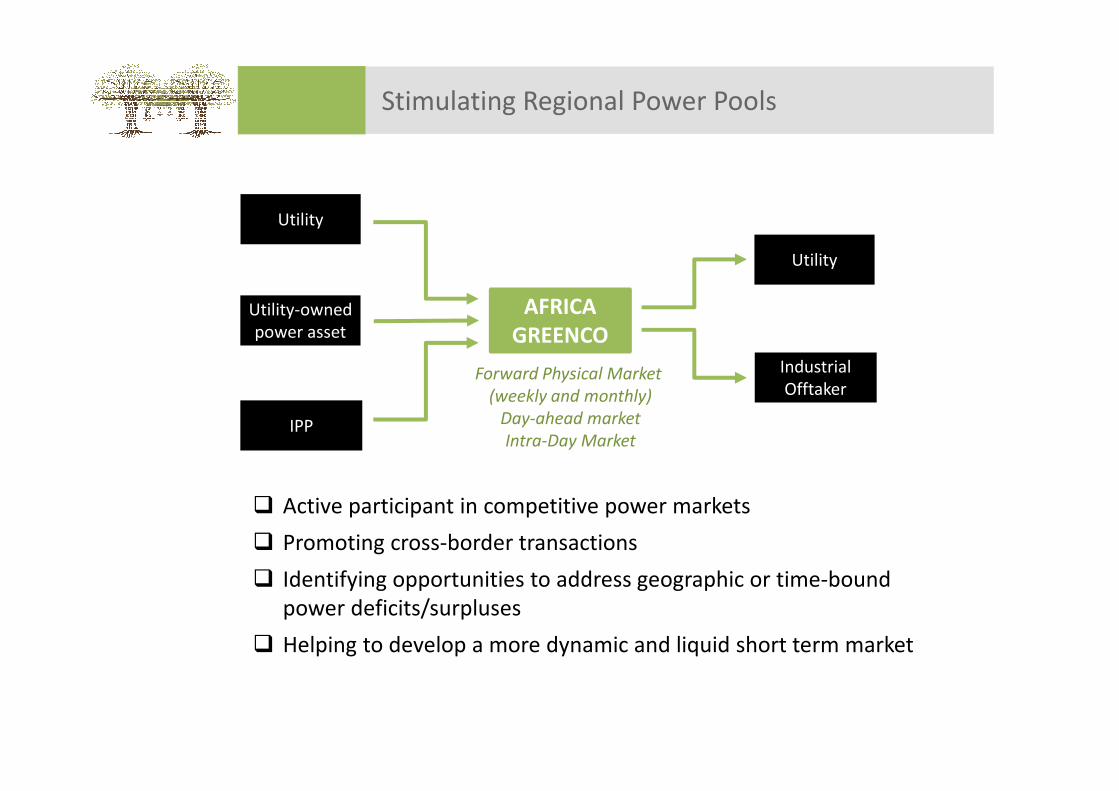
Stimulating Regional Power Pools
AFRICA
GREENCO
IPP
Utility-owned
power asset
Utility
Industrial
Offtaker
Utility
Forward Physical Market
(weekly and monthly)
Day-ahead market
Intra-Day Market
� Active participant in competitive power markets
� Promoting cross-border transactions
� Identifying opportunities to address geographic or time-bound
power deficits/surpluses
� Helping to develop a more dynamic and liquid short term market

Mitigating payment default
AFRICA
GREENCOInvestors IPP
Capital Offtaker 1 End Users
PPA PSA Power
Offtaker 2 End Users
PSA Power
Default on PSA
� Better placed to manage payment default
� Portfolio approach reduces reliance on any single offtaker
� No Government guarantee of utility’s power purchase obligations
� Government retains responsibility for political risks which Africa GreenCo
cannot mitigate
� Risks also mitigated through Africa GreenCo ownership structure

Converting a contingent liability into an asset
13
� Government support of National Utility under bilateral structures
� Government support of National Utility under Africa GreenCo structure
14
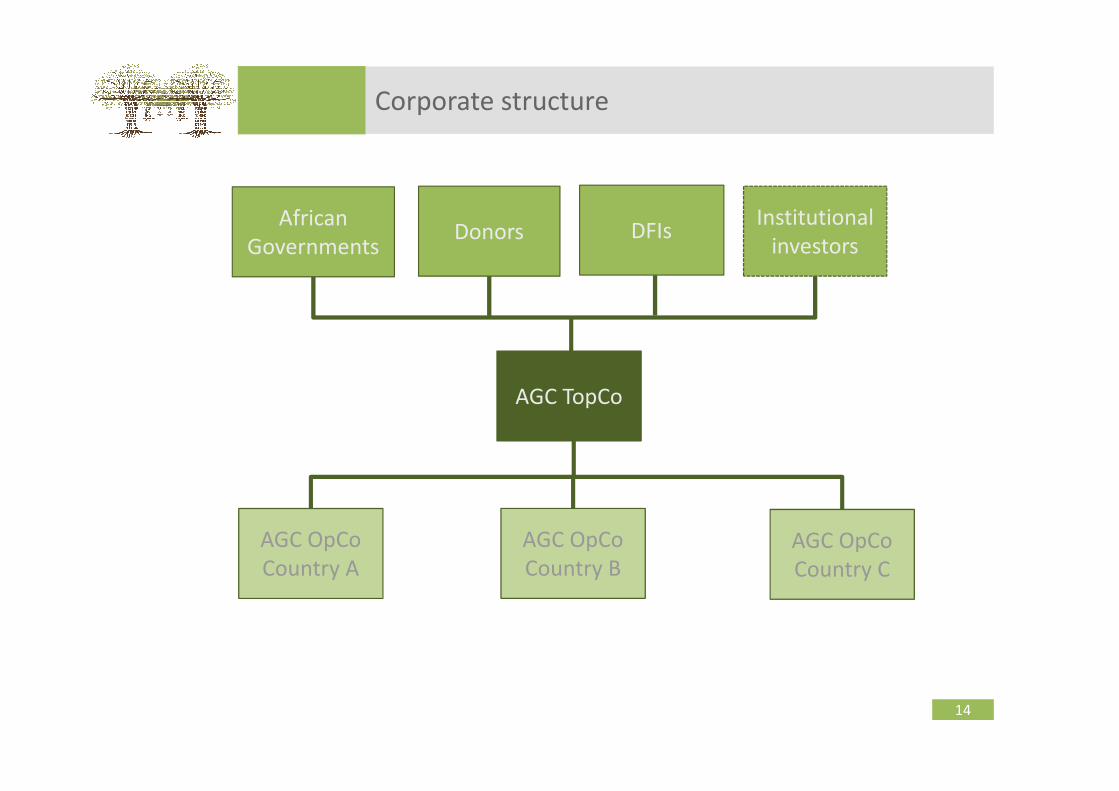
Corporate structure
DFIsInstitutional
investorsDonors
AGC TopCo
AGC OpCo
Country B
African
Governments
AGC OpCo
Country A
AGC OpCo
Country C

Tranched capital structure
� Drivers of tranched structure:
– Ensuring African political and financial ownership of the concept
– Creating a strong capital base through donor, DFI and host government
engagement
– Attracting different types of investor over time
Equity
Liquidity
Facility
Donors
DFIs
MDBs
Host Gvmts
3 years
aggregate PPA
payments1 year PSA payments
from national utility
Equal to
outstanding
debt under
GreenCo’s
PPA
portfolio + 6
months’ PPA
payments
Uncovered Excess
Value of PPA

Evolving Structure and Investors
LIQUIDITY
MDBs/DFIs
EQUITY
African Governments
Int’l Donors
Foundations
LIQUIDITY
International Capital Markets
Insurance and Re-insurance
…
Rating
Structuring
STAGE 1: PILOT
STAGE 2: GROWTH
CAPITAL
African public sector
African institutional investors
Int’l institutional investors
� Host governments/anchor
investors
� Initial deal flow
� Proof of concept
� Greater leverage
� Broader local ownership/buy in
� Financial sustainability

Current Status
Feasibility Study
Proof of Concept
Scale
- COMPLETE
- Based upon hypothetical portfolio of projects
- Includes financial structuring and technical analysis
- Broad industry support obtained (including SADC,
RERA, SAPP, KfW, DBSA, )
- Proof of concept expected in Zambia
- Leverage existing market infrastructure
- Complement parallel initiatives
- Expand capital base to support growing portfolio
- Replicate initial transaction, tailoring strategy to new
markets
Implementation
Plan- Establish a concrete pipeline of projects within SADC
- Detailed technical and regulatory review
- Further develop legal and regulatory structure
- Prepare financial structure & business plan

18
Next Steps Timeline
19
Thank You