Introduced and native fishes in the Vasse Wetland System ... Wonnerup Fishes... · Introduced and...
142
Introduced and native fishes in the Vasse‐ Wonnerup Wetland System and its rivers Beatty, S.J., Tweedley, J.R., Lymbery, A.J., Keleher, J, Allen, M.G., Morgan, D.L. Freshwater Fish Group and Fish Health Unit, Murdoch University August 2014
Transcript of Introduced and native fishes in the Vasse Wetland System ... Wonnerup Fishes... · Introduced and...

Introduced and native fishes in the Vasse‐Wonnerup Wetland System and its rivers
Beatty, S.J., Tweedley, J.R., Lymbery, A.J., Keleher, J, Allen, M.G., Morgan, D.L.
Freshwater Fish Group and Fish Health Unit, Murdoch University
August 2014

Native and Introduced Fishes of the Vasse‐Wonnerup 1
This project was supported by funding from the Australian Government’s Caring for our
Country program
Citations: Beatty S.J., Tweedley, J.R., Lymbery, A.J., Keleher, J, Allen, M.G., Morgan, D.L.
(2014). Introduced and native fishes in the Vasse‐Wonnerup Wetland System and its rivers.
Report to the Australian Government through its Caring for our Country Program.
Freshwater Fish Group and Fish Health Unit, Centre for Fish and Fisheries Research, Murdoch
University, Perth, Western Australia.
Frontispiece: the Vasse floodgates and a large Goldfish removed from the lower Vasse River
Native and Introduced Fishes of the Vasse‐Wonnerup 2
Table of Contents
Acknowledgements ................................................................................................................... 3 Executive Summary ................................................................................................................... 4
Fish faunas of the rivers of the Vasse‐Wonnerup Wetland System ...................................... 11 Introduction ............................................................................................................................. 12 Materials and Methods ........................................................................................................... 14 Sampling locations and dates .................................................................................................. 14 Habitat and environmental variables ...................................................................................... 15 Spatial and temporal distribution patterns ............................................................................. 15 Movement patterns of freshwater fishes ................................................................................ 16 Introduced species removal ..................................................................................................... 16 Fin damage by Eastern Gambusia ........................................................................................... 16 Acoustic tracking of Goldfish ................................................................................................... 18 Results and Discussion ............................................................................................................ 23 Fishes and decapods in rivers of the Vasse‐Wonnerup ............................................................ 23 Spatial and temporal patterns in distribution ......................................................................... 24 Movement patterns of freshwater fishes ................................................................................ 31 Habitat and environmental variables ...................................................................................... 34 Introduced species removal ..................................................................................................... 38 Fin damage by Eastern Gambusia ........................................................................................... 40 Acoustic tracking of Goldfish ................................................................................................... 41 Summary .................................................................................................................................. 54
Fish faunas of the Vasse‐Wonnerup Wetland System ........................................................... 57 Introduction ............................................................................................................................. 58 Materials and Methods ........................................................................................................... 59 Sampling regime ...................................................................................................................... 59 Life cycle category and guild .................................................................................................... 62 Statistical analyses ................................................................................................................... 63 Results...................................................................................................................................... 67 Water quality ........................................................................................................................... 67 Overall number of species, density and life cycle category among regions ............................ 69 Numbers of species and density ............................................................................................... 73 Spatial changes in fish faunal composition .............................................................................. 75 Overall number of species, density and life cycle category among seasons and years ........... 89 Temporal changes in fish faunal composition ......................................................................... 93 Location of introduced fish captures ...................................................................................... 105 Discussion .............................................................................................................................. 106 Water quality ......................................................................................................................... 106 Number of species and density .............................................................................................. 109 Spatial changes in fish faunal composition ............................................................................ 111 Temporal changes in fish faunal composition ....................................................................... 114 Spatial and temporal changes the abundance and distribution of introduced fish .............. 115 Management and Monitoring Recommendations .............................................................. 118 References ............................................................................................................................. 123 Appendices ............................................................................................................................. 129

Native and Introduced Fishes of the Vasse‐Wonnerup 3
Acknowledgements
The authors gratefully acknowledge the support and advice given to them throughout this
study from the Vasse Wonnerup Pest Fish Steering Committee (VWPFSC), comprising: Jim
Lane, Dr Kim Williams and Alan Clarke (Department of Parks and Wildlife), Dr Kath Lynch,
Krish Seewraj and Jenelle Carter (Department of Water), Bruce Mackay, Michael Burgess,
Claire Taylor (Department of Fisheries), Jen Mitchell (Geocatch), Dr Emily Hugues dit Ciles
and Craig Bohm (South West Catchments Council) and Will Oldfield (Shire of Busselton). Sally
Clifton Parks (Geocatch) is thanked for supporting the extension of this project, as are
Vanessa Boladeras, James Florrison, Abbas Akbaripasand and Dr Joel Williams for their help
with the fieldwork.
Special thanks to the following landholders for kindly allowing access to their stretches of the
various rivers: John and Janet Wells, Gary Bibby, Mark Nottle, Ross and Cheryl Manning,
Peter and Donna Oates. This project was supported by the Australian Federal Government’s
Caring for our Country program, GeoCatch and Murdoch University.
A native Gilgie Cherax quinquecarinatus from the Abba River.

Native and Introduced Fishes of the Vasse‐Wonnerup 4
Executive Summary
The Vasse‐Wonnerup Ramsar Wetland System (VWWS) has international ecological
significance due to its designation as a Ramsar site. However, the water quality is poor due in
large part to high levels of nutrients which, in conjunction with other stressors such as
regulation of flow, have caused numerous algal blooms and fish deaths. Surprisingly, there
has been no quantitative research or monitoring of the fish communities in the VWWS
despite fishes being key indicator group of ecosystem health and being a critical component
in foodwebs and particularly for birds which give the system its Ramsar status.
Although there has never been a comprehensive fish survey of the entire wetland,
the adjoining rivers were known contain a number of introduced fish and crayfish species.
As found elsewhere in south‐western Australia, these introduced fishes and crayfishes are
known to impact directly on native fish species by predation and competition and indirectly
by introducing exotic diseases. In addition, one of the key invasive species in the VWWS,
Goldfish, is known to exacerbate algal blooms by re‐suspending nutrients and stimulating
algal growth through their feeding processes. Other ecological impacts include alteration of
natural food webs and habitat destruction through feeding and burrowing activities.
The current project aimed to provide a comprehensive quantitative understanding of
the fishes and crayfishes of the VWWS across the full range of habitats in order to assess the
current and future health of the ecosystem and guide effective management decisions and
monitoring programs. Given the impact of introduced fishes, the study had a specific
simultaneous aim to document, prioritise and control introduced fishes and crayfishes to
directly address a major known impact on aquatic ecosystems. Finally, it aimed to provide
management recommendations that could be implemented to mitigate the impacts of
existing and future introduced species.
The report is separated into two major sections; ‘riverine’ and ‘wetland’ (including
estuarine) that together form the VWWS. This was undertaken as these habitats are
obviously linked yet exhibit different hydrological regimes and thus require different
sampling techniques and generally house distinct suites of species. However, at all stages of
the project, these activities were carefully coordinated (e.g. such as the timing of sampling)

Native and Introduced Fishes of the Vasse‐Wonnerup 5
to ensure compatible seasonal comparisons, and to enable the findings and
recommendations of the report to be framed in a ‘whole‐off‐system’ setting. This study
provides an overall baseline dataset of the fishes and crayfish communities of the entire
system and will enable a more coordinated management approach to the issue of
introduced species in the VWWS.
Fish faunas of the rivers of the Vasse‐Wonnerup Wetland System
A total of 17 sites were chosen for seasonal sampling in the rivers of the VWWS including
five each in the Ludlow, Abba, and Sabina rivers, and two in the Vasse River. Six seasonal
sampling trips were conducted in total, commencing in March 2012 and concluding in June
2013. A range of sampling techniques were deployed designed to quantity the density and
also movement patterns of native species whilst minimising impacts of sampling on those
species and importantly removing large numbers of introduced species. Level of fin damage
by the invasive Eastern Gambusia was also assessed throughout the study to determine
which native fishes are most susceptible and explore the factors that influence the degree of
impact of its aggressive behaviour.
A suite of environmental variables (including habitat, riparian vegetation, and water
quality) were also recorded at each site to enable calculation of the Pen‐Scott foreshore
condition index at each site, and also relationships between native and introduced species
and water quality and habitat variables to be explored. Fixed position photography occurred
at each site to provide a visual representation of seasonal changes in site characteristics.
The first ever acoustic tracking study of Goldfish was conducted as part of the project
in the Vasse River. An array of eight acoustic receiver units (‘listening stations’) was
deployed in a 5.8 km stretch of the lower Vasse River and acoustic transmitter tags were
implanted in 21 individual Goldfish. These Goldfish were passively tracked from 12 months
from December 2012 – December 2013 to provide information on movement patterns and
spawning locations.

Native and Introduced Fishes of the Vasse‐Wonnerup 6
A total of 66,944 individual fishes and decapod crustaceans representing 12 species
were captured during riverine sampling. These included self‐maintaining populations of
three native freshwater fishes (Western Minnow Galaxias occidentalis, Western Pygmy
Perch Nannoperca vittata, and the Nightfish Bostockia porosa), three native estuarine fishes
that are known to utilise riverine habitats (i.e. Bluespot Goby Pseudogobius olorum, Sea
Mullet Mugil cephalus, and Western Hardyhead Leptatherina wallacei, two introduced fishes
Goldfish Carassius auratus, Eastern Gambusia Gambusia holbrooki, three native decapod
crustaceans Gilgie Cherax quinquecarinatus, Koonac Cherax preissii, Glass Shrimp
Palaemonetes australis, and one introduced decapod crustacean, the eastern Australian
Yabby Cherax destructor.
The highest aquatic biodiversity sites were in the lower reaches of the river
catchments. These sites tended to hold permanent water and act as vital refuge for aquatic
species during the dry summer/autumn baseflow period. Sites located further upstream in
the rivers only held water in winter/spring and housed fewer aquatic species. However,
native fishes were found to utilise upstream sites, indicating that seasonal migration is an
important life history trait and longitudinal stream connectivity must be considered to
effectively manage native freshwater fish populations in the VWWS. Stream habitats were
generally degraded throughout the catchments, except in the headwater reaches located on
the Darling/Whicher range which were near pristine. Habitats were most highly degraded in
the middle reaches of rivers, in the agricultural and grazing land lying between Bussell
Highway and the foot of the Darling/Whicher Range.
The project resulted in the removal of 26,081 introduced Eastern Gambusia and 842
Goldfish from rivers of the Vasse‐Wonnerup catchment. The removal of large numbers of
mature Goldfish during this project is likely to significantly reduce the subsequent rate of
recruitment to the population. Importantly, the exhaustive seasonal sampling did not reveal
any unexpected pest species incursions in the rivers of the Vasse‐Wonnerup.
In the 12 month duration of the Goldfish tracking study, 15 Goldfish were tracked for
the entire year. A high site fidelity (in terms of percentage of days visited) was recorded at
the receiver upstream of the Boat Ramp near the Shire (93% of fish detected each on

Native and Introduced Fishes of the Vasse‐Wonnerup 7
average 27% of the days), followed by the New River Wetlands (80% of fish, 22% of days).
47% of Goldfish were detected in the Lower Vasse River Wetland at least once during the
study.
Tagged Goldfish were far from being sedentary, and movements of at least 5.4 km in
a 24 hour period were recorded for some individuals, indicating that the species is highly
mobile in the Vasse River. There were considerable seasonal patterns in habitat use and the
key sites utilised during the known spawning period of Goldfish were the site upstream of
the Boat Ramp and the New River Wetland (60% of fish detected) suggesting they were the
key spawning habitats. Furthermore, 80% of Goldfish were detected in the New River
Wetland at some stage during the study. Almost half of tagged Goldfish were detected in
the Ramsar listed Lower Vasse River Wetland and the salinity tolerance of Goldfish
determined during the study (i.e. 11 ppt acute, and 21 ppt gradual tolerance) suggests that it
is plausible that the species can use the estuary as a dispersal pathway into other rivers of
the VWWS. This was also supported by the findings of the Wetland component of the
current study that detected large numbers of juveniles using the Vasse axis of the wetland
system. However, rigorous seasonal sampling in both wetland and riverine waters
throughout the Vasse‐Wonnerup failed to detect the species outside of the lower Vasse
River and upper Vasse Estuary, indicating that such dispersal has not yet taken place.
As outlined in the Table of Management and Monitoring Recommendations at the
rear of the report, the information gathered during this study will be critical to future
management. Efforts should be made to protect the high conservation habitats in the lower
reaches of the rivers particularly those that provide permanent refuge pools. Protection and
rehabilitation of riparian vegetation and continuing to address nutrient loads will greatly
benefit riverine fishes in these systems. Other actions including addressing instream barriers
to migrations and ensuring future water abstractions are carefully monitored to offset
projected declines in rainfall and river flow.
The current study also allows clarity and confidence in the allocation of resources for
ongoing introduced species control efforts in the VWWS. Investment should be made in
continued control of the Goldfish population using the information gathered from the

Native and Introduced Fishes of the Vasse‐Wonnerup 8
tracking study. Importantly, priority can also be focused on preventing future species
incursions with the confidence in knowing that urgent control of other pest species is not
required at this time. Ongoing monitoring should occur to detect, as early as possible, any
future introductions into the rivers of the Vasse‐Wonnerup (see the Table of Management
and Monitoring Recommendations at the rear of this report).
Fish fauna of the Wetlands of the Vasse‐Wonnerup Wetland System
The study in the wetland and estuarine habitats of the VWWS was conducted simultaneously
and in coordination with the riverine survey. It was also expanded to assess the impact of a
large fish kill in April 2013 on the fish fauna of the Vasse‐Wonnerup that was made possible
by the regular sampling of the fish in the nearshore waters of the system that had been
occurring since February 2012 as part of the current project. This thus provided a timely
example as to the value of the current study in providing a baseline upon which to assess
these sorts of stochastic events. The results of the fish kill investigation are presented in the
current study but also in a stand‐alone companion report (see Tweedley et al., 2014).
Analysis of the nearshore fish fauna collected every three months over a two year
period between February 2012 and November 2013 indicated the presence of two
introduced fishes, the Eastern Gambusia and the Goldfish existing in the VWWS; consistent
with the findings in the riverine sampling with no new species being detected. The
composition of the fish fauna changed markedly both among seasons and regions and that
this change was accompanied by large changes in water quality, most notably salinity. Both
the number of species and individuals were greatest in the lower reaches of the system, i.e.
the Deadwater and Wonnerup Inlet, and declined in an upstream direction through both the
lower and upper Vasse and Wonnerup estuaries, before increasing in the Lower Vasse River
Wetlands. The diversity in the lower reaches reflects the presence of juveniles of
commercially and recreational important fish species, while the high numbers of fish is a
reflection of the relatively stable water and salinity levels. These levels changed markedly in
the estuaries, with the upper estuaries becoming dry and the lower estuaries markedly

Native and Introduced Fishes of the Vasse‐Wonnerup 9
hypersaline, reaching 132 (around four times full strength seawater) during summer and
autumn, before freshwater discharge in winter lowers the salinity considerably (i.e. to < 10).
The density of fishes in the wetlands of the VWWS ‐Wonnerup changed dramatically
over the course of a year, with those changes being consistent across the two years. High
densities of fish were recorded during November and February, before declining rapidly in
May and remaining at those levels in August. This trend is a reflection of i) the breeding cycle
of many of the estuarine species, which typically live for one year and spawn over the
summer period and ii) the reduction in water levels, increase in salinity and temperature and
consequently lower dissolved oxygen concentrations at night. The decline in water levels in
the upper estuaries also traps fish in shallow pools making them easy prey for the many
birds that inhabit the Vasse‐Wonnerup at that time of year.
With regard to the nearshore fish community as a whole (i.e. including all species), no
significant change in faunal composition was detected as a result of the fish kill in April 2013.
This is due mainly to the fact that there is a ‘natural’ decrease in the fish fauna at this time of
year and that a similar suite of species inhabit the wetlands of the VWWS in all seasons. Had
the fish kill occurred earlier in the year, a stronger signal would likely have been detected.
However, this event did highlight the importance of the Deadwater, Wonnerup Inlet and the
Lower Vasse River Wetlands as refuges for fish and as sources for recolonisation of areas
where severe depletions in fish stock occurred either due to ‘natural’ stressors or fish kills.
The Deadwater and Wonnerup Inlet should be prioritised for protection from
environmental degradation, as these regions act as fish refuge areas during times of poor
water quality. Annual monitoring of the nearshore fish community in February is
recommended to assess the condition of the fish fauna and would also help track long‐
termer changes, such as climate change and efforts to remediate the VWWS and its
catchment. The disturbing trends in the biology and ecology of Black Bream also warrant
further investigation. If another fish kill occurs the information in this report, together with
any annual monitoring data, can be used to assess the effects and implications. Such analysis
would be greatly helped by the presence of sound, quantitative data of the species and
number of fish that die as a result of the event. Such events, although unwelcome, also

Native and Introduced Fishes of the Vasse‐Wonnerup 10
represent the chance to collect biological data that can be used to help elucidate the causes
and effects of the kill. Immediately following any fish kill an independent assessment of its
effects (e.g. fish mortality and subsequent ecological effects) should also be undertaken (see
the Table of Management and Monitoring Recommendations at the rear of this report (see
also the recommendations in Tweedley et al., 2014)).
Native and Introduced Fishes of the Vasse‐Wonnerup 11
Fish faunas of the rivers of the Vasse‐Wonnerup Wetland
System
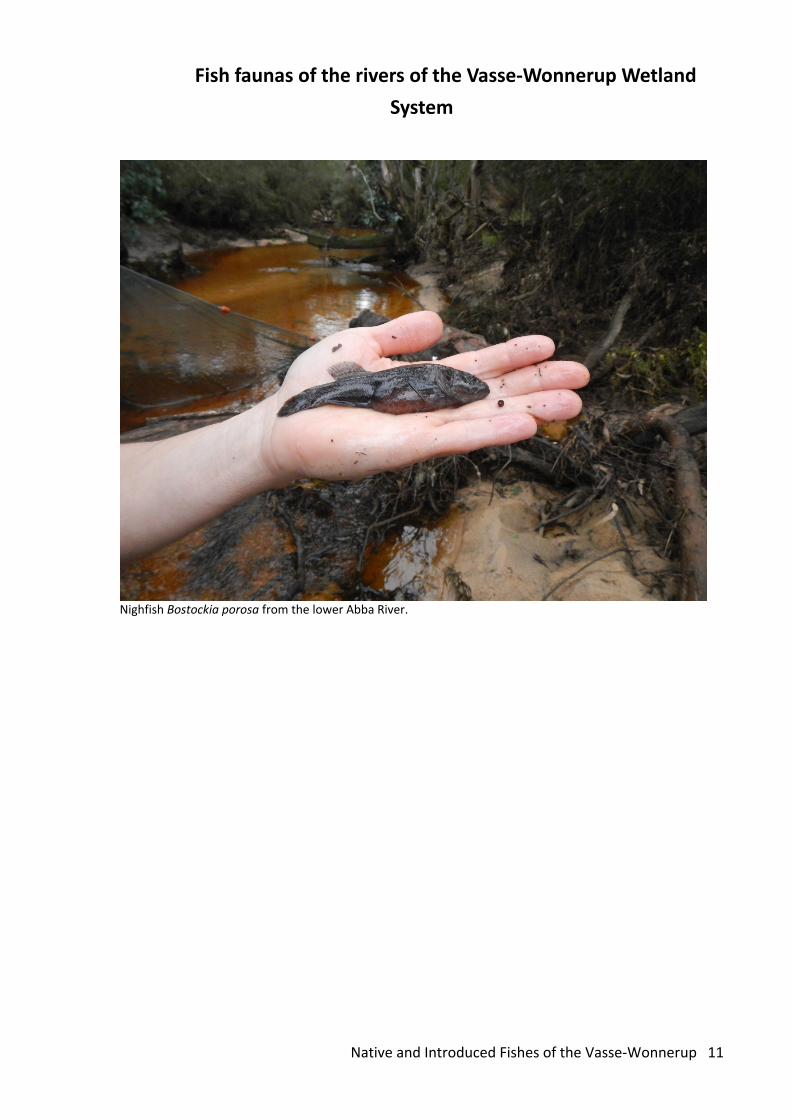
Nighfish Bostockia porosa from the lower Abba River.

Native and Introduced Fishes of the Vasse‐Wonnerup 12
Introduction
Introduced freshwater fishes are one of the major global threats to aquatic biodiversity. In
south‐western Australia, the number of introduced freshwater fishes in wild systems (i.e. 13)
has recently surpassed the number of native species (i.e. 11) (Beatty and Morgan, 2013). Of
great concern is the increased rate of recent introductions with a 44% increase in known
introductions over past decade with 80% of those being aquarium species (Beatty and
Morgan, 2013). In this region as in others, introduced fish and crayfish are known to directly
impact ecosystems by predating on and competing with native species (Morgan et al., 2004;
Beatty et al., 2005) and indirectly by altering habitat, water quality and introducing exotic
diseases and parasites (Marina et al., 2008). While investment in preventing new
introductions is the most cost‐effective approach to mitigating impacts, monitoring for early
detection of newly introduced species is crucial to increase the chance of containment or
eradication.
Although no comprehensive survey has yet been conducted on the rivers of the
Vasse‐Wonnerup Wetland System (VWWS), a number of introduced fish and crayfish species
are known to be present in the region (Morgan and Beatty, 2004). In addition, one of the key
invasive species in the VWWS, Goldfish, is known to exacerbate algal blooms by re‐
suspending nutrients and stimulating algal growth through their feeding processes
(Kolmakov and Gladyshev, 2003). Other ecological impacts include alteration of natural food
webs and habitat destruction through feeding and burrowing activities.
Reducing or eradicating populations of introduced freshwater fish and crayfish in the
VWWS directly addresses a previously identified key threat, i.e. impact of pest animals ‐
introduced fish and crayfish species, in the Site Investment Guide (WRM, 2007). A long‐term
control program since 2003 in the Vasse River has resulted in stabilisation of the Goldfish
population (Morgan and Beatty, 2005, 2007; Morgan et al., 2008; Beatty and Morgan, 2009).
A further reduction (or eradication) in Goldfish biomass will help mitigate their impact such
as re‐suspending nutrients in the sediment that has been demonstrated to help fuel algal
blooms.
Native and Introduced Fishes of the Vasse‐Wonnerup 13
While an intensive control program of Goldfish may be successful in this VWWS,
additional information on the species is also required to refine these control efforts. The use
of passive acoustic telemetry can yield valuable information on the movements of animals
within their environment. The current study will therefore identify key seasonal habitats that
act as refugia or aggregation sites for invasive Goldfish. We propose to do this by using
tagged individuals to determine movement patterns (diurnally and seasonally), habitat
associations, and to locate Goldfish aggregations. It is hypothesised that this will enhance
the efficiency of the eradication program considerably, as well as allowing a robust
management plan to be produced to combat this species.
Along with addressing the threat of Goldfish in the VWWS, it is also paramount that a
broader survey be conducted to understand both the native fish communities (such as
identifying areas of high conservation value), to detect any unknown introduced species, and
develop and prioritise impact mitigation strategies for current and future introductions. In
undertaking the control program via a risk management approach, the project will be
consistent with the key principles of the Australian Pest Animal Strategy and ensure
resources are used in a cost‐effective manner.
This study is the first comprehensive survey of the freshwater fishes and crayfishes of
the rivers of the VWWS and it aimed to both control existing introduced populations, and
identify and prioritise any new incursions detected. It also aimed to engage key stakeholders
and the broader local community on its activities to highlight the serious ecological and
social impacts of introduced species in order to prevent new introductions. Finally, it aimed
to develop a series of management recommendations to mitigate the impact of existing
introduced species, and importantly also to prevent and detect any future introductions.

Native and Introduced Fishes of the Vasse‐Wonnerup 14
Materials and Methods
Sampling locations and dates
A total of 17 sites were chosen for seasonal sampling including five each in the Ludlow, Abba,
and Sabina rivers, and two in the upper reaches of the Vasse River (Fig. 1). At each site, a 50
m long stretch of river was selected for repeated sampling over the duration of the project.
Within this area, three stakes spaced 15 m apart from each other (at the 10, 25 and 40 m
mark) were driven into the bank to mark the locations of fixed sampling points for the
measurement of various environmental and habitat features (see below). Six seasonal
sampling trips were conducted in total, commencing in March 2012 and concluding in June
2013.
Fig. 1: Map of the Vasse‐Wonnerup catchment showing locations of the 17 seasonal riverine sampling sites monitored during the present study.

Native and Introduced Fishes of the Vasse‐Wonnerup 15
Habitat and environmental variables
A handheld YSI Professional Plus multiparameter meter was used to measure water quality
within each sampling site on each sampling occasion. The mean of three replicate
measurements was calculated for water temperature, dissolved oxygen (% saturation and
mg/L), conductivity (mS/cm), total dissolved solids (g/L), salinity (ppt), pH, and ORP (mV).
A suite of environmental and habitat features were measured at the three fixed
locations at each sampling site. These included percentage cover of various river substrate
types (estimated by randomly placing a 1 x 1 m quadrat on the substrate at three locations
at each cross section), bank angle (left and right bank), erosion index (left and right bank),
percentage riparian vegetation cover (understorey, midstorey and overstorey in a 5 m radius
area centred on the fixed locations on both the left and right bank), Pen‐Scott foreshore
condition index (see Table 1 caption for explanation of grading system used), and stream
width (see also Table 1 and Appendix 1). When surface water was present at a fixed sampling
location, a cross‐sectional profile of the stream was obtained using a handheld flow probe
(Global Water FP111) to measure depth (cm) and flow (cm.sec‐1) at ca 10 points along each
cross‐section.
Digital photographs were taken at fixed locations at each site on each sampling
occasion and compiled to track seasonal changes in riparian vegetation cover and surface
water availability over the duration of the project (seasonal extremes are presented in
Appendix 2).
Spatial and temporal distribution patterns
At each site on each sampling occasion, mean density estimates for fish and crayfish species
were determined by conducting three replicate passes with a backpack mounted
electrofisher (Smith‐Root 12‐A). All fish specimens captured were measured to the nearest 1
mm total length (TL), and crayfish specimens were measured to the nearest 1 mm orbital‐
carapace length (OCL) prior to their release at the point of capture, except introduced
species (see Introduced species removal below).

Native and Introduced Fishes of the Vasse‐Wonnerup 16
Movement patterns of freshwater fishes
Movement patterns were determined at the seasonal sampling sites located uppermost and
lowermost in the Sabina, Abba, and Ludlow rivers (Fig. 1) using fyke nets, but only when flow
was detectable at the site.
Fyke nets consisted of two 5 x 0.8 m wings, a 1.2 x 0.8 m opening, and 5 m long
pocket with two funnels all constructed from 2 mm woven mesh. One net was set facing
upstream to capture downstream movements and another net set facing downstream to
capture upstream movements. Fyke nets were set for three consecutive nights and checked
once each 24 hour period (usually in the morning). Specimens captured in fyke nets were
processed in the same manner as described.
Introduced species removal
In order to reduce the population of invasive Goldfish in the lower Vasse River, targeted
removal of individuals took place on five separate occasions during the project in March
2012, May 2012, July 2012, November 2012, and March 2013. The extent of the area fished
varied on each occasion depending on the river level (Fig. 2). A boat electrofisher (Smith‐
Root VVP‐15B, Fig. 3) was used to stun Goldfish and a scoop net used to remove fish from
the river. All Goldfish were euthanised in an ice slurry on board the electrofishing boat, and
transported to the laboratory where the TL (to the nearest 1 mm) and wet weight (to the
nearest g) of each fish was measured. All other introduced species captured during the study
were euthanised in an ice slurry, stored in 100% ethanol, and later counted.
Fin damage by Eastern Gambusia
In order to determine the degree of fin damage that the prolific Eastern Gambusia was
having, we used a fin‐nipping damage score adopted from Gill et al. (1999), however, set a
maximum damage score of 10 (caudal fin completely missing) and a minimum of zero
(completely intact).

Native and Introduced Fishes of the Vasse‐Wonnerup 17
Fig. 2: Map showing the extent of boat electrofishing for Goldfish control in the lower Vasse River during the study.
Fig. 3: Electrofishing boat used in Goldfish control activities (left); a freshly caught Goldfish specimen, approximately 280 mm TL (right).

Native and Introduced Fishes of the Vasse‐Wonnerup 18
Acoustic tracking of Goldfish
Eight VR2W 69 kHz (VEMCO) acoustic receivers were deployed at sites throughout the lower
and middle reaches of the Vasse River system (Figs 4, 5), a stretch of river known from
previous studies (e.g. Morgan and Beatty 2007; Beatty and Morgan, 2009) to house a robust,
self‐sustaining population of Goldfish. Receivers were cable‐tied to 25 mm diameter nylon
rope and either tied to existing infrastructure (e.g. under bridges) or suspended below a 200
mm diameter solid styrene float anchored to the riverbed with a 4.5 kg galvanised sand
anchor (Fig. 6). At one site (i.e. New River wetland) the receiver was cable tied directly to a
1.5 m long galvanised metal stake driven into the substrate (Fig. 6). V7‐4L acoustic
transmitters were used in this project following the advice of staff at the biotelemetry
equipment manufacturer VEMCO, as they offered the longest transmission range of all
transmitters appropriate for the size of the fish to be tagged (i.e. adult Goldfish >180 mm).
Acoustic tags were programmed to transmit a signal at a random interval of between
80 and 160 sec, and the estimated tag life was 388 days. The VR2W receivers record these
transmissions whenever the tags are within detection range, which can vary depending on
factors such as depth, flow, and substrate type (see Whitty et al., 2009). Range testing was
performed for three of the eight acoustic receivers (i.e. butter factory, town bridge, and New
River wetland, see Figs. 2,5) using a V7‐4L range test tag that transmits an acoustic signal
every 12 seconds. A handheld GPS unit (Garmin eTrex 30) was used to position the range
test tag at progressive distance intervals of 25 m from the acoustic receiver up to a
maximum distance of 250 m, and the percentage of detections by the receiver at each
distance was recorded.

Native and Introduced Fishes of the Vasse‐Wonnerup 19
Fig. 4: Aerial photograph of the lower Vasse River showing locations and ID numbers of seven of the eight VR2W acoustic receivers deployed in December 2012. The receiver not shown here (i.e. #8 – Below Diversion Drain) was located a further ~3 km upstream of receiver #7.
1 ‐ Vasse‐Wonnerup Wetlands (Butter Boards)
2 – Bussell Hwy
3 – New River Wetlands
4 – U/s Boat Ramp
5 – Strelley St
6 – D/s Bypass
7 – U/s Bypass

Native and Introduced Fishes of the Vasse‐Wonnerup 20
Fig. 5: Map showing the location of all acoustic receivers used (and names) in the tracking of Goldfish in the Lower Vasse River.

Native and Introduced Fishes of the Vasse‐Wonnerup 21
Fig. 6: (a) VR2W acoustic receiver unit attached to styrene float/sand anchor mooring prior to deployment; (b) deployment of receiver attached by rope to bridge infrastructure; (c) styrene float/sand anchor mooring deployment; (d) deployment of receiver attached by cable ties to metal stake (New River Wetland).
Following deployment and range testing of the acoustic receiver array, 21 Goldfish
were captured from the Vasse River using a boat electrofisher (Smith‐Root VVP 15‐B) on
5/12/12 and 6/12/12. Fish were placed in an aerated 110 L holding tank, and moved a short
distance (i.e. <1 km) to a temporary field laboratory, where each individual fish was
anaesthetised by emersion in AQUI‐S® solution (dilution rate of 0.125 mL per L of water).
Following the loss of equilibrium and all signs of fin movement, an incision of 10 mm was
made in the abdominal wall and a V7‐4L acoustic tag was placed in the peritoneal cavity (Fig.
7). The incision was then closed with a single suture (4/0) (Fig. 7). All individuals were also
implanted with a small (12 mm) Passive Internal Transponder (PIT) tag inserted via injection
with a purpose‐built applicator (BioMark HPT12 pre‐loaded tags). Tagged individuals were
then placed in oxygenated holding tanks and monitored throughout a recovery period, which
was deemed completed when individuals maintained equilibrium and resumed full fin
movement. The fish were then moved to a holding cage in the Vasse River and monitored
twice daily for a period of three consecutive days to ensure that no signs of stress, infection
(red or swollen areas around the incision), or tag loss were evident. All 21 fish were then
liberated into the Vasse River.

Native and Introduced Fishes of the Vasse‐Wonnerup 22
Fig. 7: (a) Freshly captured Goldfish specimen; (b) anaesthetised specimen being prepared to have a small incision made in the abdominal wall; (c) V7‐4L acoustic transmitter being inserted into the peritoneal cavity; (d) suturing up of the incision; (e) post‐operative recovered specimen.
Manual downloading of the receivers took place in January, March, October 2013,
and final download occurred in January 2014. Data were compiled using the VUE software
package (VEMCO) and analysed and graphically displayed using Excel and Sigmaplot.
Distance covered by tagged individuals was calculated by summing the absolute values of
the stream distance (in km) between receivers for every consecutive pair of detections for
each fish. This yields an estimate of the minimum distance (Dmin) a fish has covered. The
actual distance covered is likely to be much greater as movements outside the detection
range of receivers, and small‐scale movements within the detection range of receivers
cannot be determined from the passive telemetry data.
Native and Introduced Fishes of the Vasse‐Wonnerup 23
Results and Discussion
Fishes and decapods in rivers of the Vasse‐Wonnerup
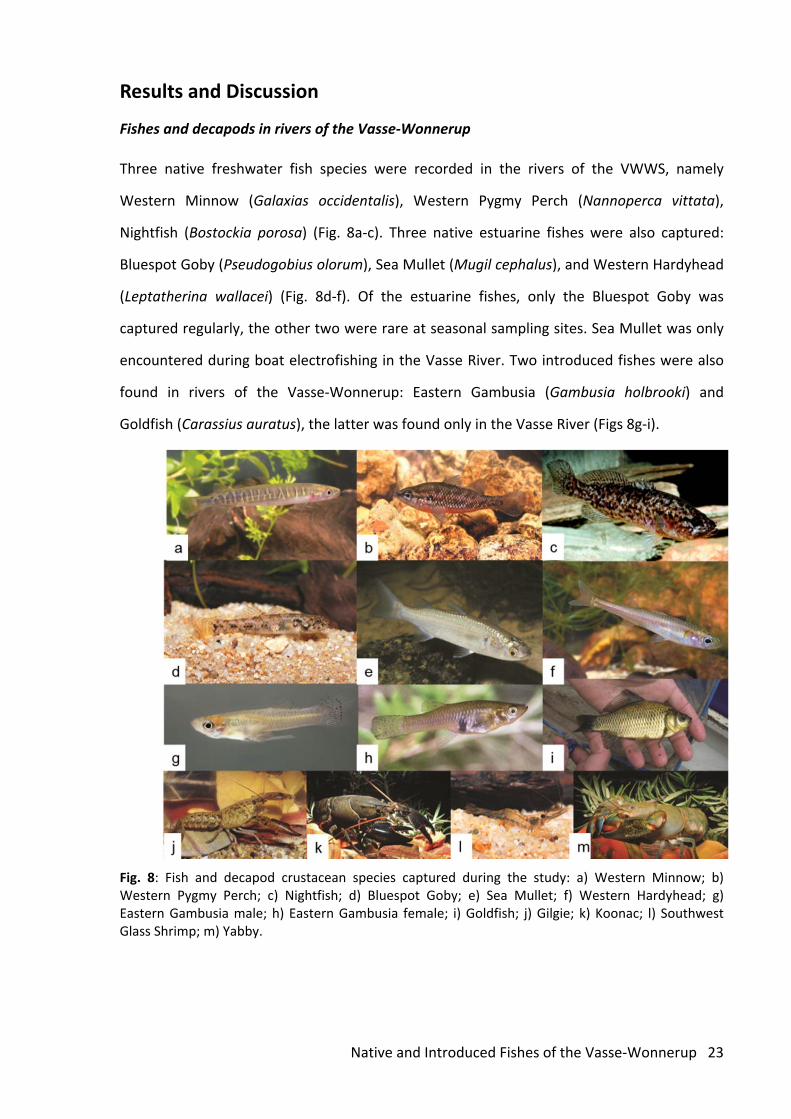
Three native freshwater fish species were recorded in the rivers of the VWWS, namely
Western Minnow (Galaxias occidentalis), Western Pygmy Perch (Nannoperca vittata),
Nightfish (Bostockia porosa) (Fig. 8a‐c). Three native estuarine fishes were also captured:
Bluespot Goby (Pseudogobius olorum), Sea Mullet (Mugil cephalus), and Western Hardyhead
(Leptatherina wallacei) (Fig. 8d‐f). Of the estuarine fishes, only the Bluespot Goby was
captured regularly, the other two were rare at seasonal sampling sites. Sea Mullet was only
encountered during boat electrofishing in the Vasse River. Two introduced fishes were also
found in rivers of the Vasse‐Wonnerup: Eastern Gambusia (Gambusia holbrooki) and
Goldfish (Carassius auratus), the latter was found only in the Vasse River (Figs 8g‐i).
Fig. 8: Fish and decapod crustacean species captured during the study: a) Western Minnow; b) Western Pygmy Perch; c) Nightfish; d) Bluespot Goby; e) Sea Mullet; f) Western Hardyhead; g) Eastern Gambusia male; h) Eastern Gambusia female; i) Goldfish; j) Gilgie; k) Koonac; l) Southwest Glass Shrimp; m) Yabby.

Native and Introduced Fishes of the Vasse‐Wonnerup 24
Decapod crustaceans recorded during the study included three native species: Gilgie
(Cherax quinquecarinatus), Koonac (C. preissii), and Southwest Glass Shrimp (Palaemonetes
australis), and the introduced Yabby (C. destructor) (Fig. 8j‐m).
Spatial and temporal patterns in distribution
Sabina River (Fig. 9)
Water was present in every season at all of the study sites in the Sabina River, except at the
uppermost site (i.e. Piggott Road), which only held water in winter and spring. The only
species collected from the uppermost site was the Gilgie. Sites further downstream housed
between five and seven species, with the highest species richness recorded at Tuart Drive
and Bussell Highway. Of the native fishes, both Nightfish and Western Minnow were the
most widely distributed (at 4 of 5 sites), whilst Western Pygmy Perch and Bluespot Goby
were slightly less widespread (at 3 of 5 sites). Gilgies were found at most sites (4 of 5) and
the Southwest Glass Shrimp at just two of the lower sites. The most numerous species in the
Sabina catchment was Eastern Gambusia which dominated catches, particularly in the
summer samples. The Yabby was also recorded at one site in the middle reaches of the
Sabina.
During the dry summer and autumn period, all four native fish species recorded in
the system were found in at least one of the lower three sites, all of which were located
within 3.3 km of the interface with the Vasse Estuary. In winter and spring, Western
Minnows were absent from the lower sites but did occur at the Oates site, located in the
middle reaches of the catchment. Nightfish maintained their presence in the lower reaches
of the catchment throughout the year and were also present at the Oates site in spring.
Western Pygmy Perch were absent at all sites in winter but were present at the Oates site in
spring as well. Bluespot Goby was resident in all seasons in the lower catchment but did not
penetrate to the middle reaches of the catchment. The seasonal distribution of the two
native decapods followed a similar pattern to that of the goby. Introduced Eastern Gambusia
occurred at all sites in most seasons, with the exception of the uppermost site.

Native and Introduced Fishes of the Vasse‐Wonnerup 25
Fig. 9: Results of seasonal sampling at sites in the Sabina River, February 2012 ‐ June 2013.

Native and Introduced Fishes of the Vasse‐Wonnerup 26
Abba River (Fig. 11)
The only sampling site that held water year round in the Abba was the Bussell Highway site. All
other sites dried periodically during the summer and autumn seasons. The two lowermost sites
housed seven different species of fishes and crayfishes, whilst the upper three sites housed
between two and three species. Western Minnow (4 of 5 sites) and Nightfish (3 of 5 sites) were
the most widely distributed fish species, whilst Western Pygmy Perch, Bluespot Goby and the
introduced Eastern Gambusia were all recorded in the two lowermost sites only. Of the
decapods, the Gilgie was found at all sites, with the Southwest Glass Shrimp occurring at the two
lowermost sites only. The native Koonac was also recorded at one site in the middle reaches of
the catchment (Ludlow‐Hithergreen).
At the sites where it occurred, Eastern Gambusia was the most abundant species, with
densities highest during the summer/autumn period. In terms of native fish abundance, all
species were present in roughly comparable numbers; no species was clearly dominant.
The lowermost sites, both located within 3 km of the interface with the Vasse Estuary,
acted as a baseflow refuge for the majority of the aquatic macrofaunal diversity in the Abba
River. With the onset of flow in winter and spring, the Western Minnow displayed some
upstream dispersal to the middle reaches (Williamson Road). Also, Western Minnow and
Nightfish were recorded at the uppermost site (Vasse Highway), located in the headwaters
about 22 km upstream of the estuary, during the flow period. However, it is suspected that
these fish may have moved into this seasonally inundated habitat from refuge pools located on
nearby farmland (e.g. artificial onstream dams), rather than by migrating from the lower
reaches. The appearance of native decapods (Gilgie and Koonac) in the impermanent sites
located in the middle and upper catchment was not surprising given the ability of both of these
species to persist in seasonally inundated habitats by retreating to moist burrows (Fig. 10).
Of note was the major crayfish death event that occurred at the Bussell Hwy site on the
Abba River in early June 2013 (Fig. 10). This was caused by a truck rollover spilling sewerage into
the system. At the time of sampling, hundreds of Gilgies were recorded dead and dying on the

Native and Introduced Fishes of the Vasse‐Wonnerup 27
banks that had walked out likely as a result of extremely low dissolved oxygen levels that would
have been expected shortly after the spill occurring.
Fig. 10: (top left): Gilgie burrows in undercut bank at Abba River (Vasse Hwy site March
2012), (other photos) the mass walk‐outs of Gilgies in the Abba River (Bussell Hwy) that
occurred in early June 2013 in response to sewerage spill.

Native and Introduced Fishes of the Vasse‐Wonnerup 28
Fig. 11: Results of seasonal sampling at sites in the Abba River, March 2012 ‐ June 2013.

Native and Introduced Fishes of the Vasse‐Wonnerup 29
Ludlow River (Fig. 12)
The lowermost site (Tuart Drive) was the only Ludlow sampling site that held water in all
seasons. Not surprisingly, it housed the highest diversity of aquatic species (7 species). The other
sites in the catchment housed between two and four species. Western Minnow, Western Pygmy
Perch, and introduced Eastern Gambusia were the most widespread fish species (3 of 5 sites).
The native decapods (Gilgie and Koonac) were also found at 3 of 5 sites. These two decapod
species did not overlap in distribution in the Ludlow River except at the Bussell Highway site.
Koonacs were distributed in the middle reaches of the catchment (i.e. Bussell Highway to Warns
Rd), whereas Gilgies were recorded at sites in the lower catchment and at the uppermost site.
The two estuarine stragglers (Bluespot Goby and Southwest Glass Shrimp) only occurred at the
lowermost site. The introduced Yabby was also recorded at the Bussell Highway site.
As in the other catchments, Eastern Gambusia dominated fish numbers at the sites
where it occurred. Of the native species, densities were roughly similar between all species,
although Southwest Glass Shrimp were the most abundant species at the Tuart Drive site in the
lower reaches.
Three fish species (i.e. Western Minnow, Western Pygmy Perch, Eastern Gambusia)
dispersed upstream to sites in the middle reaches of the catchment (~15 km upstream of
mouth) during the winter/spring flow period. Nightfish was also recorded at the uppermost site
(~20 km upstream of mouth) in winter.

Native and Introduced Fishes of the Vasse‐Wonnerup 30
Fig. 12: Results of seasonal sampling at sites in the Ludlow River, March 2012 ‐ June 2013.
Native and Introduced Fishes of the Vasse‐Wonnerup 31
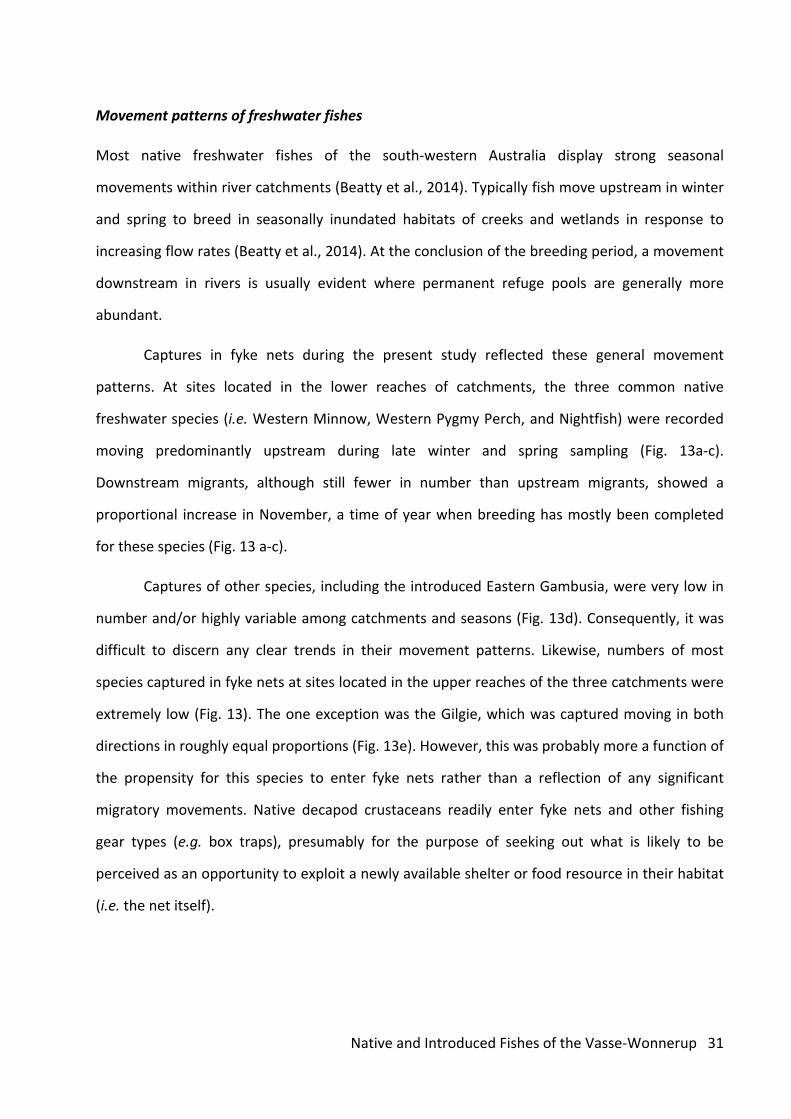
Movement patterns of freshwater fishes
Most native freshwater fishes of the south‐western Australia display strong seasonal
movements within river catchments (Beatty et al., 2014). Typically fish move upstream in winter
and spring to breed in seasonally inundated habitats of creeks and wetlands in response to
increasing flow rates (Beatty et al., 2014). At the conclusion of the breeding period, a movement
downstream in rivers is usually evident where permanent refuge pools are generally more
abundant.
Captures in fyke nets during the present study reflected these general movement
patterns. At sites located in the lower reaches of catchments, the three common native
freshwater species (i.e. Western Minnow, Western Pygmy Perch, and Nightfish) were recorded
moving predominantly upstream during late winter and spring sampling (Fig. 13a‐c).
Downstream migrants, although still fewer in number than upstream migrants, showed a
proportional increase in November, a time of year when breeding has mostly been completed
for these species (Fig. 13 a‐c).
Captures of other species, including the introduced Eastern Gambusia, were very low in
number and/or highly variable among catchments and seasons (Fig. 13d). Consequently, it was
difficult to discern any clear trends in their movement patterns. Likewise, numbers of most
species captured in fyke nets at sites located in the upper reaches of the three catchments were
extremely low (Fig. 13). The one exception was the Gilgie, which was captured moving in both
directions in roughly equal proportions (Fig. 13e). However, this was probably more a function of
the propensity for this species to enter fyke nets rather than a reflection of any significant
migratory movements. Native decapod crustaceans readily enter fyke nets and other fishing
gear types (e.g. box traps), presumably for the purpose of seeking out what is likely to be
perceived as an opportunity to exploit a newly available shelter or food resource in their habitat
(i.e. the net itself).

Native and Introduced Fishes of the Vasse‐Wonnerup 32
a) Western Minnow b) Nightfish
c) Western Pygmy Perch
d) Eastern Gambusia
Fig. 13: Upstream and downstream movement of seven aquatic species (a‐g) captured in the Sabina, Abba, and Ludlow rivers during three seasons (i.e. Sep = spring, Nov = spring/summer, Jun = winter).
268.1 674.1

Native and Introduced Fishes of the Vasse‐Wonnerup 33
e) Gilgie f) Southwest Glass Shrimp
g) Bluespot Goby
Fig. 13 cont.: Upstream and downstream movement of seven aquatic species (a‐g) captured in the Sabina, Abba, and Ludlow rivers during three seasons (i.e. Sep = spring, Nov = spring/summer, Jun = winter).

Native and Introduced Fishes of the Vasse‐Wonnerup 34
Habitat and environmental variables
The habitat and environmental characteristics of sites were relatively consistent in all three
catchments; depending on the distance upstream of the estuary. A number of sites in the lower
reaches (i.e. within about 3 km of the estuary) were located within or near the boundaries of
Ludlow National Park. Most of these sites had a riparian zone that was heavily weed infested or
weed dominated (i.e. B2/B3 on the Pen‐Scott index) (Table 1), with reasonable shading of the
streamline (typically ≥ 30%) provided by native tree species including Tuart (Eucalyptus
gomphocephala), Flooded Gum (E. rudis), and Peppermint (Agonis flexuosa). Bank erosion at
these sites ranged from moderate (~5) to low (~8.5) (Table 1).
The middle reaches of the Vasse‐Wonnerup catchments (i.e. between Bussell Highway
and the foot of the Darling Scarp) comprise land that is mostly developed for agriculture,
livestock grazing, and mineral sand mining. Sites in these areas ranged in their level of riparian
degradation from heavily weed infested (B2) to eroded (C3). Two sites (i.e. Sabina River – Oates
property and Vasse River – Chapman Hill Road) consisted of channelised, diversion drains, built
to bypass the Vasse‐Wonnerup Estuary and mitigate the risk of flooding in Busselton. Stream
shading ranged from >50% at sites where some native riparian overstorey remained intact to 0%
at the heavily modified diversion drain sites. Bank erosion at these sites ranged from moderately
high (~3) to low (~8). Most sites in the middle reaches of the catchments typically only held
water in winter and spring with the exception of the two Vasse River sites and the Sabina River –
Oates Property site (diversion drain).
Three study sites were located in the upper reaches of the catchments. Two of these
were located at slightly higher elevation on the Darling/Whicher Range (i.e. Sabina River –
Piggott Road and Abba River – Vasse Highway), whilst the third was located at the foot of the
Darling Scarp (i.e. Ludlow River – Yoganup Place). All three sites exhibited highly seasonal flow
(only holding water in winter and spring), and were characterised by near pristine riparian
condition (A2) and >60% stream shading provided by native overstorey species including Jarrah
(Eucalyptus marginata), Marri (Corymbia calophylla), Yarri (E. patens), and Flooded Gum (E.
rudis). Bank erosion at these sites was low (~7 and above).

Native and Introduced Fishes of the Vasse‐Wonnerup 35
Table 1. Mean values of various environmental/habitat characteristics of seasonal sampling sites. Pen‐Scott foreshore condition index was graded as follows: A1 – pristine, A2 – near pristine, A3 – slightly disturbed, B1 – degraded/weed infested, B2 – degraded/heavily weed infested, B3 – degraded/weed dominated, C1 – erosion prone, C2 – soil exposed, C3 – eroded, D1 – eroding ditch, D2 – freely eroding ditch, D3 – weed dominated drain.
Pen‐Scott
CATCHMENT SITE mean se mean se mean se mean se mean se mean se
Sabina Barracks 1.17 5.00 0.40 2.83 0.18 B3 80 6.16 72.5 10.75 6.67 2.71 84.17 12.36
Tuart 2.06 8.50 0.37 2.83 0.18 B3 10 6.93 17.5 13.1 5 5.48 95 3.74
Bussell 3.24 6.83 0.52 2.67 0.23 B3 45 7.87 27.5 13.4 20 9.7 91.67 5.42
Oates 10.23 10.00 0.00 2.00 0.00 D3 10 6.93 0 0 0 0 50.83 14.31
Piggott 17.61 6.83 1.15 2.33 0.46 A2 80 5.48 42.5 13.32 46.67 11.8 53.33 7.7
Abba Tuart 1.68 4.67 0.73 2.50 0.37 B2 30 17.89 19.17 14.03 17.5 5.43 45.83 9.94
Bussell 2.86 8.50 0.37 3.00 0.00 B3 52.5 15.98 53.33 13.9 38.33 14.47 97.5 1.87
Ludlow‐Hithergreen 13.29 6.67 0.54 2.83 0.18 B2 57.5 19.99 53.33 16.83 75.83 71.1 65.83 6.39
Williamson 15.54 3.17 0.52 2.33 0.37 C1 80 6.16 52.5 11.81 10.83 3.58 59.17 12.92
Vasse Hwy 23.14 8.00 0.57 2.50 0.37 A2 90 5.10 82.5 4.42 28.33 3.65 24.17 4.98
Ludlow Tuart 3.22 7.67 0.92 2.33 0.37 B3 37.5 16.96 63.33 8.79 19.17 4.78 63.33 28.05
Bussell 5.99 7.67 0.46 2.50 0.24 B2 39.17 10.72 62.5 13.17 16.67 5.23 78.33 5.42
Capel‐Tutunup 12.7 2.67 0.23 2.00 0.49 C3 9.17 3.29 13.33 14.61 0 0 89.17 4.34
Warns 15.65 7.83 0.59 2.50 0.24 B3 41.67 9.87 52.5 7.97 13.33 3.65 79.17 11.26
Yoganup 22.71 6.67 0.88 3.00 0.00 A2 60.1 10.04 63.33 8.68 21.67 6.73 70.83 4.1
Vasse Chapman Hill Rd 5.71 4.83 0.34 3.00 0.00 D3 0 0 0 0 1.67 1.83 100 0
Below div. drain 5.75 7.50 0.84 2.00 0.40 B3 53.33 16.23 51.67 13.17 10 5.1 95.83 2.2
Distance
f/mouth
(km)
Midstorey
(% cover)
Understorey
(% cover)Erosion Index
1‐10 (1 = 100%
eroded, 10 = <5%
eroded)
Bank Angle
1‐3 (1 = <30°,
2 = 30‐60°, 3 = 60‐
90°)
Overstorey
(% cover)
Shade
(%)
Native and Introduced Fishes of the Vasse‐Wonnerup 36
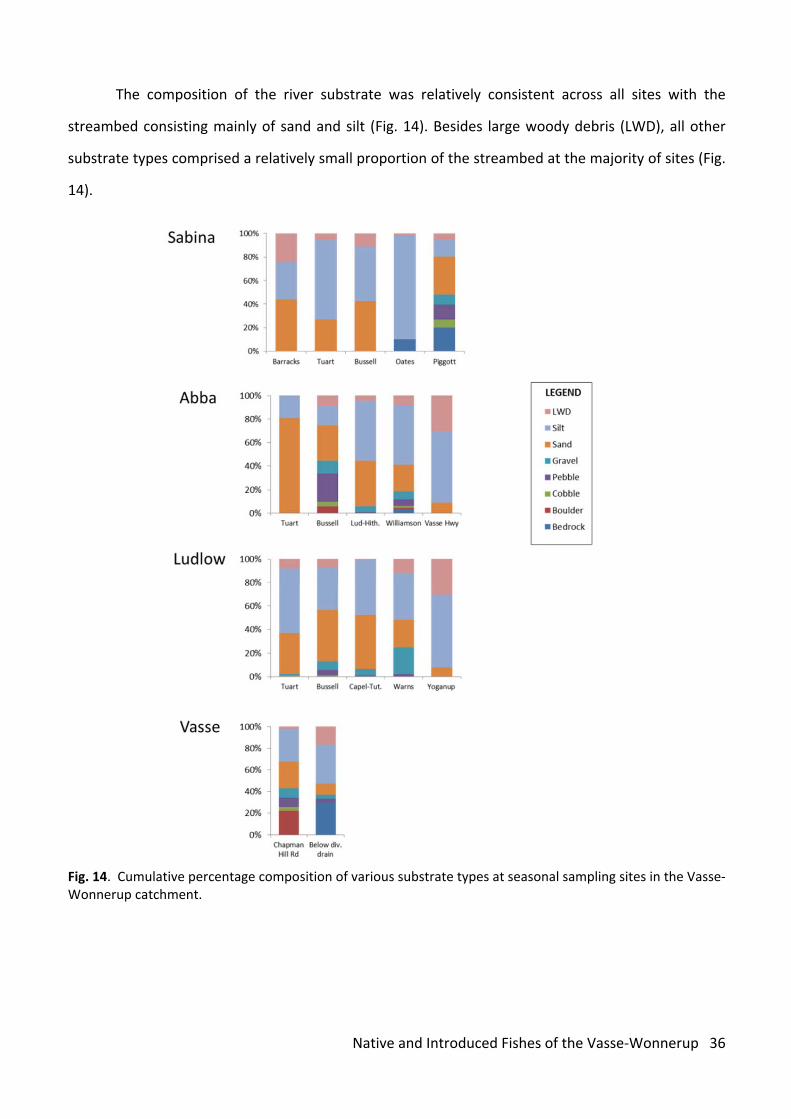
The composition of the river substrate was relatively consistent across all sites with the
streambed consisting mainly of sand and silt (Fig. 14). Besides large woody debris (LWD), all other
substrate types comprised a relatively small proportion of the streambed at the majority of sites (Fig.
14).
Fig. 14. Cumulative percentage composition of various substrate types at seasonal sampling sites in the Vasse‐Wonnerup catchment.

Native and Introduced Fishes of the Vasse‐Wonnerup 37
As is typical of most small rivers in south‐western Australia, the rivers of the Vasse‐Wonnerup
catchment displayed a highly seasonal flow regime. In 2012, flow was absent at all except one site
during March/May sampling, and was only detected during September sampling at most sites,
although there were some sites (mostly in the Abba River) that had detectable flow into November.
Flow had ceased at all sites by the following February sampling period, but had resumed at all sites
except the upper Sabina River (Piggott Road) in June 2013 following decent autumn rainfall. Salinity
levels were intrinsically linked to the prevailing flow regime, with the highest levels occurring during
the hottest and driest period in March 2012, and the lowest levels coinciding with a period of strong
surface discharge in September 2012 (Fig. 15 b,d). Water temperatures followed a similar pattern to
salinity but the timings of the recorded minima and maxima in the various catchments were slightly
different. Temperatures peaked during November 2012 and February 2013 sampling and were at
their lowest in May 2012 (Fig. 14a). No clear seasonal trends were evident in the dissolved oxygen
concentration data (Fig. 15c).
Fig. 15: Seasonal variation in a) mean water temperature, b) mean salinity, c) mean dissolved oxygen, and d) discharge at selected sites in the Sabina, Abba, and Ludlow rivers during the study.
b)
a)

Native and Introduced Fishes of the Vasse‐Wonnerup 38
Fig. 15 cont.: Seasonal variation in a) mean water temperature, b) mean salinity, c) mean dissolved oxygen, and d) discharge at selected sites in the Sabina, Abba, and Ludlow rivers during the study.
Introduced species removal
The removal of Goldfish became the focus of our introduced species control efforts during the study
when it became apparent from our seasonal sampling data that only two other introduced species
occurred in the Vasse‐Wonnerup catchment (i.e. Eastern Gambusia and Yabby), both of which are
notoriously difficult to control effectively. This highlights the adaptive approach the project adopted
where constant review of our data with the VWPFSC enabled decisions to be made to adapt our
monitoring and control efforts.
Targeted boat electrofishing efforts resulted in the capture and removal of 842 Goldfish from
the lower Vasse River. Notably, this amount outnumbers those removed in nine previous removal
events combined, stretching back to December 2003. There was a consistent trend in the numbers of
Goldfish removed (usually ≤ 100 individuals per removal event) with one notable exception: the first
removal event of the current study in March 2012, in which over 550 specimens were captured (Fig.
c)
d)

Native and Introduced Fishes of the Vasse‐Wonnerup 39
15). This unprecedented catch was probably caused by the drying of habitat in the adjoining New
River Wetland, due to exceptionally hot and dry conditions over the preceding summer, which
resulted in a mass downstream migration of Goldfish into the lower Vasse main channel where they
were subsequently caught. This event helped improve the success of this project in terms of boosting
the numbers of introduced fish removed, but more significantly, it highlighted the importance of the
New River Wetland for this population. This information will greatly assist future Goldfish control
efforts in this system. Following the exceptionally large catch in March 2012, the numbers removed
declined noticeably with each control event throughout the remainder of the year (Fig. 16), reflecting
the fact that the Goldfish population had been greatly reduced by the removal program. However,
following spring breeding and a flush of new recruits in the population, the number of Goldfish
removed increased to over 100 in March 2013 (Fig. 16).
Fig. 16: Numbers of Goldfish removed from the lower Vasse River, 2003‐2013. Only the final five removal events were undertaken as part of the current project; however, note that all removal events involved the same methodology and comparable eradication effort.

Native and Introduced Fishes of the Vasse‐Wonnerup 40
Of the other introduced aquatic species captured in rivers of the Vasse‐Wonnerup, a total of
26,081 Eastern Gambusia and five Yabbies were removed. The low numbers of Yabbies captured
during the study reflects a low relative abundance for this species in these rivers. Importantly, no
other introduced species were detected as part of the comprehensive seasonal monitoring program
in the estuary or rivers of the Vasse‐Wonnerup. This project has provided a valuable baseline dataset
for long‐term monitoring of both the native and introduced fish communities in these rivers. A key
recommendation is ongoing community education on the impacts of introduced aquatic species to
help mitigate the risk of additional introductions (see Recommendations).
Fin damage by Eastern Gambusia
All native fish received some damage to their fins that typified attack by Eastern Gambusia (Fig. 17).
Fin‐nipping was most severe on Western Pygmy Perch and peaked at 1.55 (±0.30) in March 2012
falling to a minimum of 0.21 (±0.11) in September 2012 (Figure 2). The life‐cyle of the Eastern
Gambusia lifecycle results in its densities being greatest in late summer – early autumn and it
appeared that the degree of damage to native species was associated with the densities of the
introduced species.

Native and Introduced Fishes of the Vasse‐Wonnerup 41
Fig. 17: Combined (across all rivers sampled) mean fin‐nipping scores for each native fish captured in each month sampled. N.B. also presented is the mean density of G. holbrooki in each sampling month.
Acoustic tracking of Goldfish
Overall number of detections and site fidelity
In total, each fish was detected an average of 27189 (±5573 S.E.) times in the receiver array. Five of
the 21 fishes were excluded from the analysis (i.e. 7574, 7575, 7580, 7583 and 7593) as they were
not recorded for more than 30 of the 391 day period and 7576 was also excluded because it
appeared to have died (recorded at one receiver constantly) (Table 2). The data for subsequent
analysis was also trimmed slightly to encompass the period December 15 2012 ‐ December 14 2013
(i.e. 365 days). This was undertaken to allow for more standardised analyses among fishes (i.e. the
period ends on the last full day before the first battery died) and to account for any unusual
behaviour the fish may have displayed in the 10 day period following tagging.

Native and Introduced Fishes of the Vasse‐Wonnerup 42
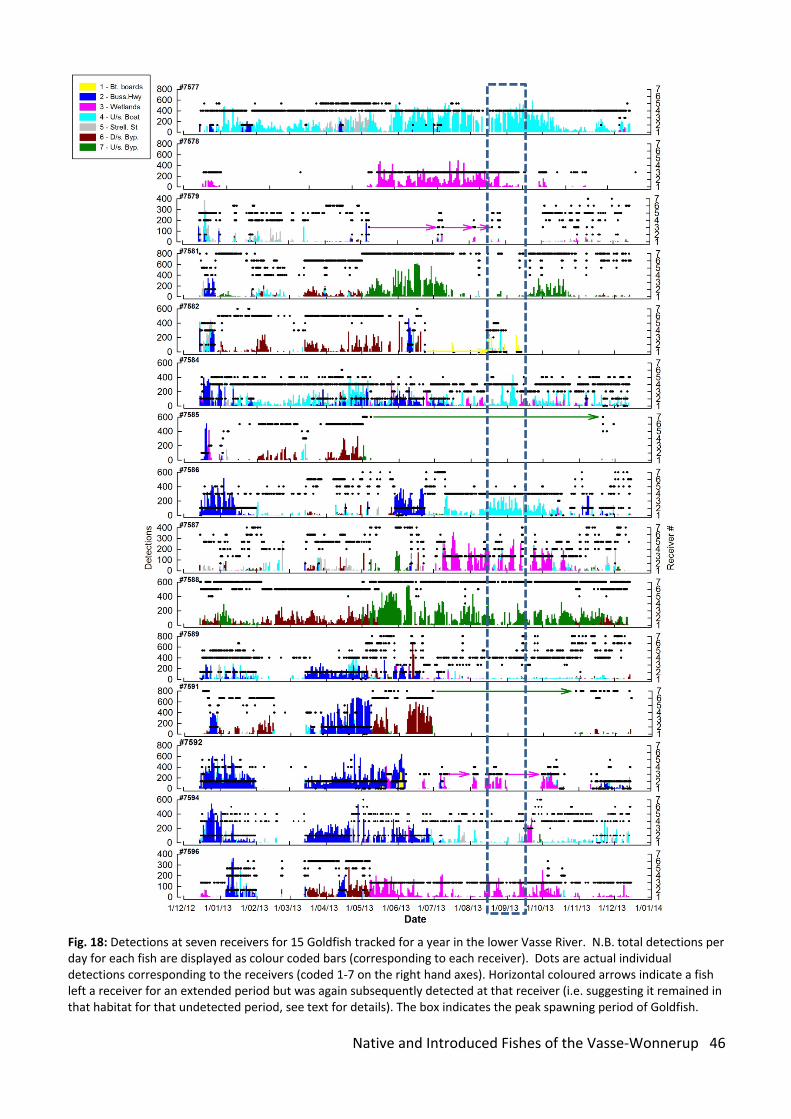
Examination of the remaining 15 fishes revealed that there were a total of 403728 detections
over the 1 year period (Table 2). The fishes spent the majority of their time within the array with
several notable exceptions of those with lengthy non‐detection periods (Fig. 18). Of these, most
displayed “home‐ranging” tendencies, where regular detections were made at one or two receivers,
interspersed with comparatively less detection at other receivers in the array (Fig. 18). A minority of
tagged Goldfish did not display such site fidelity, with large numbers of consecutive detections at any
one receiver being the exception for these individuals (e.g. #7576, #7579, #7581, Fig. 18).
No fish were detected at the eighth receiver downstream of the bypass (Figs 18, 19). Highest
site fidelity was recorded at the receiver upstream of the boat ramp adjacent to the Busselton Shire
(Figs 2, 3) which was situated within the infestation of water lilies that expanded rapidly throughout
the one year study to eventually completely prevent boat passage (Fig. 20). Fourteen of the 15 fish
(93%) visited that site at least once and on average fish visited this site on 27% of the total days
throughout the year (Table 3, Fig. 18). Other key habitats included the New River Wetlands (80% of
fish detected at least once and on average each fish detected on 22% of all days), Strelley St (93% of
fish detected and average each fish detected on 21% of all days) (Table 3, Fig. 19). The least visited
site (other than the receiver below the Diversion Drain) was the Vasse‐Wonnerup Wetlands
immediately downstream of the Butter Boards; however, this site was still visited by 47% of the
fishes at an average rate of ~5% of all days (Table 3, Figs 18, 19).
Two fish (#7585 and #7591) spent considerable time outside of the array likely in the lengthy
(~3 rkm) region between receiver 7 (upstream of the Bypass) and the Diversion Drain (that had zero
detections). This was assumed as there were long periods (>3 months) between detections at the
former receiver during which time they were not detected at the other receivers (Fig. 18). One fish
(#7582) spent considerable time at receiver 1 in the Vasse‐Wonnerup Wetlands (downstream of the
array) and was last detected at that site in mid‐September (Figure 18).
Seasonal patterns in movement
There were clear seasonal shifts in habitat usage for most fish. Of particular note was the
decline from the summer/autumn period compared to the winter/spring period in the number of fish

Native and Introduced Fishes of the Vasse‐Wonnerup 43
and detections at the two receivers at Bussell Hwy and downstream of the Bypass (Fig. 18). The
catch‐per‐unit‐effort (CPUE) had been recorded as consistently high at the Bussell Hwy site and
around the Boat Ramp during previous Goldfish control events. Those results combined with the
acoustic telemetry data from this study provide solid evidence to indicate that these sites are likely
to be the most important refuge or shelter site for Introduced Goldfish in the Vasse River during the
summer/autumn period. Conversely, a considerable increase in the number of fish was detected in
the New River Wetland during this high flow period (Fig. 19). The receiver upstream of the boat
ramp had relatively consistent residency throughout the study period (Fig. 19).
During the month encompassing the known breeding period of Goldfish (birth day was
assigned as September 1st in Morgan and Beatty, 2007) between 15th August and 15th September,
there were clear preferences for regions (Table 2, Figs 18, 19). Equal numbers of fish (i.e. nine) were
detected at the New River Wetlands and the Boat Ramp during that time (Table 2). The third most
number of fish (i.e. 8) were detected at the Strelley St receiver followed by upstream (four fish) and
downstream (three fish) of the bypass with the receiver at the upstream end of the Vasse Wonnerup
Wetlands detecting one fish (Table 2). This suggests that the New River Wetland and the habitat
upstream of the Boat Ramp (likely to be within the infestation of water lilies) are the key spawning
sites of the fish as all those tagged were mature individuals.

Native and Introduced Fishes of the Vasse‐Wonnerup 44
Table 2: Detection data from the 21 C. auratus passive acoustically tracked in the Lower Vasse River between
December 2013 and January 2014. N.B. shaded fish were excluded from the overall analysis.
Fish ID
TL Tag location Tag date Days at
liberty
# of detections
# receivers detected at
Days detected
Residency index
Dmin (km)
7574 374 DS of Bypass 06‐Dec‐12 3 384 4 3 100.0 4.6
7575 233 US of Bypass 06‐Dec‐12 22 1168 5 18 81.8 7.23
7576 277 US of Bypass 06‐Dec‐12 375 97881 6 344 91.7 33.67
7577 355 Boat ramp 05‐Dec‐12 391 67324 6 381 97.4 82.55
7578 260 Boat ramp 05‐Dec‐12 391 16792 4 154 39.4 7.41
7579 280 Boat ramp 05‐Dec‐12 391 5718 6 186 47.6 129.08
7580 290 DS of Bypass 06‐Dec‐12 10 1278 5 10 100.0 14.14
7581 294 US of Bypass 06‐Dec‐12 391 37497 5 308 78.8 116.96
7582 371 US of Bypass 06‐Dec‐12 282 20439 7 177 62.8 82.8
7583 265 Boat ramp 05‐Dec‐12 5 497 3 5 100.0 0.62
7584 370 Boat ramp 05‐Dec‐12 391 35606 6 378 96.7 229.42
7585 290 Boat ramp 05‐Dec‐12 382 7985 6 96 25.1 8.71
7586 297 US of Bypass 06‐Dec‐12 390 31363 7 329 84.4 165.34
7587 314 US of Bypass 06‐Dec‐12 383 19547 6 293 76.5 111.5
7588 265 US of Bypass 06‐Dec‐12 391 48561 5 377 96.4 93.06
7589 309 US of Bypass 06‐Dec‐12 390 25008 7 342 87.7 231.32
7591 280 Boat ramp 05‐Dec‐12 382 40645 6 223 58.4 34.5
7592 357 Boat ramp 05‐Dec‐12 391 56735 5 290 74.2 99.34
7593 262 US of Bypass 06‐Dec‐12 17 106 6 8 47.1 9.19
7594 306 US of Bypass 06‐Dec‐12 391 37476 7 357 91.3 163.23
7595 273 US of Bypass 06‐Dec‐12 391 18966 5 347 88.7 86.83
min 233 3 106 3 3 25.1 0.62
max 374 391 97881 7 381 100.0 231.32
avg 301.0 293.3 27189.3 5.6 220.3 77.4 81.5
se 9.03 35.62 5573.42 0.23 31.49 4.87 15.88

Native and Introduced Fishes of the Vasse‐Wonnerup 45
Table 3: Overall number of fish and the number of detections at each receiver, and the mean percentage of
daily visits per fish at each receiver (i.e. site fidelity). Also shown are the same detection data during the
month around the known peak breeding period of Goldfish (i.e. 15th August – 15th September) in the Vasse
River.
Entire study Breeding period Receiver ID Number of
fish detected (% total)
Total detections (% total)
Mean % of total days visited per fish (± 1S.E.)
Number of fish detected (% total)
Total detections (% total)
Mean detections/fish (± 1 S.E.)
U/S of Bypass 10 (67) 58150 (14) 18.57 (7.34) 4 (27) 3519 (12) 880 (748)
D/S of Bypass 12 (80) 52186 (13) 18.93 (3.65) 3 (20) 37 (0.1) 12 (1)
Strelley St 14 (93) 19521 (5) 21.02 (6.36) 8 (53) 488 (1.6) 61 (22)
Boat Ramp 14 (93) 104756 (26) 27.03 (7.67) 9 (60) 17298 (58) 1922 (1012)
New River
Wetlands
12 (80) 48449 (12) 21.87 (7.73) 9 (60) 7023 (24) 780 (335)
Bussel Hwy 13 (87) 117177 (29) 16.31 (4.60) 0 (0) ‐ ‐
Vasse‐
Wonnerup
Wetlands
7 (47) 3489 (0.86) 4.73 (1.78) 1 (7) 1388 (47) 1388
TOTAL 403728 29753
Native and Introduced Fishes of the Vasse‐Wonnerup 46
Fig. 18: Detections at seven receivers for 15 Goldfish tracked for a year in the lower Vasse River. N.B. total detections per day for each fish are displayed as colour coded bars (corresponding to each receiver). Dots are actual individual detections corresponding to the receivers (coded 1‐7 on the right hand axes). Horizontal coloured arrows indicate a fish left a receiver for an extended period but was again subsequently detected at that receiver (i.e. suggesting it remained in that habitat for that undetected period, see text for details). The box indicates the peak spawning period of Goldfish.

Native and Introduced Fishes of the Vasse‐Wonnerup 47
Month
Jan Feb Mar Apr May Jun Jul Aug Sep Oct Nov Dec
Num
ber o
f fis
h
0
5
10
15
20
25
30
Bt. BoardsBuss. HwyN/R WetlandsU/s. BoatStrell. StD/s. bypassU/s. bypass
Fig. 19: Number of fish at each of the seven receivers in each day over the one year period in the lower Vasse River. N.B. each receiver is colour coded and note the clear increase in the number of fish detected in the New River Wetland (pink) during the winter and spring, and decrease in the fish detected at the Bussell Hwy Bridge and downstream of the Bypass during spring. N.B. The box indicates the peak spawning period of Goldfish.

Native and Introduced Fishes of the Vasse‐Wonnerup 48
Fig. 20: Images of a phenomenal expansion in the water lily infestation in the lower Vasse River during the study period.
Native and Introduced Fishes of the Vasse‐Wonnerup 49
Diurnal patterns in movement
There was a clear increase in the overall number of detections between midday and midnight in
autumn and winter with this pattern not evident in summer and spring (Fig. 21). In terms of
diurnal patterns at individual receivers, a clear reduction in the number of detections occurred
at the Bussell Hwy site between mid‐morning to dusk in suggesting that fish were using the
bridge as an evening refuge (Fig. 22). In autumn, an increase in the number of detections
occurred at the site downstream of the Bypass and the Boat Ramp between late morning to
early evening. In winter, a similar increase in detections occurred from early morning to early
evening at the Boat Ramp, New River Wetlands, and upstream of the Bypass. There was no
clear diurnal pattern in number of detections in spring (Fig. 22).
An example of a diurnal movement pattern is presented for fish #7595 that measured
273 mm TL (Fig. 23). For example, during the period 7/1/13 to 14/1/13, fish #7595 was recorded
undertaking regular movements back and forth between the Town Bridge and Strelley Street
Bridge receivers (Fig. 23); a round trip distance of about 1.8 km. Most of these movements took
place during daylight hours, followed by sedentary periods of 12‐16 hours where the fish was
detected at regular intervals, mostly at the Town Bridge site (Fig. 23).

Native and Introduced Fishes of the Vasse‐Wonnerup 50
Average detections/fish
Hour
0 5 10 15 20
Ave
rage
det
ectio
ns p
er fi
sh
0
200
400
600
800
1000
1200
1400
1600
1800
Summer Autumn Winter Spring Combined
Fig. 21: Average detections over 24 hour period in each season and over all seasons. N.B. the increase in detections between midday through to midnight during the autumn and winter.

Native and Introduced Fishes of the Vasse‐Wonnerup 51
Summer
0 2 4 6 8 10 12 14 16 18 20 22 240
1000
2000
3000
4000 Butter BoardsBussel HwyWetlandsBoat RampStrelley StD/S BypassU/S Bypass
Autumn
0 2 4 6 8 10 12 14 16 18 20 22 240
1000
2000
3000
4000
Winter
0 2 4 6 8 10 12 14 16 18 20 22 24
Num
ber o
f det
ectio
ns
0
1000
2000
3000
4000
Spring
Hour
0 2 4 6 8 10 12 14 16 18 20 22 240
1000
2000
3000
4000
Fig. 22: Total detections over 24 hour period in each season at the seven receivers in the lower Vasse River.

Native and Introduced Fishes of the Vasse‐Wonnerup 52
Fig. 23: Detection plot for fish #7595 during a week in January 2013. Dark bars indicate night periods, and white bars daylight periods.
Average Dmin (km) was 81.5 rkm of movement with a maximum of 231.3 rkm recorded
for fish 7589 (309 mm TL) (Table 2). A closer look at the data for some of the wider ranging
individuals revealed relatively high levels of mobility over short timeframes. For example, fish
#7589 (309 mm TL at time of capture) moved back and forth between the receiver located
upstream of the Bussell Highway Bypass and the Town Bridge site over a 24 hour period on 16‐
17 May 2013, covering a stream distance of at least 5.4 km, and repeated the journey, albeit
more slowly (~48 hours), two days later (Fig. 17). These data on movement demonstrate that
Goldfish in the Vasse River are highly mobile, which, along with the hardy and adaptable biology
of the species, adds to the challenge of controlling this introduced population. Moreover, these
distances obviously greatly underestimate the actual distance travelled by the fishes over the
one year period as are only calculated based on movement between receivers. However, as
discussed below, this study has also identified a potentially exciting opportunity for control due
to it identifying key breeding habitats.
.9 km
Native and Introduced Fishes of the Vasse‐Wonnerup 53
Prior to this study, we hypothesised that the New River and associated wetlands may
play an important role as a potential spawning area for introduced Goldfish in the Vasse River.
The extent to which the New River was utilised varied greatly among individual tagged fish, with
some being detected there regularly, whilst others considerably less so with 80% of individuals
being detected in the system at least once during the study and 60% during the peak breeding
period (as revealed by Morgan and Beatty 2007 (Table 3, Fig. 17). The study has therefore
confirmed that the wetlands were one of the top two breeding habitats and perhaps also
nursery habitat (along with the site upstream of the Boat Ramp). Therefore there exists an
opportunity to design a simple funnel barrier that could be installed at the narrow entrance to
the New River Wetland that enables one‐way passage of Goldfish in but then prevents
downstream movement back into the lower Vasse River. As the New River Wetland usually dries
substantially, this could then enable targeted removal (such as netting or application of a
piscicide such as rotenone) to eliminate a large proportion of the breeding stock. Consideration
would need to be made on monitoring the barrier to prevent build‐up of debris, and also the
possibility of trapping other native fishes (i.e. Sea Mullet) in the Wetland.
We had previously suspected that the Vasse‐Wonnerup estuary could be utilised as a
pathway of dispersal by Goldfish, particularly during periods of peak flow. Confirming this fear,
the current study detected 40% of large goldfish accessing the Vasse‐Wonnerup Wetlands at
least once (in the Lower Vasse Wetlands). Furthermore, the estuarine sampling component in
the current report revealed juvenile Goldfish to be present in the Lower Vasse Wetlands, and
the Upper and Lower Vasse Estuary at salinities of ~17 ppt.
Lab trials on the salinity tolerances of Goldfish conducted as part of this project
determined that salinity levels in the estuary do indeed fall to within threshold tolerance levels
of the species in winter (see also the Spatial and temporal changes the abundance and
distribution of introduced fish in the Wetland section in the current report). The salinity
tolerance of the Vasse River Goldfish revealed the population had an acute tolerance of ~11 ppt,
but alarmingly a gradual tolerance of ~21ppt. Therefore, it is clear that this species is seasonally
moving into the Vasse‐Wonnerup Wetland, and a small proportion of individuals may even be
Native and Introduced Fishes of the Vasse‐Wonnerup 54
reproducing in the Lower Vasse Wetland. Therefore, it is plausible and possibly inevitable, that
Goldfish could spread to other rivers in the Vasse‐Wonnerup catchment via the Estuary.
Fortunately, our rigorous seasonal monitoring in the rivers revealed that this dispersal avenue
has not yet taken place and there remains an opportunity to concentrate control efforts on the
Vasse River population.
Summary
A total of 66,944 individual fishes and decapod crustaceans representing 12 species were
captured during riverine sampling. These included three south‐western Australian
endemic freshwater fishes, three native estuarine fishes, two introduced fishes, three
native decapod crustaceans, and one introduced decapod crustacean.
The project has resulted in the removal of 26,081 introduced Eastern Gambusia and 842
Goldfish from rivers of the Vasse‐Wonnerup catchment. The removal of large numbers of
mature Goldfish during this project was likely to significantly reduce the rate of
recruitment in spring 2013.
The comprehensive seasonal sampling did not reveal any unexpected pest species
incursions.
The highest aquatic biodiversity sites were in the lower reaches of the river catchments.
These sites tend to hold permanent water and act as vital refugia for aquatic species
during the dry summer/autumn baseflow period.
Sites located further upstream in the rivers only held water in winter/spring and housed
fewer aquatic species. However, native fishes were found to utilise upstream sites,
indicating that seasonal migration is an important life history trait and longitudinal
stream connectivity must be considered to effectively manage native freshwater fish
populations in the Vasse‐Wonnerup.
Stream habitats were generally degraded throughout the catchments, except in the
headwater reaches located on the Darling/Whicher range, which were near pristine.
Habitats were most highly degraded in the middle reaches of rivers, in the agricultural
and grazing land lying between Bussell Highway and the foot of the scarp.

Native and Introduced Fishes of the Vasse‐Wonnerup 55
The project resulted in a world‐first passive acoustic tracking study of an invasive
Goldfish population in order to better focus future control efforts.
In the 12 month duration of the tracking study, 530,913 detections were recorded on the
array. Of the 15 Goldfish tracked for the entire year, highest site fidelity (in terms of
percentage of days visited) was recorded at the receiver upstream of the Boat Ramp near
the Shire (93% of fish, 27% of days), followed by the New River Wetlands (80% of fish,
22% of days). The least amount of detections were recorded in the Ramsar listed Vasse‐
Wonnerup Wetlands (i.e. the Lower Vasse River Wetlands), however, 47% of fish were
still detected there at least once during the study.
Tagged Goldfish were far from being sedentary, and on average covered a minimum
stream distance (Dmin) of 84.28 km over a 10 month period (one fish moved 231.3 km).
However, actual distances travelled would have been much greater than these values as
Dmin only takes into account straight line movements between receivers. Movements of
at least 5.4 km in a 24 hour period were recorded for some individuals, indicating that
the species is highly mobile in the Vasse River.
There were considerable seasonal patterns in habitat use with a distinct movement away
from the Bussell Hwy and downstream of the Bypass sites between summer/autumn and
winter/spring. Between these same periods, a distinct shift occurred towards the New
River Wetlands.
The key sites utilised during the known period site of Goldfish were the site upstream of
the Boat Ramp and the New River Wetland (60% of fish detected) suggesting they were
the key spawning habitats. Furthermore, 80% of Goldfish were detected in the New
River Wetland at some stage during the study. Several trends in diurnal movement
patterns were also detected that also changed seasonally.
As almost half of tagged Goldfish were detected in the Ramsar listed Lower Vasse River
Wetland and the salinity tolerance of Goldfish determined during the study (i.e. 11 ppt
acute, and 21 ppt gradual tolerance), it is plausible that the species can use the estuary
as a dispersal pathway into other rivers of the Vasse‐Wonnerup during spring when
diluting flows lower salinity levels within threshold limits. This was also supported by the

Native and Introduced Fishes of the Vasse‐Wonnerup 56
findings of the Wetland component of the current study that detected large numbers of
juveniles using the Vasse axis of the wetlands.
However, rigorous seasonal sampling in both estuarine and riverine waters throughout
the Vasse‐Wonnerup failed to detect the species outside of the lower Vasse River and
upper Vasse Estuary, indicating that such dispersal has not yet taken place.
Information gathered during this study will be critical to future management as it allows
clarity and confidence in the allocation of resources for ongoing introduced species
prevention and control efforts in the VWWS (please see the Table of Monitoring and
Management Recommendations at the rear of the report).

Native and Introduced Fishes of the Vasse‐Wonnerup 57
Fish faunas of the Vasse‐Wonnerup Wetland System
Wonnerup Estuary

Native and Introduced Fishes of the Vasse‐Wonnerup 58
Introduction
The Vasse‐Wonnerup Wetland System (VWWS) is a shallow, intermittently‐open, nutrient‐
enriched system located near the town of Busselton, Western Australia (Brearley, 2005). The
wetland provides habitat for over 37,500 water birds comprising ~90 species, a function that is
recognised by its designation in 1990 as a Wetland of International Importance under the
Ramsar Convention (Lane et al., 2007). However, although the importance of the VWWS is well
recognised, its catchment has undergone substantial anthropogenic modification. For example,
much of the catchment has been cleared, primarily for cattle grazing, extensive drainage
networks have been constructed, several rivers that used to flow into the system have been
diverted to the sea and floodgates have been installed in the exit channels of the estuaries to
prevent seawater intrusion (Lane et al., 1997). Furthermore, the large amounts of fertilizer
applied to crops, combined with animal waste discharged from pastures into the estuaries,
resulted in the VWWS becoming “the most grossly enriched major wetland system known in
Western Australia” (McAlpine et al., 1989). Moreover, without management intervention,
nutrient loads are expected to increase over the next 20 years due to increased urbanisation and
more intensive agriculture (Department of Water, 2010). These factors have led to a multiplicity
of detrimental effects, including increases in the prevalence of eutrophication, algal blooms,
anoxia, fish kills, undesirable odours, mosquito problems and the death of fringing vegetation
(Lane et al., 1997; Brearley, 2005).
Fish kills occur regularly in the Vasse‐Wonnerup. Reports of such events date back to
1905 and they have occurred as recently as January and February 2012, April 2013 and February
2014, with the causes ranging from anoxia to high temperatures, algal blooms and/or toxic
phytoplankton (Lane et al., 1997; Lynch, 2013; Hart, 2014; J.Tweedley per. obs.). However,
despite the frequency of these events and the ecological importance of the VWWS, the only
quantitative information on the fish fauna of any parts of this system, was that collected from
the nearshore waters of the Vasse and Wonnerup estuaries during January 2012 by Tweedley et
al., (2012). Such a study is fundamental to understanding the ecological functioning of this
system, particularly as fish constitute a substantial component of the diet of at least 24 bird

Native and Introduced Fishes of the Vasse‐Wonnerup 59
species which utilise this system and are key to the Vasse‐Wonnerup maintaining its Ramsar
status (Wetland Research and Management 2007). Furthermore, the collection of quantitative
data on the fish fauna is essential in developing an understanding of the ecology of the wetland
and, if sufficient in scope, would also allow the development of quantitative tools for monitoring
the future ecological health of the VWWS (e.g. Harrison and Whitfield 2004; Breine et al., 2007;
Hallett et al., 2012a; 2012b). Such empirically‐based tools could underpin a rigorous assessment
of the effectiveness of management actions, including recent efforts to reduce nutrient input
(Department of Water 2010).
In light of the above, the main aim of this study was to conduct a detailed quantitative
survey of the characteristics of the fish fauna of the nearshore waters of all regions of the Vasse‐
Wonnerup seasonally over 18 months between February (summer) 2012 and May (autumn)
2013, including the presence of any introduced species of fish, as two species were found by
Tweedley et al., (2012).
Materials and Methods
Sampling regime
The fish fauna of the shallow, nearshore waters of the Vasse‐Wonnerup was sampled during the
last month of each season between February (summer) 2012 and November (spring) 2013 at
each of the seven regions of the VWWS, i.e. the Deadwater, Wonnerup Inlet, lower and upper
Vasse Estuary, lower and upper Wonnerup Estuary and the Lower Vasse River Wetlands (Fig. 1;
Appendix 3). Note that no sampling was conducted in the upper Vasse and Wonnerup estuaries
in May 2012 and February 2013 as the sites in those regions were completely dry (see Appendix
3) and thus contained no fish. Sampling of the deeper, offshore waters was also undertaken in
August and November 2013 in the Deadwater and Wonnerup Inlet. During each of the above
sampling occasions, samples of the fish fauna were collected at four sites representing each of
the regions (Fig. 1).
Samples of the fish fauna in nearshore waters were collected using a seine net that was
21.5 m long and consisted of two 10 m long wings (6 m of 9 mm mesh and 4 m of 3 mm mesh)

Native and Introduced Fishes of the Vasse‐Wonnerup 60
and a 1.5 m long bunt made of 3 mm mesh. The net, which was laid parallel to the shore and
then hauled onto the beach, fished to a depth of 1.5 m and swept an area of 116 m2 (Fig. 2). Two
replicate samples were collected at each site, on each sampling occasion.
Upon capture, all fish collected using the seine net were immediately euthanised in an
ice slurry (Murdoch University Animal Ethics Permit #RW2471_12). The total number of
individuals of each fish species in each sample was then recorded and the total length of each
individual measured to the nearest 1 mm, except when a large number of any one species was
caught, in which case the lengths of a random subsample of 100 fish were measured.
Three replicate values for salinity, water temperature (°c) and dissolved oxygen
concentration (mg L‐1) were also measured in the middle of the water column at each site at the
time of fish collection using a Yellow Springs Instrument 556 water quality meter (www.ysi.com).

Native and Introduced Fishes of the Vasse‐Wonnerup 61
Fig. 1: Map of the Vasse‐Wonnerup wetland System, showing the location of the sites sampled with a 21.5 m seine net seasonally between February 2012 and November 2013.

Native and Introduced Fishes of the Vasse‐Wonnerup 62
Fig. 2: Photograph showing the sampling of the nearshore waters of the Deadwater using a 21.5m seine net. Photo James Tweedley.
Life cycle category and guild
Each fish species was assigned to a life‐cycle guild within a category according to the way in
which it uses estuaries (Potter et al., 2014), based on numerous studies of the biology of fish
species in south‐western Australia as reported in the review of Potter and Hyndes (1999).
Definition of the three categories and seven guilds relevant to the current study are as follows.
Marine category, i.e. species that spawn at sea. Marine straggler (MS) guild, i.e. species that
spawn at sea and typically enter estuaries sporadically and in low numbers and are most
common in the lower reaches, where salinities typically do not decline far below ~35. Marine
estuarine‐opportunist (MEO) guild, i.e. species that spawn at sea and regularly enter estuaries in
substantial numbers, particularly as juveniles, but can also use coastal marine waters as
alternative nursery areas. Estuarine category, i.e. species with populations in which the
individuals complete their life cycles within the estuary. Solely estuarine (E) guild, i.e. species
typically found only in estuaries. Estuarine and marine (E&M) guild, i.e. species represented by
populations whose individuals complete their life cycle either in estuaries or coastal marine

Native and Introduced Fishes of the Vasse‐Wonnerup 63
waters. Estuarine and freshwater (E&F) guild, i.e. species represented by populations whose
individuals complete their life cycle either in estuaries or fresh water. Freshwater category, i.e.
species that spawn in freshwater. Freshwater straggler (FS) guild, i.e. species that are found in
low numbers in estuaries and whose distribution is usually limited to the low salinity, upper
reaches of estuaries. Freshwater estuarine‐opportunist (FEO), i.e. species found regularly and in
moderate numbers in estuaries and whose distribution can extend well beyond the oligohaline
sections of these systems. No species belonging to the diadromous category, i.e. species that
migrate between the sea and freshwater, such as the Pouched Lamprey (Geotria australis) were
recorded in this study.
Statistical analyses
Each of the following statistical analyses were performed using the PRIMER v6 multivariate
software package (Clarke and Gorley, 2006) with the PERMANOVA+ add‐on module (Anderson
et al., 2008). As no samples were collected from the upper Vasse and Wonnerup estuaries in
May 2012 or February 2013 due to them being dry the data for those regions in those seasons
were excluded from any statistical analyses. However, unlike ‘traditional’ parametric analyses,
the permutational tests employed below remained unaffected by unbalanced statistical designs.
Numbers of species and densities of fishes
The number of species and density (fish 100 m‐2) of fishes recorded at each of the four sites
sampled in the seven regions of the Vasse‐Wonnerup in the eight consecutive seasons between
February 2012 and November 2013 (with the exception noted above) were separately input to
univariate Analysis of Variance, but using the permutation form in which the statistical tests do
not make traditional normality assumptions (Anderson, 2001). This is effected as a special case
of multivariate analysis in PRIMER v6 software (Clarke and Gorley 2006) by constructing a
Euclidean distance matrix among values of the single variable and entering those into the
PERMANOVA routine (Anderson et al., 2008). The resulting tests determined whether the

Native and Introduced Fishes of the Vasse‐Wonnerup 64
number of species and density of fishes differed significantly between years (2 levels: 2012 and
2013), seasons (4 levels: February [summer], May [autumn], August [winter] and November
[spring]) and regions (7 levels: see Fig. 1), and the extent of any interactions among these
factors. All factors were considered fixed. In this and in all subsequent PERMANOVA tests the
null hypothesis of no significant difference among a priori groups was rejected if the significance
level (P) was < 5%, and the relative influence of each term in the model was quantified using the
F or, in the case of a multivariate test, pseudo‐F. Examination of the values for these variables
demonstrated that, prior to PERMANOVA, the number of species required a square‐root
transformation and density a loge(x+1) transformation to meet the test assumption of
homogeneous dispersions among a priori groups (see Anderson, 2001).
Multivariate analyses of spatial changes in species compositions
The numbers of each fish species recorded at each of the four sites in each region in each season
in 2012 and 2013, with the exception noted above, were subject to a pre‐treatment shown to be
effective for fish data of this type (Clarke et al., 2014). This involved a) dispersion weighting to
down‐weight the effects of those species whose numbers exhibited erratic differences among
replicate samples due to schooling (Clarke et al., 2006), followed by b) square‐root
transformation to down‐weight the contributions of species with consistently high values (across
replicates within a group) in relation to those with consistently low values. The resultant pre‐
treated data at each site on each sampling occasion were averaged and used to construct a
Bray‐Curtis similarity matrix, which was subjected to the same three‐way PERMANOVA design as
described above, though now with genuinely multivariate data, with the focus being on
determining whether there were significant interactions between year, season and region.
Separate two‐way crossed Analysis of Similarity tests (ANOSIM, Clarke and Green, 1988;
Clarke, 1993) were used to assess the relative magnitudes of overall year, season and region
factors (subsuming both main and interaction effects), via the universally‐scaled ANOSIM R
statistic. This was computed, in turn, for each factor (region, year or season) vs the other two
factors combined, thereby removing the combined effects of those other factors (see Lek et al.,

Native and Introduced Fishes of the Vasse‐Wonnerup 65
2011). In this and all subsequent ANOSIM tests, the null hypothesis that there were no
significant differences in ichthyofaunal composition among levels of a factor was rejected if the
significance level (P) was < 5%. The extent of any significant differences was determined by the
magnitude of the test statistic (R), which typically ranges between 0 (i.e. no group differences) to
1 (i.e. the similarities between samples from different groups are all less than those between
samples belonging to the same group).
As the above PERMANOVA tests detected significant interactions between years, seasons
and regions, the Bray‐Curtis similarity matrix was separated for each level of the relevant
temporal factor(s) in order to remove their confounding influence, and the various sub‐matrices
were then each subjected to one‐way Analysis of Similarities (ANOSIM) tests to elucidate, in
more detail, the extent to which ichthyofaunal composition differed among regions. The same
Bray‐Curtis submatrices were then used to construct a distance among centroids matrix, which
creates averages in the ‘Bray–Curtis space’ calculated from the replicate samples (Anderson et
al., 2008), and subjected to non‐metric Multidimensional Scaling (nMDS) ordination (referred to
as centroid nMDS ordination plots) in order to display visually the differences in the fish faunal
composition among regions.
When ANOSIM detected a significant difference among regions and the associated
R statistic was ≥ 0.2, Similarity Percentages (SIMPER, Clarke, 1993) was then used to elucidate
which species typified the assemblages in each region and those which contributed most to
differences between each pair of regions. Focus was placed on those typifying and distinguishing
species that had the highest similarity/standard deviation ratio and dissimilarity/standard
deviation ratio, respectively, and those that were the most abundant.
Whilst an a priori hypothesis was able to be constructed, stating that the fish fauna in the
Vasse‐Wonnerup would differ among the seven regions (see above), it was not possible to
predict which pairs of regions would be similar (see Tweedley et al., Submitted for a similar
problem and approach). Therefore, to identify those regions in which the fish fauna composition
did not differ significantly (and thus could represent ‘management units’), the pre‐treated faunal
data was averaged across seasons and years, thus creating a single value for each of the seven

Native and Introduced Fishes of the Vasse‐Wonnerup 66
regions) and used to construct a Bray‐Curtis similarity matrix. This matrix was then subjected to
hierarchical agglomerative clustering with group‐average linking (CLUSTER) and associated
Similarity Profile (SIMPROF) test (Clarke et al., 2008). A SIMPROF test was performed at each
node of the dendrogram to ascertain whether the particular group of samples (i.e. regions in the
Vasse‐Wonnerup) being subdivided contained any significant internal structure. This routine
thus provided a sound and objective basis for ascertaining the points in the clustering procedure
at which further subdivision of the samples was unwarranted. The null hypothesis that there
were no significant faunal differences among regions was rejected if the significance level (P)
associated with the test statistic (π) was < 5%.
Multivariate analyses of temporal changes in species compositions
The statistical analyses employed to elucidate any temporal changes in fish faunal composition
were identical to those described above for assessing the extent of any spatial changes. For
these analyses, the same Bray‐Curtis similarity matrix constructed from the dispersion weighted
and square‐root transformed fish data was employed. However, to assess whether the fish
composition varied among seasons and years in of the seven regions, this overall Bray‐Curtis
similarity matrix was separated into submatrices for each region and subjected to the same one‐
way ANOSIM, centroid nMDS and one‐way SIMPER employed above. Finally the pre‐treated fish
faunal data was averaged across region, used to construct a Bray‐Curtis similarity matrix and
subjected to the CLUSTER and SIMPROF routines described above, to determine in which
seasons and year the average fish fauna across the entire system was similar. Note that to assess
whether differences in the fish faunal compositions among the various season and year
combinations were driven by changes in the densities of key species rather than the presence of
those species, the CLUSTER‐SIMPROF procedure was employed again, only this time using a
Bray‐Curtis similarity matrix constructed from the presence or absence data of each species in
each season and year combination.

Native and Introduced Fishes of the Vasse‐Wonnerup 67
Results
Water quality
Mean salinity differed markedly among the seven regions in the Vasse‐Wonnerup and generally
among seasons (Fig. 5a). The seasonal trends in salinity among the different regions fell into one
of three groups, (i) those that underwent pronounced seasonal variation, i.e. the upper and
lower Vasse and Wonnerup estuaries, (ii) those that underwent some seasonal change in
salinity, i.e. the Deadwater and Wonnerup Inlet and (iii) those where salinity essentially
remained the same, i.e. the Lower Vasse River Wetlands.
The largest seasonal changes in salinity were recorded in the upper Vasse and Wonnerup
estuaries where salinities ranged from ~ 0.77 in the Upper Vasse in August 2013 to 111 in the
Upper Wonnerup in February 2013. Generally salinities were highest in February and May (when
water levels were lowest; see Appendix 4) and lowest in August and November. However,
rainfall in April 2013 caused a pronounced drop in salinity in May of that year (Fig. 5a). A similar
pattern in salinity was recorded in the lower Vasse and Wonnerup estuaries, however, by
comparison the maximum mean salinity recorded in either of these regions was 46 in the Lower
Vasse Estuary in May 2012. In contrast to the Vasse and Wonnerup estuaries, salinities in the
Deadwater and Wonnerup Inlet remained much more stable and generally around that of full
strength sea water. In August 2013, however, relatively heavy rainfall resulted in salinities in
Wonnerup Inlet dropping to 1.5 and those in the Deadwater to 13 (Fig. 5a). Salinities in the
Lower Vasse River Wetland were always low and ranged between 0.32 and 0.85, even during the
warm, dry summer months.
Mean water temperature in each of the regions followed a consistent trend, generally
being highest in February (~25 °C) and November (~22 °C) and lowest in May (~16 °C) and
August (~16 °C; Fig. 5b). Mean dissolved oxygen concentrations exhibited no clear trend either
among regions or seasons (Fig. 5c). In all cases the mean values for each season/year and region
combination were normoxic (i.e. an oxygen level that is above the ≤ 2 mg L‐1 definition of
hypoxia; Rosenberg, 1980). However, it is noteworthy that hypoxia was detected at individual
sites on three occasions (not shown on graph, but discussed later).
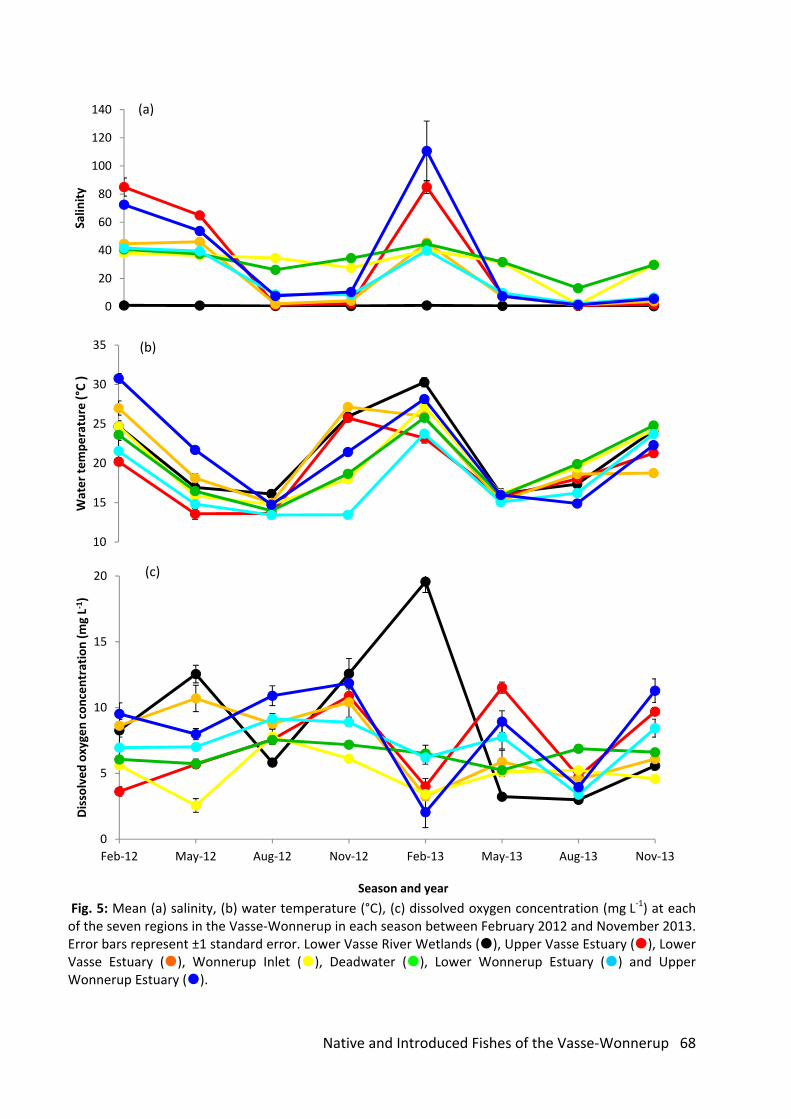
Native and Introduced Fishes of the Vasse‐Wonnerup 68
Fig. 5: Mean (a) salinity, (b) water temperature (°C), (c) dissolved oxygen concentration (mg L‐1) at each of the seven regions in the Vasse‐Wonnerup in each season between February 2012 and November 2013. Error bars represent ±1 standard error. Lower Vasse River Wetlands (), Upper Vasse Estuary (), Lower Vasse Estuary (), Wonnerup Inlet (), Deadwater (), Lower Wonnerup Estuary () and Upper Wonnerup Estuary ().
0
20
40
60
80
100
120
140
Salin
ity
(a)
10
15
20
25
30
35
Water temperature (°C
)
0
5
10
15
20
Feb‐12 May‐12 Aug‐12 Nov‐12 Feb‐13 May‐13 Aug‐13 Nov‐13
Dissolved oxygen concentration (mgL‐1)
Season and year
(b)
(c)

Native and Introduced Fishes of the Vasse‐Wonnerup 69
Overall number of species, density and life cycle category among regions
A total of 174,149 fish were recorded in the shallow, nearshore waters of the Vasse‐Wonnerup
between February 2012 and November 2013. These fish comprised 31 species, representing 18
families. The Atherinidae (silversides), Sillaginidae (whitings) and Gobiidae (gobies) were the
most speciose, with the first two families represented by five species and the last by three
species. In terms of individuals, the most abundant family were the silversides (~84%), whom
together with the gobies accounted for ~94% of all fish recorded.
Of the seven regions sampled throughout the Vasse‐Wonnerup, the Deadwater (25) and
Wonnerup Inlet (22) were by far the most speciose. Conversely, only five species were recorded
in the Upper Wonnerup Estuary (Table 1). However, it should be noted that, like the Upper
Vasse Estuary, this region was not sampled in two of the eight seasons as all the water had
evaporated (Appendix 3). The remaining regions all contained between 8 and 14 species. Like
the number of species, overall mean density of fish was also highest in the Deadwater (~780 and
~600 fish 100 m‐2, respectively) and the Lower Vasse River Wetlands (~670 fish 100 m‐2). In
contrast the lowest mean densities were recorded in the Upper Wonnerup and Vasse estuaries
(~19 and ~32 fish 100 m‐2, respectively).
Three of the four categories in the estuarine usage functional group were recorded in the
nearshore waters of the Vasse‐Wonnerup, i.e. freshwater, estuarine and marine species.
Although marine species were the most speciose, represented by 18 species, compared to
estuarine (8) and freshwater (4), fish belonging to this category only comprised ~2% of the total
number of fish. In contrast, estuarine species dominated the fish fauna contributing almost 95%
to the total number of fish recorded.
Four species, namely the Western Hardyhead, Elongate Hardyhead, Bluespot Goby and
Spotted Hardyhead, were the most abundant species, each representing ≥ 5% to the catch and
together contributing ~91% to the total number of individuals (Table 1). Particularly abundant
where the Western and Elongate hardyheads, which ranked in the top two in all regions except
the Lower Wonnerup Estuary and Lower Vasse River Wetlands where they ranked first and third
and first and fifth, respectively.

Native and Introduced Fishes of the Vasse‐Wonnerup 70
Table 1: Life cycle guilds (LC), mean density (fish 100 m2; , standard error (SE), percentage contribution to the overall catch (%), rank by density (R), mean total length (Lm) and length range (mm; LR) of each fish species recorded in each of the seven regions in the Vasse‐Wonnerup in each season between February 2012 and November 2013. Abundant species (i.e. those that contribute ≥ 5% to the catch) are highlighted in grey. In this and subsequent tables, life‐cycle guilds are abbreviated as follows: E, solely estuarine; E&M, estuarine & marine; E&F, estuarine and freshwater; MEO, marine estuarine opportunist; MS, marine straggler; FEO, freshwater estuarine‐opportunist and FS, freshwater straggler. The total number of species, mean overall density, number of samples and actual and adjusted number of individuals (i.e. after the number of individuals in each sample had been adjusted to that in 100 m‐2) are given for each region. Species ranked by total abundance. Scientific names are given in Appendix 6.
Entire estuary Lower Vasse River Wetlands Upper Vasse Estuary Lower Vasse Estuary
Common name LC SE % R LM LR SE % R SE % R SE % R Western Hardyhead E&F 164.23 53.62 45.51 1 34 14‐65 534.56 362.47 79.67 1 17.67 4.02 55.37 1 113.09 49.74 58.01 1 Elongate Hardyhead E 115.46 22.72 31.99 2 33 14‐87 0.85 0.59 0.13 5 8.76 3.59 27.46 2 54.74 28.80 28.08 2 Bluespot Goby E&F 25.74 4.48 7.13 3 24 8‐56 68.75 23.10 10.25 2 1.49 0.60 4.67 4 25.39 13.47 13.02 3 Spotted Hardyhead E 22.68 8.94 6.29 4 32 18‐61 0.16 0.14 0.08 5 Eastern Gambusia FEO 9.55 7.87 2.65 5 25 9‐57 61.83 55.02 9.21 3 0.08 0.08 0.04 8 Southern Longfin Goby E&M 9.52 2.18 2.64 6 33 12‐71 1.02 0.80 0.53 4 Sandy Sprat MEO 3.82 2.41 1.06 7 39 19‐56 Black Bream E 3.33 0.74 0.92 8 72 10‐242 0.05 0.04 0.03 9 Sea Mullet MEO 1.96 0.59 0.54 9 47 22‐217 0.01 0.01 0.01 14 Goldfish FS 1.09 0.34 0.30 10 30 10‐149 4.16 1.55 0.62 4 3.77 1.76 11.82 3 0.09 0.07 0.05 7 Yelloweye Mullet MEO 0.60 0.22 0.17 11 83 26‐235 Silver Fish E&M 0.59 0.22 0.16 12 34 21‐68 0.05 0.05 0.03 9 Common Silverbiddy MEO 0.54 0.39 0.15 13 34 14‐82 0.03 0.03 0.01 13 Trumpeter Whiting MEO 0.43 0.24 0.12 14 58 33‐107 Bridled Goby E&M 0.36 0.13 0.10 15 32 21‐56 0.11 0.11 0.06 6 Yellowtail Grunter E 0.18 0.05 0.05 16 80 24‐236 0.05 0.05 0.03 9 Western Pygmy Perch FS 0.18 0.12 0.05 16 28 14‐35 0.23 0.17 0.03 7 0.02 0.01 0.06 6 Western Minnow FS 0.13 0.04 0.04 18 44 23‐82 0.58 0.26 0.09 6 0.13 0.06 0.39 5 0.04 0.02 0.02 12 Tarwhine MEO 0.12 0.06 0.03 19 60 32‐116 King George Whiting MEO 0.10 0.04 0.03 19 74 25‐145 Western School Whiting MEO 0.06 0.05 0.02 21 48 27‐75 Yellowfin Whiting MEO 0.04 0.02 0.01 22 121 67‐250 Australian Anchovy E&M 0.03 0.03 0.01 22 58 51‐63 Western Striped Grunter MEO 0.03 0.01 0.01 22 30 15‐151 Southern School Whiting MS 0.02 0.02 0.01 22 31 24‐66 Prickly Toadfish MEO 0.02 0.01 0.01 22 39 22‐68 Soldier MEO 0.02 0.01 0.01 22 26 12‐36 Tailor MEO 0.02 0.01 0.01 22 67 30‐112 Common Hardyhead MEO <0.01 <0.01 <0.01 29 53 48‐57 Smalltooth Flounder MEO <0.01 <0.01 <0.01 29 149 149‐149 Old Wife MS <0.01 <0.01 <0.01 29 24 24‐24 0.02 0.01 0.06 6
Number of species 31 7 8 14 Mean overall density 360.89 670.97 31.91 194.94

Native and Introduced Fishes of the Vasse‐Wonnerup 71
Number of samples 416 64 48 64 Adjusted number of fish 150,128 42,942 1,532 12,476 Actual number of fish 174,149 49,813 1,777 14,472
Table 1 continued: Wonnerup Inlet Deadwater Lower Wonnerup Estuary Upper Wonnerup Estuary
Common name LC SE % R SE % R SE % R SE % RWestern Hardyhead E&F 198.87 63.19 33.09 2 172.70 39.90 22.15 2 23.94 7.24 39.18 1 14.78 5.95 77.42 1
Elongate Hardyhead E 280.71 71.52 46.71 1 389.05 131.24 49.91 1 16.08 5.99 26.32 3 3.30 1.30 17.31 2
Bluespot Goby E&F 13.15 4.77 2.19 5 38.40 12.80 4.93 5 19.88 6.46 32.54 2 0.86 0.14 4.52 3
Spotted Hardyhead E 64.16 53.46 10.68 3 83.07 31.46 10.66 3 0.05 0.03 0.09 6
Eastern Gambusia FEO 0.19 0.09 0.31 5
Southern Longfin Goby E&M 10.09 1.80 1.68 6 50.77 14.09 6.51 4
Sandy Sprat MEO 16.88 16.56 2.81 4 7.95 3.15 1.02 8
Black Bream E 9.68 3.15 1.61 7 11.92 3.78 1.53 6
Sea Mullet MEO 2.88 1.15 0.48 8 9.87 3.82 1.27 7
Goldfish FS
Yelloweye Mullet MEO 0.89 0.51 0.15 11 3.03 1.41 0.39 10
Silver Fish E&M 1.01 0.86 0.17 9 2.77 1.29 0.36 11
Common Silverbiddy MEO 0.19 0.09 0.03 13 3.31 2.75 0.43 9
Trumpeter Whiting MEO 0.05 0.03 0.01 17 2.76 1.67 0.35 12
Bridled Goby E&M 1.02 0.75 0.17 9 1.20 0.53 0.15 13 0.01 0.01 0.02 8
Yellowtail Grunter E 0.86 0.33 0.14 12 0.28 0.13 0.04 17
Western Pygmy Perch FS 0.90 0.84 1.48 4 0.02 0.01 0.09 5
Western Minnow FS <0.01 0.01 <0.01 25 0.04 0.04 0.07 7 0.13 0.05 0.66 4
Tarwhine MEO 0.09 0.05 0.02 15 0.71 0.40 0.09 14
King George Whiting MEO 0.63 0.25 0.08 15
Western School Whiting MEO 0.40 0.33 0.05 16
Yellowfin Whiting MEO 0.19 0.10 0.03 13 0.04 0.03 0.01 23
Australian Anchovy E&M 0.22 0.22 0.03 18
Western Striped Grunter MEO 0.13 0.09 0.02 19
Southern School Whiting MS 0.03 0.02 <0.01 19 0.11 0.11 0.01 20
Prickly Toadfish MEO 0.03 0.02 <0.01 19 0.09 0.04 0.01 21
Soldier MEO 0.04 0.03 0.01 17 0.08 0.04 0.01 22
Tailor MEO 0.09 0.05 0.02 15 0.03 0.03 <0.01 24
Common Hardyhead MEO 0.01 0.01 <0.01 21
Smalltooth Flounder MEO 0.01 0.01 <0.01 21
Old Wife MS
Number of species 22 25 8 5 Mean overall density 600.94 779.55 61.10 19.09

Native and Introduced Fishes of the Vasse‐Wonnerup 72
Number of samples 64 64 64 48 Adjusted number of fish 38,460 49,891 3,910 916 Actual number of fish 44,614 57,874 4,536 1,063

Native and Introduced Fishes of the Vasse‐Wonnerup 73
Numbers of species and density
The mean numbers of species differed significantly among years, seasons and regions and the
season x region and year x season x region interaction (Table 2a). As indicated by the F value,
differences among regions explained the majority of the variance, followed by season. The lack
of a significant year x season interaction indicates that the pattern of seasonal difference was
consistent in both years. In all seasons, the Deadwater contained the greatest number of
species, ranging from ~4.3 in autumn to ~7.9 in summer (Fig. 6a). Wonnerup Inlet also contained
appreciable numbers of species, while the lowest numbers of species were generally recorded in
the upper Vasse and Wonnerup estuaries. The mean number of species exhibited seasonal
trends within a region. For example, values of this variable were markedly higher in summer and
spring than in autumn and winter in the Deadwater and Wonnerup Inlet. In contrast, in the
remaining regions the number of species increased from a minimum in autumn to a maximum in
spring before falling in summer (Fig 6a).
Total density (fish 100 m‐2) also differed among years, seasons and regions and the
season x region and year x season x region interactions (Table 2b). Differences among seasons
and regions were the most important and far larger than that for year and for any of the
interaction terms. Mean densities were generally greatest in the Deadwater and Wonnerup Inlet
and lowest in the upper Vasse and Wonnerup estuaries (Fig. 6b). Within a region densities
changed markedly, with the lowest values generally recorded in autumn and winter. However,
the season in which the maximum abundance was recorded differed among regions, with the
greatest values recorded in the most downstream locations, i.e. the Lower Vasse Estuary,
Wonnerup Inlet and the Deadwater in summer, while this peak occurred in autumn in the
remaining regions (Fig. 6b).

Native and Introduced Fishes of the Vasse‐Wonnerup 74
Table 2. Mean squares (MS), F values (F) and significance levels (P) for three‐way PERMANOVA tests employing the Euclidean distance matrices constructed from (a) number of species and (b) mean density (fish 100 m‐2) in the seven regions of the Vasse‐Wonnerup in each season over the two consecutive years between February 2012 and November 2013. df = degrees of freedom. Significant differences (< 5%) are highlighted in bold.
(a) Number of species (b) Density
Main Effects df MS F P MS F P
Year 1 1.01 5.87 0.2% 20.11 10.33 0.2% Season 3 6.14 35.70 0.1% 83.42 42.84 0.1% Region 6 10.33 60.07 0.1% 78.37 40.25 0.1% Interactions Year × Season 3 0.44 2.55 6.1% 4.25 2.18 10.2% Year × Region 6 0.37 2.15 5.1% 3.74 1.92 7.1% Season × Region 18 0.70 4.06 0.1% 7.61 3.91 0.1% Year × Season × Region 14 0.45 2.64 0.3% 4.13 2.12 1.7% Residuals 156
Fig. 6: Mean (a) number of species, (b) density (fish 100 m‐2) at each of the seven regions in the Vasse‐Wonnerup in each season. Error bars represent ±1 standard error. To aid interpretation of the density plot, the values recorded in each region in each season have been provided above their respective bars. Summer (), autumn (), winter () and spring ().
0
1
2
3
4
5
6
7
8
9
Number of species
2560
538
1653
2177
45 047 5 6154
374
49 010 11 4 46 88 9 2
2371
80231
551 479
142 550
500
1,000
1,500
2,000
2,500
3,000
3,500
4,000
WT VU VL IT DW WL WU
Density (fish 100 m
‐2)
Region
(a)
(b)

Native and Introduced Fishes of the Vasse‐Wonnerup 75
Three‐way crossed PERMANOVA identified significant differences in the species
composition of the nearshore fish communities among years, seasons, and regions and all
interaction terms except the year x region term were significant (all P = 0.1%; Table 3). The
pseudo‐F values for region and season were far greater than for any other main effects and
interaction terms. Subsuming main effects and interactions, the values for the two‐way
crossed ANOSIM analyses for each factor vs the other two factors combined were greater for
season (0.467) and region (0.421) than for year (0.313). On the basis of these results,
subsequent analyses were then employed to more thoroughly investigate the differences in fish
faunal composition among regions (and later seasons). Note that, these more detailed spatial
and temporal analysis were carried out separately for each season and year and each region,
respectively.
Table 3. Mean squares (MS), pseudo‐F values (F) and significance levels (P) for three‐way PERMANOVA tests employing the a Bray‐Curtis similarity matrices constructed from the fish abundances recorded using a 21.5m seine net from the seven regions of the Vasse‐Wonnerup in each season over the two consecutive years between February 2012 and November 2013. Df = degrees of freedom. Significant differences (< 5%) are highlighted in bold.
Main Effects df MS Pseudo‐F P
Year 1 2787 6.17 0.1% Season 3 8902 19.71 0.1% Region 6 11992 26.55 0.1% Interactions Year × Season 3 2478 5.49 0.1% Year × Region 6 568 1.26 13.0% Season × Region 18 1679 3.72 0.1% Year × Season × Region 14 1495 3.31 0.1% Residuals 156
Spatial changes in fish faunal composition
One‐way ANOSIM tests, conducted on the data collected in each season and year separately,
identified significant differences among regions in each season and year combination (all P =
0.1%; Table 4; Fig. 7). The relative extent of the differences in fish composition varied among
seasons and years, being higher in February and November than in May and August. The
greatest overall difference was recorded during February 2013

Native and Introduced Fishes of the Vasse‐Wonnerup 76
Table 4. Global and pairwse R‐statistic values and significance levels (P) for one‐way ANOSIM tests for region, employing separate Bray‐Curtis similarity matrices constructed from the fish abundances in each season. Insignificant pairwise comparisons are highlighted in grey, while black boxes indicate a comparison where data were not available for the upper Vasse and Wonnerup estuaries due to those areas being dry (see Materials and Methods).
(a) February 2012: Global R = 0.449, P = 0.1% (e) February 2013: Global R = 0.634, P = 0.1% WT VU VL DW IT WL WT VU VL DW IT WL
VU 0.458 VU
VL 0.188 0.271 VL 0.458
DW 0.969 1.000 0.281 DW 1.000 1.000
IT 1.000 1.000 0.375 0.094 IT 0.917 0.917 0.292
WL 0.219 0.417 0.031 0.823 1.000 WL 0.458 0.333 1.000 0.875
WU 0.458 0.000 0.271 1.000 1.000 0.417 WU
(b) May 2012: Global R = 0.589, P = 0.1% (f) May 2013: Global R = 0.339, P = 0.1% WT VU VL DW IT WL WT VU VL DW IT WL
VU VU 0.167
VL 0.927 VL 0.000 0.323
DW 0.917 0.927 DW 0.531 0.479 0.479
IT 0.646 0.313 0.320 IT 0.656 0.573 0.625 ‐0.073
WL 0.948 0.250 0.969 0.469 WL ‐0.063 0.479 0.271 0.469 0.635
WU WU 0.000 0.458 0.177 0.469 0.625 ‐0.094
(c) August 2012: Global R = 0.359, P = 0.1% (g) August 2013: Global R = 0.244, P = 0.1% WT VU VL DW IT WL WT VU VL DW IT WL
VU 1.000 VU 0.052
VL 1.000 ‐0.115 VL 0.021 0.063
DW 0.917 0.521 0.573 DW 0.583 0.510 0.531
IT 0.823 0.198 0.118 0.063 IT 0.375 0.260 0.406 0.219
WL 0.792 ‐0.094 ‐0.052 0.542 0.208 WL 0.385 0.115 0.510 0.563 0.281
WU 0.771 0.094 0.073 0.646 0.240 ‐0.177 WU ‐0.094 ‐0.052 ‐0.010 0.583 0.260 0.094
(d) November 2012: Global R = 0.502, P = 0.1% (h) November 2013: Global R = 0.566, P = 0.1% WT VU VL DW IT WL WT VU VL DW IT WL
VU 0.240 VU 0.885
VL 0.323 ‐0.052 VL 0.885 0.396
DW 0.927 0.865 0.719 DW 1.000 1.000 0.958
IT 0.896 0.719 0.563 0.000 IT 0.938 0.646 0.542 0.188
WL 0.594 0.240 ‐0.010 0.990 0.927 WL 0.406 0.604 0.156 1.000 0.646
WU 0.646 0.375 0.333 1.000 1.000 0.833 WU 1.000 0.656 ‐0.198 0.938 0.500 0.146
(Global R = 0.634), with the fish fauna recorded from the Deadwater and Wonnerup Inlet being
particularly distinct from those in the other regions (i.e. pairwise R > 0.917). This is reflected on
the associated centroid nMDS plot, where the points representing those

Native and Introduced Fishes of the Vasse‐Wonnerup 77
(a) February 2012 (e) February 2013
(b) May 2012 (f) May 2013
(c) August 2012 (g) August 2013
(d) November 2012 (h) November 2013
Fig. 7: Centriod nMDS ordinations plots, derived from distance among centroid matrices constructed from Bray‐Curtis matrices of the fish composition in each season between February 2012 and November 2013. Lower Vasse River Wetlands (), Upper Vasse Estuary (), Lower Vasse Estuary (), Wonnerup Inlet (), Deadwater (), Lower Wonnerup Estuary () and Upper Wonnerup Estuary ().
2D Stress: 0 2D Stress: 0
2D Stress: 0 2D Stress: 0
2D Stress: 0 2D Stress: 0
2D Stress: 0 2D Stress: 0

Native and Introduced Fishes of the Vasse‐Wonnerup 78
regions lay on the left side of the plot and far away from those representing the other three
regions, i.e. the lower Vasse and Wonnerup estuaries and the Lower Vasse River Wetlands (Fig.
7e). In the case of the Deadwater and Wonnerup Inlet, the fish fauna was typified by the
consistently large densities of Elongate Hardyhead, Southern Longfin Goby and Black Bream,
with these species being more abundant in these regions and any of the three other regions
(Table 5a). The next biggest differences, in this season, were in pairwise comparisons involving
the Lower Vasse River Wetlands, where the presence of Goldfish distinguished this region from
the others as this species was only recorded in this region. In February 2012 a similar trend was
recorded, with 9 of the 13 significant pairwise comparisons involving either the Deadwater or
Wonnerup Inlet (Table 4a). As in 2013, these regions were distinguished by consistently greater
densities of Elongate Hardyhead, Southern Longfin Goby and Black Bream (Table 5a).
In the remaining seasons and years, the largest differences involved comparisons
between the Deadwater and other regions, while the same was true for Wonnerup Inlet in all
but August 2013 and the Lower Vasse River Wetlands in May and August 2013 (Table 4). This is
shown on the associated centroid nMDS plots, where the points representing those regions lay
well separated from the main cluster of points representing the upper and lower Vasse and
Wonnerup estuaries (Fig. 7). In contrast, these latter points were rarely different in all season
and year combinations (Table 4). The presence of substantial densities of the Southern Longfin
Goby and to a lesser extent, Black Bream and the Spotted Hardyhead distinguished the
Deadwater and the Wonnerup Inlet from the other regions. The fauna in these regions differed
significantly in only May 2012 and August 2013, due to greater densities of the Southern Longfin
Goby and Sea Mullet in the Deadwater in the former sampling occasion and Yellowtail Grunter
and Roach being recorded in Wonnerup Inlet in the latter (Table 5b, h).
In the case of the Lower Vasse River Wetland, this region was typified by consistently
greater densities of the Western Minnow and Bluespot Goby in August 2012 and 2013 (Table 5c,
g) and of Goldfish, the Bluespot Goby and the Western Hardyhead in November 2012 and 2013
(Table 5d, h) than the other regions. The remaining regions, namely the upper and lower Vasse
and Wonnerup estuaries, were generally depauperate, harbouring

Native and Introduced Fishes of the Vasse‐Wonnerup 79
Table 5: Species that consistently typified (provided along the diagonal in light grey) and distinguished (provided in the sub‐diagonal in white) the fish assemblages in each region of the Vasse‐Wonnerup between February 2012 and November 2013 as detected by one‐way SIMPER. The region in which each species was most abundant is given in superscript for each pairwise comparison. Insignificant pairwise comparisons, as detected by ANOSIM (Table 4) are highlighted in dark grey, while black boxes indicate a comparison were data were not available for the upper Vasse and Wonnerup estuaries due to those areas being dry (see Materials and Methods). Lower Vasse River Wetlands (WT), Upper Vasse Estuary (VU), Lower Vasse Estuary (VL), Wonnerup Inlet (IT), Deadwater (DW), Lower Wonnerup Estuary (WL) and Upper Wonnerup Estuary (WU). Full species and scientific names are given in Appendix 6.
(a) February 2012
WT VU VL DW IT WL WU
WT Eastern Gambusia
VU
Eastern Gambusia (WT)
Bluespot Goby (WT)
VL
W. Hardyhead
Elongate Hardyhead
Bluespot Goby
DW
Elongate Hardyhead (DW) Bluespot Goby (DW) Elongate Hardyhead
S. Longfin Goby (DW) Elongate Hardyhead (DW) Bluespot Goby
Black Bream (DW) S. Longfin Goby (DW) S. Longfin Goby
Eastern Gambusia (WT) W. Hardyhead
IT
Elongate Hardyhead (IT) Elongate Hardyhead (IT) Elongate Hardyhead (IT) Elongate Hardyhead
W. Hardyhead (IT) W. Hardyhead (IT) W. Hardyhead (IT) W. Hardyhead
S. Longfin Goby (IT) Black Bream (IT) Black Bream (IT) S. Longfin Goby
Eastern Gambusia (WT) S. Longfin Goby (IT) S. Longfin Goby (IT)
WL
Bluespot Goby (WL) S. Longfin Goby (DW) Elongate Hardyhead (IT) Bluespot Goby
Bridled Goby (WL) Elongate Hardyhead (DW) W. Hardyhead (IT) W. Hardyhead
W. Hardyhead (WL) Black Bream (DW) Black Bream (IT)
W. Hardyhead (DW) Bluespot Goby (WL)
WU
Eastern Gambusia (WT) Bluespot Goby (DW) Elongate Hardyhead (IT) Bluespot Goby (WL)
Bluespot Goby (WT) Elongate Hardyhead (DW) W. Hardyhead (IT) W. Hardyhead (WL)
S. Longfin Goby (DW) Black Bream (IT)
W. Hardyhead (DW) S. Longfin Goby (IT)

Native and Introduced Fishes of the Vasse‐Wonnerup 80
(b) May 2012 WT VU VL DW IT WL WU
WT
W. Hardyhead
Bluespot Goby
VU
VL
Bluespot Goby (WT) Elongate Hardyhead
W. Hardyhead (WT)
Elongate Hardyhead(VL)
DW
S. Longfin Goby (DW) W. Hardyhead (DW) W. Hardyhead
Black Bream (DW) S. Longfin Goby (DW) S. Longfin Goby
Silver Fish (DW) Black Bream (DW) Black Bream
Elongate Hardyhead (DW) Silver Fish (DW) Silver Fish
IT
Bluespot Goby (WT) W. Hardyhead (DW) Black Bream
Black Bream (IT) S. Longfin Goby (DW) Yellowtail Grunter
W. Hardyhead (WT) Yelloweye Mullet (DW) Silver Fish
Yellowtail Grunter (IT) Yellowtail Grunter (IT) Common Silverbiddy
WL
Bluespot Goby (WT) W. Hardyhead (DW) Elongate Hardyhead (WL) Elongate Hardyhead
Elongate Hardyhead (WL) S. Longfin Goby (DW) Black Bream (IT)
W. Hardyhead (WT) Black Bream (DW) Yellowtail Grunter (IT)
Silver Fish (DW)
WU

Native and Introduced Fishes of the Vasse‐Wonnerup 81
(c) August 2012 WT VU VL DW IT WL WU
WT
Western Minnow
Bluespot Goby
VU
Western Minnow (WT) W. Hardyhead
Bluespot Goby (WT)
Eastern Gambusia (WT)
VL
Western Minnow (WT) W. Hardyhead
Bluespot Goby (WT)
Eastern Gambusia (WT)
DW
Western Minnow (WT) S. Longfin Goby (DW) S. Longfin Goby (DW) S. Longfin Goby
S. Longfin Goby (DW) Prickly Toadfish (DW) Prickly Toadfish (DW) Sea Mullet
Bluespot Goby (WT) Sea Mullet (DW) Sea Mullet (DW) Elongate Hardyhead
Prickly Toadfish (DW) Elongate Hardyhead (DW) Elongate Hardyhead (DW) W. Hardyhead
IT
Western Minnow (WT) S. Longfin Goby
Bluespot Goby (WT) W. Hardyhead
S. Longfin Goby (IT)
W. Hardyhead (IT)
WL
Western Minnow (WT) S. Longfin Goby (DW) W. Hardyhead
Bluespot Goby (WT) Prickly Toadfish (DW) Bluespot Goby
Eastern Gambusia (WT) Sea Mullet (DW)
Elongate Hardyhead (DW)
WU
Western Minnow (WU) S. Longfin Goby (DW) Western Minnow
Bluespot Goby (WT) Prickly Toadfish (DW)
Eastern Gambusia (WT) Western Minnow (WU)
Sea Mullet (DW)

Native and Introduced Fishes of the Vasse‐Wonnerup 82
(d) November 2012 WT VU VL DW IT WL WU
WT
Goldfish
Bluespot Goby
W. Hardyhead
VU
W. Hardyhead
Goldfish
Elongate Hardyhead
Bluespot Goby
VL
Bluespot Goby
Elongate Hardyhead
W. Hardyhead
DW
Elongate Hardyhead (DW) Elongate Hardyhead (DW) Elongate Hardyhead (DW) Elongate Hardyhead
Goldfish (WT) Goldfish (VU) S. Longfin Goby (DW) Bluespot Goby
Bluespot Goby (WT) S. Longfin Goby (DW) Yelloweye Mullet (DW) S. Longfin Goby
S. Longfin Goby (DW) Yelloweye Mullet (DW) Black Bream (DW) Black Bream
IT
Goldfish (WT) Elongate Hardyhead (IT) Elongate Hardyhead (IT) Elongate Hardyhead
Elongate Hardyhead (IT) Bluespot Goby (IT) S. Longfin Goby (IT) Bluespot Goby
Bluespot Goby (WT) Goldfish (VU) Yelloweye Mullet (IT) Yelloweye Mullet
S. Longfin Goby (IT) Yelloweye Mullet (IT) Black Bream (IT)
WL
Goldfish (WT) Elongate Hardyhead (DW) Elongate Hardyhead (IT) Bluespot Goby
Bluespot Goby (WT) Bridled Goby (DW) Bridled Goby (IT) Elongate Hardyhead
W. Hardyhead (WT) S. Longfin Goby (DW) S. Longfin Goby (IT) W. Hardyhead
Elongate Hardyhead (WL) Yelloweye Mullet (DW) Yelloweye Mullet (IT)
WU
Goldfish (WT) Goldfish (VU) Bluespot Goby (VL) Elongate Hardyhead (DW) Elongate Hardyhead (IT) Bluespot Goby (WL) Bluespot Goby
W. Hardyhead (WT) Elongate Hardyhead (VU) Elongate Hardyhead (VL) Bluespot Goby (DW) Bluespot Goby (IT) W. Hardyhead (WL) Elongate Hardyhead
Bluespot Goby (WT) W. Hardyhead (VU) W. Hardyhead (VL) S. Longfin Goby (DW) Yelloweye Mullet (IT) Elongate Hardyhead (WL)
W. Pygmy Perch (WT) Goldfish (VL) Yelloweye Mullet (DW)

Native and Introduced Fishes of the Vasse‐Wonnerup 83
(e) February 2013 WT VU VL DW IT WL WU
WT
Eastern Gambusia
Bluespot Goby
VU
VL
Bluespot Goby (WT)
Eastern Gambusia (WT)
Goldfish (WT)
DW
Elongate Hardyhead (DW) Elongate Hardyhead (DW) Elongate Hardyhead
S. Longfin Goby (DW) S. Longfin Goby (DW) S. Longfin Goby
Black Bream (DW) Spotted Hardyhead (DW) Spotted Hardyhead
Goldfish (WT) Black Bream (DW) Black Bream
IT
Elongate Hardyhead (IT) Elongate Hardyhead (IT) Elongate Hardyhead
Yellowtail Grunter (IT) Yellowtail Grunter (IT) Yellowtail Grunter
Black Bream (IT) Black Bream (IT) Sea Mullet
Goldfish (WT) Sea Mullet (IT) Black Bream
WL
Eastern Gambusia (WT) W. Hardyhead (WL) Elongate Hardyhead (DW) Elongate Hardyhead (IT) Bluespot Goby
Bluespot Goby (WT) Bluespot Goby (WL) S. Longfin Goby (DW) Yellowtail Grunter (IT) W. Hardyhead
Goldfish (WT) Spotted Hardyhead (DW) Black Bream (IT)
W. Hardyhead (WT) Black Bream (DW) Sea Mullet (IT)
WU

Native and Introduced Fishes of the Vasse‐Wonnerup 84
(f) May 2013
WT VU VL DW IT WL WU
WT
VU
W. Hardyhead
VL
Spotted Hardyhead
DW
Elongate Hardyhead (DW) Elongate Hardyhead (DW) Elongate Hardyhead (DW) Elongate Hardyhead
Spotted Hardyhead (DW) Spotted Hardyhead (DW) Spotted Hardyhead (DW) Spotted Hardyhead
IT
Elongate Hardyhead (IT) Elongate Hardyhead (IT) Elongate Hardyhead (IT) Elongate Hardyhead
Spotted Hardyhead (IT) Spotted Hardyhead (IT) Spotted Hardyhead (IT) Spotted Hardyhead
W. Hardyhead (IT) W. Hardyhead (IT) W. Hardyhead (IT)
WL
Bluespot Goby (WL) Elongate Hardyhead (DW) Elongate Hardyhead (IT) Bluespot Goby
W. Hardyhead (VU) Spotted Hardyhead (DW) Spotted Hardyhead (IT)
Bluespot Goby (WL) W. Hardyhead (IT)
Bluespot Goby (WL)
WU
Bluespot Goby (WU) Elongate Hardyhead (DW) Elongate Hardyhead (IT) Bluespot Goby
W. Hardyhead (WU) Spotted Hardyhead (DW) Spotted Hardyhead (IT)
W. Hardyhead (IT)
Bluespot Goby (WU)

Native and Introduced Fishes of the Vasse‐Wonnerup 85
(g) August 2013 WT VU VL DW IT WL WU
WT
Bluespot Goby
Western Minnow
VU
Western Minnow
W. Hardyhead
Elongate Hardyhead
VL
Western Minnow
W. Hardyhead
DW
S. Longfin Goby (DW) S. Longfin Goby (DW) S. Longfin Goby (DW) S. Longfin Goby
Sea Mullet (DW) Sea Mullet (DW) Sea Mullet (DW) Sea Mullet
Bluespot Goby (WT) Western Minnow (VU) W. Hardyhead (DW) W. Hardyhead
W. Hardyhead (DW) W. Hardyhead (DW) Western Minnow (VL)
IT
Western Minnow (WT) Western Minnow (VL) Sea Mullet (DW) S. Longfin Goby
Bluespot Goby (WT) S. Longfin Goby (IT) S. Longfin Goby (DW) W. Hardyhead
S. Longfin Goby (IT) W. Hardyhead (IT)
W. Hardyhead (IT)
WL
Western Minnow (WT) S. Longfin Goby (DW) S. Longfin Goby (IT)
Bluespot Goby (WT) Sea Mullet (DW) W. Hardyhead (IT)
W. Hardyhead (DW)
WU
S. Longfin Goby (DW) S. Longfin Goby (IT) Bluespot Goby
Sea Mullet (DW) Western Minnow (WU)
W. Hardyhead (DW) W. Hardyhead (IT)
Bluespot Goby (WU)

Native and Introduced Fishes of the Vasse‐Wonnerup 86
(h) November 2013
WT VU VL DW IT WL WU
WT
Bluespot Goby
W. Hardyhead
Goldfish
VU
Bluespot Goby (WT) Goldfish
Western Minnow (WT) W. Hardyhead
W. Hardyhead (WT)
VL
Bluespot Goby (WT) Goldfish (VU) W. Hardyhead
W. Hardyhead (WT) Bluespot Goby
Goldfish (WT)
DW
Bluespot Goby (WT) Tarwhine (DW) Tarwhine (DW) S. Longfin Goby
Tarwhine (DW) S. Longfin Goby (DW) S. Longfin Goby (DW) Sandy Sprat
S. Longfin Goby (DW) Sandy Sprat (DW) Sandy Sprat (DW) W. Hardyhead
Sandy Sprat (DW) King George Whiting (DW)
King George Whiting (DW) King George Whiting
IT
Bluespot Goby (WT) S. Longfin Goby (IT) S. Longfin Goby (IT) S. Longfin Goby
S. Longfin Goby (IT) W. Hardyhead (IT) W. Hardyhead (IT) W. Hardyhead
Goldfish (WT) Goldfish (VU) Sandy Sprat (IT)
Sandy Sprat (IT)
WL
Bluespot Goby (WT) Bluespot Goby (WL) S. Longfin Goby (IT) S. Longfin Goby (IT) W. Hardyhead
Western Minnow (WT) Goldfish (VU) Bluespot Goby (WL)
Bluespot Goby (WL) Bluespot Goby
W. Hardyhead (WT) W. Pygmy Perch (WL) W. Hardyhead (IT) W. Hardyhead (IT) Elongate
Hardyhead
Goldfish (WT)
WU
Bluespot Goby (WT) Goldfish (VU) Tarwhine (DW) S. Longfin Goby (IT) W. Hardyhead
W. Hardyhead (WT) Elongate Hardyhead S. Longfin Goby (DW) W. Hardyhead (IT) Elongate

Native and Introduced Fishes of the Vasse‐Wonnerup 87
(WU) Hardyhead
Western Minnow (WT) Bluespot Goby (WU) 0Sandy Sprat (DW) Sandy Sprat (IT) Bluespot Goby
Goldfish (WT) King George Whiting (DW)

Native and Introduced Fishes of the Vasse‐Wonnerup 88
consistently low densities of the Elongate and Western hardyheads and Bluespot goby in all
seasons and years, and also the Western Minnow in August 2012 and 2013. Note that the
grouping of these regions was slightly less tight during November (Fig. 7d, h), due to the
substantial presence of Goldfish in the Upper Vasse Estuary, which helped distinguish the fauna
in this region from those at the others (Table 5d, h).
CLUSTER‐SIMPROF demonstrated that, on the basis of their fish faunal compositions, the
seven regions formed four statistically discrete groups, (I) Lower Vasse River Wetland, (II) Lower
Vasse and Wonnerup estuaries, (III) Upper Vasse and Wonnerup estuaries and (IV) the
Deadwater and Wonnerup Inlet (Fig. 8). Thus, there is no significant difference in fish faunal
compositions between any regions within a group, but the regions within a group are
statistically distinct from all regions in other groups.
Fig. 8: Dendrogram derived by subjecting, to the CLUSTER and SIMPROF utilizing Bray‐Curtis similarities, the average density of each fish species across replicate samples collected from each region on each sampling occasion. The groups in which the species compositions are significantly different from those in all other groups are denoted by thick black lines, whereas connection via a red line indicated those samples no not differ significantly. Lower Vasse River Wetlands (WT), Upper Vasse Estuary (VU), Lower
WT VL
WL
VU
WU
DW IT
Regions
100
80
60
40
20
0
Sim
ilarit
y
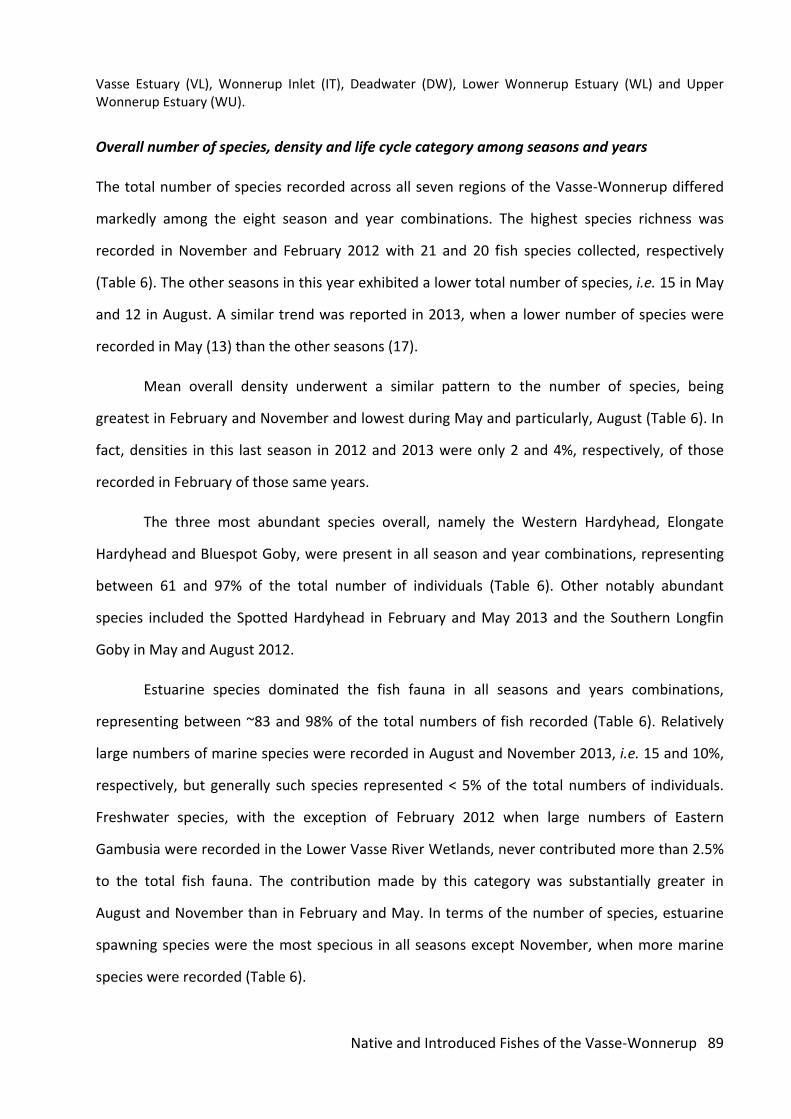
Native and Introduced Fishes of the Vasse‐Wonnerup 89
Vasse Estuary (VL), Wonnerup Inlet (IT), Deadwater (DW), Lower Wonnerup Estuary (WL) and Upper Wonnerup Estuary (WU).
Overall number of species, density and life cycle category among seasons and years
The total number of species recorded across all seven regions of the Vasse‐Wonnerup differed
markedly among the eight season and year combinations. The highest species richness was
recorded in November and February 2012 with 21 and 20 fish species collected, respectively
(Table 6). The other seasons in this year exhibited a lower total number of species, i.e. 15 in May
and 12 in August. A similar trend was reported in 2013, when a lower number of species were
recorded in May (13) than the other seasons (17).
Mean overall density underwent a similar pattern to the number of species, being
greatest in February and November and lowest during May and particularly, August (Table 6). In
fact, densities in this last season in 2012 and 2013 were only 2 and 4%, respectively, of those
recorded in February of those same years.
The three most abundant species overall, namely the Western Hardyhead, Elongate
Hardyhead and Bluespot Goby, were present in all season and year combinations, representing
between 61 and 97% of the total number of individuals (Table 6). Other notably abundant
species included the Spotted Hardyhead in February and May 2013 and the Southern Longfin
Goby in May and August 2012.
Estuarine species dominated the fish fauna in all seasons and years combinations,
representing between ~83 and 98% of the total numbers of fish recorded (Table 6). Relatively
large numbers of marine species were recorded in August and November 2013, i.e. 15 and 10%,
respectively, but generally such species represented < 5% of the total numbers of individuals.
Freshwater species, with the exception of February 2012 when large numbers of Eastern
Gambusia were recorded in the Lower Vasse River Wetlands, never contributed more than 2.5%
to the total fish fauna. The contribution made by this category was substantially greater in
August and November than in February and May. In terms of the number of species, estuarine
spawning species were the most specious in all seasons except November, when more marine
species were recorded (Table 6).

Native and Introduced Fishes of the Vasse‐Wonnerup 90
Table 6: Life cycle guilds (LC), mean density (fish 100 m2; , standard error (SE), percentage contribution to the overall catch (%), rank by density (R), mean total length (Lm) and length range (mm; LR) of each fish species recorded across the entire Vasse‐Wonnerup in each season between February 2012 and November 2013. Abundant species (i.e. those that contribute ≥ 5% to the catch) are highlighted in grey. The total number of species, mean overall density, number of samples and actual and adjusted number of individuals (i.e. after the number of individuals in each sample had been adjusted to that in 100 m‐2) are given for each season. Species ranked by total abundance.
Entire Estuary February 2012 May 2012 August 2012 November 2012
Common name LC SE % R SE % R SE % R SE % R SE % R Western Hardyhead E&F 164.23 57.71 45.51 1 325.99 92.65 43.98 1 102.82 36.20 64.16 1 19.38 6.98 66.90 1 537.87 405.85 66.36 1
Elongate Hardyhead E 115.46 24.43 31.99 2 248.68 81.29 33.55 2 25.97 9.30 16.20 2 1.62 0.63 5.58 3 182.67 43.85 22.54 2
Bluespot Goby E&F 25.74 4.82 7.13 3 54.19 19.82 7.31 4 4.29 1.94 2.68 6 1.31 0.58 4.52 4 66.72 20.03 8.23 3
Spotted Hardyhead E 22.68 9.63 6.29 4 0.85 0.83 0.11 9 3.53 2.13 0.43 5
Eastern Gambusia FEO 9.55 8.48 2.65 5 67.06 62.92 9.05 3 0.17 0.11 0.11 11 0.40 0.20 1.38 7 1.42 1.03 0.17 10
Southern Longfin Goby E&M 9.52 2.35 2.64 6 26.28 14.46 3.55 5 11.72 4.52 7.32 3 4.20 1.55 14.51 2 2.36 0.85 0.29 7
Sandy Sprat MEO 3.82 2.60 1.06 7 0.68 0.54 2.34 5 0.06 0.06 0.01 15
Black Bream E 3.33 0.79 0.92 8 10.68 4.48 1.44 6 4.72 1.96 2.95 5 0.09 0.06 0.32 10 2.14 1.13 0.26 8
Sea Mullet MEO 1.96 0.63 0.54 9 0.31 0.19 0.04 13 8.17 5.59 5.10 4 0.57 0.31 1.97 6 2.51 1.36 0.31 6
Goldfish FS 1.09 0.37 0.30 10 0.02 0.02 0.00 19 0.02 0.02 0.01 13 7.05 2.56 0.87 4
Yelloweye Mullet MEO 0.60 0.24 0.17 11 0.60 0.36 0.08 11 0.80 0.46 0.50 7 0.06 0.05 0.21 10 0.31 0.12 0.04 12
Silver Fish E&M 0.59 0.24 0.16 12 1.46 1.09 0.20 8 0.75 0.37 0.47 8 0.29 0.19 1.01 8 0.12 0.09 0.02 14
Common Silverbiddy MEO 0.54 0.43 0.15 13 3.20 3.14 0.43 7 0.45 0.21 0.28 9
Trumpeter Whiting MEO 0.43 0.26 0.12 14 1.39 0.72 0.17 10
Bridled Goby E&M 0.36 0.14 0.10 15 0.71 0.37 0.10 10 1.96 0.98 0.24 9
Yellowtail Grunter E 0.18 0.06 0.05 16 0.42 0.22 0.06 12 0.19 0.14 0.12 10
Western Pygmy Perch FS 0.18 0.13 0.05 16 0.26 0.19 0.03 12
Western Minnow FS 0.13 0.04 0.04 18 0.31 0.12 1.06 8
Tarwhine MEO 0.12 0.06 0.03 19 0.08 0.06 0.01 15
King George Whiting MEO 0.10 1.00 0.03 19 0.03 0.02 0.00 19
Western School Whiting MEO 0.06 0.05 0.02 21 0.13 0.13 0.08 11
Yellowfin Whiting MEO 0.04 0.02 0.01 22 0.22 0.12 0.03 14 0.02 0.02 0.01 13
Australian Anchovy E&M 0.03 0.03 0.01 22 0.25 0.25 0.03 14 Western Striped Grunter MEO 0.03 0.01 0.01 22 0.06 0.06 0.01 17 0.05 0.03 0.01 15
Southern School Whiting MS 0.02 0.02 0.01 22 0.15 0.12 0.02 16
Prickly Toadfish MEO 0.02 0.01 0.01 22 0.03 0.02 0.00 19
Soldier MEO 0.02 0.01 0.01 22 0.06 0.04 0.21 10 0.05 0.03 0.01 15
Tailor MEO 0.02 0.01 0.01 22 0.08 0.06 0.01 17 0.02 0.02 0.00 19
Common Hardyhead MEO <0.01 <0.01 <0.01 29
Smalltooth Flounder MEO <0.01 <0.01 <0.01 29 0.02 0.02 0.00 19
Old Wife MS <0.01 <0.01 <0.01 29 0.02 0.02 0.01 13
Species richness 31 20 15 12 21

Native and Introduced Fishes of the Vasse‐Wonnerup 91
Mean overall density 360.89 741.21 160.26 28.97 810.58
Number of samples 416 56 40 56 56
Adjusted number of fish 150,128 41,508 6,410 1,622 45,392
Actual number of fish 174,149 48,149 7,436 1,882 52,655
Table 6 continued February 2013 May 2013 August 2013 November 2013
Common name LC SE % R SE % R SE % R SE % R Western Hardyhead E&F 35.80 17.75 4.31 3 10.31 6.02 15.35 3 9.74 3.24 50.20 1 217.69 88.91 71.09 1
Elongate Hardyhead E 504.09 205.23 60.74 1 39.67 16.28 59.04 1 0.75 0.53 3.89 5 5.70 1.84 1.86 5
Bluespot Goby E&F 26.62 10.40 3.21 4 1.29 0.60 1.92 4 1.37 0.49 7.06 4 44.29 18.93 14.46 2
Spotted Hardyhead E 209.59 95.95 25.25 2 14.38 4.81 21.40 2 0.05 0.03 0.24 13
Eastern Gambusia FEO 2.52 1.24 0.30 9 0.11 0.11 0.16 7 0.06 0.04 0.32 12
Southern Longfin Goby E&M 26.03 11.38 3.14 5 0.69 0.42 1.03 5 3.93 2.00 20.22 2 6.30 1.92 2.06 4
Sandy Sprat MEO 27.63 19.11 9.02 3
Black Bream E 11.51 4.25 1.39 6 0.05 0.03 0.07 7 0.20 0.11 1.03 8
Sea Mullet MEO 2.59 1.18 0.31 8 2.31 1.62 11.90 3 1.22 0.85 0.40 6
Goldfish FS 0.84 0.69 0.10 13 0.42 0.16 0.14 10
Yelloweye Mullet MEO 2.28 2.16 0.28 11 0.62 0.34 0.92 6 0.05 0.03 0.24 13 0.65 0.57 0.21 8
Silver Fish E&M 2.76 1.93 0.33 7 0.02 0.02 0.02 9
Common Silverbiddy MEO 0.71 0.42 0.09 14
Trumpeter Whiting MEO 2.54 2.50 0.31 9 0.02 0.02 0.02 9
Bridled Goby E&M 0.02 0.02 0.01 14
Yellowtail Grunter E 1.01 0.46 0.12 12 0.08 0.05 0.40 10 0.02 0.02 0.01 14
Western Pygmy Perch FS 0.02 0.02 0.08 16 1.05 0.95 0.34 7
Western Minnow FS 0.02 0.02 0.02 9 0.26 0.08 1.35 7 0.40 0.28 0.13 11
Tarwhine MEO 0.26 0.18 0.03 16 0.02 0.02 0.08 16 0.65 0.44 0.21 8
King George Whiting MEO 0.71 0.39 0.09 14 0.08 0.08 0.40 10 0.11 0.06 0.04 12
Western School Whiting MEO 0.37 0.37 1.90 6
Yellowfin Whiting MEO 0.03 0.02 0.01 14
Australian Anchovy E&M Western Striped Grunter MEO 0.09 0.08 0.48 9
Southern School Whiting MS
Prickly Toadfish MEO 0.05 0.03 0.24 13 0.06 0.04 0.02 13
Soldier MEO 0.02 0.02 0.02 9 0.02 0.02 0.01 14
Tailor MEO 0.06 0.05 0.01 17
Common Hardyhead MEO 0.02 0.02 0.02 9
Smalltooth Flounder MEO
Old Wife MS
Species richness 17 13 17 17

Native and Introduced Fishes of the Vasse‐Wonnerup 92
Mean overall density 829.94 67.20 19.41 306.22 Number of samples 40 56 56 56 Adjusted number of fish 33,197 3,763 1,087 17,148 Actual number of fish 38,509 4,365 1,261 19,892

Native and Introduced Fishes of the Vasse‐Wonnerup 93
Temporal changes in fish faunal composition
Temporal changes in fish faunal composition were detected in all seven regions in the Vasse‐
Wonnerup, however, the extents of those differences ranged substantially from 0.681 in the
Deadwater down to 0.204 in the Lower Vasse Estuary (Table 7). Although the Deadwater and
Wonnerup Inlet experienced the greatest temporal changes in fish fauna composition, these
changes were due mainly to shift in the abundance of hardyhead and goby species. These
species were most numerous in February and to a lesser extent November. Some species were
abundant in more seasons (and years) than others, with Black Bream being more numerous
during February and May 2012 and February 2013 and with greater densities of Tarwhine and
Sandy Sprat being recorded in November 2013 (Table 8d and e).
The composition of the fish fauna in the Lower Vasse River Wetlands changed
dramatically in November of both years, with the point representing these sampling occasions
widely separated from the others on the nMDS plot (Fig. 9a). This distinction was due to far
larger densities of the Western Hardyhead and the Goldfish being recorded (Table 8a). A similar
pattern was detected in the Upper Vasse Estuary, which is directly downstream, with November
being the most ‘unique’ season (Table 7b; Fig 9b). In these regions, however, it was the greater
densities of Goldfish and the Elongate Hardyhead that were responsible for the marked shift in
fish faunal composition (Table 8b).
The two regions in the Wonnerup Estuary exhibited three groups of seasons and years
(Figs 8f and g). In the Lower Wonnerup Estuary, there were (i) November 2012 and 2013, which
contained the highest densities of the Bluespot Goby, Western Hardyhead and Eastern
Hardyhead, (ii) February 2012, characterised by moderate densities of the first two species and
(iii) the remaining seasons and years that were fairly depauperate (Table 8f). The Upper
Wonnerup Estuary in February 2012 and May 2013 (i.e. the summer and autumn seasons in
which water was present in this region) yielded very low densities of fish, while the Western
Minnow characterised the fish fauna in this region in the August of both years and the Bluespot
Goby and Elongate Hardyhead did the same in both Novembers (Table 8g).

Native and Introduced Fishes of the Vasse‐Wonnerup 94
The smallest temporal differences were detected in the Lower Vasse Estuary, where only
pairwise comparisons involving three season and year combinations were significant (Table 7c).
This was due to samples collected in November 2012 containing large densities of the Western
Hardyhead, Elongate Hardyhead and Bluespot Goby and those in August 2012 and 2013
containing relatively high numbers of the Western Hardyhead and Western Minnow,
respectively (Table 8c).
Table 7: Global and pairwse R‐statistic values and significance levels (P) for one‐way ANOSIM tests for region, employing separate Bray‐Curtis similarity matrices constructed from the fish abundances in each region. Insignificant pairwise comparisons are highlighted in grey, while black boxes indicate a comparison were data were not available for the upper Vasse and Wonnerup estuaries due to those areas being dry (see materials and methods).
(a) Lower Vasse River Wetland: Global R = 0.512, P = 0.1%
Feb‐12 May‐12 Aug‐12 Nov‐12 Feb‐13 May‐13 Aug‐13
May‐12 0.500
Aug‐12 0.635 0.948
Nov‐12 0.708 0.500 0.760
Feb‐13 0.000 0.344 0.604 0.438
May‐13 0.281 0.885 0.958 0.792 0.177
Aug‐13 0.323 0.677 0.573 0.740 0.104 ‐0.010
Nov‐13 0.833 0.646 0.979 0.438 0.823 1.000 0.969
(b) Upper Vasse: Global R = 0.332, P = 0.1%
Feb‐12 May‐12 Aug‐12 Nov‐12 Feb‐13 May‐13 Aug‐13
May‐12
Aug‐12 0.229
Nov‐12 0.542 0.490
Feb‐13
May‐13 0.354 ‐0.073 0.479
Aug‐13 0.417 0.167 0.240 0.219
Nov‐13 0.792 0.677 0.198 0.625 0.510
(c) Lower Vasse: Global R = 0.204, P = 0.1%
Feb‐12 May‐12 Aug‐12 Nov‐12 Feb‐13 May‐13 Aug‐13
May‐12 0.042
Aug‐12 0.104 0.000
Nov‐12 ‐0.104 0.385 0.427
Feb‐13 0.271 0.042 0.417 0.375
May‐13 0.135 0.000 0.219 0.375 0.083
Aug‐13 0.177 0.354 0.302 0.458 0.500 0.542
Nov‐13 0.000 0.125 0.115 0.156 0.271 0.240 0.385
Native and Introduced Fishes of the Vasse‐Wonnerup 95
Table 7 continued.
(d) Wonnerup Inlet: Global R = 0.596, P = 0.1%
Feb‐12 May‐12 Aug‐12 Nov‐12 Feb‐13 May‐13 Aug‐13
May‐12 0.802
Aug‐12 0.917 0.260
Nov‐12 0.740 0.896 1.000
Feb‐13 0.396 0.375 0.813 0.365
May‐13 0.771 0.469 0.583 0.688 0.427
Aug‐13 0.979 0.188 ‐0.104 1.000 0.729 0.635
Nov‐13 0.615 0.615 0.198 0.875 0.854 0.698 0.490
(e) Deadwater: Global R = 0.681, P = 0.1%
Feb‐12 May‐12 Aug‐12 Nov‐12 Feb‐13 May‐13 Aug‐13
May‐12 0.448
Aug‐12 0.760 0.417
Nov‐12 0.167 0.875 0.969
Feb‐13 0.229 1.000 1.000 0.885
May‐13 0.677 0.698 0.479 0.833 0.958
Aug‐13 0.844 0.490 0.042 0.854 0.969 0.490
Nov‐13 0.698 0.865 0.625 1.000 1.000 0.854 0.479
(f) Lower Wonnerup: Global R = 0.400, P = 0.1%
Feb‐12 May‐12 Aug‐12 Nov‐12 Feb‐13 May‐13 Aug‐13
May‐12 0.552
Aug‐12 0.344 0.333
Nov‐12 0.208 0.906 0.854
Feb‐13 0.406 0.448 ‐0.210 0.979
May‐13 0.385 0.542 0.167 0.917 0.135
Aug‐13 0.375 0.510 ‐0.031 0.917 0.031 0.010
Nov‐13 ‐0.031 0.625 0.542 0.167 0.667 0.646 0.635
(g) Upper Wonnerup: Global R = 0.403, P = 0.1%
Feb‐12 May‐12 Aug‐12 Nov‐12 Feb‐13 May‐13 Aug‐13
May‐12
Aug‐12 0.630
Nov‐12 1.000 0.796
Feb‐13
May‐13 0.313 0.500 0.875
Aug‐13 0.500 ‐0.037 0.510 0.063
Nov‐13 0.583 0.556 0.385 0.542 0.417

Native and Introduced Fishes of the Vasse‐Wonnerup 96
(a) Lower Vasse River Wetland
(b) Upper Vasse (c) Lower Vasse
(d) Wonnerup Inlet (e) Deadwater
(f) Lower Wonnerup (g) Upper Wonnerup
Fig. 9: Centriod nMDS ordinations plots, derived from distance among centroid matrices constructed from Bray‐Curtis matrices of the fish composition in each region of the Vasse‐Wonnerup. February 2012(), May 2012 (), August 2012 (), November 2012(), February 2013 (), May 2013 (), August 2013 () and November (). The lines represent a trajectory through time.
2D Stress: 0.01
2D Stress: 0 2D Stress: 0.01
2D Stress: 0.06 2D Stress: 0.02
2D Stress: 0.01 2D Stress: 0

Native and Introduced Fishes of the Vasse‐Wonnerup 97
Table 8: Species that consistently typified (provided along the diagonal in light grey) and distinguished (provided in the sub‐diagonal in white) the fish assemblages in each region of the Vasse‐Wonnerup between February 2013 and November 2013 as detected by one‐way SIMPER. The region in which each species was most abundant is given in superscript for each pairwise comparison. Insignificant pairwise comparisons, as detected by ANOSIM (Table 4) are highlighted in dark grey, while black boxes indicate a comparison were data were not available for the upper Vasse and Wonnerup estuaries due to those areas being dry (see materials and methods). Full species and scientific names are given in Appendix 6.
(a) Lower Vasse River Wetlands
Feb 2012 May 2012 Aug 2012 Nov 2012 Feb 2013 May 2013 Aug 2013 Nov 2013
Feb 2012
Eastern Gambusia
May 2012
E. Gambusia (F12) W. Hardyhead
Bluespot Goby (M12) Bluespot Goby
W. Hardyhead (M12)
Aug 2012
W. Minnow (A12) W. Minnow (A12) Western Minnow
E. Gambusia (F12) W. Hardyhead (M12) Bluespot Goby
Bluespot Goby (A12)
Nov 2012
Goldfish (N12) Goldfish (N12) Goldfish (N12) Goldfish
W. Hardyhead (N12) Bluespot Goby (N12) W. Hardyhead (N12) Bluespot Goby
Bluespot Goby (N12) W. Hardyhead (N12) Bluespot Goby (N12) W. Hardyhead
E. Gambusia (F12) W. Minnow (A12)
Feb 2013
W. Hardyhead (M12) W. Minnow (A12) Goldfish (N12) Eastern Gambusia
Goldfish (F12) Goldfish (F12) W. Hardyhead (N12) Bluespot Goby
E. Gambusia (F12) E. Gambusia (F12) Bluespot Goby (N12)
E. Gambusia (F12)
May 2013
E. Gambusia (F12) Bluespot Goby (M12) W. Minnow (A12) Goldfish (N12)
W. Hardyhead (M12) Bluespot Goby (A12) W. Hardyhead (N12)
Bluespot Goby (N12)
W. Pygmy Perch (N12)
Aug 2013
E. Gambusia (F12) W. Hardyhead (M12) W. Minnow (A12) Goldfish (N12) Bluespot Goby
W. Minnow (A13) Bluespot Goby (M12) Bluespot Goby (A12) W. Hardyhead (N12) Western Minnow
W. Minnow (A13) Bluespot Goby (N12)
W. Minnow (A13)
Nov 2013
Bluespot Goby (N13) Bluespot Goby (N13) Bluespot Goby (N13) Bluespot Goby (N13) Bluespot Goby (N13) Bluespot Goby (N13) Bluespot Goby
E. Gambusia (F12) W. Minnow (N13) W. Hardyhead (N13) W. Hardyhead (N13) W. Hardyhead (N13) W. Hardyhead (N13) W. Hardyhead
W. Hardyhead (N13) W. Hardyhead (N13) Goldfish (N13) W. Minnow (N13) W. Minnow (N13) W. Minnow (N13) Goldfish
W. Minnow (N13) Goldfish (N13)

Native and Introduced Fishes of the Vasse‐Wonnerup 98
(b) Upper Vasse Estuary Feb 2012 May 2012 Aug 2012 Nov 2012 Feb 2013 May 2013 Aug 2013 Nov 2013
Feb 2012
May 2012
Aug 2012
Western Hardyhead
Nov 2012
Goldfish (N12) Goldfish (N12) Western Hardyhead
W. Hardyhead (N12) E. Hardyhead (N12) Goldfish
Bluespot Goby (N12) Bluespot Goby (N12) Elongate Hardyhead
E. Hardyhead (N12) W. Hardyhead (N12) Bluespot Goby
Feb 2013
May 2013
Goldfish (N12) Western Hardyhead
E. Hardyhead (N12)
Bluespot Goby (N12)
Aug 2013
Western Minnow (A13) Western Minnow
W. Hardyhead (A13) Western Hardyhead
E. Hardyhead (A13) Elongate Hardyhead
Nov 2013
Goldfish (N13) Goldfish (N13) Goldfish (N12) Goldfish (N13) Goldfish (N13) Goldfish
W. Hardyhead (N13) W. Hardyhead (N13) E. Hardyhead (N12) W. Hardyhead (N13) W. Minnow (A13) Western Hardyhead
Bluespot Goby (N12) W. Hardyhead (N13)

Native and Introduced Fishes of the Vasse‐Wonnerup 99
(c) Lower Vasse Estuary Feb 2012 May 2012 Aug 2012 Nov 2012 Feb 2013 May 2013 Aug 2013 Nov 2013
Feb 2012
May 2012
Elongate Hardyhead
Aug 2012
Western Hardyhead
Nov 2012
Bluespot Goby (N12) Bluespot Goby (N12) Bluespot Goby
E. Hardyhead (N12) E. Hardyhead (N12) Elongate Hardyhead
W. Hardyhead (N12) W. Hardyhead (N12) Western Hardyhead
Feb 2013
W. Hardyhead (A12) Bluespot Goby (N12)
E. Hardyhead (N12)
W. Hardyhead (N12)
May 2013
W. Hardyhead (A12) Bluespot Goby (N12) Spotted Hardyhead
E. Hardyhead (N12)
W. Hardyhead (12)
Aug 2013
Bluespot Goby (N12) W. Minnow (A13) W. Minnow (A13) Western Minnow
E. Hardyhead (N12) Elongate Hardyhead
W. Minnow (A13)
Nov 2013
W. Hardyhead
Bluespot Goby

Native and Introduced Fishes of the Vasse‐Wonnerup 100
(d) Wonnerup Inlet Feb 2012 May 2012 Aug 2012 Nov 2012 Feb 2013 May 2013 Aug 2013 Nov 2013
Feb 2012
Elongate Hardyhead
W. Hardyhead
S. Longfin Goby
Black Bream
May 2012
E. Hardyhead (F12) Black Bream
W. Hardyhead (F12) Yellowtail Grunter
Black Bream (F12)
Aug 2012
E. Hardyhead (F12) S. Longfin Goby
W. Hardyhead (F12) W. Hardyhead
Black Bream (F12)
Nov 2012
E. Hardyhead (F12) E. Hardyhead (N12) E. Hardyhead (N12) Elongate Hardyhead
W. Hardyhead (F12) Bluespot Goby (N12) Bluespot Goby (N12) S. Longfin Goby
Bluespot Goby (N12) Bridled Goby (N12) Yelloweye Mullet (N12) Yelloweye Mullet
Black Bream (F12) Black Bream (M12)
Feb 2013
E. Hardyhead (F12) E. Hardyhead (F13) E. Hardyhead (F13) Elongate Hardyhead
W. Hardyhead (F12) Yellowtail Grunter (F13) Yellowtail Grunter (F13) Yellowtail Grunter
Black Bream (F12) Black Bream (F13) Black Bream (F13) Sea Mullet
Yellowtail Grunter (F13)
May 2013
E. Hardyhead (F12) E. Hardyhead (M13) E. Hardyhead (M13) Bluespot Goby (N12) Yellowtail Grunter (F13) Elongate Hardyhead
W. Hardyhead (F12) Black Bream (M12) Spotted Hardyhead (M13) E. Hardyhead (N12) E. Hardyhead (F13) Spotted Hardyhead
Black Bream (F12) Spotted Hardyhead (M13) S. Longfin Goby (A12) S. Longfin Goby (N12) S. Hardyhead (F13) Black Bream
S. Longfin Goby (F12) Yelloweye Mullet (N12) Sea Mullet (F13)
Aug 2013
E. Hardyhead (F12) E. Hardyhead (N12) E. Hardyhead (F13) E. Hardyhead (M13) S. Longfin Goby
W. Hardyhead (F12) Bluespot Goby (N12) Black Bream (F13) S. Hardyhead (M13) Sea Mullet
Black Bream (F12) Yelloweye Mullet (N12) Sea Mullet (F13) S. Longfin Goby (A13) W. Hardyhead
S. Longfin Goby (F12) W. Hardyhead (M13)
Nov 2013
E. Hardyhead (F12) S. Longfin Goby (N13) E. Hardyhead (N12) E. Hardyhead (F13) S. Longfin Goby (N13) S. Longfin Goby (N13) S. Longfin Goby
Black Bream (F12) W. Hardyhead (N13) Bluespot Goby (N12) W. Hardyhead (N13) W. Hardyhead (M13) W. Hardyhead (N13) W. Hardyhead
Yellowfin Whiting (F12) Black Bream (M12) W. Hardyhead (N13) Sea Mullet (F13) S. Hardyhead (M13) Sandy Sprat (N13)

Native and Introduced Fishes of the Vasse‐Wonnerup 101
(e) Deadwater Feb 2012 May 2012 Aug 2012 Nov 2012 Feb 2013 May 2013 Aug 2013 Nov 2013
Feb 2012
Elongate Hardyhead
Bluespot Goby
S. Longfin Goby
Western Hardyhead
May 2012
Bluespot Goby (F12) Western Hardyhead
E. Hardyhead (F12) S. Longfin Goby
S. Longfin Goby (F12) Black Bream
Black Bream (F12) Silver Fish
Aug 2012
Bluespot Goby (F12) Sea Mullet (M12) S. Longfin Goby
E. Hardyhead (F12) W. Hardyhead (M12) Sea Mullet
S. Longfin Goby (F12) S. Longfin Goby )M12) Elongate Hardyhead
Black Bream (M12) Western Hardyhead
Nov 2012
E. Hardyhead (N12) E. Hardyhead (N12) Elongate Hardyhead
Bluespot Goby (N12) Bluespot Goby (N12) Bluespot Goby
W. Hardyhead (M12) Trumpeter Whiting (N12) S. Longfin Goby
S. Longfin Goby (M12) Black Bream (N12) Black Bream
Feb 2013
E. Hardyhead (F13) W. Hardyhead (F13) E. Hardyhead (F13) Elongate Hardyhead
S. Hardyhead (F13) S. Hardyhead (F13) S. Hardyhead (F13) S. Longfin Goby
Bluespot Goby (F13) Black Bream (F13) S. Longfin Goby (F13) Spotted Hardyhead
Black Bream (F13) Yellowtail Grunter (F13) Yellowtail Grunter (F13) Black Bream
May 2013
S. Longfin Goby (F12) W. Hardyhead (M12) E. Hardyhead (M13) E. Hardyhead (N12) E. Hardyhead (F13) Elongate Hardyhead
E. Hardyhead (F12) S. Longfin Goby (M12) S. Longfin Goby (A12) Bluespot Goby (N12) S. Longfin Goby (F13) Spotted Hardyhead
Black Bream (F12) Black Bream (M12) Sea Mullet (A12) Bridled Goby (N12) Black Bream (F13)
Silver Fish (M12) Black Bream (N12) S. Hardyhead (F13)
Aug 2013
Bluespot Goby (F12) Sea Mullet (M12) E. Hardyhead (N12) E. Hardyhead (F13) E. Hardyhead (M13) S. Longfin Goby
E. Hardyhead (F12) W. Hardyhead (M12) Bluespot Goby (N12) S. Hardyhead (F13) Sea Mullet (A13) Sea Mullet
S. Longfin Goby (F12) S. Longfin Goby (M12) Bridled Goby (N12) Black Bream (F13) S. Longfin Goby (A13) Western Hardyhead
W. Hardyhead (F12) Silver Fish (M12) Black Bream (N12) Bluespot Goby (F13) W. Hardyhead (A13)
Nov 2013
Bluespot Goby (F12) Tarwhine (N13) Tarwhine (N13) E. Hardyhead (N12) E. Hardyhead (F13) Tarwhine (N13) Tarwhine (N13) S. Longfin Goby
E. Hardyhead (F12) Black Bream (M12) Sandy Sprat (N13) Bluespot Goby (N12) S. Hardyhead (F13) Sandy Sprat (N13) Sandy Sprat (N13) Sandy Sprat
S. Longfin Goby (F12) Sandy Sprat (N13) K. George Whiting (N13) Tarwhine (N13) Black Bream (F13) W. Hardyhead (N13) Sea Mullet (A13) W. Hardyhead
Sandy Sprat (N13) Silver Fish (M12) W. Hardyhead (N13) K. George Whiting (N13) S. Longfin Goby (F13) K. George Whiting (N13) W. Hardyhead (N13) K. George Whiting

Native and Introduced Fishes of the Vasse‐Wonnerup 102
(f) Lower Wonnerup Estuary Feb 2012 May 2012 Aug 2012 Nov 2012 Feb 2013 May 2013 Aug 2013 Nov 2013
Feb 2012
Bluespot Goby
Western Hardyhead
May 2012
Bluespot Goby (F12) Elongate Hardyhead
E. Hardyhead (M12)
Aug 2012
Western Hardyhead
Bluespot Goby
Nov 2012
Bluespot Goby (N12) Bluespot Goby (N12) Bluespot Goby
E. Hardyhead (M12) E. Hardyhead (N12) Elongate Hardyhead
W. Hardyhead (N12) W. Hardyhead (N12) Western Hardyhead
Feb 2013
Bluespot Goby (F12) Bluespot Goby (N12) Bluespot Goby
W. Hardyhead (F12) E. Hardyhead (N12) Western Hardyhead
W. Hardyhead (N12)
May 2013
E. Hardyhead (M12) Bluespot Goby (N12) Bluespot Goby
Bluespot Goby (M13) E. Hardyhead (N12)
W. Hardyhead (N12)
Aug 2013
E. Hardyhead (M12) Bluespot Goby (N12) Bluespot Goby
E. Hardyhead (N12) Western Hardyhead
W. Hardyhead (N12) Spotted Hardyhead
Nov 2013
Bluespot Goby (N13) Bluespot Goby (N13) Bluespot Goby (N13) Bluespot Goby (N13) Bluespot Goby (N13) Western Hardyhead
E. Hardyhead (M12) W. Hardyhead (N13) W. Hardyhead (N13) W. Hardyhead (N13) W. Hardyhead (N13) Bluespot Goby
W. Hardyhead (N13) E. Hardyhead (N13) E. Hardyhead (N13) E. Hardyhead (N13) Elongate Hardyhead
W. Pygmy Perch (N13)

Native and Introduced Fishes of the Vasse‐Wonnerup 103
(g) Upper Wonnerup Estuary Feb 2012 May 2012 Aug 2012 Nov 2012 Feb 2013 May 2013 Aug 2013 Nov 2013
Feb 2012
May 2012
Aug 2012
W. Minnow (A12) Western Minnow
Nov 2012
Bluespot Goby (N12) Bluespot Goby (N12) Bluespot Goby
E. Hardyhead (N12) Western Minnow (A12) Elongate Hardyhead
E. Hardyhead (N12)
Feb 2013
May 2013
Bluespot Goby (M13) Bluespot Goby (N12) Bluespot Goby
W. Minnow (A12) E. Hardyhead (N12)
Aug 2013
Bluespot Goby (A13) W. Minnow (A13) Bluespot Goby
W. Minnow (A13) Bluespot Goby (N12) Western Minnow
E. Hardyhead (N12)
Nov 2013
W. Hardyhead (N13) W. Hardyhead (N13) W. Hardyhead (N13) W. Hardyhead (N13) Western Hardyhead
E. Hardyhead (N13) Bluespot Goby (N12) E. Hardyhead (N13) W. Minnow (A13) Elongate Hardyhead
Bluespot Goby (N13) E. Hardyhead (N13) Bluespot Goby
Bluespot Goby (N13)

104
CLUSTER‐SIMPROF demonstrated that, on the basis of their fish faunal compositions, the
eight season and year combinations formed two statistically discrete groups (Fig. 10a). The first
group contained samples from February and November 2012 and 2013 and the other those from
May and August 2012 and 2013. However, when the same analysis was run using the presence
or absence of each species, rather than a dispersion weighted and square rooted density of each
fish species, only a single group was identified (Fig. 10b).
Fig. 10: Dendrogram derived by subjecting, to the CLUSTER and SIMPROF utilizing Bray‐Curtis similarities, (a) the average density of each fish species across replicate samples and (b) the presence and absence of all fish species collected throughout all seven regions in the Vasse‐Wonnerup on each sampling occasion. The groups in which the species compositions are significantly different from those in all other groups are denoted by thick black lines, whereas connection via a red line indicated those samples no not differ significantly.
Feb1
2
Feb1
3
Nov
12
Nov
13
May
13
May
12
Aug1
2
Aug1
3100
80
60
40
20
Sim
ilarit
y
Feb1
2
Feb1
3
May
12
Aug
13
Nov
13
Nov
12
Aug
12
Ma y
13
Seasons and years
100
90
80
70
60
50
Sim
ilarit
y
(a)
(b)

105
Location of introduced fish captures
Two species of introduced species were recorded from the nearshore waters of the Vasse‐
Wonnerup between February 2012 and November 2013, namely the Goldfish and the Eastern
Gambusia (Table 9). Goldfish were only recorded from the Vasse axis of the system, with, at the
regional level, their abundance declining downstream from the Lower Vasse River Wetlands
(59%), Upper (40%) and Lower (1%) Vasse Estuary (Table 9). Generally, goldfish were most
abundant in November, with some fish persisting in the system until February, while only a
single individual was recorded in both Mays and none in either August. Eastern Gambusia were
predominantly found in the Lower Vasse River Wetlands (>99%; Table 9), with only small
numbers recorded in the Lower Vasse Estuary (once) and the Lower Wonnerup Estuary (three
times). Abundances peaked in February, particularly in 2012, due over 3,500 individuals being
caught in a single sample.
Table 9: The number of (a) Goldfish and (b) Eastern Gambusia captured at each site on each sampling after two replicate deployments of a 21.5m seine net. Note that only regions where each species was recorded are included in the table. (a)
Region L. Vasse River Wetland Upper Vasse Estuary Lower Vasse Estuary Site 1 2 3 4 1 2 3 4 1 2 3 4 Total
February 2012 1 1May 2012 1 1August 2012 0November 2012 38 92 83 8 160 4 3 6 394February 2013 34 34May 2013 0August 2013 0November 2013 5 1 1 3 4 6 3 1 24
Total 78 93 84 12 164 10 6 1 6 0 0 0
(b)
Region L. Vasse River Wetland Lower Vasse Estuary Lower Wonnerup Estuary Site 1 2 3 4 1 2 3 4 1 2 3 4 Total
February 2012 128 16 69 3,527 5 5 5 3,750May 2012 4 2 1 7August 2012 1 9 12 22November 2012 22 54 1 2 79February 2013 22 15 56 9 102May 2013 6 6August 2013 2 2 4November 2013 0
Total 155 57 191 3,555 0 0 0 5 0 7 0 5

106
Discussion
Water quality
Salinity and water temperature
The salinity of estuaries typically increases progressively downstream due to the declining
influence of freshwater. However, the seasonal trends exhibited by salinity throughout the
Vasse‐Wonnerup in 2012‐13 demonstrate that, during the warm dry summer months of two
successive years, there was an extreme reverse salinity gradient, with salinities increasing from
the Deadwater and Wonnerup Inlet to the upper Vasse and Wonnerup estuaries, where they
were far greater than sea water, i.e. 35, and reached 132 in the Upper Wonnerup Estuary in
February 2013. While this gradient was present in February (summer) and May (autumn) 2012
and February 2013, it reversed to a typical salinity gradient during August (winter) 2012 and May
2013 and remained so through to November (spring) or both years. During these cooler, wetter
months, salinities in the Vasse and Wonnerup estuaries declined dramatically to values that
were always < 10, with the minima being the 0.33 recorded in the Upper Vasse Estuary in August
2012, and progressively increased further downstream.
These salinity patterns are unique for an estuarine environment in south‐western
Australia. For example, salinities in the Moore River Estuary, which like the Vasse‐Wonnerup is
also classified as an intermittently‐open estuary (Potter and Hyndes, 1999; Brearley 2005),
undergo seasonal changes, which relate to the opening of the bar, but always maintain a typical
salinity gradient, with values for this variable decreasing with distance upstream (Young et al.,
1997). Moreover, even in estuaries which become markedly hypersaline, like the Culham Inlet,
where salinity reached 293, a typical salinity gradient was present (Hoeksema et al., 2006).
While, a reverse salinity gradient is known to occur in the permanently‐open Leschenault
estuary during summer, this is due to the fact that the tributary rivers discharge into the lower
reaches of the estuary and thus directly opposite the entrance channel (Semeniuk et al., 2000;
Veale et al., in press).

107
The concomitant dramatic increases in salinity during summer and autumn in the Vasse
and Wonnerup estuaries are largely due to their shallow depth, coupled with high levels of solar
radiation and thus evaporation and the limited precipitation that occurs at this time of year
(Bureau of Meteorology, 2014), which results in a decrease in water levels (see photos in
Appendix 3 and maps in Lane et al., 2011) and the concentration of salt. Note that this dramatic
increase in salinity does not occur in the Lower Vasse River Wetlands or the Deadwater and
Wonnerup Inlet. In the case of the first region, this was due to Ford Road acting as a barrier
preventing saline water being circulated into the Lower Vasse River Wetland. Thus, salinities in
this region were always very low, i.e. 0.31‐1.18. In regard to the Deadwater and Wonnerup Inlet,
salinities reached a maximum of 48 which, although classified as hypersaline, these were
substantially lower than those recorded in the Vasse and Wonnerup estuaries. This was due to i)
the opening of the bar, which, if not breached naturally, is open artificially in December 14th (Jim
Lane, pers. comm.; Appendix 5), and ii) the morphology of these regions. It is thus relevant that
the Deadwater and Wonnerup Inlet are significantly narrower (~100 m at the widest point) than
the Vasse and Wonnerup estuaries (~600‐700 m at the widest point; see also Fig. 1) and that
depth measurements taken across the entire VWWS by Lane et al. (2011) on 17 occasions
between April 1998 and September 2000 indicated that the maximum depth recorded in the
Upper Vasse and Wonnerup estuaries was 1 m shallower than that in the Deadwater and
Wonnerup Inlet.
The high levels of solar radiation combined with the shallow water also account for the
very high water temperatures particularly in the upper Vasse and Wonnerup estuaries and the
Lower Vasse River Wetlands during summer. As with salinity, the maximum recorded water
temperature of 33.3°C is almost certainly an under‐estimate of the true maximum as
temperatures were measured only at the time of sampling.

108
Dissolved oxygen concentration
Of the 572 measurements of dissolved oxygen concentrations recorded during the day
throughout the Vasse‐Wonnerup in this study, only 21 values fell below the 2 mg l‐1 threshold
for hypoxia (Rosenberg, 1980). The fact that only a small number of values were classified as
hypoxic is partially related to the fact that our measurements were collected during the day,
when the high levels of macro and microalgal growth in the system would produce oxygen
(Appendix 3). It is thus relevant that the dissolved oxygen concentration was above saturation in
32% of the water quality measurements collected. However, Lane et al. (1997) showed that
oxygen concentrations undergo a distinct diel pattern, being highest during the day and
deceasing to a minimum just before dawn.
Of the 21 hypoxic dissolved oxygen concentrations recorded, 14 of these values occurred
in one of three season and region combinations. The occasion with the lowest value, i.e. 0.02
(and two others of 0.23 and 0.49 mg L‐1), occurred in the Lower Vasse Estuary several weeks
before the large fish kill in April 2013 in an area where the sediment had become thixotropic
(see photo in Appendix 3). It is thus relevant that no fish were caught at that site at that time,
although sampling efficiency of the seine net was compromised by the gelatinous nature of the
sediment.
Very low levels of oxygen 0.17 mg L‐1 were recorded near the mouth of Wonnerup Inlet
in May 2012, during a time when the bar was closed (Appendix 5) and large amounts of seagrass
wrack, likely comprised of Posidonia sinuosa and Amphibolis antarctica (Oldman et al., 2010),
had accumulated and were decaying (see Appendix 5 for a photograph). Although the sediment
was suitable for a seine net, no fish were collected at this site. They were found, however, at the
next site ~ 300 m away, suggesting that fish had moved away from this localised area of hypoxia.
Note also that no dead fish were spotted floating or wash up on the banks, although they would
likely either sink or be consumed by birds very quickly.
The other occasion where hypoxic conditions were recorded was in the Lower Vasse
River Wetlands in February 2012 (i.e. 0.93‐1.75 mg L‐1). Although, to the best of our knowledge,
a fish kill did not occur, this may be due to the fact that the two most abundant species in this
109
region at this time were the Eastern Gambusia and the Bluespot Goby. The introduced Eastern
Gambusia is known to prefer degraded environments near urban areas (Lloyd et al., 1986) and
are able to slow their metabolism in oxygen poor waters (Cech et al., 1980; 1985). They are also
able survive in waters with ~1 mg L‐1 (Odum and Caldwell, 1955; Cherry et al., 1976) and even
down to 0.28 mg L‐1 if they are able to gulp air from the surface (Odum and Caldwell, 1955; Pyke,
2005). Likewise, the Bluespot Goby is able to use atmospheric oxygen via aquatic surface
respiration in response to hypoxia (Gee and Gee, 1991).
Number of species and density
Over the course of this two year study, 174,149 fish belonging to 31 species were recorded from
the nearshore waters of the Vasse‐Wonnerup. While, it is difficult to compare the numbers of
species across studies, as the number of species is directly related to the number of samples, it is
notable that the number of species here (from 416 samples) is similar to the 27 species (from
268 samples) recorded from the Moore River Estuary, which like the Vasse‐Wonnerup, is also
classified as an intermittently‐open estuary (Young et al., 1997). Furthermore, the average mean
density was also similar being recorded as 366 and 388 fish 100 m‐2, for the Moore River Estuary
and the Vasse‐Wonnerup, respectively. The silversides and gobies were amongst the most
speciose families and together accounted for ~94% of all fish recorded. The domination of the
nearshore waters by individuals of these families is typical of the nearshore waters of estuaries
in south‐western Australia (e.g. Potter and Hyndes, 1999; Hoeksema et al., 2006; Valesini et al.,
2009).
Four species recorded during this study are particularly noteworthy, the first two of
which are the Spotted Hardyhead and Common Hardyhead. These species, which ranked 4th and
29th, respectively, are tropical species whose distributions have expanded southwards recently
due to the warming of nearshore coastal waters (Veale et al., in press). These species were not
recorded in the Leschenault Estuary, ~60 km to the north, in 1994, but were recorded in 2008‐
2011 (cf. Potter et al., 1997; Veale et al., in press), and this study provides further evidence of a

110
southwards extension of their range. Two introduced freshwater species were also recorded
during this study, namely the Eastern Gambusia and the Goldfish (see later for more details).
Both the total and mean number of species were greatest in the Deadwater and
Wonnerup Inlet, reflecting the presence of many marine estuarine‐opportunist species, such as
the five species of whiting, two species of grunter, Tarwhine and Tailor, that were only found in
these regions. These species probably remained in the lower reaches and did not penetrate into
the Vasse or Wonnerup estuaries as salinities in the Deadwater and Wonnerup Inlet, remained
the closest to sea water throughout the entire year as opposed to going markedly hypersaline in
summer and autumn and oligohaline in winter and spring. It is thus relevant that Veale et al., (in
press), found that the contributions of marine species (which includes the marine estuarine‐
opportunists) declined as salinities increase along the Leschenault Estuary. In contrast, the
lowest mean and total number of species was recorded in the Upper Vasse and Wonnerup
estuaries, which reflects the fact that there are only a few species capable of tolerating the
extreme changes in salinity that occurs in these regions.
Densities followed a similar pattern to number of species, in that they were generally
greatest in the Deadwater and Wonnerup Inlet and lowest in the Upper Vasse and Wonnerup
estuaries, which is likely due to changes in salinity. Among regions, the deeper areas of the
VWWS, namely the Lower Vasse Estuary and the Deadwater and Wonnerup Inlet, density was
greatest in summer. This is during a time when water levels are receding (see Appendix 4; Lane
et al., 2011) and may reflect the movement of individuals downstream and away from the
shallow, hypersaline upper reaches. In contrast, densities in these latter reaches was greatest in
autumn, which is likely to reflect an increase in water level and consequent marked decline in
salinity (Appendix 4) and the presence of young Western Hardyheads, that spawn in the
preceding months (Prince and Potter, 1983) and which represented between 55‐80% of the total
number of individuals recorded in these regions.

111
Spatial changes in fish faunal composition
Fish faunal composition changed markedly among the seven regions in the Vasse‐Wonnerup,
producing many pairwise comparisons with corresponding R values > 0.900 (Table 4), however,
the pattern of regional differences (i.e. which regions were different from which other regions)
changed in every season and year combination. Thus, to simplify this pattern and remove
seasonal variability, CLUSTER‐SIMPROF was employed to determine, without an a priori
hypothesis, in which regions the compositions of the fish fauna were different from one another
and those where they were not. This analysis, which pooled across regions, identified four
statistically different groups or ‘management units’; (I) the Lower Vasse River Wetlands, (II)
Lower Vasse and Wonnerup estuaries, (III) Upper Vasse and Wonnerup estuaries and (IV) the
Deadwater and Wonnerup Inlet. The grouping of the upper and lower estuaries together, rather
than the Vasse and Wonnerup estuaries together, demonstrated that environmental differences
between regions within an estuary (i.e. upper vs lower) exhibit a stronger influence on the fish
fauna than those between estuaries (i.e. Vasse vs Wonnerup), a conclusion alluded to by
Tweedley et al., (2012) in their snapshot survey.
The fish fauna in the Lower Vasse River Wetlands was dominated by the Western
Hardyhead, which contributed 80% to the total number of fish recorded in this region. This
silverside is known to exhibit a preference for the upper reaches of estuaries where salinities are
lower (Prince et al., 1982). Therefore, its high dominance in the Lower Vasse River Wetlands is
likely due to the stable, low salinities there and a lack of competition from other hardyhead
species, such as the Elongate Hardyhead, which was abundant in all other regions of the Vasse‐
Wonnerup, but hardly recorded in that region. Furthermore, although this species generally
spawns in estuaries (Prince and Potter, 1983), it has been known to spawn in freshwater lakes
(D. Morgan, unpublished data) and is classified as an estuarine & freshwater species (Potter et
al., 2014). The same is also true for the Bluespot Goby, which generally prefers the upper
reaches of estuaries, was most abundant in the Lower Vasse River Wetlands and is capable of
surviving and spawning in freshwater (Gill and Potter, 1993; Gill et al., 1996). Four of the other
five species recorded in this region were freshwater species namely, the Eastern Gambusia,

112
Goldfish, Western Minnow and Western Pygmy Perch and their presence is related to the fact
that the water in this region always remained fresh, with salinities never exceeding ~1.
The next management unit, the upper Vasse and Wonnerup estuaries, had a similar
species complement to the Lower Vasse River Wetlands, except that the densities for all species
declined, with the exception of the Elongate Hardyhead which increased. This low mean density
is a reflection of the extreme changes in salinity (Fig. 16a) and water level (Fig. 16b), which occur
in these regions over the course of a year. For example, no fish were recorded at any site in
these regions three of the four summer and autumn seasons. While, in winter and spring, these
areas are recolonised by low numbers of the Western Minnow and Western Pygmy Perch from
the tributary rivers, the Elongate Hardyhead and the Bluespot Goby from the lower reaches of
these estuaries. Substantial numbers of juvenile Goldfish also recruit into the Upper Vasse
Estuary (and to a lesser extent into the Lower Vasse Estuary) during November from the Lower
Vasse River Wetlands (see later). The timing of the recolonisation is likely to be determined by
the pattern of rainfall as, all of these five species can breed in, or in the case of the Elongate
Hardyhead, survive in freshwater. Furthermore, the only time any fish were recorded in the
Upper Vasse or Wonnerup estuaries during summer or autumn was in May 2013, following
unseasonal rains that occurred in late March/ early April, i.e. around the time of the large fish
kill, which would have raised water levels and lower salinities to enable recolonisation by the
Western Hardyhead and Bluespot Goby (Table 5f) from the Lower Vasse River Wetlands and
Lower Wonnerup Estuary, respectively.
Fig. 16: The (a) Upper Wonnerup and (b) Upper Vasse estuaries in February 2013, showing shallow puddles of hypersaline waters (salinity = 132) and the dry expanses of benthos exposed, respectively, that are a result of extensive evaporation and a lack of freshwater discharge that occurs during the hot, dry summer period.

113
Moving downstream, the next ‘management unit’ identified by CLUSTER‐SIMPROF was
the lower Vasse and Wonnerup estuaries. Unlike their counterparts in the upper reaches, these
regions generally always remain wet, albeit hypersaline (Lane et al., 2011). Thus, it is
unsurprising that, these areas yield a greater number of species and density of individuals than
the upper estuaries. This is due to the presence of freshwater species during winter and spring,
but also several estuarine species, such as the Spotted Hardyhead and the Bridled Goby in the
lower Vasse and Wonnerup estuaries, and the Black Bream, Common Silverbiddy and Southern
Longfin Goby in the Lower Vasse Estuary. The greater densities in the lower reaches of the
estuaries are mainly driven by increased densities of the Western and Elongate hardyheads and
the Bluespot Goby, which may reflect the more stable water levels and the fact that these
species are all euryhaline, with the last two species able to tolerate salinities of 76 and 136,
respectively (Hoeksema et al., 2006).
The furthest downstream and most unique of the ‘management units’ is that containing
the Deadwater and Wonnerup Inlet. These two regions yielded by far the most number of
species, i.e. 25 and 22, respectively, out of the full complement of 31 and recorded the highest
densities of fish in all seasons except spring. This high species richness is due to the fact that the
only species that were not recorded in this management unit were the two native (Western
Pygmy Perch and Western Minnow) and two introduced freshwater species (Eastern Gambusia
and Goldfish) that breed in freshwater and the marine straggler species Old Wife, of which only
a single individual was recorded. Furthermore, the Deadwater and Wonnerup Inlet harboured
many marine estuarine‐opportunist species, which were generally not caught in other regions.
This included five species of Whiting and two species of Mullets, Porgies and Grunters. The
presence of these species is related to these regions being located close to the ocean and having
a relative stable water level and salinity regime, which was always similar to full strength sea
water. The presence of so many juveniles belonging to marine estuarine‐opportunist species
provides a strong indication that many fish recruit into these regions of the Vasse‐Wonnerup
and use them as a nursery area. Furthermore, as these areas always contain water, they also act
as an important refuge area when water levels recede upstream.

114
Temporal changes in fish faunal composition
Analysis of the extensive data collected during this study indicates that the composition of the
fish fauna varies seasonally, with significant changes found to occur in each of the seven regions.
These were generally related to far higher densities of fish being recorded in February and
November, than in May and August, with the trend being present in both 2012 and 2013. This is
reflected in the CLUSTER‐SIMPROF dendrogram, which indicated that changes in the density of
species among sampling occasions at the whole estuary level were responsible for the seasonal
differences rather than a change in the presence or absence of species themselves.
Temporal changes in density were particularly marked in the most abundant four species
namely the Western, Elongate and Spotted hardyheads and the Bluespot Goby, which together
represented >90 % of all fish recorded (Table 6). Densities of the Western Hardyhead and
Bluespot Goby peaked in November of both 2012 and 2013, and substantial numbers were also
recorded in February. The peak in November is likely to reflect the presence of 0+ recruits, as
the peak spawning period of both of these species is October (Prince and Potter, 1983; Gill et al.,
1996). Likewise, in the Swan‐Canning Estuary, the Elongate Hardyhead and the Spotted
Hardyhead spawn around November‐December (Prince and Potter 1983), which explains the
peak abundance of these two species occurring in February. However, it is unlikely that the
breeding cycle alone is responsible for the dramatic declines in some of these species during
May and August. For example, while densities of the Southern Longfin Goby also decline
conspicuously from a peak in February, Gill and Potter et al. (1993) found that the abundance of
this species did not change seasonally. Furthermore, while these authors also reported that the
density of the Bluespot Goby was significantly greater in spring than in winter, due to fish dying
after spawning (Gill et al., 1996), the difference was not as marked as was recorded during this
study where the density of this species declined from 55 and 40 individuals 100m‐2 in spring and
summer, respectively, to 2.5 and 1 individuals 100m‐2 in autumn and winter, respectively.

115
Another factor that may explain the increase in total density in February may be the
reduction in the surface area of the VWWS due to the substantial evaporation that occurs at this
time of the year together with the lack of freshwater discharge (Lane et al., 2011) and thus the
subsequent concentration of fish in the lower reaches. In contrast, when total densities are
lower, particularly in August, water levels have increased. The conspicuous decline in density
between February and May 2013 may be a result of the substantial fish kill (see later), however,
it is worth noting that a similar although less marked decline was seen between these two
seasons in the preceding year.
Spatial and temporal changes the abundance and distribution of introduced fish
Of the 13 introduced fish species that have been recorded in south‐western Australian
freshwater systems (Morgan et al., 2004), two species, namely the Eastern Gambusia and the
Goldfish, were known to occur in the lower reaches of the Vasse River (Morgan and Beatty,
2007; Tweedley et al., 2013). While a snapshot survey by Tweedley et al. (2012), confirmed
suspicions that these species had spread down into the estuary (Wetland Research and
Management, 2007), this survey indicates that no more introduced fish species are present in
the Vasse‐Wonnerup. Furthermore, a detailed survey of the four tributary rivers undertaken
concurrently with the current study confirmed that no additional introduced fish species were
present (Tweedley et al., 2013).
The results of the current study demonstrate that Eastern Gambusia were present within
three of the regions in the Vasse‐Wonnerup, with their abundance varying markedly among
them. Of the 4610 individuals, the vast majority 99.5% were found in the Lower Vasse River
Wetlands. This is unsurprising as, despite being very tolerant of saline conditions Eastern
Gambusia are essentially a freshwater species (Pyke 2005; 2008). It should be noted, however,
that two individuals were collected using a sweep net from the Upper Wonnerup Estuary in a
salinity of 72, breaking the previous world record of 58.8 (Chervinski, 1983).

116
While Eastern Gambusia were recorded in the Lower Vasse River Wetlands in seven of
the eight seasons (i.e. all except November 2013), their densities varied markedly. Over 90% of
the individuals were recorded in February, which corresponds to the peak breeding period of
this species (Pyke 2005). Furthermore, it is relevant that Chapman and Warbourton (2006) found
that flooding depleted densities of Eastern Gambusia, and, that the lowest densities were
recorded during August and November following freshwater discharge. Low densities of Eastern
Gambusia were recorded in the lower Vasse and Wonnerup estuaries, but only in February
2012, with the exception of two individuals caught in the latter region in November 2012. This
suggests that although they possess a salinity tolerance that would enable them to survive in
most of the Vasse‐Wonnerup (Chervinski 1983; Pyke 2005), they generally remain in both the
tributary rivers and the Lower Vasse River Wetlands.
The other species of introduced fish found by Tweedley et al. (2012) in the Vasse‐
Wonnerup was the Goldfish with a small number recorded in the Vasse Estuary during January
2012 in salinities of ~17 and this species has been thought to inhabit the Vasse River since at
least 1996 (Morgan and Beatty 2007). As in Tweedley et al. (2012), Goldfish were found to occur
only along the Vasse axis of the VWWS (i.e. Lower Vasse Wetlands, and the Upper and Lower
Vasse estuary). Along this distribution the abundance of Goldfish declined, with 309 individuals
being recorded in the Lower Vasse River Wetlands and 210 and 7 in the Upper and Lower Vasse
Estuary, respectively. As most of these recordings were during times when the salinities in these
regions were < 5, salinity is unlikely to be a prohibiting factor. As average length of goldfish
recorded was 30 mm TL, It is more likely that the decline in abundance downstream reflects an
increase in distance from the Lower Vasse River where they were born, which is ~7 km
upstream.
The use of the estuary by juvenile goldfish occurred seasonally. Thus, while only 1, 1 and
0 fish were recorded in February and August 2012, respectively, 458 were recorded in November
of that year. In 2013, 39 goldfish were recorded in February, none in May and August and 27 in
November. These data clearly demonstrate that, following their birth around October (Morgan
and Beatty, 2007), a large number of 0+ goldfish move downstream, either through flushing or

117
perhaps swimming to avoid intraspecific completion from larger fish. Given that Tweedley et al.,
(2012) recorded juvenile goldfish in a salinity of 17 there is a risk that these fish might use the
estuary as a ‘saltbridge’ to gain access to new river systems, such as the Sabina and Abba rivers,
and to the Wonnerup Estuary and Ludlow River through Melbup creek during a wet winter, thus
expanding its distribution (Schofield et al., 2006). It is relevant that such movements have been
recorded in other introduced freshwater fish species elsewhere in the world, such as Zander,
Stizostedion lucioperca (Brown et al., 2001; 2007). Furthermore, given that the Goldfish in the
Lower Vasse River are the fastest growing in the world and are able to breed after their first year
of life (Morgan and Beatty, 2007), the movement of several juveniles into a new tributary on a
single occasion may be all that is needed to establish a new population.

118
Management and Monitoring Recommendations
Management
Issue Findings Actions
Controlling current
introduced species in the
Vasse‐Wonnerup Wetland
System
Despite the large scale of the sampling regime, no new species
of introduced fish or crayfish were recorded in the Vasse‐
Wonnerup with introductions currently limited to Goldfish
(Vasse River and Vasse Diversion Drain), Eastern Gambusia (all
rivers, wetland and estuarine habitats), and the eastern
Australian Yabby (Vasse River, Vasse Diversion Drain, Sabina
and Ludlow rivers).
Eastern Gambusia are widespread in the rivers, wetland and
estuarine habitats and 26,081 removed from the rivers and
3,970 from the wetlands during this project.
Damage to the fins of native fish by Eastern Gambusia was
considerable and was related to the seasonal patterns in the
density of the invasive species.
Yabbies were recorded in very low abundance but remain a
threat as they are known to compete with native crayfish for
food, and have an invasive life‐history including being tolerant
of poor water quality and can burrow into sediment to escape
drought.
A total of 842 Goldfish were removed from the Vasse River and
472 from the Lower Vasse River Wetland and the Upper Vasse
There is little chance of controlling or
eradicating Eastern Gambusia or Yabbies
given their distribution, abundance (in
terms of Eastern Gambusia), and invasive
life‐cycles.
Ongoing public education on the severe
ecological damage caused by Eastern
Gambusia and the Yabby should be
conducted as part of the broader campaign
to limited their additional spread (e.g. to
artificial water bodies).
Ongoing control of the Goldfish in the
Vasse River should occur and a fish trap be
designed and trialed at the entrance to the
New River Wetland. This could be a funnel
design that would allow one‐way
movement of Goldfish in to the system
during winter and subsequently block their
movement back into the river during the
drying summer months. This would allow

119
Estuary, which exceeded the number from all of the previous
control attempts combined.
The tracking study revealed that Goldfish were highly mobile
with many travelling at least hundreds of km over a one year
period.
Two key spawning habitats were revealed with 60% of Goldfish
being recorded in the New River Wetland during its peak
breeding period. Almost half the tracked fish also utilised the
Lower Vasse River Wetland at some time.
Due to its salinity tolerance elucidated during the current
project, without continued control and eradication efforts to
reduce level of downstream movement to the wetland system,
there is a high risk that the species will eventually colonise
other rivers.
concentration of the species for control to
occur in the near‐dry wetland in autumn
(using a piscicide or pumping).
Consideration would need to be made
regarding the monitoring (e.g. clearing
debris) and possibly also trapping Sea
Mullet in the wetland as it dries.
Preventing future
introduced species in the
Vasse‐Wonnerup Wetland
System
The system was found to house only three of the 15 species of
introduced fish and crayfish known from wild systems in south‐
western Australia. This presents an opportunity to protect this
important system from these and future novel introductions.
There has been a 44% increase in the number of introduced
freshwater fishes in south‐western Australia over the past
decade with 80% of new introductions being aquarium species.
Investing in prevention is the most cost‐effective way to
mitigate the impacts of introduced aquatic species as their
control and eradication is usually costly, difficult or impossible.
Ongoing public education on the high
ecological significance of the Vasse‐
Wonnerup system along with the severe
ecological damage that can result from
introduced fish and crayfish should be
conducted.
Public education should be coordinated
across agencies (led by Department of
Fisheries) to maximise the efficient use of
resources and be targeted at a broader
section of the community as possible.
A specific target should be the aquarium

120
industry as this is the source of most new
introductions in the region.
Protecting habitats for
native fishes
Areas of highest conservation value in the rivers were found to
be in the lower reaches where permanent refuges existed.
The Deadwater and Wonnerup Inlet were identified as the key
high‐conservation regions of the Vasse‐Wonnerup Wetland.
Fish kills are a major stressor on the system, particularly the
Black Bream population that cannot recruit from outside the
system (see Tweedley et al. 2014).
Ongoing efforts to protect and rehabilitate
riparian zones should be made, particularly
in the lower reaches of rivers, to project
refuge pools and other areas of high
conservation value.
Ensuring priority is given to protecting the
Deadwater and Wonnerup Inlet which
houses the greatest diversity of fishes and
act as refuges during times of poor water
quality.
Continuing to address excessive nutrient
inputs into the rivers of the Vasse‐
Wonnerup will benefit native fish and
crayfish and the ecosystems more
generally.
Immediately following any fish kill an
independent assessment of its effects (e.g.
fish mortality and subsequent ecological
effects) should be undertaken (see
Tweedley et al. 2014).
Reinstating migratory
pathways for native fishes
Limited seasonal migrations of native fishes were recorded into
upstream sections.
Instream barriers to fish migrations should
be assessed and prioritised in the Sabina
and Abba Rivers using the process

121
developed and implemented for the
Ludlow River (as part of a project that was
conducted concurrently for the National
Climate Change Adaptation Research
Facility).
Monitoring
Issue Need Action
Preventing future
introduced species in the
Vasse‐Wonnerup Wetland
System
The current study revealed no unexpected introduced species;
however, given the recent increase in south‐western Australia,
it is paramount that any future introductions are detected early
to provide greatest change of containment or eradication.
Coordinated, annual monitoring of key sites
in the Wetland and also the lower reaches
of the Vasse, Sabina, Abba, and Ludlow
Rivers during baseflow (e.g. February)
should be conducted to detect any new
introductions and also detect Goldfish
should they spread into the latter three
rivers.
Monitoring the health of
the Vasse‐Wonnerup
Wetland System using
fishes as an indicator group
The Vasse‐Wonnerup Wetland and its rivers were shown to
have considerable ecological value in terms of fish fauna.
These fauna could be used as part of a broader monitoring
program to track the health of the system and to assess
Annual monitoring of the nearshore fish
community in the Wetland and the lower
reaches of its four rivers should occur in
February in order to monitor the condition

122
effectiveness of management actions (e.g. floodgate operation,
nutrient reductions).
of the fish fauna in order to both track
long‐term changes, such as climate change,
and also assess the effectiveness or any
management actions undertaken to
remediate the system.
123
References Anderson, M.J. (2001) A new method for non‐parametric multivariate analysis of variance.
Austral Ecology 26(1), 32‐46.
Anderson, M.J., Gorley, R.N., and Clarke, K.R. (2008) 'PERMANOVA+ for PRIMER: guide to
software and statistical methods.' (PRIMER‐E: Plymouth, UK)
Beatty, S.J. and Morgan, D.L. (2009) Goldfish control in the Vasse River: summary of the 2008 programme. Technical report to Geocatch. Centre for Fish and Fisheries Research, Murdoch University, Western Australia.
Beatty, S.J., and Morgan, D.L. (2013) Introduced freshwater fishes in a global endemic hotspot and implications of habitat and climatic change. Bioinvasions Records 2(1), 1-9.
Beatty, S.J., Morgan, D.L., and Gill, H.S. (2005) Role of life history strategy in the colonisation of
Western Australian aquatic systems by the introduced crayfish Cherax destructor Clark,
1936. Hydrobiologia 549, 219‐237.
Beatty, S.J., Morgan, D.L., and Lymbery, A.J. (2014) Implications of climate change for
potamodromous fishes. Global Change Biology 20 (6), 1794‐1807.
Brearley, A. (2005) 'Ernest Hodgkin's Swanland.' 1st edn. (University of Western Australia Press:
Crawley) 550
Breine, J., Maes, J., Quataert, P., Bergh, E., Simoens, I., Thuyne, G., and Belpaire, C. (2007) A fish‐
based assessment tool for the ecological quality of the brackish Schelde estuary in Flanders
(Belgium). Hydrobiologia 575(1), 141‐159.
Brown, J., Scott, D., Wilson, R., and Gherardi, F. (2007) Do estuaries act as saline bridges to allow
invasion of new freshwater systems by non‐indigenous fish species? In Biological invaders
in inland waters: profiles, distribution, and threats. Vol. 2. pp. 401‐414.
Brown, J.A., Moore, W.M., and Quabius, E.S. (2001) Physiological effects of saline waters on
zander. Journal of Fish Biology 59(6), 1544‐1555.
Bureau of Meteorology (2014).
Cech, J.J.J., Massingill, M.J., Vondracek, B., and Linden, A.L. (1985) Respiratory metabolism of
mosquitofish, Gambusia affinis: effects of temperature, dissolved oxygen, and sex
difference. Environmental Biology of Fishes 13(4), 297‐307. [In English]
Cech, J.J.J., Massingill, M.J., and Wragg, T.E. (1980) The food demands of mosquitofish,
Gambusia affinis. In 'Forty‐eighth Annual Conference of the California Mosquito and
Vector Control Association', 1980, Anaheim, California. (Ed. CD Grant), pp. 45‐47

124
Chapman, P., and Warburton, K. (2006) Postflood movements and population connectivity in
gambusia (Gambusia holbrooki). Ecology of Freshwater Fish 15(4), 357‐365.
Cherry, D.S., Guthrie, R.K., Rodgers, J.H., Cairns, J., and Dickson, K.L. (1976) Responses of
mosquitofish (G. affinis) to ash effluent and thermal stress. Transactions of the American
Fisheries Society 105, 686‐694.
Chervinski, J. (1983) Salinity tolerance of the mosquito fish, Gambusia affinis (Baird and Girard).
Journal of Fish Biology 22(1), 9‐11.
Clarke, K.R. (1993) Non‐parametric multivariate analyses of changes in community structure.
Australian Journal of Ecology 18, 117‐143.
Clarke, K.R., Chapman, M.G., Somerfield, P.J., and Needham, H.R. (2006) Dispersion‐based
weighting of species counts in assemblage analyses. Marine Ecology Progress Series 320,
11‐27.
Clarke, K.R., and Gorley, R.N. (2006) 'PRIMER v6: User Manual/Tutorial.' (PRIMER‐E: Plymouth)
Clarke, K.R., and Green, R.H. (1988) Statistical design and analysis for a 'biological effects' study.
Marine Ecology Progress Series 46, 213‐226.
Clarke, K.R., Somerfield, P.J., and Gorley, R.N. (2008) Testing of null hypotheses in exploratory
community analyses: Similarity profiles and biota‐environment linkage. Journal of
Experimental Marine Biology and Ecology 366(1‐2), 56‐69.
Clarke, K.R., Tweedley, J.R., and Valesini, F.J. (2014) Simple shade plots aid better long‐term
choices of data pre‐treatment in multivariate assemblage studies. Journal of the Marine
Biological Association of the United Kingdom 94(1), 1‐16.
Department of Water (2010) Vasse Wonnerup Wetlands and Geographe Bay water quality
improvement plan.
Gee, J.H., and Gee, P.A. (1991) Reactions of Gobioid Fishes to Hypoxia: Buoyancy Control and
Aquatic Surface Respiration. Copeia 1991(1), 17‐28.
Gill, H.S., and Potter, I.C. (1993) Spatial segregation amongst goby species within an Australian
estuary, with a comparison of the diets and salinity tolerance of the two most abundant
species. Marine Biology 117(3), 515‐526.
Gill, H.S., Wise, B.S., Potter, I.C., and Chaplin, J.A. (1996) Biannual spawning periods and
resultant divergent patterns of growth in the estuarine goby Pseudogobius olorum:
Temperature‐induced? Marine Biology 125(3), 453‐466.

125
Hallett, C.S., Valesini, F.J., and Clarke, K.R. (2012a) A method for selecting health index metrics in
the absence of independent measures of ecological condition. Ecological Indicators 19(0),
240‐252.
Hallett, C.S., Valesini, F.J., Clarke, K.R., Hesp, S.A., and Hoeksema, S.D. (2012b) Development and
validation of fish‐based, multimetric indices for assessing the ecological health of Western
Australian estuaries. Estuarine, Coastal and Shelf Science 104–105(0), 102‐113.
Harrison, T.D., and Whitfield, A.K. (2004) A multi‐metric fish index to assess the environmental
condition of estuaries. Journal of Fish Biology 65(3), 683‐710.
Hart, B.T. (2014) Independent review of the current and future management of water assests in
the Geographe catchment, WA. Water Science, Echuca, Australia.
Hoeksema, S.D., Chuwen, B.M., Hesp, S.A., Hall, N.G., and Potter, I.C. (2006) Impact of
environmental changes on the fish faunas of Western Australian south‐coast estuaries.
Centre for Fish and Fisheries Research, Murdoch University, Perth.
Kolmakov, V.I., and Gladyshev, M.I. (2003) Growth and potential photosynthesis of
cyanobacteria are stimulated by viable gut passage in crucian carp. Aquatic Ecology 37,
237‐242.
Lane, J.A., Hardcastle, K.A., Tregonning, R.J., and Holtfreter, S. (1997) Management of the Vasse‐
Wonnerup wetland system in relation to sudden, mass fish deaths. Vasse Estuary Technical
Working Group, Busselton, Australia.
Lane, J.A.K., Clarke, A.G., and Pearson, G.B. (2007) Waterbirds of the Vasse‐Wonnerup Wetlands
in 1998‐2000 and some comparisons with earlier data. Western Australian Department of
Environment and Conservation., Busselton, Australia.
Lane, J.A.K., Clarke, A.G., and Winchcombe, Y.C. (2011) Depth, salinity and temperature profiling
of Vasse‐Wonnerup wetlands in 1998‐2000. Western Australian Department of
Environment and Conservation, Busselton, Australia.
Lek, E., Fairclough, D.V., Platell, M.E., Clarke, K.R., Tweedley, J.R., and Potter, I.C. (2011) To what
extent are the dietary compositions of three abundant, co‐occurring labrid species
different and related to latitude, habitat, body size and season? Journal of Fish Biology
78(7), 1913‐1943.
Lloyd, L.N., Arthington, A.H., and Milton, D.A. (1986) The mosquitofish – a valuable mosquito‐
control agent or a pest? In The Ecology of Exotic Animals and Plants Some Australian Case
Histories. (Ed. RL Kitching) pp. 6‐25. (John Wiley & Sons,: Brisbane, Australia)

126
Lynch, K. (2013) The Vasse Wonnerup System. In Bay OK community seminar. (Department of
Water: Busselton, Australia)
Marina, H., Beatty, S.J., Morgan, D.L., Doupé, R.G., and Lymbery, A.L. (2008) An introduced
parasite, Lernaea cyprinacea, found on native freshwater fish in the south west of Western
Australia. Journal of the Royal Society of Western Australia 91,149‐153.
McAlpine, K.W., Spice, J.F., and Humphries, R. (1989) The environmental condition of the Vasse‐
Wonnerup wetland system and a discussion of management options. Western Australian
Environmental Protection Authority Technical Series 31, 1‐35.
Morgan, D.L. and Beatty, S.J. (2004) Fish fauna of the Vasse River and the colonisation by feral
Goldfish (Carassius auratus). Murdoch University. Centre for Fish and Fisheries Research,
Western Australia.
Morgan, D., and Beatty, S. (2005) Control of feral Goldfish (Carassius auratus) in the Vasse River.
Centre for Fish and Fisheries Research, Murdoch University Report to the Vasse‐Wonnerup
LCDC.
Morgan, D.L., and Beatty, S.J. (2007) Feral Goldfish (Carassius auratus) in Western Australia: a
case study from the Vasse River. Journal of the Royal Society of Western Australia 90(151‐
156).
Morgan, D., Beatty, S., and Kurata, K. (2008) Feral Goldfish (Carassius auratus) in the Warren
River catchment. Centre for Fish and Fisheries Research, Murdoch University Report to
Southern Forests Landcare.
Morgan, D.L., Gill, H.S., Maddern, M.G., and Beatty, S.J. (2004) Distribution and impacts of
introduced freshwater fishes in Western Australia. New Zealand Journal of Marine and
Freshwater Research 38(511‐523).
Odum, H.T., and Caldwell, D.K. (1955) Fish respiration in the natural oxygen gradient of an
anaerobic spring in Florida. Copeia 1955(2), 104‐106.
Oldman, C.E., Lavery, P.S., McMahom, K., Pattiaratchi, C.B., and Chiffings, T.W. (2010) Seagrass
wrack dynamics in Geographe Bay, Western Australia. University of Western Australia,
Perth, Australia.
Potter, I.C., and Hyndes, G.A. (1999) Characteristics of the ichthyofaunas of southwestern
Australian estuaries, including comparisons with holarctic estuaries and estuaries
elsewhere in temperate Australia: a review. Austral Ecology 24(4), 395‐421.

127
Potter, I.C., Tiivel, D., Valesini, F.J., and Hyndes, G.A. (1997) Comparisons between the
ichthyofaunas of a temperate lagoonal like estuary and the embayment into which that
estuary discharges. International Journal of Salt Lake Research 5, 337‐358.
Potter, I.C., Tweedley, J.R., Elliott, M., and Whitfield, A.K. (2014) The ways in which fish use
estuaries: a refinement and expansion of the guild approach. Fish and Fisheries.
Prince, J., and Potter, I. (1983) Life‐cycle duration, growth and spawning times of five species of
atherinidae (Teleostei) found in a Western Australian estuary. Marine and Freshwater
Research 34(2), 287‐301.
Prince, J., Potter, I., Lenanton, R., and Loneragan, N. (1982) Segregation and feeding of atherinid
species (Teleostei) in south‐western Australian estuaries. Marine and Freshwater Research
33(5), 865‐880.
Pyke, G. (2005) A review of the biology of Gambusia affinis and G. holbrooki. Reviews in Fish
Biology and Fisheries 15(4), 339‐365. [In English]
Pyke, G.H. (2008) Plague minnow or mosquito fish? A review of the biology and impacts of
introduced Gambusia species. Annual Review of Ecology, Evolution, and Systematics 39(1),
171‐191.
Rosenberg, R. (1980) Effect of oxygen deficiency on benthic macrofauna. In 'Fjord
oceanography', 1980. (Eds. JH Freeland, DM Farmer and CD Levings), pp. 499‐514
Schofield, P.J., Brown, B.E., and Fuller, P.F. (2006) Salinity tolerance of goldfish, Carassius
auratus, a non‐native fish in the United States. Florida Scientist 69, 258‐268.
Semeniuk, V., Semeniuk, T.A., and Unno, J. (2000) The Leschenault Inlet estuary: an overview.
Journal of the Royal Society of Western Australia 83, 207–228.
Tweedley, J.R., Beatty, S.J., and Lymbery, A.J. (2013) Control of introduced fish and crayfish in
the Vasse‐Wonnerup Ramsar Wetland. Final MERI report. Report for Caring for our
Country., Perth, Australia.
Tweedley, J.R., Hallett, C.S., and Chambers, J.M. (2012) A baseline survey of the fish fauna of the
hightly eutrophic in the Vasse Wonnerup estuaries. Murdoch University, Perth, Australia.
Tweedley, J.R., Hallett, C.S., Warwick, R.M., Clarke, K.R., and Potter, I.C. (Submitted) The
dramatic effect of an extreme weather event on the benthos of a microtidal estuary.
Marine Pollution Bulletin.
Valesini, F.J., Coen, N.J., Wildsmith, M.D., Hourston, M., Tweedley, J.R., Hallett, C.S., Linke, T.E.,
and Potter, I.C. (2009) Relationships between fish faunas and habitat type in south‐

128
western Australian estuaries. Project 2004/045. Draft Final Report for Fisheries Research
and Development Corporation. Murdoch University, Perth, Western Australia.
Veale, L., Tweedley, J.R., Clarke, K.R., Hallett, C.S., and Potter, I.C. (in press) Characteristics of the
ichthyofauna of a temperate microtidal estuary with a reverse salinity gradient, including
inter‐decadal comparisons. Journal of Fish Biology.
Wetland Research and Management (2007) Ecological character description: Vasse‐Wonnerup
wetlands Ramsar site south‐west Western Australia. Wetland Research and Management,
Perth, Australia.
Whitty, J.M., Morgan, D.L., and Thorburn, D.C. (2009) Movements and interannual variation in
the morphology and demographics of Freshwater Sawfish (Pristis microdon) in the Fitzroy
River. In: Phillips N M, Whitty J M, Morgan D L, Chaplin J A, Thorburn D C and Peverell S C
(eds). Freshwater Sawfish (Pristis microdon) movements and population demographics in
the Fitzroy River, Western Australia and genetic analysis of P. microdon and Pristis zijsron.
Centre for Fish and Fisheries Research (Murdoch University) report to the Department of
the Environment, Water, Heritage and the Arts, Australian Government.
Young, G.C., Potter, I.C., Hyndes, G.A., and de Lestang, S. (1997) The ichthyofauna of an
intermittently open estuary: Implications of bar breaching and low salinities on faunal
composistion. Estuarine, Coastal and Shelf Science 45, 53‐68.

129
Appendices
Appendix 1: Field data sheet (environmental and habitat characteristics)

130
Appendix 2: Site photographs

131

132

133

134
Appendix 3: Photographs highlighting the differences among regions and seasons in the Vasse‐Wonnerup (for locations see Fig. 1). Photographs taken by James Tweedley.
The Deadwater in May and November 2013. Note the marked increase in macroalgae in November.
Wonnerup Inlet in May and November 2013. Note the exposed areas of seagrass wrack in May.
Lower Vasse Estuary in February 2012 and 2013. The environment in 2012 is characterised by large macroalgal blooms, while in 2013 low water levels exposed fine anoxic sediments.

135
Appendix 3 continued: Photographs highlighting the differences among regions and seasons in the Vasse‐Wonnerup (for locations see Fig. 1). Photographs taken by James Tweedley.
Lower Wonnerup Estuary in February and May 2013. Note the presence of serpulid tubeworm mounds in February and the subsequent dramatic increase in water levels by May of that year.
Upper Wonnerup Estuary in November 2012, shallow water with extensive macrophyte beds, however, by February 2013 the macrophytes had been consumed by birds, primarily Black Swans, and the water
evaporated.
Lower Vasse River Wetlands in November 2012 and February 2013. Note the decrease in water levels and presence of a phytoplankton bloom in February 2013.

136
Appendix 4: Daily water levels in comparison to mean sea level recorded by the Department of Parks and Wildlife in the Lower Vasse River Wetlands, Lower Vasse Estuary and Lower Wonnerup Estuary. Data kindly provided by Jim Lane and Yvonne Winchcombe (DPaW).
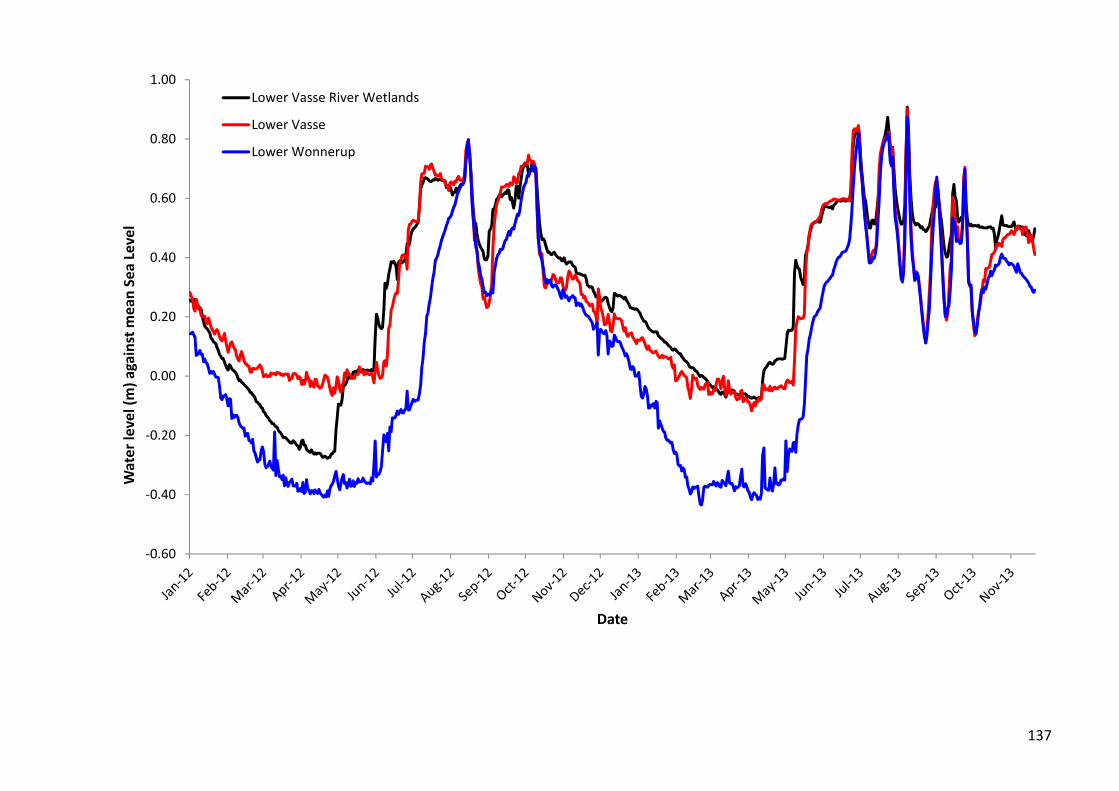
137
‐0.60
‐0.40
‐0.20
0.00
0.20
0.40
0.60
0.80
1.00
Water level (m) against m
ean
Sea Level
Date
Lower Vasse River Wetlands
Lower Vasse
Lower Wonnerup

138
Appendix 5: State of the bar at the mouth of Wonnerup Inlet between December 2011 and December 2013. Photographs taken by James Tweedley.
Late December 2011: Deep, straight connection to the ocean as the bar had been dug open two weeks prior. Remained open in February 2012.
Late May 2012: Bar closed to the ocean

139
Late August 2012: Bar remained closed to ocean November 2012: A relatively wide but shallow connection established
Appendix 5 continued: State of the bar at the mouth of Wonnerup Inlet between December 2011 and December 2013.
Late February 2013: A very narrow and shallow connection remains Late May 2013: Bar closed to the ocean, despite being opened following the
fish kill in April of that year.

140
Late August 2013: Deep and wide connection to ocean following heavy rain.
Note the erosion on southern bank due to substantial outflow Late November 2013: Bar closed.

141
Appendix 6: List of common and scientific names for fish collected from the Vasse‐Wonnerup during this study. Species denotes with an * indicate that they have been collected from the system by the authors of this report since the completion of the current study.
Common Name Species Name Family Family Name
Western Australian Salmon Arripis truttaceus Arripidae Australasian Salmons
Common Hardyhead Atherinomorus vaigiensis Atherinidae Silversides
Elongate Hardyhead Atherinosoma elongata
Spotted Hardyhead Craterocephalus mugiloides
Silver Fish Leptatherina presbyteroides
Western Hardyhead Leptatherina wallacei
Skipjack Trevally* Pseudocaranx wrighti Carangidae Jacks and Trevally
Sandy Sprat Hyperlophus vittatus Clupeidae Herrings
Goldfish Carassius auratus Cyprinidae Carps
Australian Anchovy Engraulis australis Engraulidae Anchovies
Old Wife Enoplosus armatus Enoplosidae OldWives
Western Minnow Galaxias occidentalis Galaxiidae Galaxiids
Common Silverbiddy Gerres subfasciatus Gerreidae Mojarras
Bridled Goby Arenigobius bifrenatus Gobiidae Gobies
Southern Longfin Goby Favonigobius lateralis
Bluespot Goby Pseudogobius olorum
Southern Garfish* Hyporhamphus melanochir Hemiramphidae Halfbeaks
Yelloweye Mullet Aldrichetta forsteri Mugilidae Mullets
Sea Mullet Mugil cephalus
Western Butterfish* Pentapodus vitta Nemipteridae Threadfin Breams
Smalltooth Flounder Pseudorhombus jenynsii Paralichthyidae Sand Flounders
Nightfish* Bostockia porosa Percichthyidae Temperate Perches
Western Pygmy Perch Nannoperca vittata
Estuary Cobbler Cnidoglanis macrocephalus Plotosidae Eeltail Catfish
Eastern Gambusia Gambusia holbrooki Poeciliidae Livebearers
Tailor Pomatomus saltatrix Pomatomidae Bluefishes
Mulloway* Argyrosomus japonicus Sciaenidae Drums
King George Whiting Sillaginodes punctata Sillaginidae Whitings
Southern School Whiting Sillago bassensis
Trumpeter Whiting Sillago maculata
Yellowfin Whiting Sillago schomburgkii
Western School Whiting Sillago vittata
Black Bream Acanthopagrus butcheri Sparidae Porgies
Tarwhine Rhabdosargus sarba
Yellowtail Grunter Amniataba caudavittata Terapontidae Grunters
Western Striped Grunter Pelates octolineatus
Prickly Toadfish Contusus brevicaudus Tetraodontidae Puffers
Soldier Gymnapistes marmoratus Tetrarogidae Wasp Fish