Intro to Machine Learning - UZH · • Java machine learning framework • Provides a Java library...
34
Introduction to Machine Learning
Transcript of Intro to Machine Learning - UZH · • Java machine learning framework • Provides a Java library...
Introduction to
Machine Learning
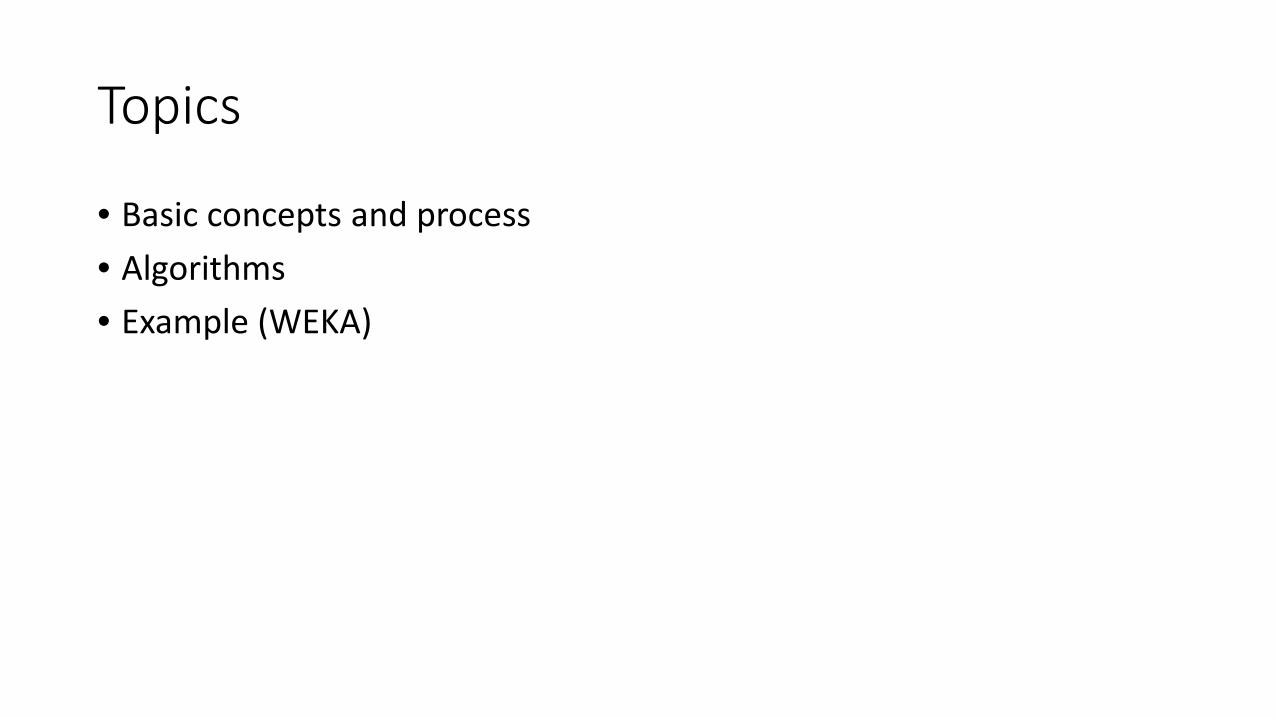
Topics
• Basic concepts and process• Algorithms• Example (WEKA)
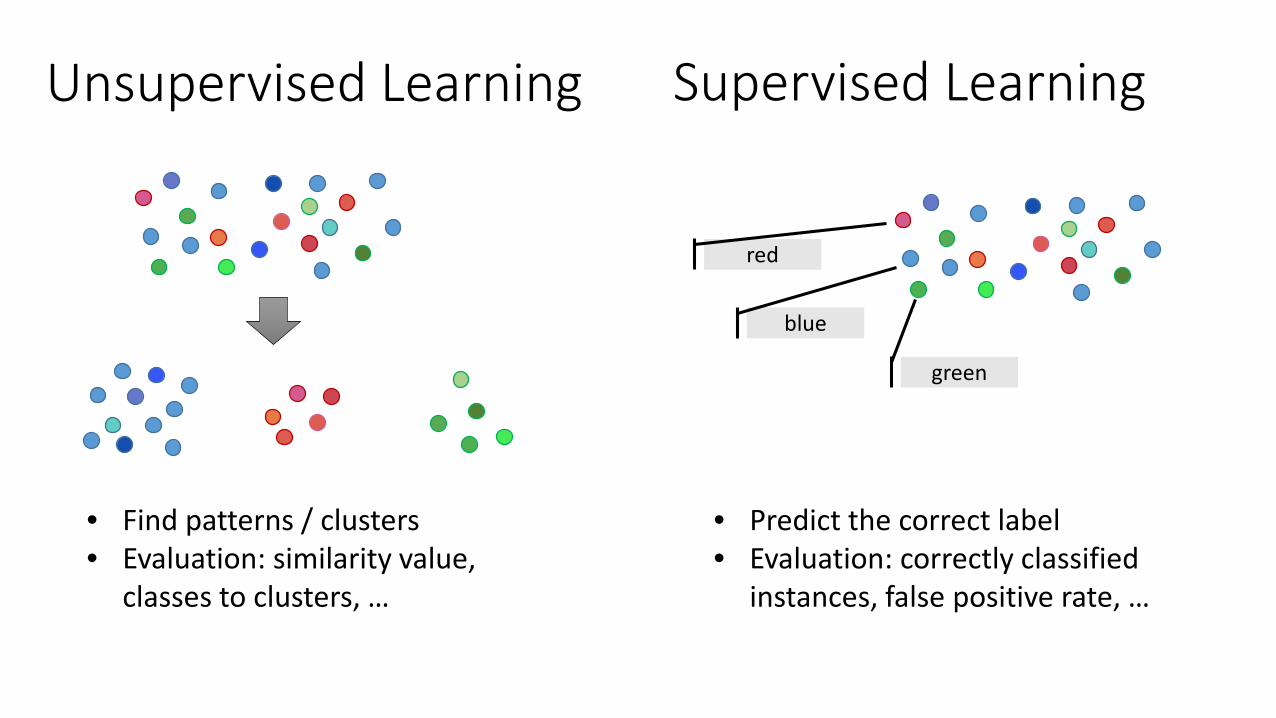
• Find patterns / clusters• Evaluation: similarity value,
classes to clusters, …
• Predict the correct label• Evaluation: correctly classified
instances, false positive rate, …
green
blue
red
Unsupervised Learning Supervised Learning
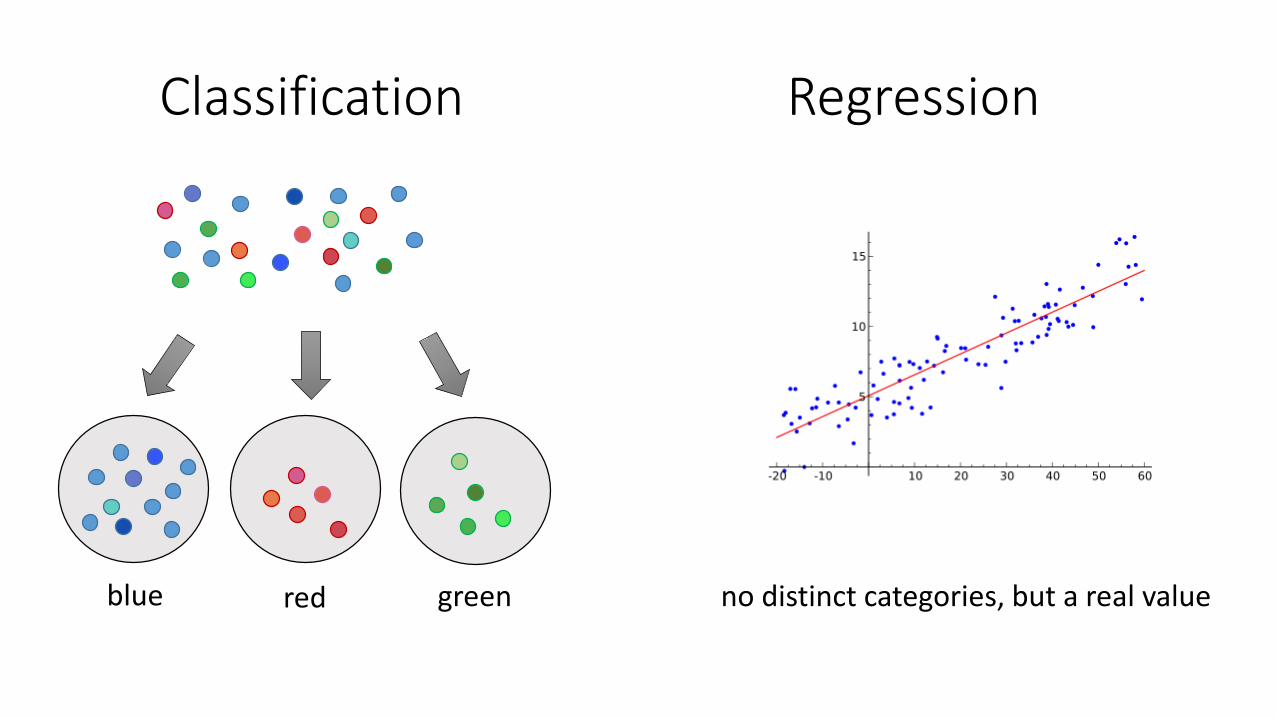
Classification Regression
blue red green no distinct categories, but a real value
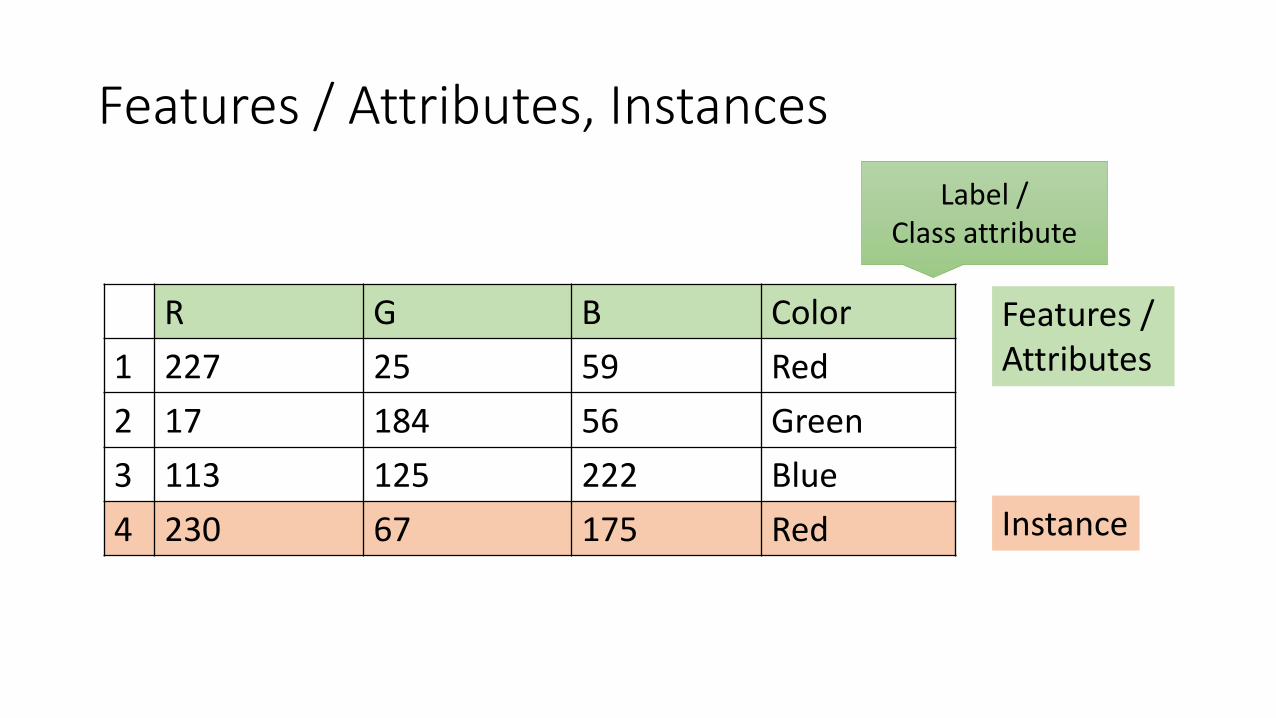
Features / Attributes, Instances
R G B Color1 227 25 59 Red2 17 184 56 Green3 113 125 222 Blue4 230 67 175 Red Instance
Features / Attributes
Label /Class attribute
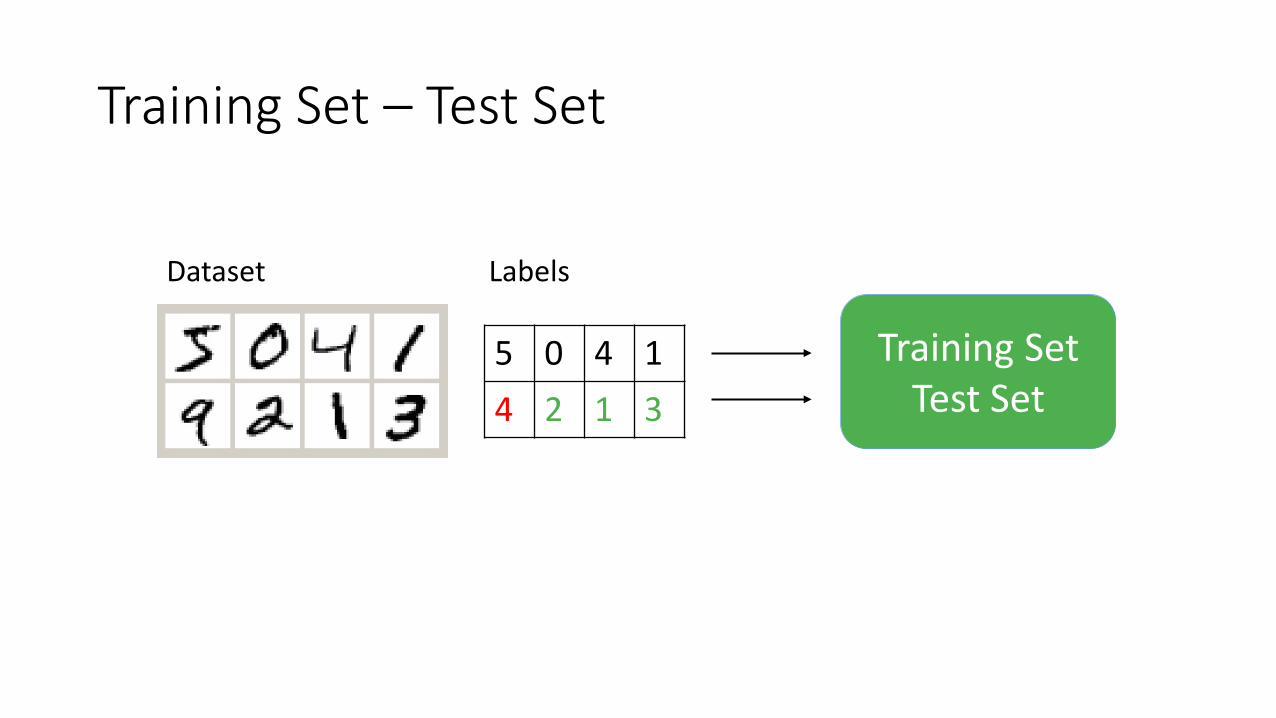
Training Set – Test Set
Training SetTest Set
5 0 4 14 2 1 3
Dataset Labels
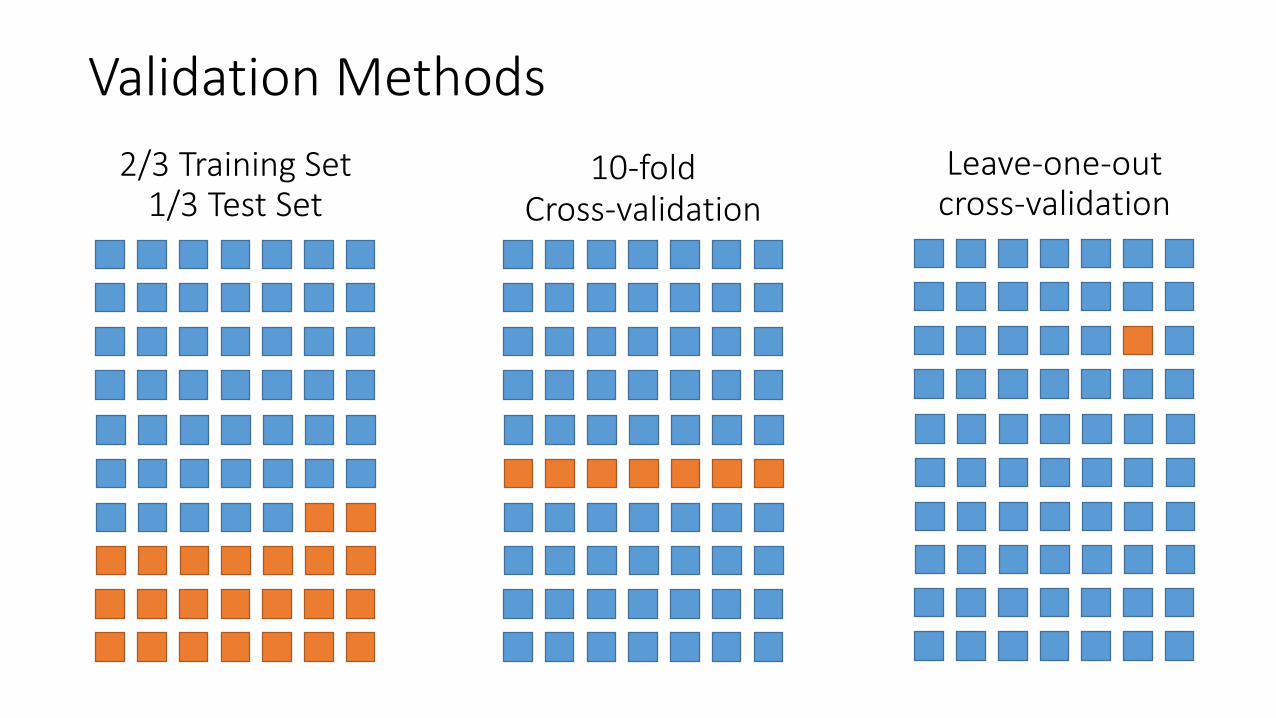
Validation Methods10-fold
Cross-validationLeave-one-out cross-validation
2/3 Training Set1/3 Test Set
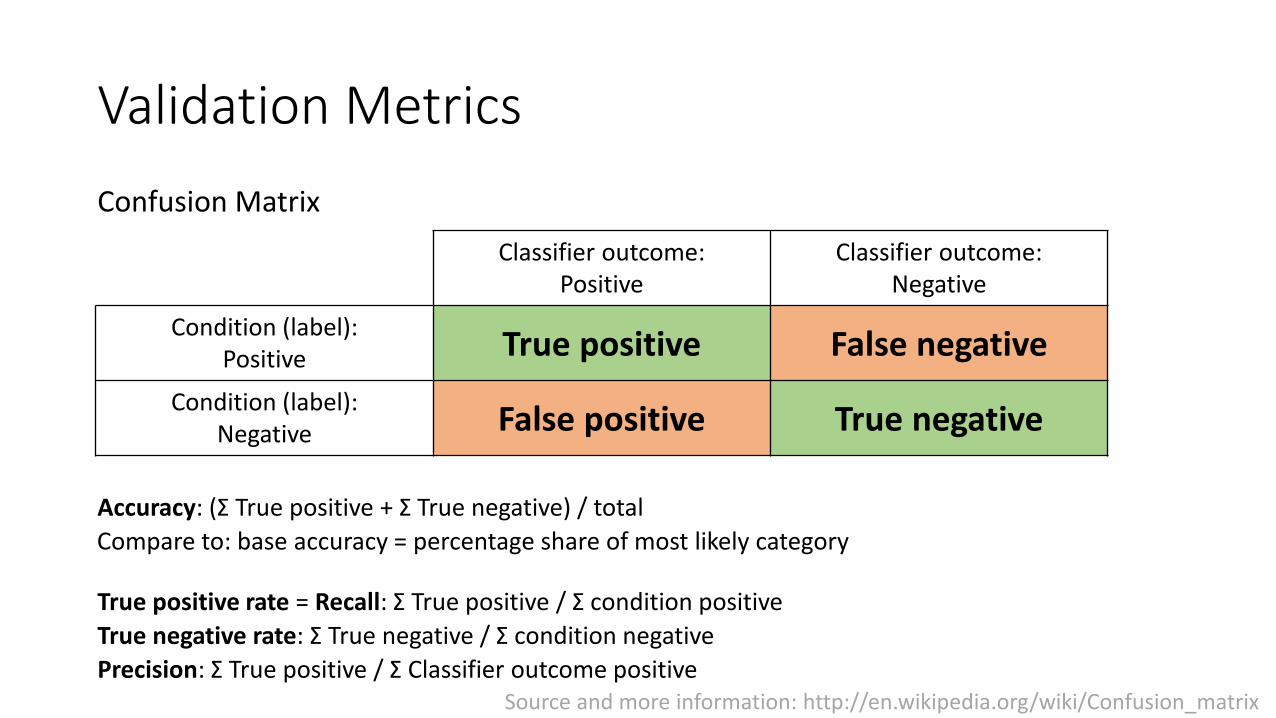
Validation Metrics
Classifier outcome:Positive
Classifier outcome:Negative
Condition (label):Positive True positive False negative
Condition (label):Negative False positive True negative
Confusion Matrix
Accuracy: (Σ True positive + Σ True negative) / total
True positive rate = Recall: Σ True positive / Σ condition positive True negative rate: Σ True negative / Σ condition negativePrecision: Σ True positive / Σ Classifier outcome positive
Compare to: base accuracy = percentage share of most likely category
Source and more information: http://en.wikipedia.org/wiki/Confusion_matrix
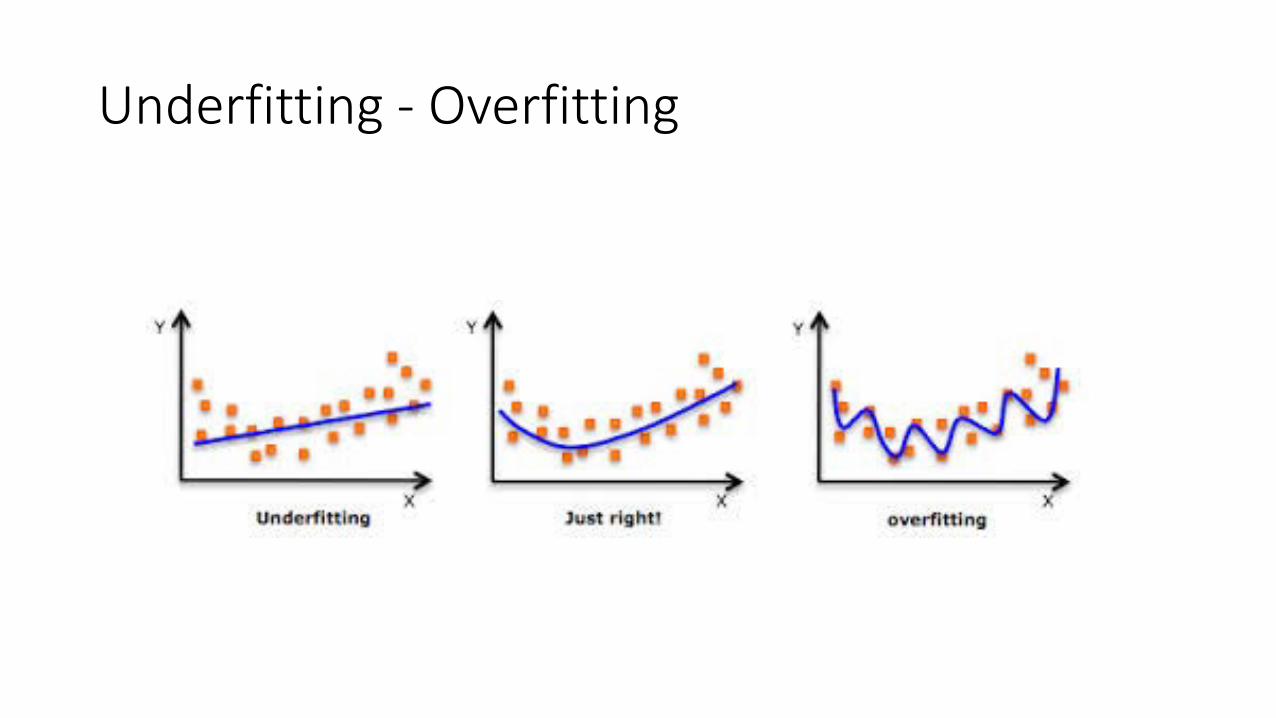
Underfitting - Overfitting
Basic Process
1. Data collection2. Feature calculation3. Feature selection4. Classification
Algorithms
• Naive Bayes• Support Vector Machine• Decision Trees
(There are many more: Neural networks, k-nearest neighbour, …)
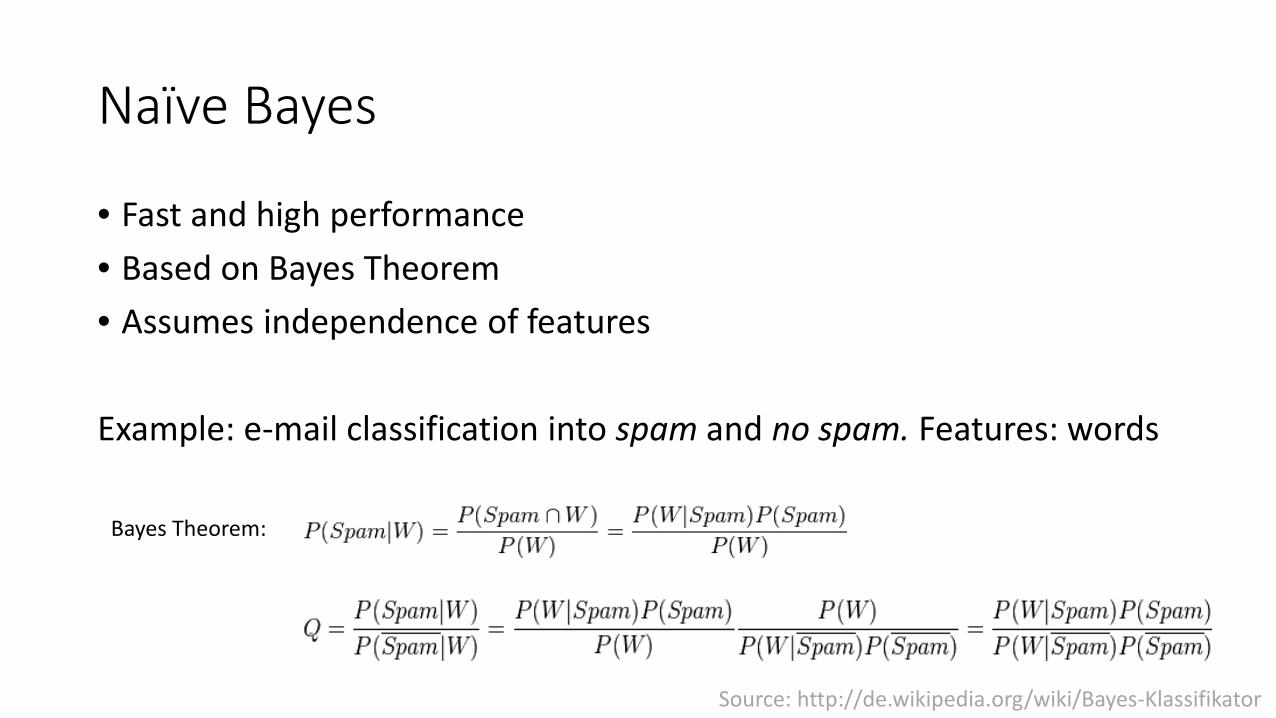
Naïve Bayes
• Fast and high performance• Based on Bayes Theorem• Assumes independence of features
Example: e-mail classification into spam and no spam. Features: words
Bayes Theorem:
Source: http://de.wikipedia.org/wiki/Bayes-Klassifikator
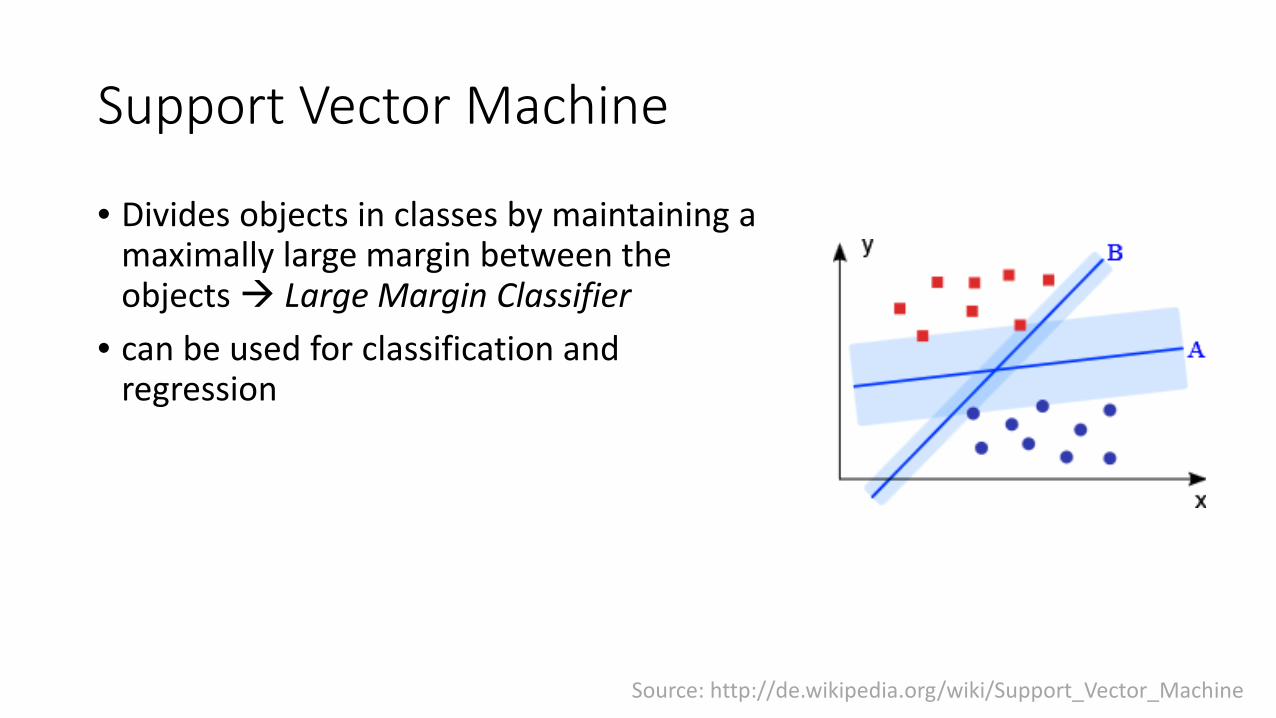
Support Vector Machine
• Divides objects in classes by maintaining a maximally large margin between theobjects Large Margin Classifier
• can be used for classification andregression
Source: http://de.wikipedia.org/wiki/Support_Vector_Machine
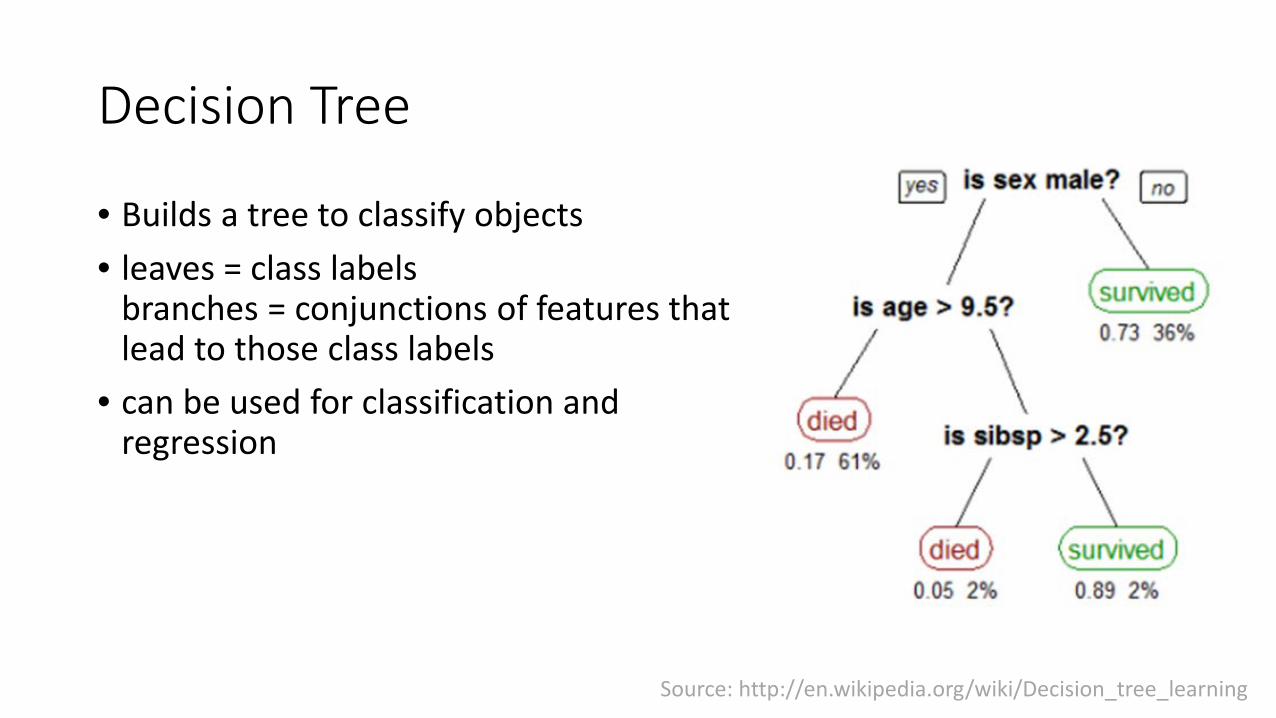
Decision Tree
• Builds a tree to classify objects• leaves = class labels
branches = conjunctions of features that lead to those class labels
• can be used for classification andregression
Source: http://en.wikipedia.org/wiki/Decision_tree_learning
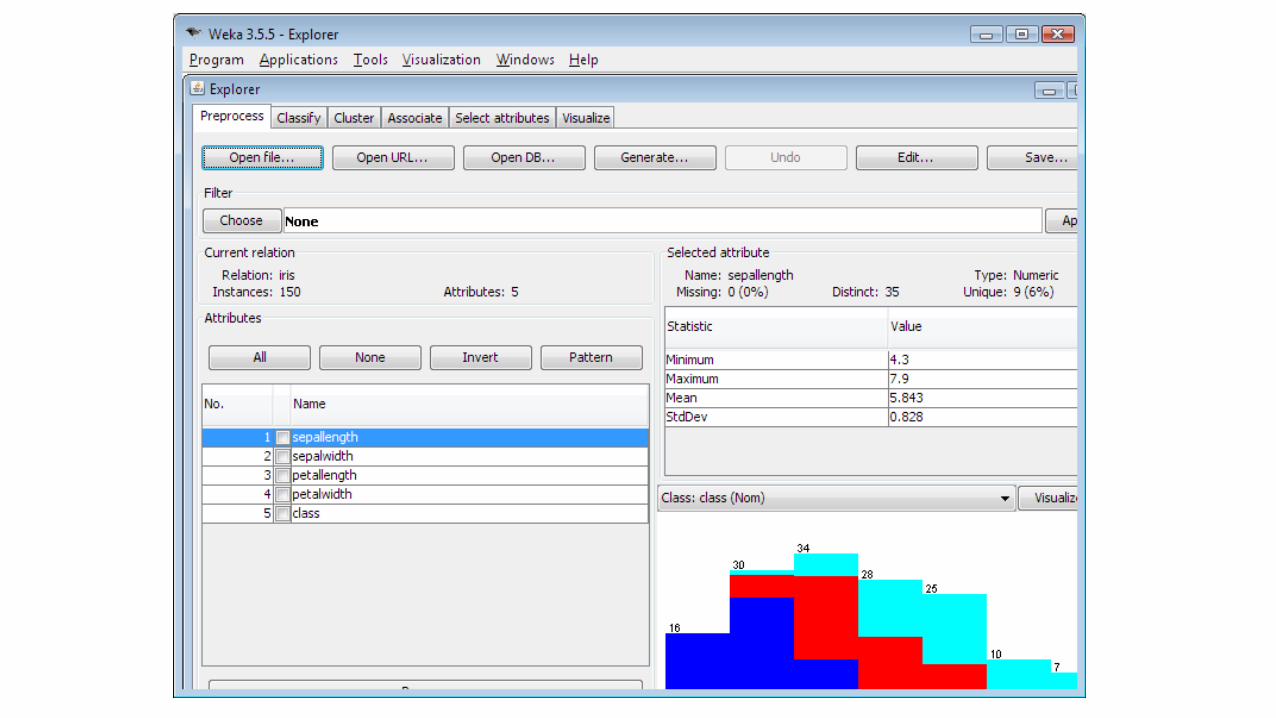
WEKA
• Java machine learning framework• Provides a Java library and a graphical user interface• Implements many preprocessing algorithms (filters) and classifiers• Filters: attribute selection, transforming and combining attributes,
discretization, normalization, …• Classifiers: Support Vector Machine (SMO), Decision Tree (J48), Naive
Bayes, …
Source: http://www.cs.waikato.ac.nz/ml/weka/
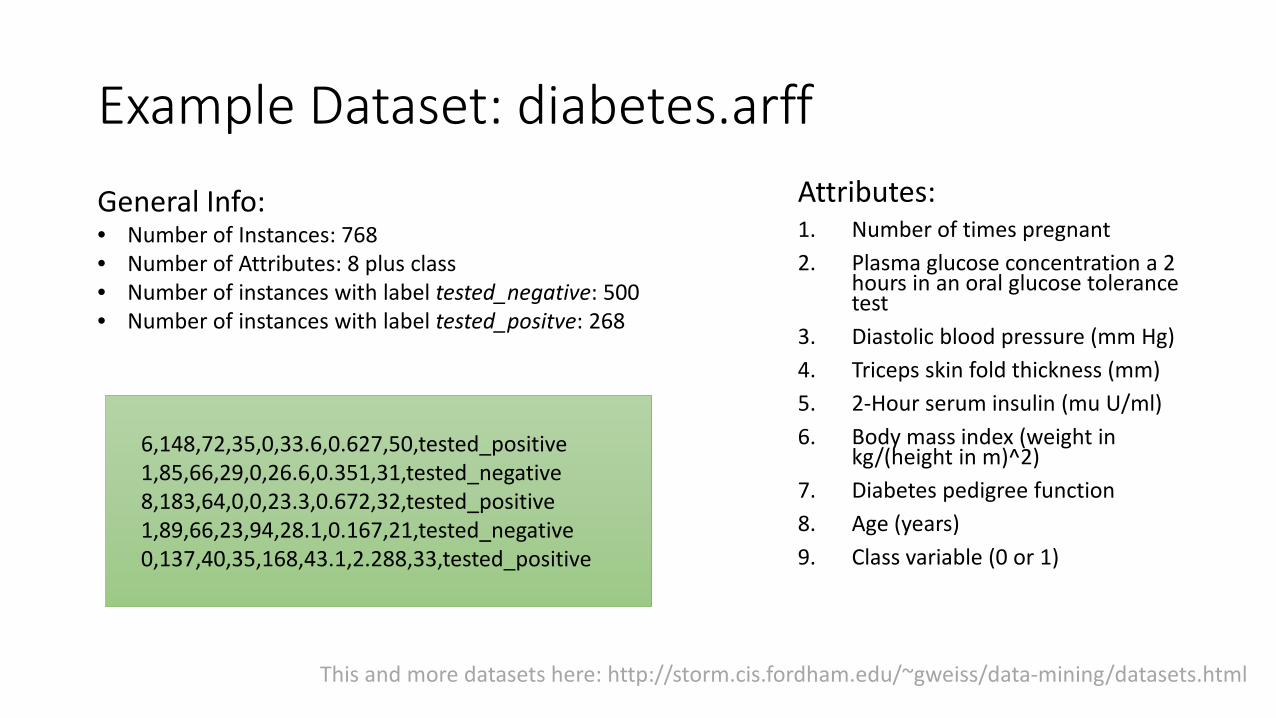
Example Dataset: diabetes.arffAttributes:1. Number of times pregnant2. Plasma glucose concentration a 2
hours in an oral glucose tolerancetest
3. Diastolic blood pressure (mm Hg)4. Triceps skin fold thickness (mm)5. 2-Hour serum insulin (mu U/ml)6. Body mass index (weight in
kg/(height in m)^2)7. Diabetes pedigree function8. Age (years)9. Class variable (0 or 1)
General Info:• Number of Instances: 768• Number of Attributes: 8 plus class• Number of instances with label tested_negative: 500• Number of instances with label tested_positve: 268
6,148,72,35,0,33.6,0.627,50,tested_positive1,85,66,29,0,26.6,0.351,31,tested_negative8,183,64,0,0,23.3,0.672,32,tested_positive1,89,66,23,94,28.1,0.167,21,tested_negative0,137,40,35,168,43.1,2.288,33,tested_positive
This and more datasets here: http://storm.cis.fordham.edu/~gweiss/data-mining/datasets.html
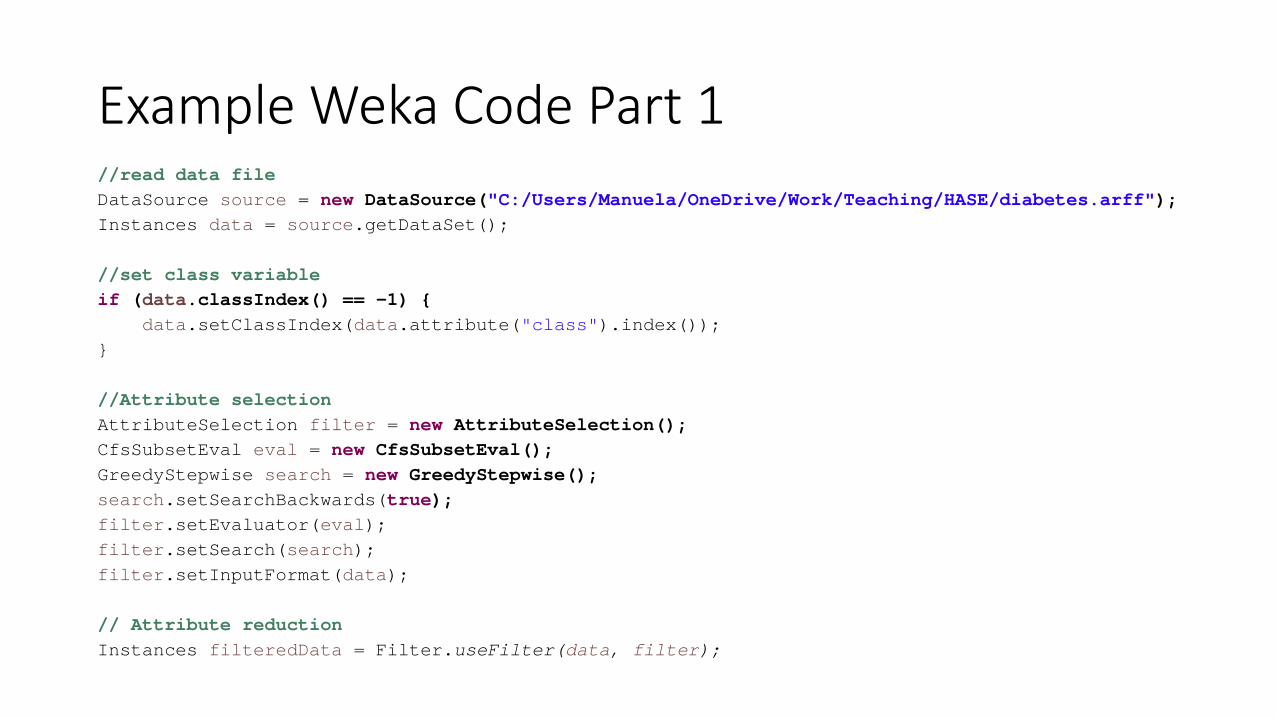
Example Weka Code Part 1//read data fileDataSource source = new DataSource("C:/Users/Manuela/OneDrive/Work/Teaching/HASE/diabetes.arff");Instances data = source.getDataSet();
//set class variableif (data.classIndex() == -1) {
data.setClassIndex(data.attribute("class").index());}
//Attribute selectionAttributeSelection filter = new AttributeSelection(); CfsSubsetEval eval = new CfsSubsetEval();GreedyStepwise search = new GreedyStepwise();search.setSearchBackwards(true);filter.setEvaluator(eval);filter.setSearch(search);filter.setInputFormat(data);
// Attribute reductionInstances filteredData = Filter.useFilter(data, filter);
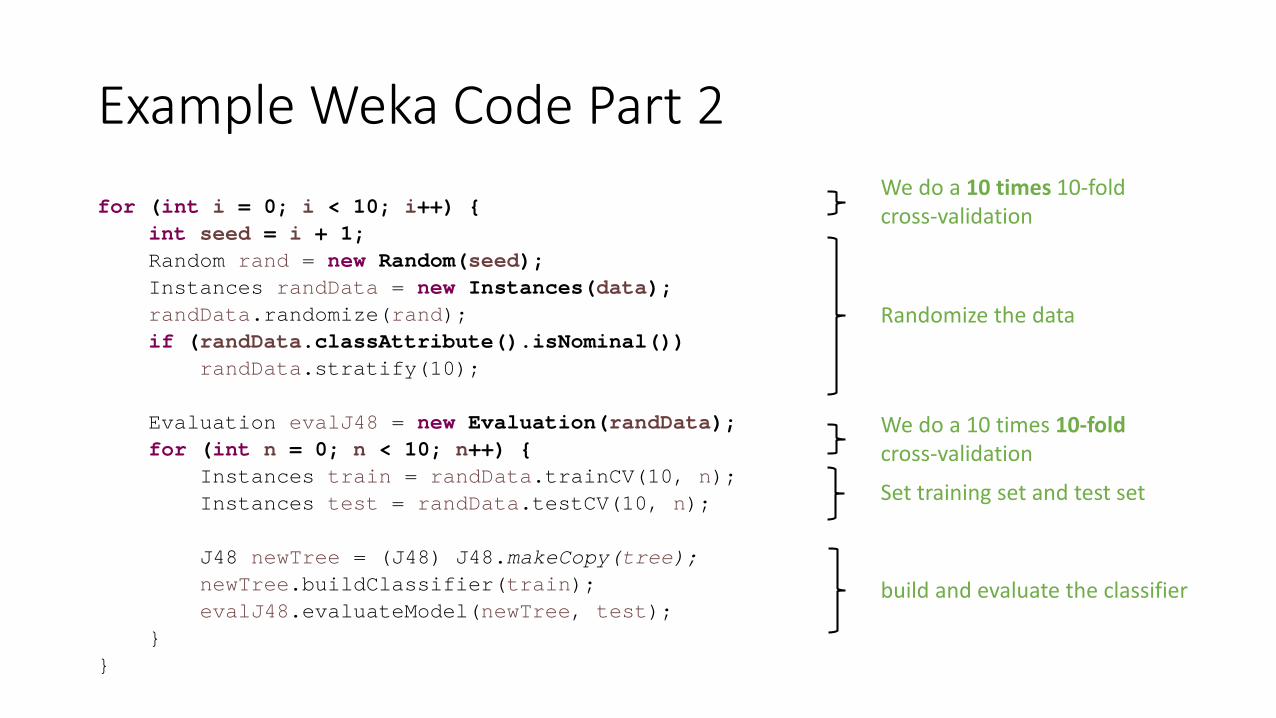
Example Weka Code Part 2for (int i = 0; i < 10; i++) {
int seed = i + 1;Random rand = new Random(seed);Instances randData = new Instances(data);randData.randomize(rand);if (randData.classAttribute().isNominal())
randData.stratify(10);
Evaluation evalJ48 = new Evaluation(randData);for (int n = 0; n < 10; n++) {
Instances train = randData.trainCV(10, n);Instances test = randData.testCV(10, n);
J48 newTree = (J48) J48.makeCopy(tree);newTree.buildClassifier(train);evalJ48.evaluateModel(newTree, test);
}}
Randomize the data
We do a 10 times 10-fold cross-validation
We do a 10 times 10-foldcross-validation
Set training set and test set
build and evaluate the classifier

Interpretation of ResultsClassifier Features Accuracy (%)
J48 All 74.49
J48 Selected 74.38
SMO All 76.81
SMO Selected 76.95
Naïve Bayes All 75.76
Naïve Bayes Selected 77.06
Selected Features:• Plasma glucose concentration a 2 hours in an oral glucose tolerance test• Body mass index• Diabetes pedigree function (synthesis of family history concerning diabetes)• Age
Base accuracy: 65.1 %
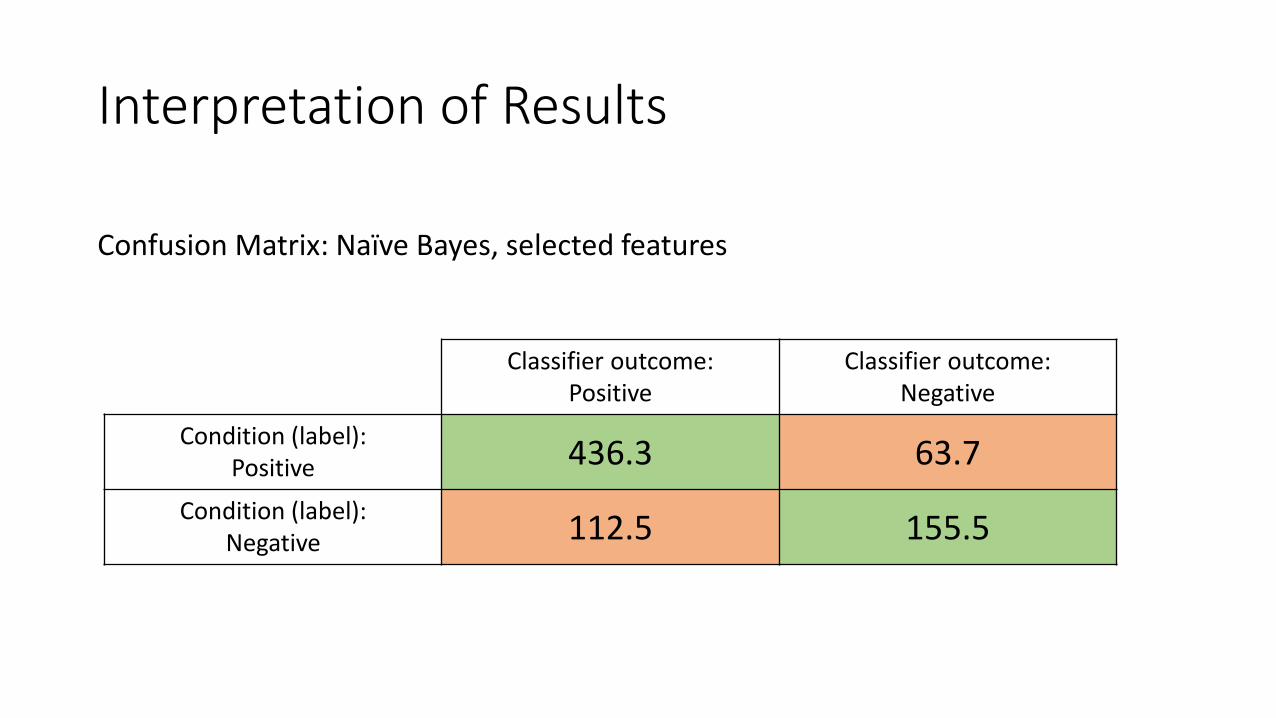
Interpretation of Results
Classifier outcome:Positive
Classifier outcome:Negative
Condition (label):Positive 436.3 63.7
Condition (label):Negative 112.5 155.5
Confusion Matrix: Naïve Bayes, selected features
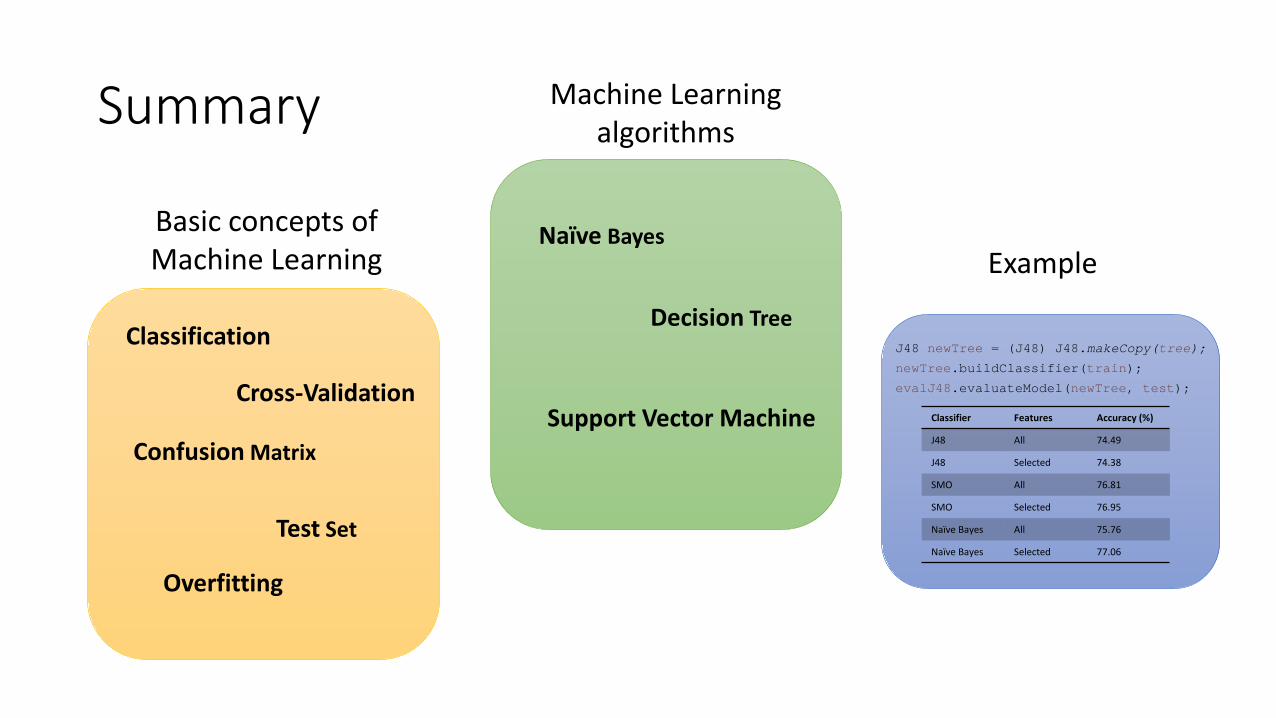
Summary
Basic concepts ofMachine Learning
Classification
Confusion Matrix
Naïve Bayes
Test Set
Overfitting
Machine Learning algorithms
Cross-Validation
Decision Tree
Support Vector Machine
Example
J48 newTree = (J48) J48.makeCopy(tree);
newTree.buildClassifier(train);
evalJ48.evaluateModel(newTree, test);
Classifier Features Accuracy (%)
J48 All 74.49
J48 Selected 74.38
SMO All 76.81
SMO Selected 76.95
Naïve Bayes All 75.76
Naïve Bayes Selected 77.06
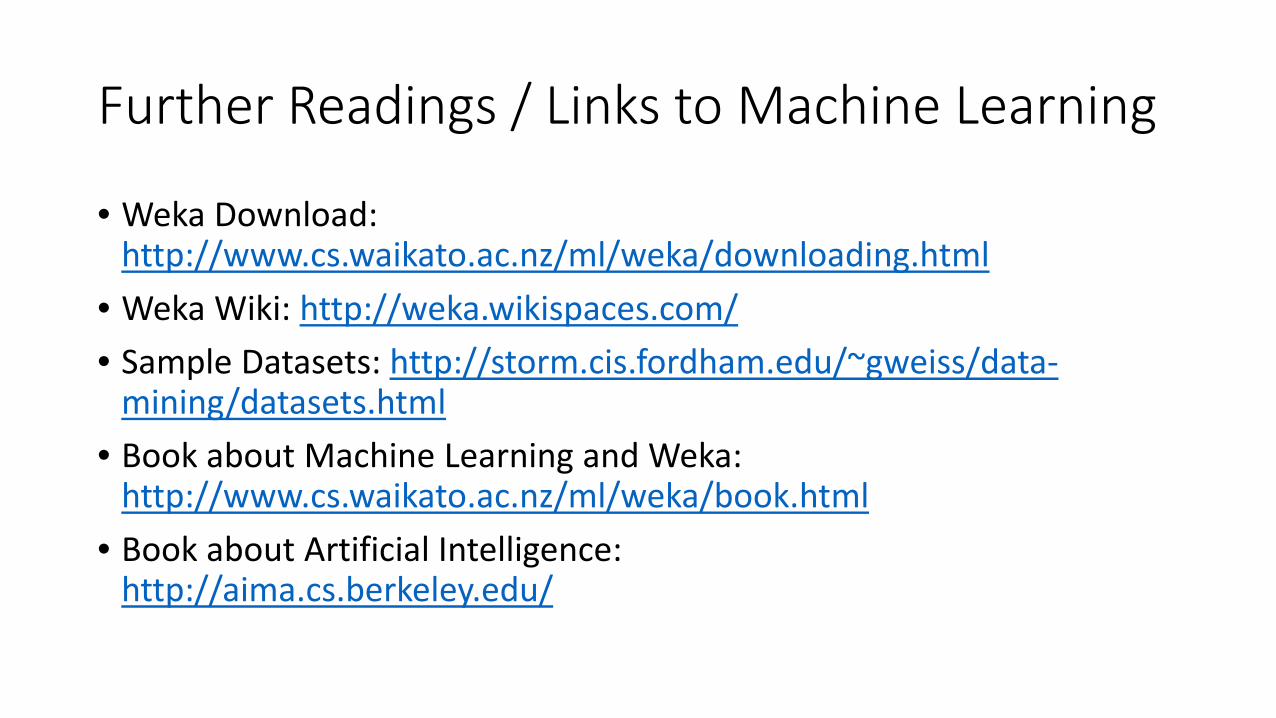
Further Readings / Links to Machine Learning
• Weka Download: http://www.cs.waikato.ac.nz/ml/weka/downloading.html
• Weka Wiki: http://weka.wikispaces.com/• Sample Datasets: http://storm.cis.fordham.edu/~gweiss/data-
mining/datasets.html• Book about Machine Learning and Weka:
http://www.cs.waikato.ac.nz/ml/weka/book.html• Book about Artificial Intelligence:
http://aima.cs.berkeley.edu/
Datasets:
«Developer Activity, Productivty, Emotion and Interruption Data»
«Biometric Data»
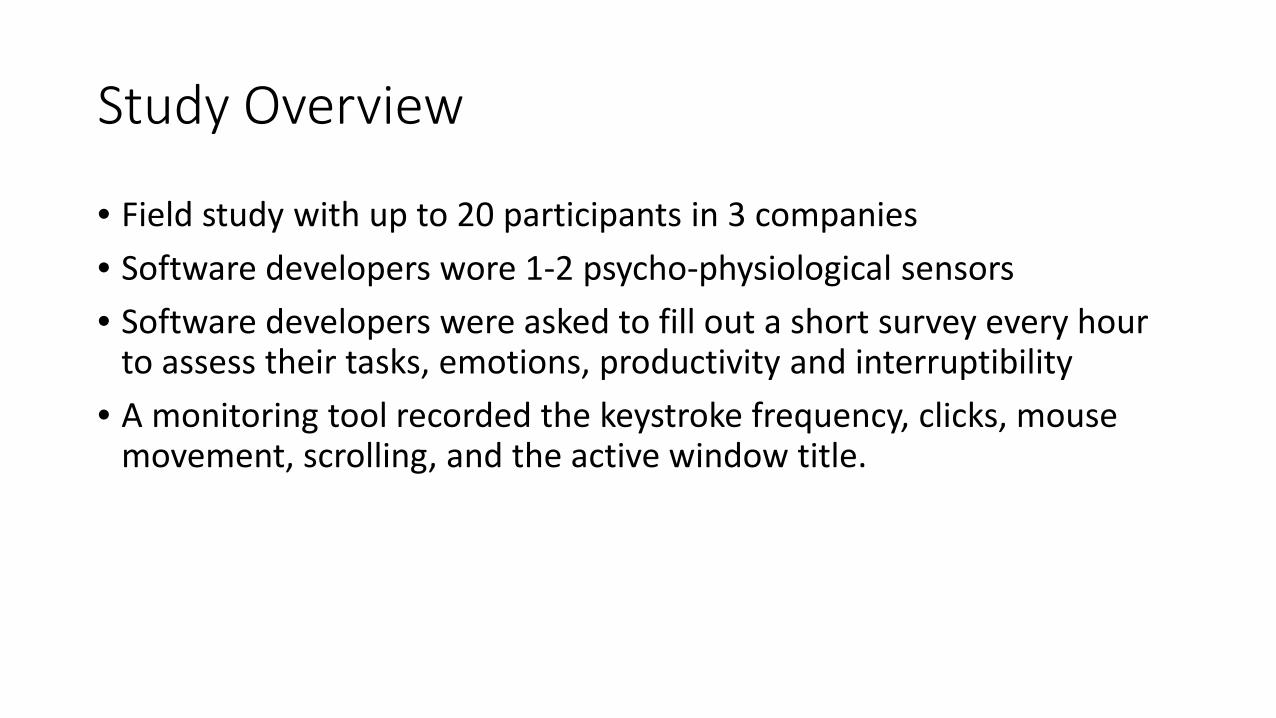
Study Overview
• Field study with up to 20 participants in 3 companies• Software developers wore 1-2 psycho-physiological sensors• Software developers were asked to fill out a short survey every hour
to assess their tasks, emotions, productivity and interruptibility• A monitoring tool recorded the keystroke frequency, clicks, mouse
movement, scrolling, and the active window title.
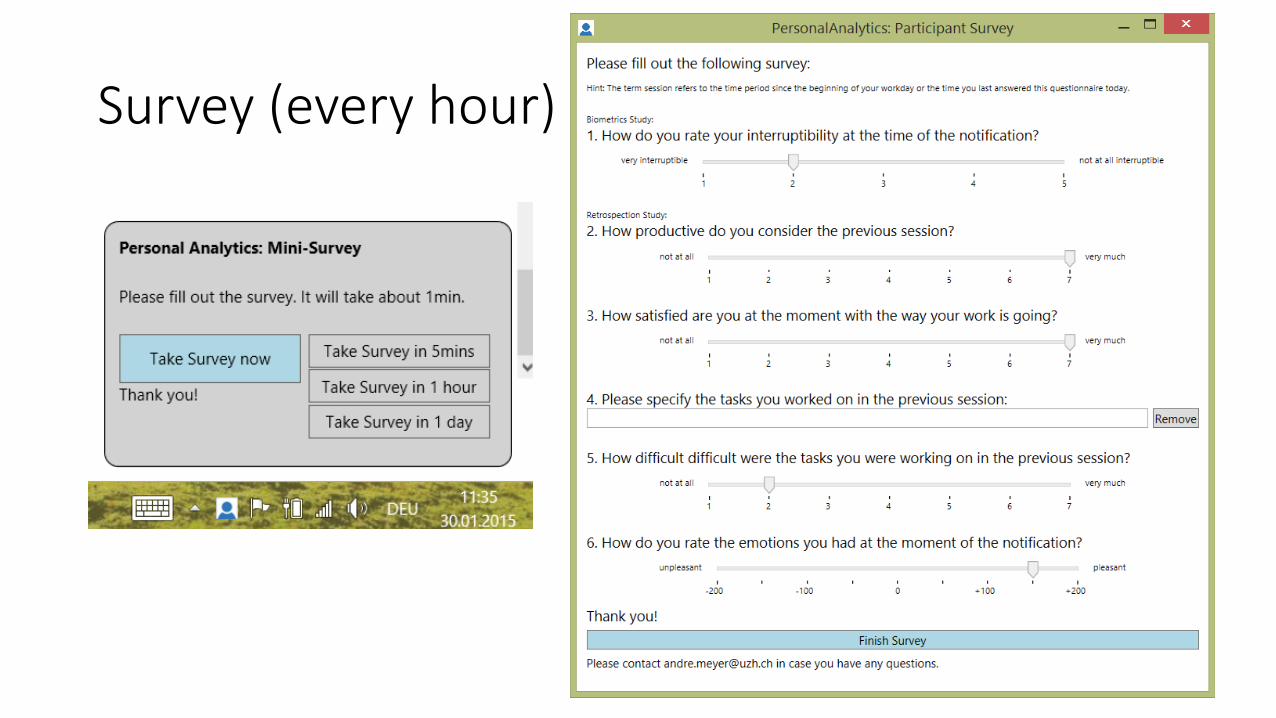
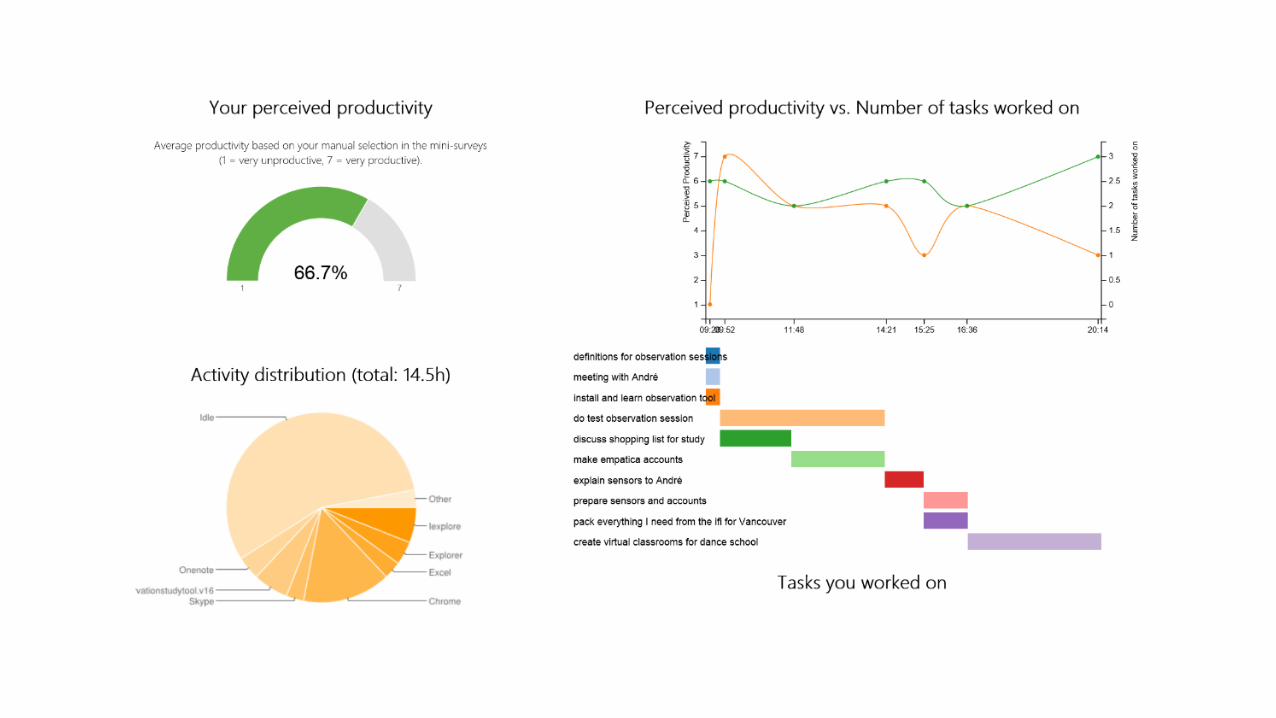
Survey (every hour)
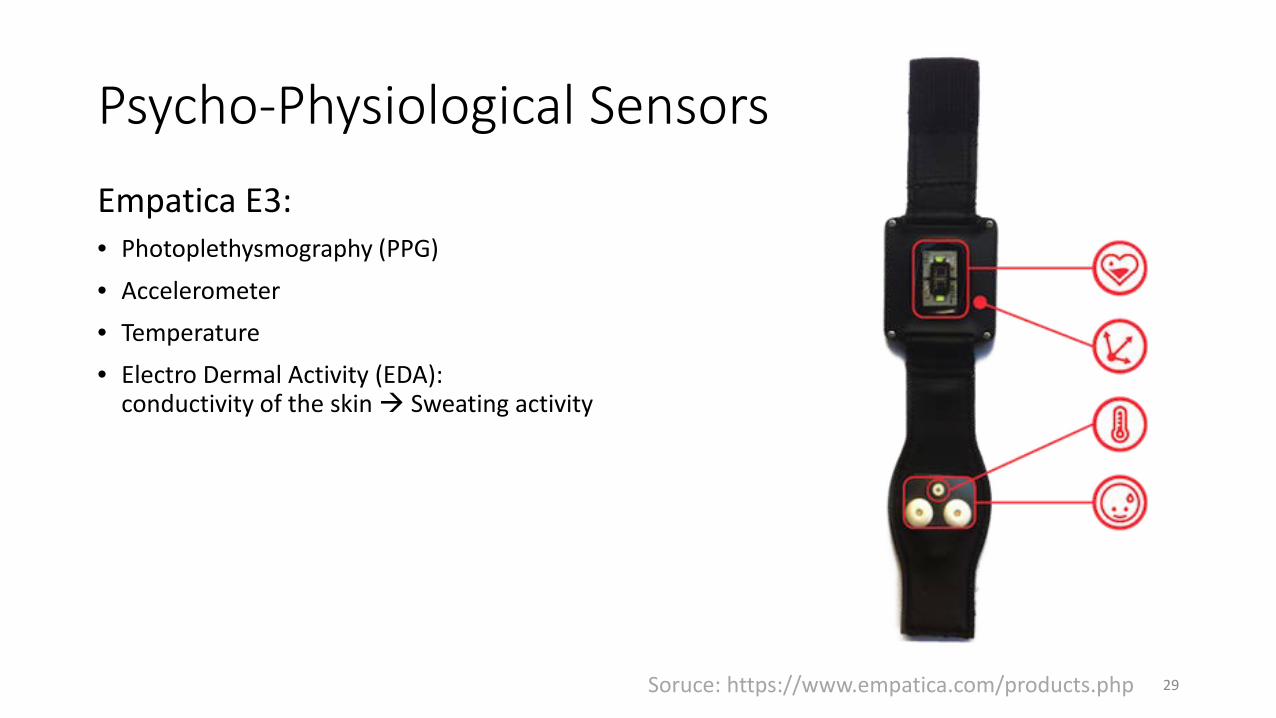
Psycho-Physiological SensorsEmpatica E3:• Photoplethysmography (PPG)
• Accelerometer• Temperature• Electro Dermal Activity (EDA):
conductivity of the skin Sweating activity
29Soruce: https://www.empatica.com/products.php
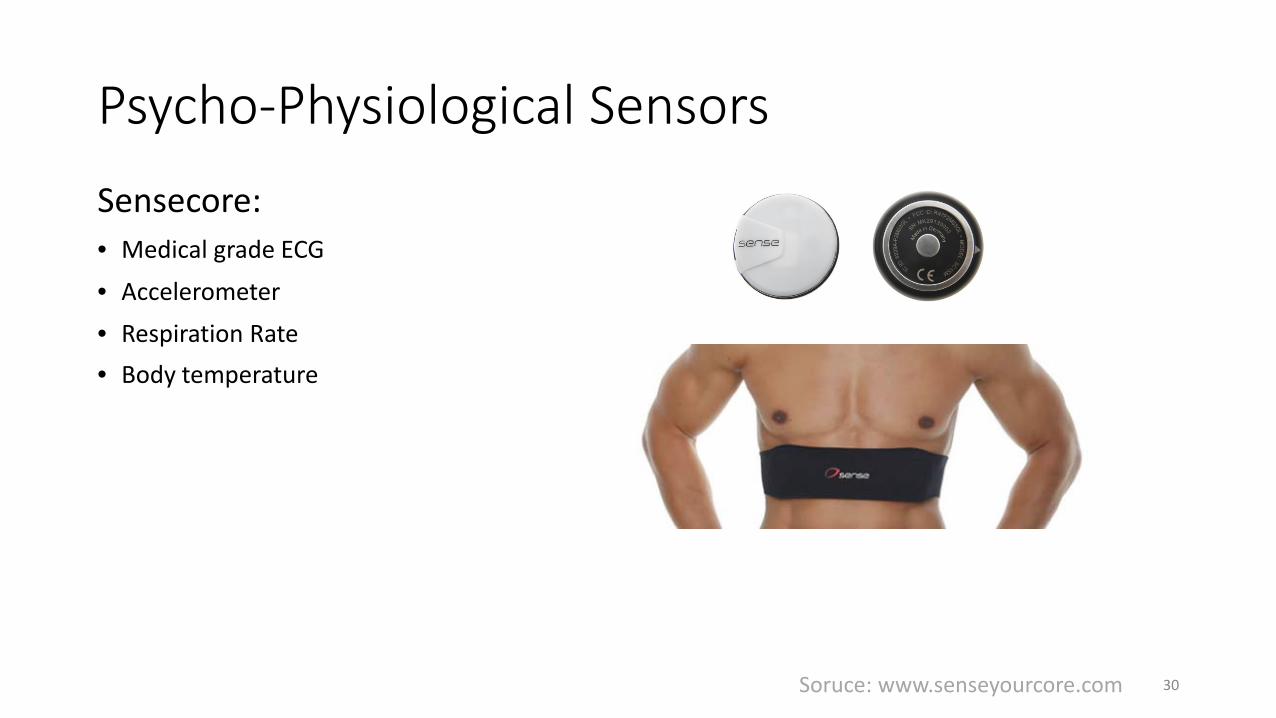
Psycho-Physiological SensorsSensecore:• Medical grade ECG
• Accelerometer
• Respiration Rate• Body temperature
30Soruce: www.senseyourcore.com
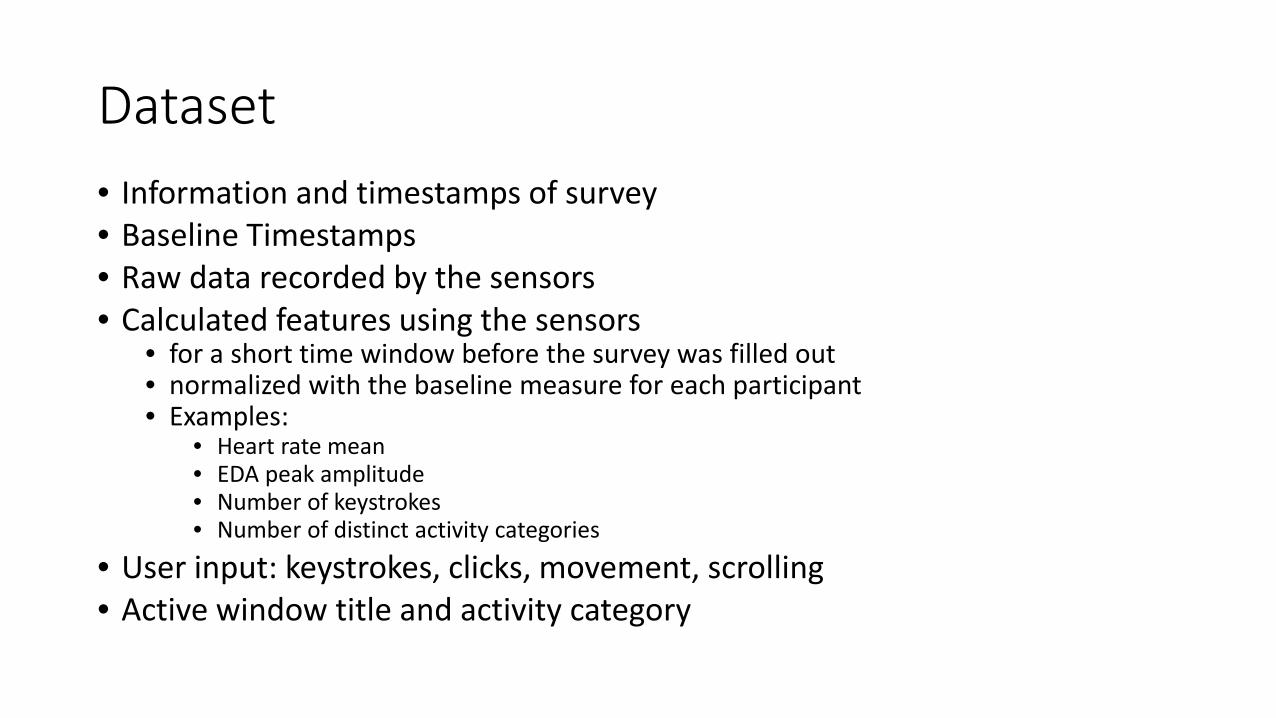
Dataset• Information and timestamps of survey• Baseline Timestamps• Raw data recorded by the sensors• Calculated features using the sensors
• for a short time window before the survey was filled out• normalized with the baseline measure for each participant• Examples:
• Heart rate mean• EDA peak amplitude• Number of keystrokes• Number of distinct activity categories
• User input: keystrokes, clicks, movement, scrolling• Active window title and activity category
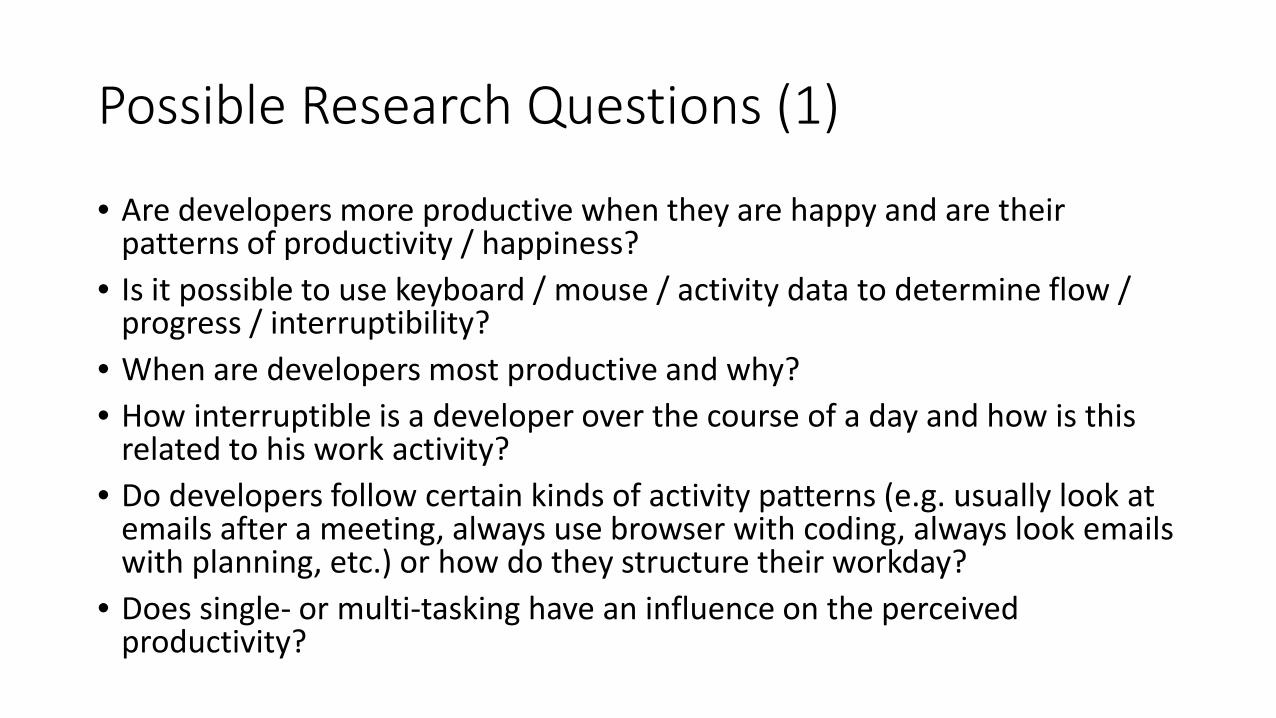
Possible Research Questions (1)
• Are developers more productive when they are happy and are their patterns of productivity / happiness?
• Is it possible to use keyboard / mouse / activity data to determine flow / progress / interruptibility?
• When are developers most productive and why?• How interruptible is a developer over the course of a day and how is this
related to his work activity?• Do developers follow certain kinds of activity patterns (e.g. usually look at
emails after a meeting, always use browser with coding, always look emails with planning, etc.) or how do they structure their workday?
• Does single- or multi-tasking have an influence on the perceived productivity?
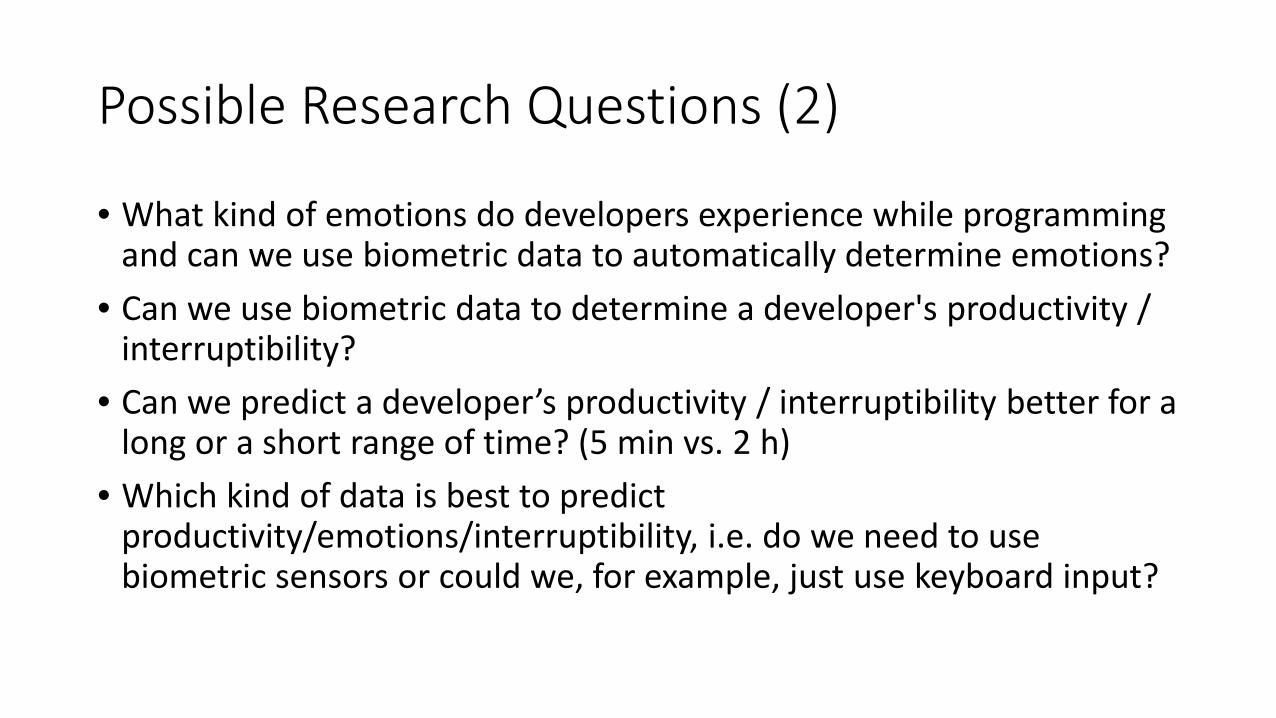
Possible Research Questions (2)
• What kind of emotions do developers experience while programming and can we use biometric data to automatically determine emotions?
• Can we use biometric data to determine a developer's productivity / interruptibility?
• Can we predict a developer’s productivity / interruptibility better for a long or a short range of time? (5 min vs. 2 h)
• Which kind of data is best to predict productivity/emotions/interruptibility, i.e. do we need to use biometric sensors or could we, for example, just use keyboard input?
Image Sources
Title Page: http://www.enterprisetech.com/2014/02/11/netflix-speeds-machine-learning-amazon-gpus/Regression: http://www.digplanet.com/wiki/Linear_regressionHandwritten Letters: http://yann.lecun.com/exdb/mnist/Overfitting: http://pingax.com/regularization-implementation-r/Naïve Bayes Formulas: http://de.wikipedia.org/wiki/Bayes-KlassifikatorSupport Vector Machine: http://de.wikipedia.org/wiki/Support_Vector_MachineDecision Tree: http://en.wikipedia.org/wiki/Decision_tree_learningWeka Logo: http://www.cs.waikato.ac.nz/ml/weka/Weka Screenshot: http://commons.wikimedia.org/wiki/File:Weka-3.5.5.pngEmpatica: https://www.empatica.com/products.phpSensecore: https://www.senseyourcore.com