Development of High Throughput Plant Phenotyping Facilities in Aberystywth
date post
20-Dec-2015Category
view
213download
0
Intro to Ecological Economics-human dev
Growth Development
Growth=increase in throughput-quantitative
Development=qualitative improvement

Intro to Ecological Economics-population
Growth Development
Demographic transition Theory

Intro to Ecological Economics-population

Intro to Ecological Economics-forest succession
Growth Development
Reorganization Aggredation Transition Steady-state (mature)

We hear:“There is no conflict between economic
growth and environmental protection!”

World GDP and CO2
$1
$10
$100
$1,000
$10,000
$100,000
100010501100115012001250130013501400145015001550160016501700175018001850190019502000
World GDP Billions US$$
250
270
290
310
330
350
370
ATMOSPHERIC CO2
World GDPCO2 level


60 Million yrs of CO2

CLIMATE DAMAGE

CLIMATE DAMAGE

ESA Listings and GDP
0
200
400
600
800
1000
1200
1400
1973 1980 1990 2001
$10
$9
$8
$7
$6
$5
$4
$3
R2 = 98.4
Source: The Wildlife Society Technical Review 2003-1.

Endangerment CausesUrbanization
Agriculture
Water diversions (e.g., reservoirs)
Recreation, tourism development
Pollution
Domestic livestock, ranching
247
205
160
148
143
136
Czech et al. 2000. Bioscience 50(7):593-601.

Causes (cont.)Mineral, gas, oil extraction
Non-native species
Harvest
Modified fire regimes
Road construction/maintenance
Industrial development
134
115
101
83
83
81
Czech et al. 2000. Bioscience 50(7):593-601.

Time
GN
PK
Natural capital allocated to human economy
Natural capital allocated to wildlife
Czech, B. 2000. Economic growth as the limiting factor for wildlife conservation. Wildlife Society Bulletin 28(1):4-14.

Natural Capital
“We treat the earth like a business in liquidation.”
Herman Daly
Opportunity cost. Loss is not counted.

K
Economic Carrying Capacity(“Plimsoll line”)
GNP
Time
r-selection
K-selection
(OVERSHOOT)

K and r-selected Economies
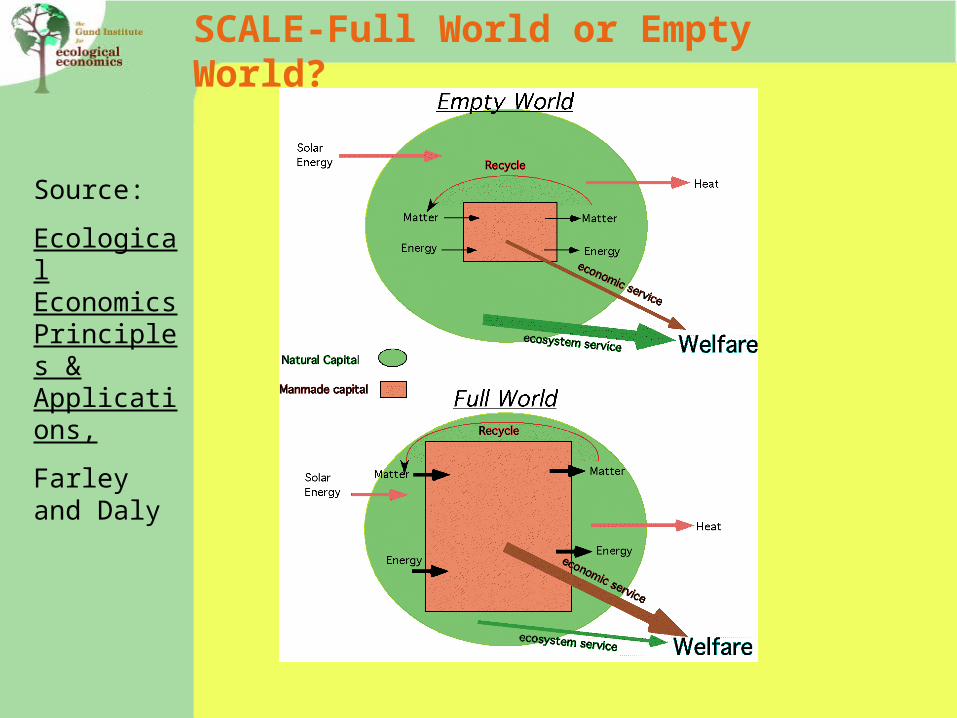
SCALE-Full World or Empty World?
Source:
Ecological Economics Principles & Applications,
Farley and Daly

GG
P
K
Human economy
Economy of nature
We Might Ask

KTGNP
Natural capital allocated to human economy
Natural capital allocated to non-human economy
X natural capital allocable
Time
KU
Natural Capital Allocation Revisited

Intro to Ecological Economics
Entropy=disorder, randomness2nd Law: entropy always increases
ECONOMY
(waste)
LOW ENTROPY HIGH ENTROPY
(dissipated)

Intro to Ecological Economics
WHAT IS ANTI-ENTROPIC?
ECONOMY
(waste)
LOW ENTROPY HIGH ENTROPY

Distribution-Grow out of poverty?Poverty rate vs. GDP per Capita (1996$)
$10,000
$15,000
$20,000
$25,000
$30,000
$35,000
1959 19611963 19651967 19691971 19731975 19771979 19811983 19851987 19891991 19931995 19971999 2001
8%
10%
12%
14%
16%
18%
20%
per capita GDP (1996$) poverty rate

ALLOCATION
Adam Smith