Intro to Data Analytics
73
-
Upload
lexi-sydow -
Category
Data & Analytics
-
view
61 -
download
1
Transcript of Intro to Data Analytics


Raise your hand at any point
Tweet us your questions: #IntroToData
@peaziesocial@collcampus
GOOD EVENING
I AM LEXI SYDOWI am in charge of data & insights at . But more importantly I am a data enthusiast, startup fanatic, artist, dancer and traveler.

In God we trust. All others must bring data. - Robert Hayden
There are no facts, only interpretations. - Nietzsche
WHAT DO YOU KNOW ABOUT DATA?

2,500,000,000,000,000,0002.5 Quintillion Bytes of Data are created each day

WOAH.

LET’S THINK OF IT IN TERMS OF
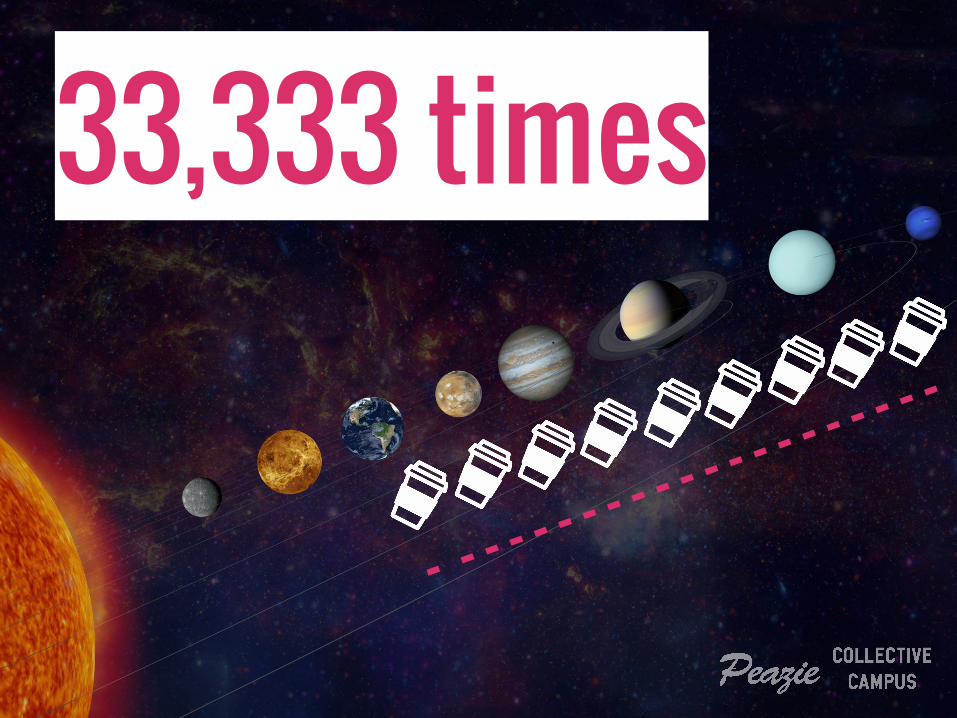
33,333 times
- - - - - - - - - - - - -
- - - - - - - -

MASSIVE.

90%Data created in the last 2 years
40,000Googles every second
204 MILLION Emails are sent every hour

That’s why analytics are so important

But don’t worry, we’re looking at the micro level.

LET ME TELL YOU A STORYJourney to loving data

WHERE DID THIS ALL START?
The homeland
The Residence
- - - - - - - - - - - - - - - - - - - - - - -

A NATURAL NEED

FROM GUESS WORK TO DEFENSIBLE FINDINGS

100% ALL NATURAL

WHAT IS DATA ANALYTICS?Let’s start with some examples

Data Analytics is taking collections of information, deriving insights and provoking action.
THIS ACTION CAN BE:
● Change in marketing channel● Prioritisation of product changes● Documentation for client services● Business model pivot

Female, 22 Carpenter3 hours on email
Male, 65GrandpaFacebook user
Male, 43Teacher1 hour Twitter
INFORMATION
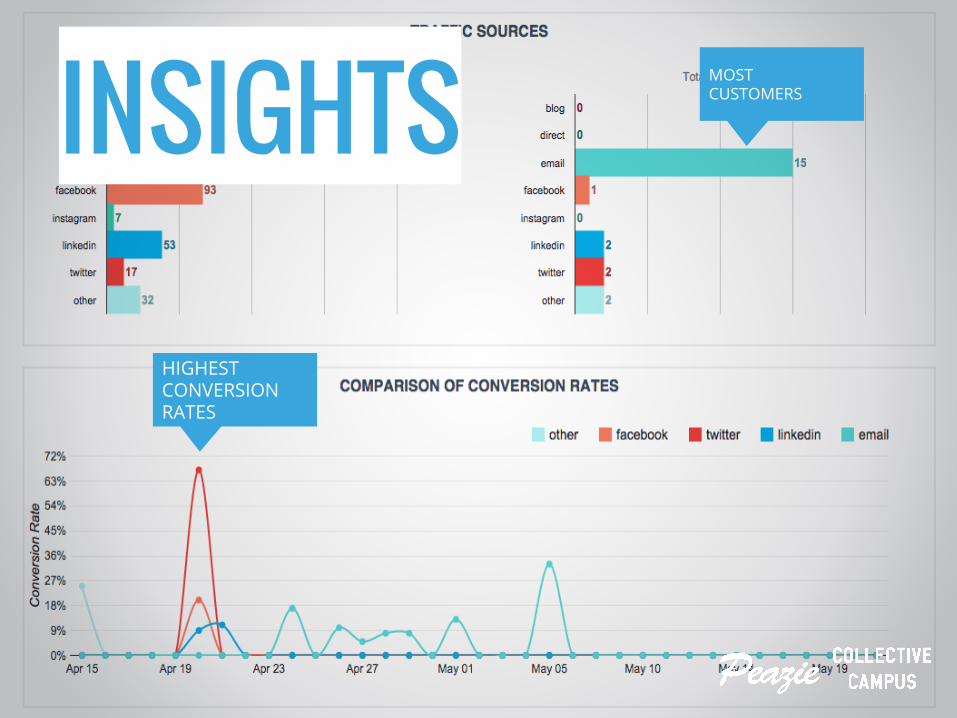
HIGHEST CONVERSION RATES
MOST CUSTOMERSINSIGHTS

ACTION m
EXAMPLES OF DATA

Data on your daily habits to assess for improvements and adjust actions next day

LET’S LOOK AT DATA IN THIS ROOM
Name Gender Personal Contact?
Personal Email? Date Created Time Created
Name Email Time Created
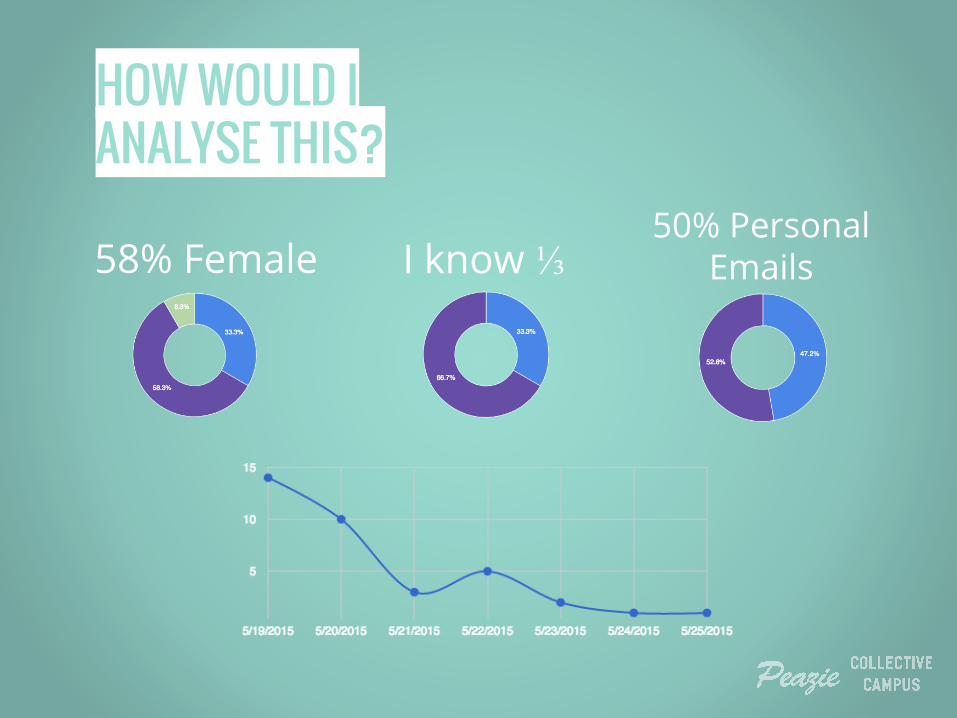
HOW WOULD I ANALYSE THIS?
58% Female I know ⅓ 50% Personal
Emails

BUT WHAT DOES THIS MEAN?

WHAT ACTION WOULD I TAKE?
1) Change Ad Imagery to cater to women or to attract more men
2) Content - business & personal examples
3) Leverage Personal Networks
4) Leverage EDM’s from partners
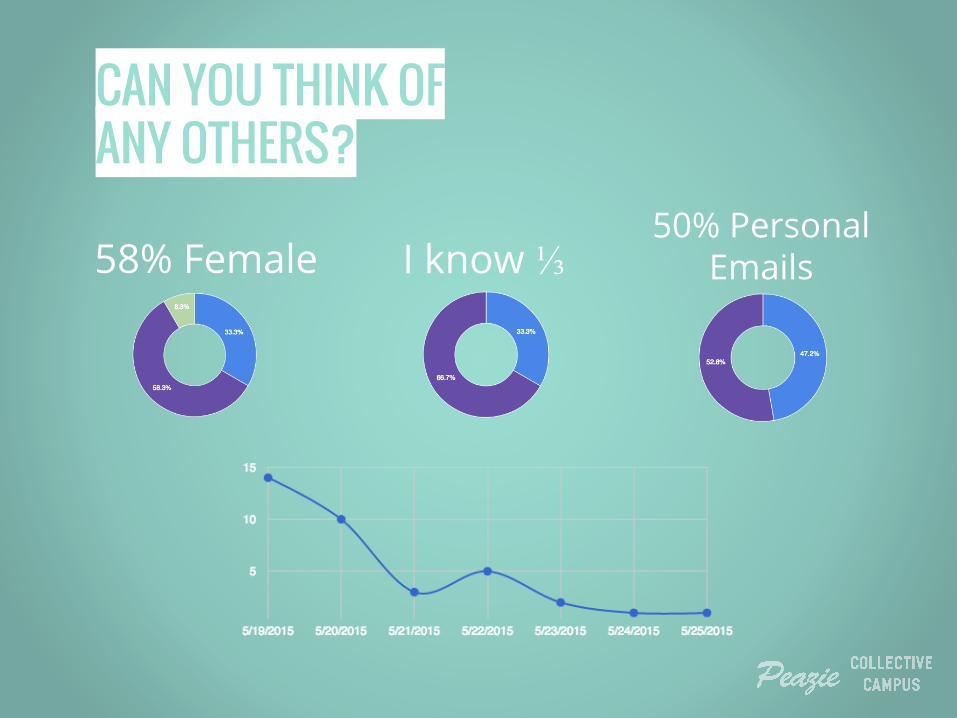
CAN YOU THINK OF ANY OTHERS?
58% Female I know ⅓ 50% Personal
Emails

YOU ARE A DETECTIVE
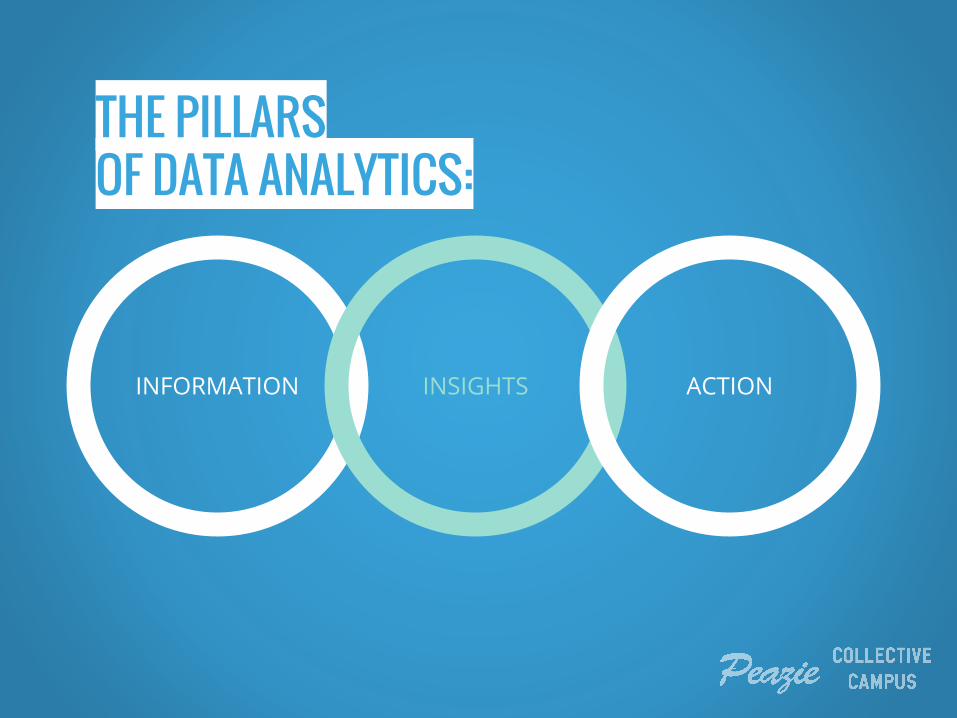
THE PILLARS OF DATA ANALYTICS:
INFORMATION INSIGHTS ACTION

THE END GOAL IS ACTION
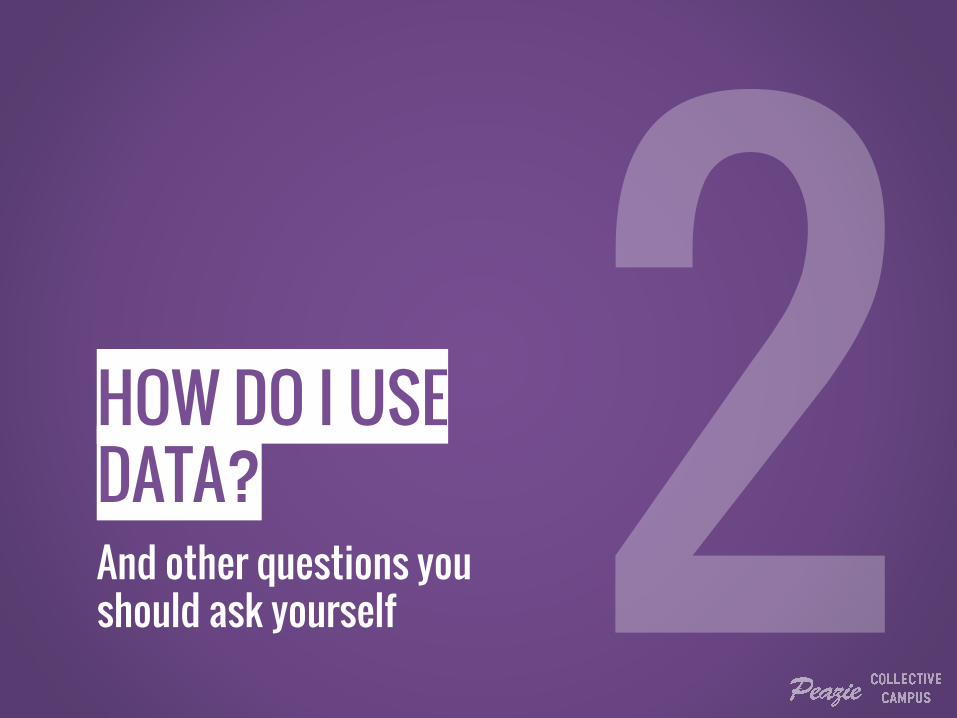
HOW DO I USE DATA?And other questions you should ask yourself

WE RECOMMEND A SIMPLE PROCESS
1) Ask a question 2) Define & Find
4) Tell a Story
3) Identify & Measure

ASK A QUESTION
Are my Facebook ads bringing in quality traffic to my website?
“ ”
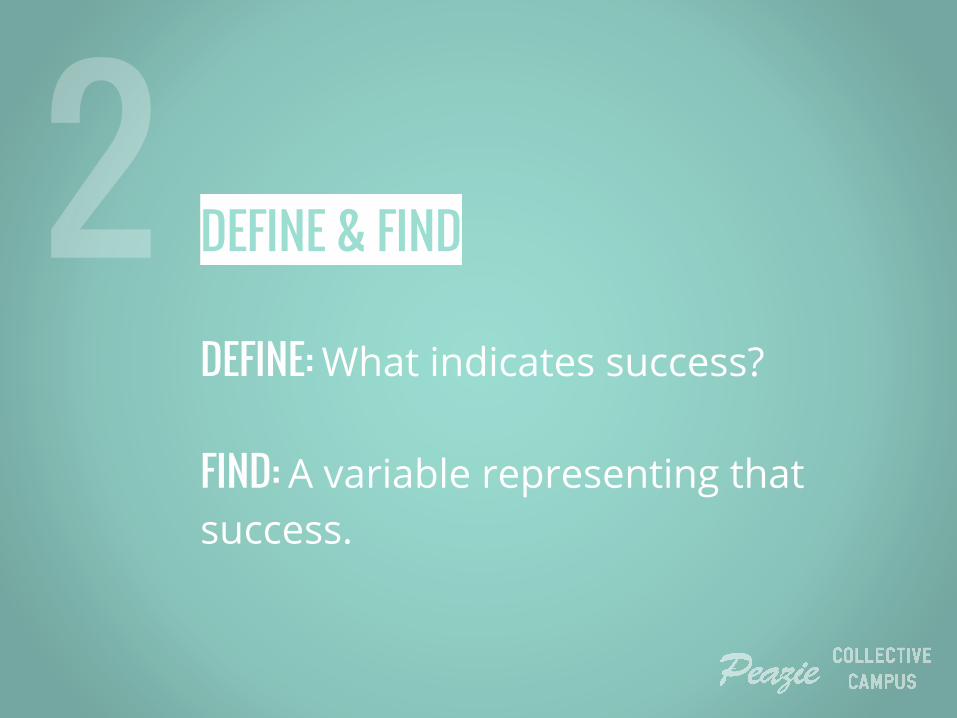
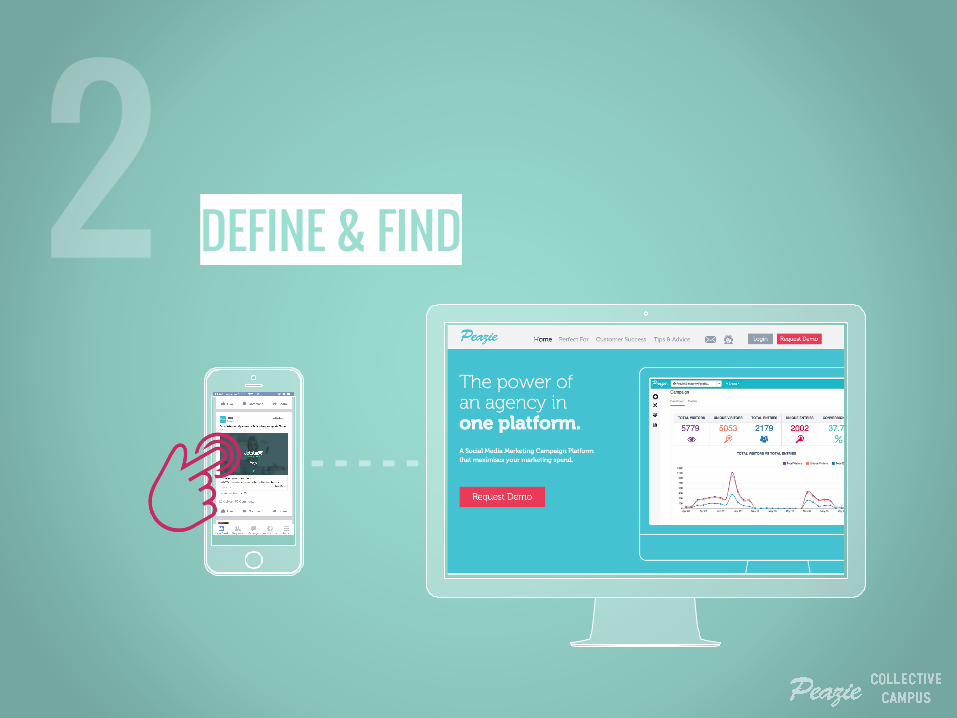
DEFINE & FIND
DEFINE: What indicates success?
FIND: A variable representing that success.

DEFINE & FIND
DEFINE SUCCESS: People clicking the ads and going to our website
FIND THE METRIC: Website Click-Through-Rate
DEFINE & FIND

IDENTIFY A TOOL & MEASURE
IMAGE OF FACEBOOK ADS MANAGER

TELL A STORY
We had a low wCTR, meaning we had few people viewing. Something was off with our ads. We need to adjust the copy, the imagery or the action we’re directing.
“
”

ACTION
CHANGE AD IMAGERY
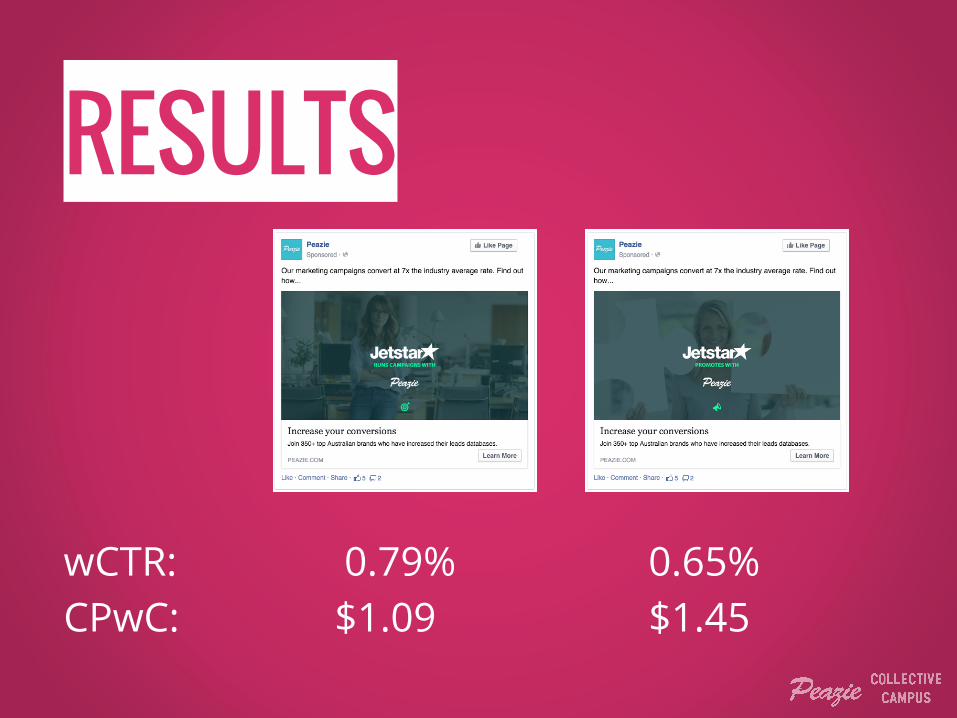
RESULTS
wCTR: 0.79% 0.65%CPwC: $1.09 $1.45

YOUR TURN : SELECT A BUSINESS QUESTION
1) Ask a question 2) Define & Find
4) Tell a Story
3) Identify & Measure

CARDINAL RULE: Don’t manipulate data to what you want to see. Let it tell YOU the story.

Coffee drinkers like the house blend best according to a survey of Uni students at Cafe Lexi in the CBD.

PURCHASES BY COFFEE PATRONS AT CAFE LEXI

BUT WAIT
A few things are happening here:
1) Uni students… a) CAFFEINEb) Not seasoned coffee drinkers
2) What does Purchase indicate?a) Preference OR b) Budget
3) Marketinga) In store display b) Promotions

HOW DO I KEEP FROM BIASES?
1) Write out multiple stories or questions
2) Write out all variables that could affect what you’re measuring
3) Tell a story & work with people

HOW DO I GET STARTED USING DATA IN MY COMPANY?Let’s put it into practice

MAKE A PLAN OF QUESTIONS
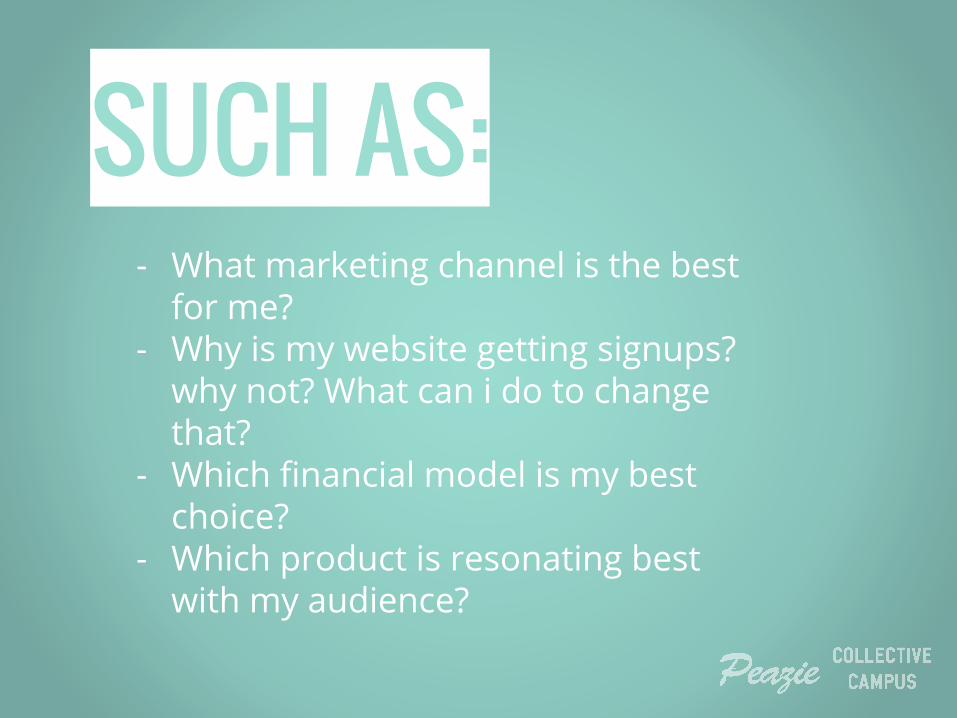
- What marketing channel is the best for me?
- Why is my website getting signups? why not? What can i do to change that?
- Which financial model is my best choice?
- Which product is resonating best with my audience?
SUCH AS:

SELECT A PLATFORM
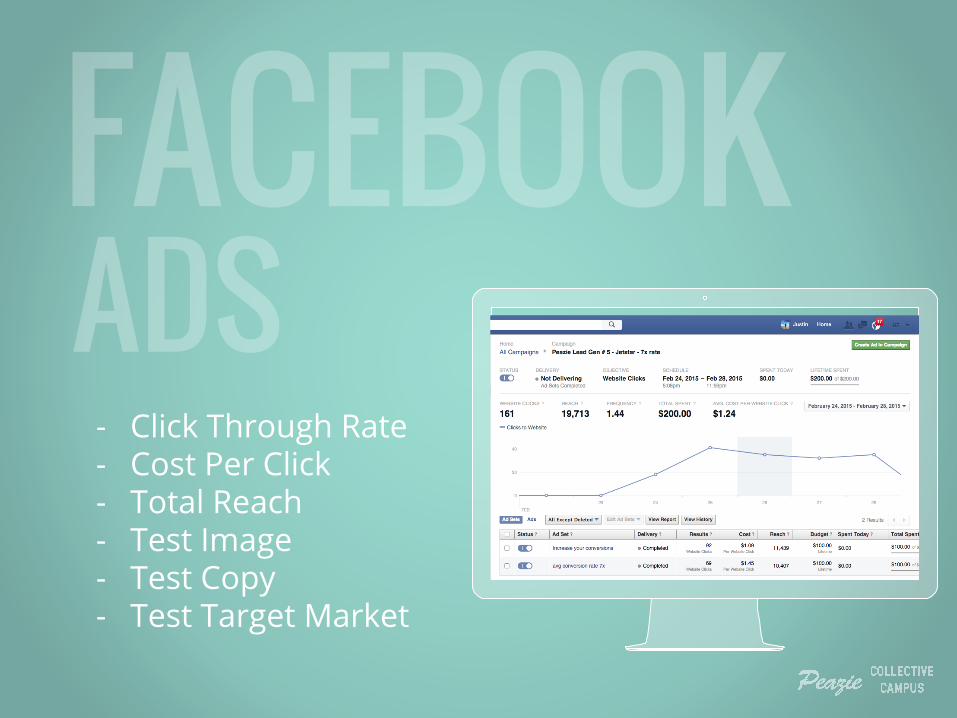
- Click Through Rate- Cost Per Click- Total Reach- Test Image- Test Copy- Test Target Market

- Open Rate- Click Through Rate- Test Subject Lines- Test Timing- Test Content
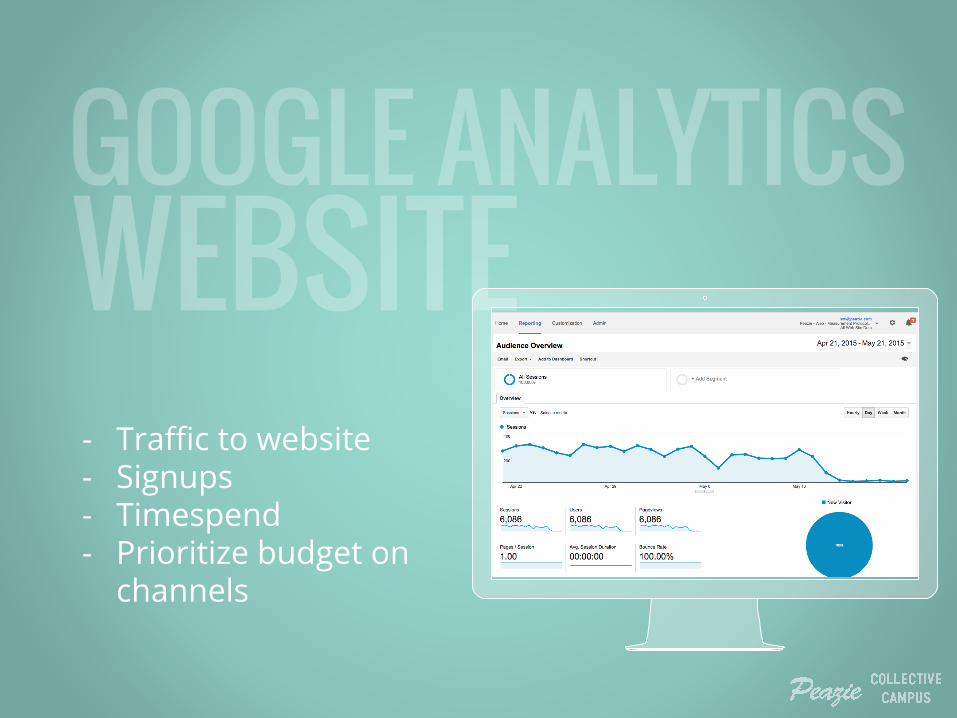
- Traffic to website- Signups- Timespend- Prioritize budget on
channels
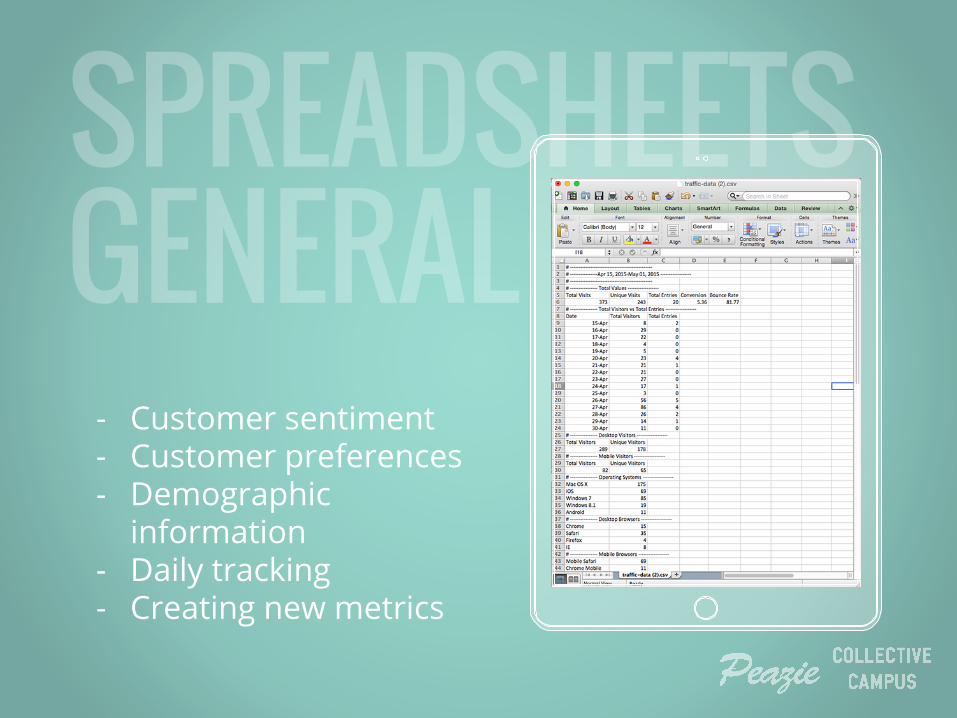
- Customer sentiment- Customer preferences- Demographic
information- Daily tracking - Creating new metrics

WHAT SHOULD I KEEP IN MIND?

CASE STUDY

TESTING
Ad 01 Ad 02

TESTING ● Multiple ads in 1 ad set
● Test only 1 variable from your control
● Same budget
● Same testing time-frame (1 week)

TRACKING

ASSESSING QUALITY
Ad 01wCTR: 0.93%CR: 6.35%
Ad 02wCTR: 0.76%CR: 15.94%

QUESTIONING WHYWhy did Ad 1 have a higher click through rate but a lower conversion rate? - e.g. more people clicked the ad but fewer entered
the website from that ad

PRESENTING DATA: LESS IS MORE


Ad 01wCTR: 0.93%Conversion Rate: 6.35%
Ad 02wCTR: 0.76%Conversion Rate: 15.94%
INSTEAD:

KEY TAKEAWAYS◇ Data is a story
◇ Start with a question
◇ Main goal from data insights is ACTION
◇ Presenting data to a boss? a client? your mom?
Less is more
ANY QUESTIONS?You can find me at@[email protected]/in/lexisydow
You can find Collective Campus [email protected]
CREDITS
Special thanks to all the people who made and released these awesome resources for free:◇ Presentation template by SlidesCarnival◇ Icons by flaticon

THANKS FROM COLLECTIVE CAMPUS
◇ To say thanks for coming, we’re giving you $50 off a workshop at Collective Campus.
◇ Simply check out next time you’re booking a
workshop with coupon code I2DA50.