Intrinsic Circuits in the Lateral Central Amygdala · Local inhibition in the lateral central...
18
Sensory and Motor Systems Intrinsic Circuits in the Lateral Central Amygdala Sarah Hunt, 1 Yajie Sun, 1 Hakan Kucukdereli, 2 Rüdiger Klein, 2 and Pankaj Sah 1 DOI:http://dx.doi.org/10.1523/ENEURO.0367-16.2017 1 Queensland Brain Institute, The University of Queensland, Brisbane 4072, Queensland, Australia, and 2 Max Planck Institute of Neurobiology, 82152 Martinsreid, Germany Abstract Network activity in the lateral central amygdala (CeL) plays a crucial role in fear learning and emotional processing. However, the local circuits of the CeL are not fully understood and have only recently begun to be explored in detail. Here, we characterized the intrinsic circuits in the CeL using paired whole-call patch-clamp recordings, immunohistochemistry, and optogenetics in C57BL/6J wild-type and somatostatin-cre (SOM-Cre) mice. Our results revealed that throughout the rostrocaudal extent of the CeL, neurons form inhibitory connections at a rate of 29% with an average amplitude of 20 3 pA (at 40 mV). Inhibitory input from a single neuron is sufficient to halt firing in the postsynaptic neuron. Post hoc immunostaining for protein kinase C (PKC) in wild-type mice and paired recordings in SOM-Cre mice demonstrated that the most common local connections were PKC() ¡ PKC() and SOM() ¡ SOM(). Finally, by optogenetically activating either SOM() or SOM() neurons, we found that almost all neurons in the CeL were innervated by these neuronal populations and that connections between like neurons were stronger than those between different neuronal types. These findings reveal a complex network of connections within the CeL and provide the foundations for future behavior-specific circuit analysis of this complex network. Key words: anxiety; emotion; fear; learning Introduction The amygdala has long been known to play a crucial role in processing innate emotions, particularly fear (Klüver and Bucy, 1939; Weiskrantz, 1956; Sah et al., 2003). In Pavlovian fear conditioning, an associative learn- ing paradigm widely used to study amygdala function, subjects learn to associate a neutral sensory stimulus [the conditioned stimulus (CS)], with an aversive one (the un- Received December 12, 2016; accepted February 9, 2017; First published February 23, 2017. The authors declare no competing financial interests. Author contributions: R.K. and P.S. designed research; S.H., Y.S., and H.K. performed research; S.H. and H.K. analyzed data; S.H. and P.S. wrote the paper. This work was supported by grants to P.S. from the National Health and Medical Research Council and the Australian Research Council. Correspondence should be addressed to Pankaj Sah, Queensland Brain Institute, Building 79, The University of Queensland, Brisbane 4072, QLD, Australia. E-mail: [email protected]. DOI:http://dx.doi.org/10.1523/ENEURO.0367-16.2017 Copyright © 2017 Hunt et al. This is an open-access article distributed under the terms of the Creative Commons Attribution 4.0 International, which permits unrestricted use, distri- bution and reproduction in any medium provided that the original work is properly attributed. Significance Statement Local inhibition in the lateral central amygdala (CeL) plays a crucial role in the processing of emotions, yet a complete understanding of these connections is still in its infancy. In this study, we show that CeL neurons are highly interconnected and that inhibition from a single neuron is sufficient to silence the postsynaptic neuron. Focusing on two well known CeL neuronal subtypes, protein kinase C (PKC)-expressing and somatostatin (SOM)-expressing neurons, we show that the most common local connections are PKC() ¡ PKC() and SOM() ¡ SOM(). Optogenetic activation of either the SOM() or SOM() neuronal populations revealed that inhibition was larger between like neurons. These findings show that within the CeL there is a complex network and provide the foundations for future behavior-specific circuit studies. New Research January/February 2017, 4(1) e0367-16.2017 1–18
Transcript of Intrinsic Circuits in the Lateral Central Amygdala · Local inhibition in the lateral central...
Sensory and Motor Systems
Intrinsic Circuits in the Lateral Central AmygdalaSarah Hunt,1 Yajie Sun,1 Hakan Kucukdereli,2 Rüdiger Klein,2 and Pankaj Sah1
DOI:http://dx.doi.org/10.1523/ENEURO.0367-16.2017
1Queensland Brain Institute, The University of Queensland, Brisbane 4072, Queensland, Australia, and 2Max PlanckInstitute of Neurobiology, 82152 Martinsreid, Germany
AbstractNetwork activity in the lateral central amygdala (CeL) plays a crucial role in fear learning and emotional processing.However, the local circuits of the CeL are not fully understood and have only recently begun to be explored indetail. Here, we characterized the intrinsic circuits in the CeL using paired whole-call patch-clamp recordings,immunohistochemistry, and optogenetics in C57BL/6J wild-type and somatostatin-cre (SOM-Cre) mice. Ourresults revealed that throughout the rostrocaudal extent of the CeL, neurons form inhibitory connections at a rateof �29% with an average amplitude of 20 � 3 pA (at �40 mV). Inhibitory input from a single neuron is sufficientto halt firing in the postsynaptic neuron. Post hoc immunostaining for protein kinase C� (PKC�) in wild-type miceand paired recordings in SOM-Cre mice demonstrated that the most common local connections were PKC�(�)¡ PKC�(�) and SOM(�) ¡ SOM(�). Finally, by optogenetically activating either SOM(�) or SOM(�) neurons, wefound that almost all neurons in the CeL were innervated by these neuronal populations and that connectionsbetween like neurons were stronger than those between different neuronal types. These findings reveal a complexnetwork of connections within the CeL and provide the foundations for future behavior-specific circuit analysis ofthis complex network.
Key words: anxiety; emotion; fear; learning
IntroductionThe amygdala has long been known to play a crucial
role in processing innate emotions, particularly fear(Klüver and Bucy, 1939; Weiskrantz, 1956; Sah et al.,
2003). In Pavlovian fear conditioning, an associative learn-ing paradigm widely used to study amygdala function,subjects learn to associate a neutral sensory stimulus [theconditioned stimulus (CS)], with an aversive one (the un-
Received December 12, 2016; accepted February 9, 2017; First publishedFebruary 23, 2017.The authors declare no competing financial interests.Author contributions: R.K. and P.S. designed research; S.H., Y.S., and H.K.
performed research; S.H. and H.K. analyzed data; S.H. and P.S. wrote thepaper.
This work was supported by grants to P.S. from the National Health andMedical Research Council and the Australian Research Council.
Correspondence should be addressed to Pankaj Sah, Queensland BrainInstitute, Building 79, The University of Queensland, Brisbane 4072, QLD,Australia. E-mail: [email protected].
DOI:http://dx.doi.org/10.1523/ENEURO.0367-16.2017Copyright © 2017 Hunt et al.This is an open-access article distributed under the terms of the CreativeCommons Attribution 4.0 International, which permits unrestricted use, distri-bution and reproduction in any medium provided that the original work isproperly attributed.
Significance Statement
Local inhibition in the lateral central amygdala (CeL) plays a crucial role in the processing of emotions, yeta complete understanding of these connections is still in its infancy. In this study, we show that CeL neuronsare highly interconnected and that inhibition from a single neuron is sufficient to silence the postsynapticneuron. Focusing on two well known CeL neuronal subtypes, protein kinase C� (PKC�)-expressing andsomatostatin (SOM)-expressing neurons, we show that the most common local connections are PKC�(�)¡ PKC�(�) and SOM(�) ¡ SOM(�). Optogenetic activation of either the SOM(�) or SOM(�) neuronalpopulations revealed that inhibition was larger between like neurons. These findings show that within theCeL there is a complex network and provide the foundations for future behavior-specific circuit studies.
New Research
January/February 2017, 4(1) e0367-16.2017 1–18
conditioned stimulus; LeDoux, 2000). Following learning,the previously neutral CS now evokes a defensive re-sponse (i.e., freezing of movement or flight; Gross andCanteras, 2012). A converging body of evidence has es-tablished the amygdala as a central player in fear condi-tioning where the basolateral amygdala (BLA) and thecentral amygdala (CeA) are the key sites involved in theacquisition and expression of fear (LeDoux, 2000; Sahet al., 2003; Duvarci and Pare, 2014). The BLA has beenextensively studied with respect to its cell types, intrinsiccircuits, and extrinsic connections (LeDoux, 2000; Sahet al., 2003; Duvarci and Pare, 2014), while the CeA hasreceived considerably less attention and the intrinsic cir-cuits within this nucleus are less well understood.
The CeA is a GABAergic nucleus (McDonald and Au-gustine, 1993; Sun and Cassell, 1993) that is anatomicallydivided into the lateral sector of the CeA (CeL) and themedial sector of the CeA (CeM), with substantial unidirec-tional connections between the CeL and the CeM (Mc-Donald, 1982; Grove, 1988; Jolkkonen and Pitkänen,1998). Neurons in both regions also make extensive localconnections (McDonald, 1982; Sun and Cassell, 1993;Jolkkonen and Pitkänen, 1998), with local glutamate ex-citation of CeL neurons evoking IPSCs in neighboringneurons (Lopez de Armentia and Sah, 2004). Recent stud-ies have divided CeL neurons into distinct populationsbased on the expression of immunohistochemical mark-ers, electrophysiological properties, and synaptic connec-tions (Ciocchi et al., 2010; Haubensak et al., 2010; Li et al.,2013). Of these, one population expresses protein kinaseC� [PKC�(�)], and these neurons are predominantly de-scribed as late-firing (LF) neurons, exhibiting a substantialdelay to action potential (AP) initiation in response todepolarizing somatic current injections. Following fearconditioning, these neurons respond to the CS with areduction in activity and have therefore been called Ce-LOFF cells (Ciocchi et al., 2010; Haubensak et al., 2010). Asecond population of CeL neurons, which is largely sep-arate from the PKC�(�) population, expresses soma-tostatin [somatostatin-positive (SOM�); Li et al., 2013].These neurons receive direct synaptic input from thelateral amygdala, which is potentiated following auditoryfear conditioning (Li et al., 2013). Electrophysiologically,PKC�(�) neurons which are predominantly SOM(�), havebeen described as either LF or regular spiking (RS). Fol-lowing fear conditioning, PKC�(�) neurons respond to theCS with an increase in activity, and have therefore beencalled CeLON neurons (Ciocchi et al., 2010; Haubensaket al., 2010), which likely also correspond to SOM(�)neurons (Yu et al., 2016). PKC�(�) neurons inhibitPKC�(�) neurons, which in turn project to the CeM (Hau-bensak et al., 2010).
This organization has led to one model in which fearexpression is mediated by CS-related information drivingPKC�(�) neurons, presumably SOM(�) neurons, in theCeL via excitatory input from the BLA and thalamus.These neurons in turn inhibit PKC�(�) neurons, resultingin disinhibition of the CeM and the expression of fear(Ciocchi et al., 2010; Haubensak et al., 2010). However,some SOM(�) neurons in the CeL also project to the
periaqueductal gray (PAG; Penzo et al., 2014), and CS-driven activity of these neurons also contributes to fearexpression (Tovote et al., 2016). Moreover, recent studieshave reported that neurons in the CeL are also involved infeeding (Cai et al., 2014), and pain (Han et al., 2015).Neurons engaged during feeding and pain responses arealso part of the PKC� and SOM population, indicating thatthe intrinsic circuitry of the CeL is complex, and thestrength, identity, and physiologic role of individual localconnections are not fully understood. In this study, weprovide a detailed investigation of local circuits in the CeL.
Materials and MethodsAnimals
All studies were approved by the University of QueenslandAnimal Ethics Committee, and experiments were conductedin accordance with the Australian Code of Practice for theCare and Use of Animals for Scientific purposes. Adult (6–15weeks old) male wild-type C57BL/6J mice were used forelectrophysiology experiments. Where stated, we also usedboth male and female mice (8–12 weeks old) from asomatostatin-IRES-cre mouse line (SOM-Cre; C57BL/6Jbackground; Ssttm2.1(cre)Zjh) that was acquired from TheJackson Laboratory. These mice express cre recombinaseunder the SOM promoter, thereby allowing selective target-ing of SOM(�) neurons using cre-dependent viral constructs(described below). Mice were genotyped by the AustralianEquine Genetics Research Center.
Brain slice preparationMice were anesthetized using isoflurane and decapitated,
after which brains were quickly removed while submerged inan oxygenated ice-cold N-methyl-D-glucamine-based(NMDG) solution (NMDG 93 mM, KCl 2.5 mM, NaH2PO4
1.2 mM, NaHCO3 30 mM, HEPES 20 mM, glucose 25 mM,sodium ascorbate 5 mM, thiourea 2 mM, sodium pyruvate3 mM, MgSO4 10 mM, and CaCl2 0.5 mM, pH 7.2, 290–300mOsm). This NMDG-based solution is particularly suitedfor dissections of adult mice (Zhao et al., 2011). Coronalbrain slices (300 �m thick) were then prepared using avibratome (catalog #VT1000S, Leica) and placed to re-cover in oxygenated artificial CSF (aCSF; NaCl 118 mM,NaHCO3 25 mM, glucose 10 mM, KCl 2.5 mM, NaHPO4 1.2mM, MgCl2 1.3 mM, and CaCl2 2.5 mM, pH 7.2, 290–300mOsm) for 30 min at 34°C, and then at room temperatureuntil required.
Electrophysiological recordingsSlices were visualized on an upright microscope (model
BX51WI, Olympus), and whole-cell patch-clamp record-ings were made using a Multiclamp 700B (Molecular De-vices). The CeL was easily distinguishable in vitro basedon the fire bundles that surround and clearly delineate thisarea (see Fig. 4A). These landmarks are readily visibleunder the microscope and ensured that cells chosen forrecordings were situated within the CeL. In addition, forelectrophysiological recordings, cells in the CeL are typ-ically smaller than those in the BLA, and their cell densityis higher than both the BLA and CeM. Data were filtered at4 kHz and sampled at 20 kHz using an ITC-18 (Instrutech).
New Research 2 of 18
January/February 2017, 4(1) e0367-16.2017 eNeuro.org

Data were acquired and analyzed using AxoGraphX soft-ware (AxoGraph). Brain slices were continuously perfusedwith oxygenated aCSF (34°C; 3–4 mL/min), and recordingelectrodes (4–6 M�; glass capillaries, Harvard Apparatus;PC-10 Electrode Puller, Narishige) were filled with aKMeSO4-based internal solution (KMeSO4 135 mM, NaCl8 mM, HEPES 10 mM, MgATP 2 mM, GTP 0.3 mM, phos-phocreatine 7 mM, EGTA 0.2 mM, and biocytin 0.2%, pH7.2 with KOH, osmolarity 295 mOsm/kg) unless otherwisestated, in which case a CsMeSO4-based internal solutionwas used (CsMeSO4 135 mM, NaCl 8 mM, HEPES 10 mM,MgATP 2 mM, GTP 0.3 mM, phosphocreatine 7 mM, andspermine 0.1 mM, pH 7.2 with CsOH, osmolarity 300mOsm/kg). In some experiments GABA (10 mM) wasadded to the KMeSO4-based internal solution to avoidany run down of responses due to wash out during whole-cell recordings (Apostolides and Trussell, 2013), althoughno difference in response was observed when usingGABA internal solutions. No corrections were made forjunction potentials. The pairs of neurons chosen for re-cordings were located within 50–100 �m of each other inthe coronal plane and 10–40 �m in the rostrocaudalplane. To probe for connections during paired recordings,one cell was held in current-clamp mode and injected witha 5 ms, 600–700 pA current pulse to evoke an AP. Mean-while, the second (postsynaptic) neuron was held involtage-clamp mode at �40 mV, well away from thechloride reversal potential (approximately �73 mV), giventhat neurons in the CeL are known to be GABAergic,forming inhibitory synapses (Sun and Cassell; Lopez deArmentia and Sah, 2004; Haubensak et al., 2010; Li et al.,2013). This protocol was repeated for at least 20 (but not�50) episodes, and sweeps were averaged for analysis.The same was then done in the opposite direction. Onlyconnections with an amplitude of �5 pA were consideredto be connected. Finally, in pharmacology experiments,bicuculline (10 �M; Sigma-Aldrich) or CNQX (10 �M; TocrisBioscience) were bath applied to the slice.
Firing propertiesAPs were evoked using current injections applied in
increments of 20 pA from �60 to 240 pA. AP threshold,amplitude, delay, half-width, rise time, and spike accom-modation were analyzed off-line (described below). Spikeaccommodation was measured as the difference in APfrequency over at least eight APs at twice threshold.Although the two main firing types we observed ultimatelyhad significantly different AP onsets, we used the ab-sence or presence of spike accommodation to classifythese firing types, as AP onset varied with small changesin holding membrane potential.
Data analysisElectrophysiological properties
Resting membrane potential (Rm) was recorded on-lineimmediately after break-in, whereas input resistance (Ri)was measured off-line as Ri � dVm/l, where dVm is thechange in membrane potential in response to a �20 pA(800 ms) current injection (l). For connections, decay wasmeasured by fitting the average IPSC by a sum of twoexponentials (simplex sum of squared errors) to calculate
a weighted time constant: �w � �t1·a1 � t2·a2� / �a1 � a2� .Onset delay was calculated as the difference between thetime of the presynaptic AP peak and the time of IPSConset (time at 5% of peak). For firing properties, APthreshold was measured as the membrane potential at thestart of the fast-rising phase. AP amplitude was measuredfrom the threshold to peak, and delay was measured asthe duration from the start of the current injection to thestart of the fast-rising phase of the first AP.
Statistical testsDatasets were tested for normality using the Shapiro–
Wilks test. In the cases where a subset of the populationwas tested (e.g., drug application), we based our choiceof statistical test on whether or not the overall dataset wasnormally distributed. We used parametric tests (t tests)when the data followed a normal distribution, whereasnonparametric tests (Wilcoxon and Mann–Whitney tests)were used for datasets that were too small to reliably testfor or did not follow a normal distribution. Two-tailed testswere used unless otherwise stated, and differences wereconsidered to be significant at p 0.05.
ImmunohistochemistryLabeling for immunohistochemical characterization
For characterization of CeA neurons, mice were anes-thetized by intraperitoneal injection of pentobarbitone so-dium (3250 mg/kg; Virbac) and transcardially perfusedwith 40 ml of a 1% sodium nitrite solution (phosphatebuffer, 0.1 M), followed by 40 ml of 4% paraformaldehyde(PFA; in 0.1 M phosphate buffer). Brains were then re-moved and left in 4% PFA at room temperature overnightand washed (3 15 min, PBS 0.1 M) before sectioning(50–60 �m sections). Brains were placed in 30% sucrosefor 48 h and sectioned using a sliding microtome (modelSM200R, Leica). Coronal subsections (50 �m) were thenstained for PKC� using a mouse anti-PKC� antibody (1:500; BD Biosciences), for SOM using a rabbit anti-SOMantibody (1:1000; Millipore Bioscience Research Reagents/Millipore), and for NeuN using a chicken anti-NeuN antibody(1:1000; Millipore; 72 h at room temperature). In the case ofvirus-injected animals, fluorescence was amplified using ei-ther a rabbit anti-red fluorescent protein antibody (1:1000;Abcam) or chicken anti-green fluorescent protein (1:1000;Life Technologies). Sections were then washed and incu-bated with mouse-fluorophore 647 (for PKC�; 1:2000; Invitro-gen), rabbit-fluorophore 488 (for SOM; 1:2000; Invitrogen),rabbit-fluorophore 568, or chicken-fluorophore 488 (forfluorescence-enhanced sections; 1:2000; Invitrogen). Brainsections used for counts were immunolabeled for NeuN toallow reliable identification of mature neurons, and onlyNeuN(�) neurons were counted. Cell counts were made inboth the right and left hemispheres, but, because these werenot significantly different, the data were pooled for eachbregma location.
Post hoc labeling of recorded neuronsAlexa Fluor 568 (1 ng/ml internal solution) was added to
the internal recording solution, and images of dendriticmorphology were taken during recordings to correctlyidentify the presynaptic and postsynaptic cells after re-covery of recorded neurons. Following electrophysiolog-
New Research 3 of 18
January/February 2017, 4(1) e0367-16.2017 eNeuro.org

Figure 1. PKC� and SOM label distinct populations of neurons in the CeL of wild-type C57BL/6J mice. A, Top, Diagrams of coronalCeL slices of C57BL/6J mouse at �1.20, �1.40, �1.60, and �1.80 mm from bregma. LA, Lateral amygdala; BA, basal amygdala;CeA, central amygdala, which is divided into the CeL (orange) and the central medial amygdala (CeM, in white). Arrows show dorsaland medial orientation. Scale bar, 1 mm. Bottom panels show closeups of the CeL in 50 �m sections that were stained for NeuN (tostain somas of neurons, white fluorescence), PKC� (green fluorescence), and SOM (red fluorescence). Scale bar in bottom left square,100 �m. For clarity, the merged panels represent the merging of PKC� and SOM only. The CeL is outlined in the bottom panel, andthis outline was defined both by landmarks visible in bright field (data not shown), and the presence of PKC�(�) somas. PKC�(�) fiberscan typically be seen in the CeM. The locations of both the BA and the CeM are also labeled in the merged panels, and note that by1.80 mm the CeM is no longer present. The inset in the lower right corner of the far right merged panel shows a closeup of the mostcommon cells types: PKC�(�)/SOM(�) (white arrowhead) and SOM(�)/PKC�(�) neurons (yellow arrowhead; scale bar, 10 �m; PKC�green fluorescence, SOM red fluorescence, NeuN blue fluorescence). B, Only NeuN(�) neurons were counted to ensure that onlymature neuronal cells were taken into account. Of these, 48 � 5% were PKC�(�)/SOM(�) (mean n � 83 � 19 neurons/1.0 10�3
mm3), and 38 � 3% were SOM(�)/PKC�(�) (mean n � 66 � 14 neurons/1.0 10�3 mm3). These two populations were largely distinctas only 1 � 0.5% of neurons were PKC�(�)/SOM(�) (mean n � 2 � 0.3 neurons/1.0 10�3 mm3), and 12 � 2% NeuN(�) cells werePKC�(�)/SOM(�) (mean n � 20 � 4 neurons/1.0 10�3 mm3). The dotted line on the graph indicates 50% and bregma-specific
New Research 4 of 18
January/February 2017, 4(1) e0367-16.2017 eNeuro.org

ical recordings, slices were fixed in 4% PFA (in 0.1 M
phosphate buffer) for either 1 h at room temperature orovernight at 4°C, and then washed for 3 15 min in 0.1M PBS. Slices were then placed in blocking solution (1%BSA, 0.05% saponin, and 0.05% sodium azide) for 1–2 hat room temperature before incubation with an AlexaFluor 555-bound streptavidin (overnight at room temper-ature; 1:2000 in blocking solution; Life Technologies).Slices were then washed (3 15 min, 0.1 M PBS),mounted (DABCO), and imaged using either an uprightfluorescent microscope (5 and 20; Zen Software,Zeiss) or spinning disk confocal microscope (20 and40 water-immersion objective, model #CSU-W1, Yok-ogawa; Slidebook software). All images were analyzedusing FIJI (ImageJ). For protein PKC� staining, slices weresubsequently embedded in 4% agarose and subsec-tioned (50 �m sections; VT1000S vibratome, Leica) beforebeing incubated with the PKC� mouse-antibody (72 h atroom temperature; 1:500; BD Biosciences). Sections werethen washed and incubated with mouse-fluorophore 647(1:2000; Invitrogen), and the nuclei of the cells stainedwith DAPI, before being mounted and imaged as de-scribed above. Although PKC� clearly labeled somas, thesomatostatin antibody did not deliver reliable post hocstaining, as a result of which we focused on PKC� forpostrecording labeling experiments.
MorphologyBiocytin-recovered neurons that were used for morpho-
logic reconstruction were imaged using a spinning diskconfocal microscope (40 1.2 numerical aperture water-immersion objective, 0.156 0.156 0.33 �m3/pixelresolution; model #CSU-W1, Yokogawa; Slidebook soft-ware). Neurons were manually traced using Neurolucida(MBF Bioscience) and analyzed using Neurolucida Ex-plorer. For spine counts, dendrites were reimaged using a63 1.4 numerical aperture oil-objective (0.099 0.099 0.15 �m3/pixel resolution) and underwent deconvolu-tion. Spines were counted automatically and manuallyverified (Neurolucida 360, MBF Bioscience; including thez-plane) over 60 �m of secondary dendrites. Three seg-ments (each from a different secondary dendrite) werecounted and averaged for each cell.
Viral injections and optical stimulationMice (21–28 d old) were anesthetized (100 mg/kg ket-
amine, 10 mg/kg xylazil in saline) and placed in a stereo-taxic frame. Bilateral injections were made into CeL usingthe following coordinates (Paxinos and Watson, 2001):�1.6 mm (anteroposterior); � 2.8 mm (mediolateral); and�4.8 mm (dorsoventral from skull).
A small hole was drilled in the skull, and virus wasinjected using a glass needle (pressure injection Pico-spritzer; 10–20 ms, 10–30 psi). Animals were injected
stereotaxically with an AAV (adeno-associated virus; 0.1–0.3 �l, 0.1 �l/min Vector Core) containing one of thefollowing constructs: AAV2/5- EF1�-DIO-tdTomato (titer: 1.0 1011); AAV2/5- EF1�.dflox.hChR2(H134R)-mCherry (titer:
Figure 2. Firing types of neurons in the central lateral amygdalaare as follows: late-firing nonaccommodating and early-spikingaccommodating. A, B, Example traces of the two main firingtypes recorded in the CeL: LF-NA (A) and ES-Ac (B) with exam-ple traces of current injections below. Calibration: 20 mV, 500ms, 80 pA. The top two current injections shown are at thresholdand twice threshold (2T). On average, LF-NA neurons displayedsignificantly longer onset to firing of the first AP (onset indicatedby black arrowheads) when compared with ES-Ac neurons (LF-NA, 330 � 25 ms, n � 80 neurons; ES-Ac, 209 � 23, n � 59neurons; p 0.001, Mann–Whitney test) and little to no accom-modation at 2T. To demonstrate accommodation, early (greenlines) and late (red lines) interspike intervals are indicated. C,Whereas AP frequency over eight action potentials remainedconsistent for LF-NA neurons (n � 20; AP1-2 frequency, 17 � 1Hz; AP7-8 frequency, 16 � 1 Hz; p � 0.6, Wilcoxon matched-pairs test), ES-Ac AP frequency gradually decreased (AP1-2 fre-quency, 32 � 4 Hz; AP7-8 frequency, 13 � 1 Hz; p 0.001,Wilcoxon matched-pairs test).
continuedpercentages were as follows: PKC�(�)/SOM(�), 34 � 6% (�1.20 mm), 50 � 2% (�1.40 mm), 52 � 1% (�1.60 mm), and 57 � 4%(�1.80 mm). PKC�(�)/SOM(�), 45 � 3% (�1.20 mm), 38 � 1% (�1.40 mm), 39 � 3% (�1.60 mm), and 30 � 5% (�1.80 mm);PKC�(�)/SOM(�), 20 � 6% (�1.20 mm), 11 � 3% (�1.40 mm), 8 � 3% (�1.60 mm), and 10 � 1% (�1.80 mm); and PKC�(�)/SOM(�), 1 � 0.3% (�1.20 mm), 1 � 0.2% (�1.40 mm), 1 � 0.05% (�1.60 mm), and 3 � 0.5% (�1.80 mm).
New Research 5 of 18
January/February 2017, 4(1) e0367-16.2017 eNeuro.org

1.31 1013); or AAV2/5-EF1�-DIO-Fwd.hChR2(H134R)-EYFP (enhanced yellow fluorescent protein; titer: 1.0 1011).
Animals were quarantined for 48 h then allowed torecover for at least 4 weeks postinjection. Brain sliceswere prepared as described above for electrophysiologi-cal experiments, and cells were only recorded well withinthe spread of the virus to ensure that nonfluorescentneurons were indeed SOM(�) rather than simply not in-fected. To verify the expression of channelrhodopsin(ChR2) and to activate ChR2 in infected cells, an LEDsystem (470 nm, 1.4 mW; pE-2 LED System, CoolLED)attached to the microscope (via the rear C-mount port)was used. A prolonged light pulse (100 ms) was used toverify that cells expressed functional ChR2. In the case ofAAV2/5- EF1�.dflox.hChR2(H134R)-mCherry experi-ments, for example, neurons were considered SOM(�) ifthey were both fluorescent and displayed a prolongeddepolarization in response to prolonged light stimulation(470 nm, 100 ms), whereas a SOM(�) neuron was notfluorescent and showed no excitation to the light pulse. Alight pulse of 2 ms (n � 57 neurons) or 1 ms (n � 10neurons) was used to evoke responses in the CeL.
ResultsCharacterization of neurons in the central lateralamygdalaImmunohistochemical characterization
Neurons in the CeL have been separated based on theexpression of a range of neuropeptides and markers thatinclude PKC�, SOM, corticotropin-releasing factor, oxy-tocin receptors, enkephalin, and others (Cassell and Gray,1989; Haubensak et al., 2010). Of these, the two mosthighly expressed and clearly distinct neuropeptides arePKC� and SOM (Haubensak et al., 2010; Li et al., 2013).Immunostaining of brain sections from four locations pos-terior to bregma (�1.20, �1.40, �1.60, and �1.80 mm;�0.05 mm; Fig. 1A, top diagrams) shows that PKC�labeling within the amygdala was specific to the CeL,whereas SOM expression was also present outside the
central amygdala. In the CeL, 48 � 5% of neurons ex-pressed PKC�, and 38 � 3% SOM (Fig. 1A), with the twopopulations largely nonoverlapping, and dual-labeled[PKC�(�)/SOM(�)] neurons accounting for only 1.5 �0.5% of neurons. The remaining neurons (13 � 2%) werenegative for both markers. It was notable that whereas theproportions of PKC�(�)/SOM(�) and PKC�(�)/SOM(�)neurons were similar between bregma �1.40 and �1.60mm, the difference between the total numbers of the twocell types changed at bregma �1.20 and �1.80 mm, therostral and caudal limits of the CeL (Fig. 1B).
Electrophysiological propertiesBased on their response to somatic current injections,
three general types of CeL neurons have previously beendescribed, with the two major types being LF neurons,which show a significant delay before onset of the first AP(�100–200 ms), and early-spiking (ES) neurons (also de-scribed as regular-spiking; AP onset, �50 ms). A third,smaller population of low-threshold bursting neurons hasalso been described (Dumont et al., 2002; Lopez de Ar-mentia and Sah, 2004; Haubensak et al., 2010; Li et al.,2013; Hou et al., 2016). We characterized the firing prop-erties of 151 CeL neurons. However, while classifyingneurons we found that AP onset varied with changes inholding potential, whereas the presence of spike fre-quency accommodation was more reliable. Using thismeasure, neurons were classified either as nonaccommo-dating (NA), where AP frequency remained relatively con-sistent (�17 Hz), or accommodating (Ac), where therewas clear spike frequency adaptation (AP1-2, �32 Hz;AP7-8, 13 Hz; p 0.001 Wilcoxon matched-pairs test; Fig.2C). The large majority of our neurons were nonaccom-modating (n � 80 neurons; Fig. 2A) or accommodating (n� 59 neurons; Fig. 2B). Nonaccommodating neurons alsohad a significantly longer mean onset compared with thatof accommodating neurons (Table 1), and these neuronsgenerally corresponded to the LF and ES types (Hauben-sak et al., 2010; Amano et al., 2012). Thus, for consistencywe have termed these LF-NA and ES-Ac neurons. Apart
Table 1: Membrane properties of neurons in the central lateral amygdala
Firing typeNonaccommodating(n � 80)
Accommodating(n � 59)
Stuttering(n � 12)
Incidence 53% 39% 8%Input resistance (m�) 416 � 17 419 � 28 387 � 64Resting potential (mV) -64 � 1 -59 � 1a -62 � 2Threshold (mV) -33 � 0.5 -34 � 0.5 -34 � 1.8Onset (ms) at T 330 � 25 209 � 23b 122 � 54Onset (ms) at 2T 77 � 5 59 � 7c 28 � 19Amplitude (mV) 66 � 1 69 � 1 53 � 4d,e
Rise time (ms) 0.4 � 0.02 0.4 � 0.02 0.2 � 0.02f,g
Half-width (ms) 1.2 � 0.03 1.1 � 0.03 0.6 � 0.04f,h
Values are the mean � SEM. Low-threshold bursting neuron properties are not represented in this table since n � 1 for this firing type. T, Threshold; 2T,twice threshold.ap 0.001 vs NA (two-tailed t test).bp 0.001 vs NA (Mann–Whitney test).cp 0.01 vs NA (Mann–Whitney test)dp 0.001 vs NA (two-tailed t test).ep 0.0001 vs Ac (two-tailed t test).fp 0.0001 vs NA (Mann–Whitney test).gp 0.001 vs Ac (Mann–Whitney test).hp 0.0001 vs Ac (Mann–Whitney test).
New Research 6 of 18
January/February 2017, 4(1) e0367-16.2017 eNeuro.org

from resting membrane potential, which was significantlymore depolarized in ES-Ac neurons, other membraneproperties such as input resistance, threshold potential,AP amplitude, rise time, and half-width did not differsignificantly between LF-NA and ES-Ac neurons(Table 1).
In the remaining 12 neurons (8%; Fig. 3), we found adistinct stuttering firing type that resembled that of someinterneurons in the BLA (Woodruff and Sah, 2007; Sos-ulina et al., 2010; Spampanato et al., 2011). These neu-rons were easily distinguishable due to their distinctivefiring pattern, with bursts of high-frequency APs (�60 Hz;
Figure 3 , Stuttering neurons in the CeL. A, Example trace of firing of a stuttering (S) neuron at threshold, and twice and three timesthreshold. In addition to its fast AP kinetics (Table 1) and distinct firing pattern, large fast afterhyperpolarizations (as indicated by thered arrowhead) are also typical of this firing type. Inset shows a closeup of a spontaneous EPSP (sEPSP) in green. B, Overlay of thefirst AP of a stuttering (red), LF-NA (black), and ES-Ac (blue) neurons. The AP rise time and half-width of S neurons were significantlyfaster than those of LF-NA and ES-Ac neurons (Table 1). C, sEPSPs in S neurons were significantly more numerous than in LF-NAand ES-Ac neurons during the hyperpolarizing steps of this protocol. Numbers shown are the total counted over the �60, �40, and�20 pA current injections (B; S vs LF-NA: p � 0.001, unpaired t test; S vs ES-Ac: p 0.0001, unpaired t test). D, Example biocytinrecovery of an S neuron, which was PKC�(�) (top inset, yellow arrowhead indicates the soma of the S neuron). Scale bars: 20 �m;top inset, 10 �m; bottom inset, 5 �m. This neuron displayed an extensive axon with inset showing a closeup of the axon in the dottedwhite square. E, Percentage of firing types for recovered neurons that were PKC�(�) (n � 8) or PKC�(�) (n � 17). F, Shows totalpercentage of each firing type.
New Research 7 of 18
January/February 2017, 4(1) e0367-16.2017 eNeuro.org
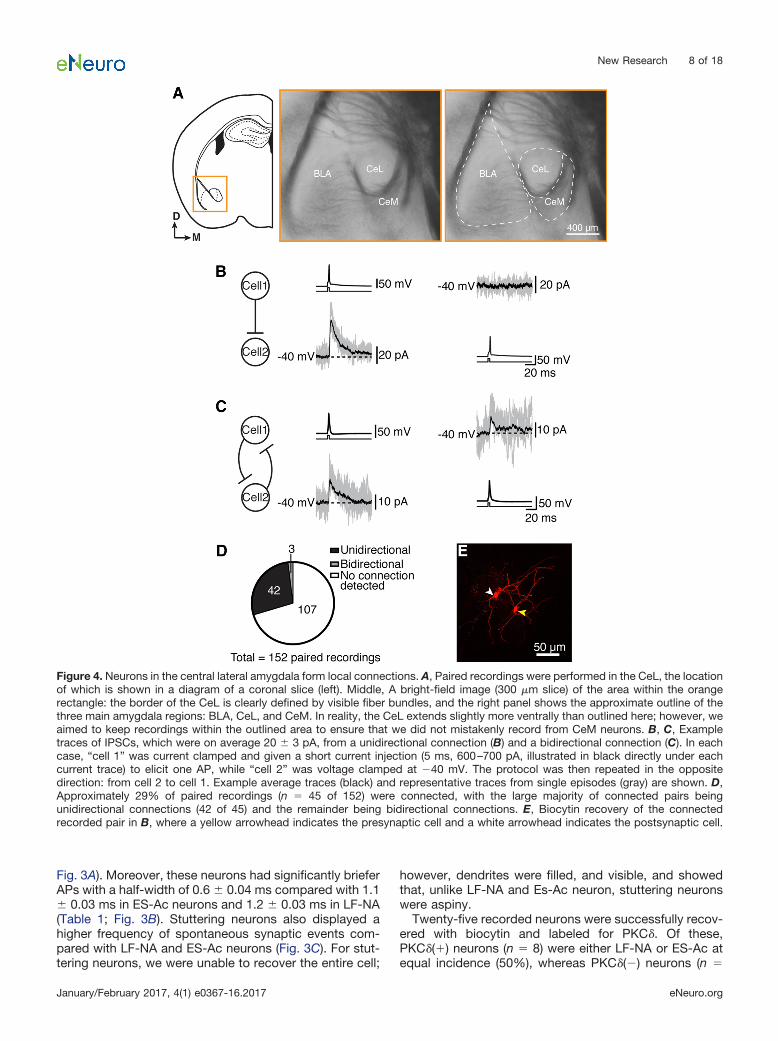
Fig. 3A). Moreover, these neurons had significantly brieferAPs with a half-width of 0.6 � 0.04 ms compared with 1.1� 0.03 ms in ES-Ac neurons and 1.2 � 0.03 ms in LF-NA(Table 1; Fig. 3B). Stuttering neurons also displayed ahigher frequency of spontaneous synaptic events com-pared with LF-NA and ES-Ac neurons (Fig. 3C). For stut-tering neurons, we were unable to recover the entire cell;
however, dendrites were filled, and visible, and showedthat, unlike LF-NA and Es-Ac neuron, stuttering neuronswere aspiny.
Twenty-five recorded neurons were successfully recov-ered with biocytin and labeled for PKC�. Of these,PKC�(�) neurons (n � 8) were either LF-NA or ES-Ac atequal incidence (50%), whereas PKC�(�) neurons (n �
Figure 4. Neurons in the central lateral amygdala form local connections. A, Paired recordings were performed in the CeL, the locationof which is shown in a diagram of a coronal slice (left). Middle, A bright-field image (300 �m slice) of the area within the orangerectangle: the border of the CeL is clearly defined by visible fiber bundles, and the right panel shows the approximate outline of thethree main amygdala regions: BLA, CeL, and CeM. In reality, the CeL extends slightly more ventrally than outlined here; however, weaimed to keep recordings within the outlined area to ensure that we did not mistakenly record from CeM neurons. B, C, Exampletraces of IPSCs, which were on average 20 � 3 pA, from a unidirectional connection (B) and a bidirectional connection (C). In eachcase, “cell 1” was current clamped and given a short current injection (5 ms, 600–700 pA, illustrated in black directly under eachcurrent trace) to elicit one AP, while “cell 2” was voltage clamped at �40 mV. The protocol was then repeated in the oppositedirection: from cell 2 to cell 1. Example average traces (black) and representative traces from single episodes (gray) are shown. D,Approximately 29% of paired recordings (n � 45 of 152) were connected, with the large majority of connected pairs beingunidirectional connections (42 of 45) and the remainder being bidirectional connections. E, Biocytin recovery of the connectedrecorded pair in B, where a yellow arrowhead indicates the presynaptic cell and a white arrowhead indicates the postsynaptic cell.
New Research 8 of 18
January/February 2017, 4(1) e0367-16.2017 eNeuro.org

Figure 5. Morphology and anatomic location of local connections within the central lateral amygdala. A, Example morphologicreconstruction (spines not depicted) of a connected pair with the presynaptic neuron in black and the postsynaptic neuron in gray.Blue arrowheads indicate where the presynaptic axon (red) crossed over a postsynaptic dendrite in the same z-plane, representingputative synapse locations. Inset shows average traces of this connection, with the presynaptic trace in black and the postsynaptictrace in gray (postsynaptic cell voltage clamped at �40 mV). B, Recovered neurons typically had a medium spiny morphology; spinecounts of recovered connected neurons showed that the postsynaptic neuron was not significantly more spiny than its presynapticneuron. Example images show closeups of secondary dendrites from a presynaptic (“Pre”) neuron and correspondingpostsynaptic (“Post”) neuron from the pair shown in A. Scale bar, 5 �m. Bar graph shows mean spine densities (number ofspines per micrometer) for presynaptic and postsynaptic neurons, with connected neurons joined by a dotted line (n � 3connected pairs). Data points with red borders correspond to the Pre and Post closeups depicted in B. C, Image of biocytinrecovery of the connected pair of neurons shown in A to show the location within the CeL. BA, Basal amygdala; D, dorsal; M,medial. Scale bar, 100 �m. D, Locations within the CeL (yellow; central medial amygdala is in white) of 35 recorded pairs thatcould be reliably located at different rostrocaudal locations (�1.22 to �1.70 mm from bregma; Di–Div). Presynaptic cells arerepresented by black circles, and postsynaptic cells are represented by solid gray circles. White circles indicate pairs where aconnection was not detected.
New Research 9 of 18
January/February 2017, 4(1) e0367-16.2017 eNeuro.org
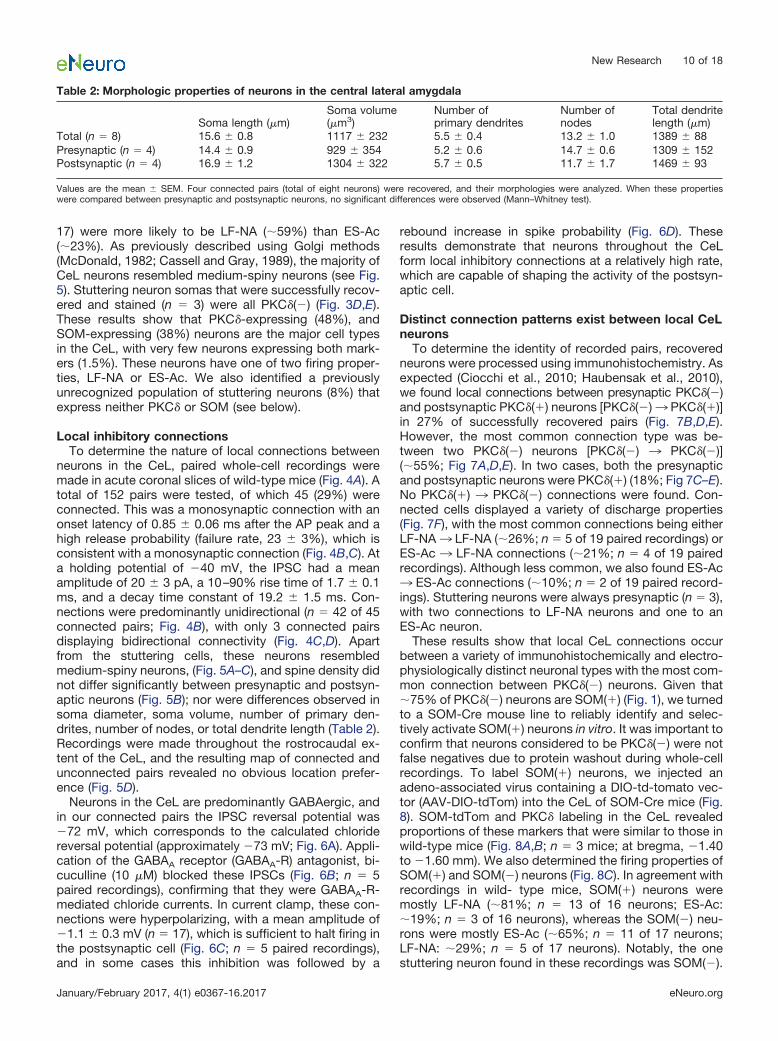
17) were more likely to be LF-NA (�59%) than ES-Ac(�23%). As previously described using Golgi methods(McDonald, 1982; Cassell and Gray, 1989), the majority ofCeL neurons resembled medium-spiny neurons (see Fig.5). Stuttering neuron somas that were successfully recov-ered and stained (n � 3) were all PKC�(�) (Fig. 3D,E).These results show that PKC�-expressing (48%), andSOM-expressing (38%) neurons are the major cell typesin the CeL, with very few neurons expressing both mark-ers (1.5%). These neurons have one of two firing proper-ties, LF-NA or ES-Ac. We also identified a previouslyunrecognized population of stuttering neurons (8%) thatexpress neither PKC� or SOM (see below).
Local inhibitory connectionsTo determine the nature of local connections between
neurons in the CeL, paired whole-cell recordings weremade in acute coronal slices of wild-type mice (Fig. 4A). Atotal of 152 pairs were tested, of which 45 (29%) wereconnected. This was a monosynaptic connection with anonset latency of 0.85 � 0.06 ms after the AP peak and ahigh release probability (failure rate, 23 � 3%), which isconsistent with a monosynaptic connection (Fig. 4B,C). Ata holding potential of �40 mV, the IPSC had a meanamplitude of 20 � 3 pA, a 10–90% rise time of 1.7 � 0.1ms, and a decay time constant of 19.2 � 1.5 ms. Con-nections were predominantly unidirectional (n � 42 of 45connected pairs; Fig. 4B), with only 3 connected pairsdisplaying bidirectional connectivity (Fig. 4C,D). Apartfrom the stuttering cells, these neurons resembledmedium-spiny neurons, (Fig. 5A–C), and spine density didnot differ significantly between presynaptic and postsyn-aptic neurons (Fig. 5B); nor were differences observed insoma diameter, soma volume, number of primary den-drites, number of nodes, or total dendrite length (Table 2).Recordings were made throughout the rostrocaudal ex-tent of the CeL, and the resulting map of connected andunconnected pairs revealed no obvious location prefer-ence (Fig. 5D).
Neurons in the CeL are predominantly GABAergic, andin our connected pairs the IPSC reversal potential was�72 mV, which corresponds to the calculated chloridereversal potential (approximately �73 mV; Fig. 6A). Appli-cation of the GABAA receptor (GABAA-R) antagonist, bi-cuculline (10 �M) blocked these IPSCs (Fig. 6B; n � 5paired recordings), confirming that they were GABAA-R-mediated chloride currents. In current clamp, these con-nections were hyperpolarizing, with a mean amplitude of�1.1 � 0.3 mV (n � 17), which is sufficient to halt firing inthe postsynaptic cell (Fig. 6C; n � 5 paired recordings),and in some cases this inhibition was followed by a
rebound increase in spike probability (Fig. 6D). Theseresults demonstrate that neurons throughout the CeLform local inhibitory connections at a relatively high rate,which are capable of shaping the activity of the postsyn-aptic cell.
Distinct connection patterns exist between local CeLneurons
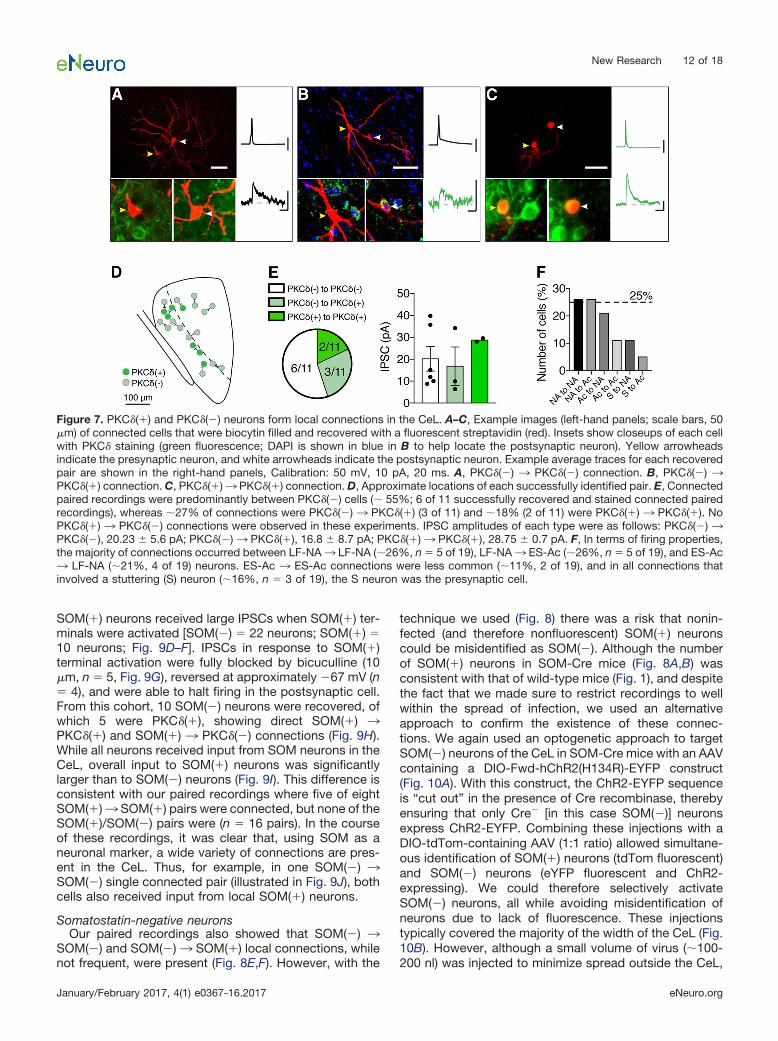
To determine the identity of recorded pairs, recoveredneurons were processed using immunohistochemistry. Asexpected (Ciocchi et al., 2010; Haubensak et al., 2010),we found local connections between presynaptic PKC�(�)and postsynaptic PKC�(�) neurons [PKC�(�) ¡ PKC�(�)]in 27% of successfully recovered pairs (Fig. 7B,D,E).However, the most common connection type was be-tween two PKC�(�) neurons [PKC�(�) ¡ PKC�(�)](�55%; Fig 7A,D,E). In two cases, both the presynapticand postsynaptic neurons were PKC�(�) (18%; Fig 7C–E).No PKC�(�) ¡ PKC�(�) connections were found. Con-nected cells displayed a variety of discharge properties(Fig. 7F), with the most common connections being eitherLF-NA ¡ LF-NA (�26%; n � 5 of 19 paired recordings) orES-Ac ¡ LF-NA connections (�21%; n � 4 of 19 pairedrecordings). Although less common, we also found ES-Ac¡ ES-Ac connections (�10%; n � 2 of 19 paired record-ings). Stuttering neurons were always presynaptic (n � 3),with two connections to LF-NA neurons and one to anES-Ac neuron.
These results show that local CeL connections occurbetween a variety of immunohistochemically and electro-physiologically distinct neuronal types with the most com-mon connection between PKC�(�) neurons. Given that�75% of PKC�(�) neurons are SOM(�) (Fig. 1), we turnedto a SOM-Cre mouse line to reliably identify and selec-tively activate SOM(�) neurons in vitro. It was important toconfirm that neurons considered to be PKC�(�) were notfalse negatives due to protein washout during whole-cellrecordings. To label SOM(�) neurons, we injected anadeno-associated virus containing a DIO-td-tomato vec-tor (AAV-DIO-tdTom) into the CeL of SOM-Cre mice (Fig.8). SOM-tdTom and PKC� labeling in the CeL revealedproportions of these markers that were similar to those inwild-type mice (Fig. 8A,B; n � 3 mice; at bregma, �1.40to �1.60 mm). We also determined the firing properties ofSOM(�) and SOM(�) neurons (Fig. 8C). In agreement withrecordings in wild- type mice, SOM(�) neurons weremostly LF-NA (�81%; n � 13 of 16 neurons; ES-Ac:�19%; n � 3 of 16 neurons), whereas the SOM(�) neu-rons were mostly ES-Ac (�65%; n � 11 of 17 neurons;LF-NA: �29%; n � 5 of 17 neurons). Notably, the onestuttering neuron found in these recordings was SOM(�).
Table 2: Morphologic properties of neurons in the central lateral amygdala
Soma length (�m)Soma volume(�m3)
Number ofprimary dendrites
Number ofnodes
Total dendritelength (�m)
Total (n � 8) 15.6 � 0.8 1117 � 232 5.5 � 0.4 13.2 � 1.0 1389 � 88Presynaptic (n � 4) 14.4 � 0.9 929 � 354 5.2 � 0.6 14.7 � 0.6 1309 � 152Postsynaptic (n � 4) 16.9 � 1.2 1304 � 322 5.7 � 0.5 11.7 � 1.7 1469 � 93
Values are the mean � SEM. Four connected pairs (total of eight neurons) were recovered, and their morphologies were analyzed. When these propertieswere compared between presynaptic and postsynaptic neurons, no significant differences were observed (Mann–Whitney test).
New Research 10 of 18
January/February 2017, 4(1) e0367-16.2017 eNeuro.org
Given that the stuttering neurons observed in wild-typemice were PKC�(�), it is possible that these neurons area major contributor to the population of PKC�(�)/SOM(�)neurons.
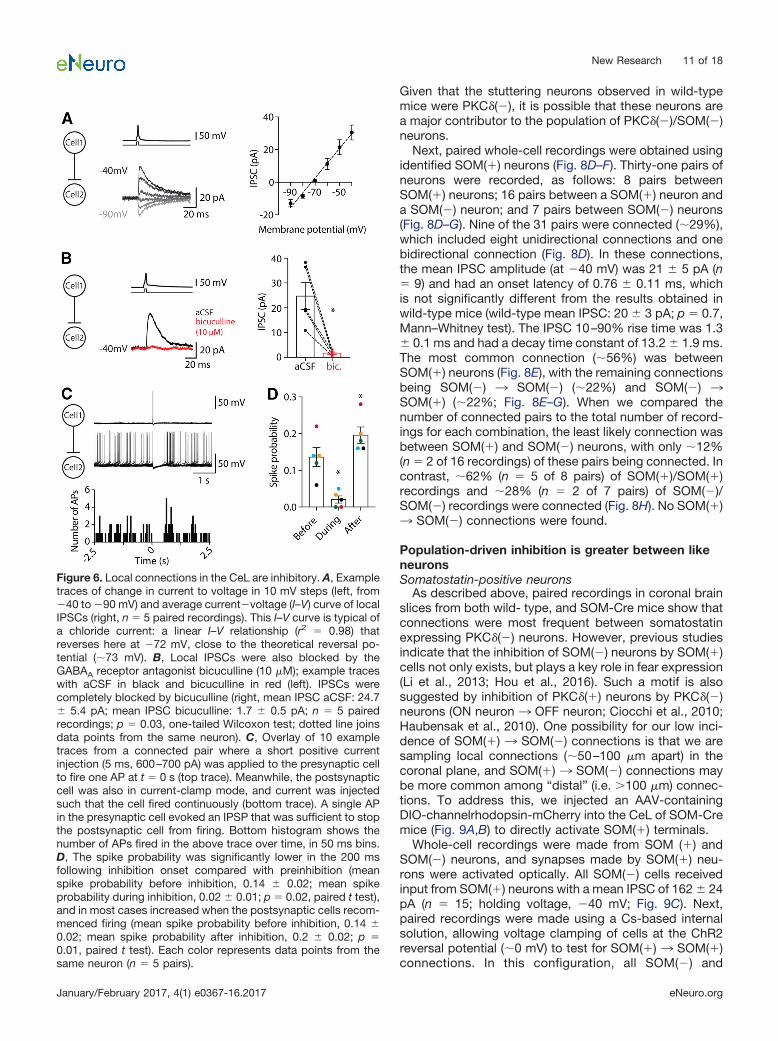
Next, paired whole-cell recordings were obtained usingidentified SOM(�) neurons (Fig. 8D–F). Thirty-one pairs ofneurons were recorded, as follows: 8 pairs betweenSOM(�) neurons; 16 pairs between a SOM(�) neuron anda SOM(�) neuron; and 7 pairs between SOM(�) neurons(Fig. 8D–G). Nine of the 31 pairs were connected (�29%),which included eight unidirectional connections and onebidirectional connection (Fig. 8D). In these connections,the mean IPSC amplitude (at �40 mV) was 21 � 5 pA (n� 9) and had an onset latency of 0.76 � 0.11 ms, whichis not significantly different from the results obtained inwild-type mice (wild-type mean IPSC: 20 � 3 pA; p � 0.7,Mann–Whitney test). The IPSC 10–90% rise time was 1.3� 0.1 ms and had a decay time constant of 13.2 � 1.9 ms.The most common connection (�56%) was betweenSOM(�) neurons (Fig. 8E), with the remaining connectionsbeing SOM(�) ¡ SOM(�) (�22%) and SOM(�) ¡SOM(�) (�22%; Fig. 8E–G). When we compared thenumber of connected pairs to the total number of record-ings for each combination, the least likely connection wasbetween SOM(�) and SOM(�) neurons, with only �12%(n � 2 of 16 recordings) of these pairs being connected. Incontrast, �62% (n � 5 of 8 pairs) of SOM(�)/SOM(�)recordings and �28% (n � 2 of 7 pairs) of SOM(�)/SOM(�) recordings were connected (Fig. 8H). No SOM(�)¡ SOM(�) connections were found.
Population-driven inhibition is greater between likeneuronsSomatostatin-positive neurons
As described above, paired recordings in coronal brainslices from both wild- type, and SOM-Cre mice show thatconnections were most frequent between somatostatinexpressing PKC�(�) neurons. However, previous studiesindicate that the inhibition of SOM(�) neurons by SOM(�)cells not only exists, but plays a key role in fear expression(Li et al., 2013; Hou et al., 2016). Such a motif is alsosuggested by inhibition of PKC�(�) neurons by PKC�(�)neurons (ON neuron ¡ OFF neuron; Ciocchi et al., 2010;Haubensak et al., 2010). One possibility for our low inci-dence of SOM(�) ¡ SOM(�) connections is that we aresampling local connections (�50–100 �m apart) in thecoronal plane, and SOM(�) ¡ SOM(�) connections maybe more common among “distal” (i.e. �100 �m) connec-tions. To address this, we injected an AAV-containingDIO-channelrhodopsin-mCherry into the CeL of SOM-Cremice (Fig. 9A,B) to directly activate SOM(�) terminals.
Whole-cell recordings were made from SOM (�) andSOM(�) neurons, and synapses made by SOM(�) neu-rons were activated optically. All SOM(�) cells receivedinput from SOM(�) neurons with a mean IPSC of 162 � 24pA (n � 15; holding voltage, �40 mV; Fig. 9C). Next,paired recordings were made using a Cs-based internalsolution, allowing voltage clamping of cells at the ChR2reversal potential (�0 mV) to test for SOM(�) ¡ SOM(�)connections. In this configuration, all SOM(�) and
Figure 6. Local connections in the CeL are inhibitory. A, Exampletraces of change in current to voltage in 10 mV steps (left, from�40 to �90 mV) and average current�voltage (I–V) curve of localIPSCs (right, n � 5 paired recordings). This I–V curve is typical ofa chloride current: a linear I–V relationship (r2 � 0.98) thatreverses here at �72 mV, close to the theoretical reversal po-tential (�73 mV). B, Local IPSCs were also blocked by theGABAA receptor antagonist bicuculline (10 �M); example traceswith aCSF in black and bicuculline in red (left). IPSCs werecompletely blocked by bicuculline (right, mean IPSC aCSF: 24.7� 5.4 pA; mean IPSC bicuculline: 1.7 � 0.5 pA; n � 5 pairedrecordings; p � 0.03, one-tailed Wilcoxon test; dotted line joinsdata points from the same neuron). C, Overlay of 10 exampletraces from a connected pair where a short positive currentinjection (5 ms, 600–700 pA) was applied to the presynaptic cellto fire one AP at t � 0 s (top trace). Meanwhile, the postsynapticcell was also in current-clamp mode, and current was injectedsuch that the cell fired continuously (bottom trace). A single APin the presynaptic cell evoked an IPSP that was sufficient to stopthe postsynaptic cell from firing. Bottom histogram shows thenumber of APs fired in the above trace over time, in 50 ms bins.D, The spike probability was significantly lower in the 200 msfollowing inhibition onset compared with preinhibition (meanspike probability before inhibition, 0.14 � 0.02; mean spikeprobability during inhibition, 0.02 � 0.01; p � 0.02, paired t test),and in most cases increased when the postsynaptic cells recom-menced firing (mean spike probability before inhibition, 0.14 �0.02; mean spike probability after inhibition, 0.2 � 0.02; p �0.01, paired t test). Each color represents data points from thesame neuron (n � 5 pairs).
New Research 11 of 18
January/February 2017, 4(1) e0367-16.2017 eNeuro.org
SOM(�) neurons received large IPSCs when SOM(�) ter-minals were activated [SOM(�) � 22 neurons; SOM(�) �10 neurons; Fig. 9D–F]. IPSCs in response to SOM(�)terminal activation were fully blocked by bicuculline (10�m, n � 5, Fig. 9G), reversed at approximately �67 mV (n� 4), and were able to halt firing in the postsynaptic cell.From this cohort, 10 SOM(�) neurons were recovered, ofwhich 5 were PKC�(�), showing direct SOM(�) ¡PKC�(�) and SOM(�) ¡ PKC�(�) connections (Fig. 9H).While all neurons received input from SOM neurons in theCeL, overall input to SOM(�) neurons was significantlylarger than to SOM(�) neurons (Fig. 9I). This difference isconsistent with our paired recordings where five of eightSOM(�) ¡ SOM(�) pairs were connected, but none of theSOM(�)/SOM(�) pairs were (n � 16 pairs). In the courseof these recordings, it was clear that, using SOM as aneuronal marker, a wide variety of connections are pres-ent in the CeL. Thus, for example, in one SOM(�) ¡SOM(�) single connected pair (illustrated in Fig. 9J), bothcells also received input from local SOM(�) neurons.
Somatostatin-negative neuronsOur paired recordings also showed that SOM(�) ¡
SOM(�) and SOM(�) ¡ SOM(�) local connections, whilenot frequent, were present (Fig. 8E,F). However, with the
technique we used (Fig. 8) there was a risk that nonin-fected (and therefore nonfluorescent) SOM(�) neuronscould be misidentified as SOM(�). Although the numberof SOM(�) neurons in SOM-Cre mice (Fig. 8A,B) wasconsistent with that of wild-type mice (Fig. 1), and despitethe fact that we made sure to restrict recordings to wellwithin the spread of infection, we used an alternativeapproach to confirm the existence of these connec-tions. We again used an optogenetic approach to targetSOM(�) neurons of the CeL in SOM-Cre mice with an AAVcontaining a DIO-Fwd-hChR2(H134R)-EYFP construct(Fig. 10A). With this construct, the ChR2-EYFP sequenceis “cut out” in the presence of Cre recombinase, therebyensuring that only Cre� [in this case SOM(�)] neuronsexpress ChR2-EYFP. Combining these injections with aDIO-tdTom-containing AAV (1:1 ratio) allowed simultane-ous identification of SOM(�) neurons (tdTom fluorescent)and SOM(�) neurons (eYFP fluorescent and ChR2-expressing). We could therefore selectively activateSOM(�) neurons, all while avoiding misidentification ofneurons due to lack of fluorescence. These injectionstypically covered the majority of the width of the CeL (Fig.10B). However, although a small volume of virus (�100-200 nl) was injected to minimize spread outside the CeL,
Figure 7. PKC�(�) and PKC�(�) neurons form local connections in the CeL. A–C, Example images (left-hand panels; scale bars, 50�m) of connected cells that were biocytin filled and recovered with a fluorescent streptavidin (red). Insets show closeups of each cellwith PKC� staining (green fluorescence; DAPI is shown in blue in B to help locate the postsynaptic neuron). Yellow arrowheadsindicate the presynaptic neuron, and white arrowheads indicate the postsynaptic neuron. Example average traces for each recoveredpair are shown in the right-hand panels, Calibration: 50 mV, 10 pA, 20 ms. A, PKC�(�) ¡ PKC�(�) connection. B, PKC�(�) ¡PKC�(�) connection. C, PKC�(�) ¡ PKC�(�) connection. D, Approximate locations of each successfully identified pair. E, Connectedpaired recordings were predominantly between PKC�(�) cells (� 55%; 6 of 11 successfully recovered and stained connected pairedrecordings), whereas �27% of connections were PKC�(�) ¡ PKC�(�) (3 of 11) and �18% (2 of 11) were PKC�(�) ¡ PKC�(�). NoPKC�(�) ¡ PKC�(�) connections were observed in these experiments. IPSC amplitudes of each type were as follows: PKC�(�) ¡PKC�(�), 20.23 � 5.6 pA; PKC�(�) ¡ PKC�(�), 16.8 � 8.7 pA; PKC�(�) ¡ PKC�(�), 28.75 � 0.7 pA. F, In terms of firing properties,the majority of connections occurred between LF-NA ¡ LF-NA (�26%, n � 5 of 19), LF-NA ¡ ES-Ac (�26%, n � 5 of 19), and ES-Ac¡ LF-NA (�21%, 4 of 19) neurons. ES-Ac ¡ ES-Ac connections were less common (�11%, 2 of 19), and in all connections thatinvolved a stuttering (S) neuron (�16%, n � 3 of 19), the S neuron was the presynaptic cell.
New Research 12 of 18
January/February 2017, 4(1) e0367-16.2017 eNeuro.org

Figure 8. Somatostatin-positive neurons form local connections in the central lateral amygdala of somatostatin-cre mice. The CeL ofSOM-Cre C57BL/6J mice was injected with an AAV-DIO-tdtomato to fluorescently label SOM(�) cells. A, Subsections (50 �m thick)of injected CeL were stained with a NeuN antibody and a PKC� antibody. Representative sections at bregma �1.60 mm are shown.B, NeuN-positive cells were counted for PKC� and SOM labeling; 47 � 3% (mean, n � 122 � 27 neurons/1.3 10�3 mm3) of totalcounted neurons were PKC�(�) but SOM(�), whereas 39 � 1% (mean, n � 100 � 16 neurons/1.3 10�3 mm3) of total neurons wereSOM(�)/PKC�(�), with very little overlap [i.e., SOM(�) and PKC�(�): 2 � 1% (mean, n � 3 � 1 neurons/1.3 10�3 mm3) and 12 �1% negative for both (mean, n � 32 � 6 neurons/1.3 10�3 mm3)]. C, Whole-cell recordings were performed and complete firingproperties for 33 neurons were recorded from SOM(�) and SOM(�) neurons. As with wild-type mice LF-NA (�55%), ES-Ac (�42%)and stuttering (S; 3%) neurons were observed. SOM(�) neurons were mostly ES-Ac (�65%, LF-NA 29%, S 6%, n � 17 neurons),whereas SOM(�) neurons were mostly LF-NA (�81%, ES-Ac 19%, n � 16 neurons). D, �29% of paired recordings showed eithera unidirectional (n � 8 paired recordings) or bidirectional (n � 1 paired recording) connection, whereas in 71% of recordings noconnection was detected. E, Unidirectional connections were observed between different combinations of SOM(�) and SOM(�)neurons: SOM(�) ¡ SOM(�) (n � 2); SOM(�) ¡ SOM(�) (n � 4); SOM(�) ¡ SOM(�) (n � 2); and one bidirectional connection wasrecorded that occurred between two SOM(�) neurons. Calibration: 50 mV, 20 pA, 20 ms. Current injection applied to the presynapticcell is illustrated in black under each trace. F, Shows IPSC amplitudes for each connection type: SOM(�) ¡ SOM(�) mean amplitude,23.5 pA (n � 2 pairs); SOM(�) ¡ SOM(�) mean amplitude, 24.9 � 7.3 pA (n � 5 pairs – 4 unidirectional IPSCs, 2 bidirectional IPSCs);SOM(�) ¡ SOM(�) mean amplitude, 6.6 pA (n � 2 pairs). Gray dots represent IPSCs from the bidirectional connection. G, Diagramshowing the approximate location of connected paired recordings within the CeL. H, Shows the number of paired recordings wherea connection either was or was not detected for each SOM(�) and SOM(�) combination. A connection was more likely to be observedwhen recording from two SOM(�) neurons (�62% connection success rate) as opposed to a SOM(�) ¡ SOM(�) (�12% connectionsuccess rate) or a SOM(�) ¡ SOM(�) combination (�28% connection success rate).
New Research 13 of 18
January/February 2017, 4(1) e0367-16.2017 eNeuro.org

Figure 9. Channelrhodopsin activation of SOM terminals in the central lateral amygdala. A, AAV-DIO-channelrhodopsin-mCherry was injectedinto the CeL of SOM-Cre C57BL/6J mice. B, Example image of fluorescence of injection site in the CeL (BA, basal amygdala; CeM). C, Using aKMeSO4 internal solution (K-Me), we recorded responses from SOM(�) cells in response to a short light pulse (2 ms, 470 nm; blue rectangle;example voltage-clamp traces at �40 and �70 mV), resulting in an IPSC (mean amplitude: 162 � 24 pA, n � 15 cells). D–F, To determine whetherall cell types received inhibition from SOM(�) CeL neurons, we also used a cesium-based internal solution (Cs), allowing voltage clamping at 0mV (ChR reversal potential); average traces are shown in black, and example individual traces are shown in gray. SOM(�) neurons responded withlarge IPSCs in response to light activation (D), as did SOM(�) cells (E). F, Light-activated IPSCs were detected in 100% of SOM(�) cells (n � 10neurons) and 100% of SOM(�) cells (n � 22). The overall mean amplitude in SOM(�) neurons was 1358 � 231 pA (n � 10 neurons; light pulse:2 ms, 470 nm), and the mean amplitude in SOM(�) neurons was 609 � 202 pA (n � 12, light pulse 2 ms, 470 ms; the remaining 10 neurons weretested with a 1 ms light pulse: mean amplitude 294 � 70 pA). G, Bicuculline (10 �M) blocked SOM(�)-driven IPSCs (aCSF mean amplitude, 450� 206 pA; bicuculline mean amplitude, 11 � 4 pA; p � 0.04, one-tailed paired t test). H, SOM(�) neurons that received SOM(�)-driven inhibitionwere recovered and stained for PKC� (n � 10 neurons). Five of these neurons were PKC�(�), while the remainder were PKC�(�). Example images
New Research 14 of 18
January/February 2017, 4(1) e0367-16.2017 eNeuro.org
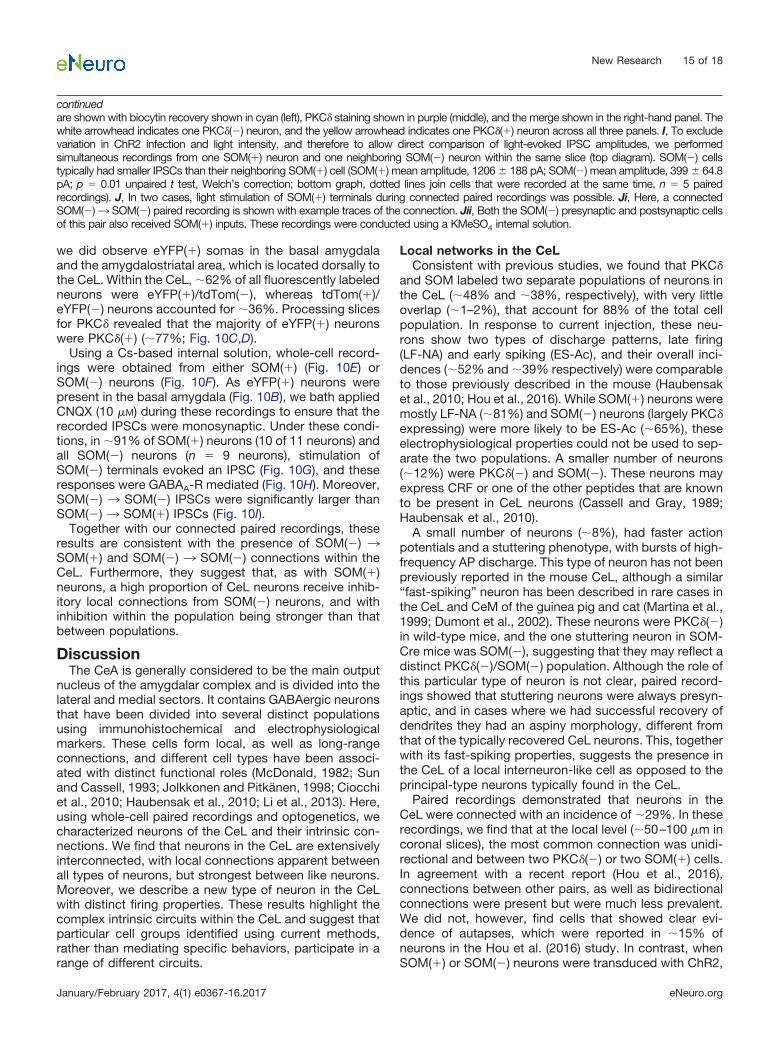
we did observe eYFP(�) somas in the basal amygdalaand the amygdalostriatal area, which is located dorsally tothe CeL. Within the CeL, �62% of all fluorescently labeledneurons were eYFP(�)/tdTom(�), whereas tdTom(�)/eYFP(�) neurons accounted for �36%. Processing slicesfor PKC� revealed that the majority of eYFP(�) neuronswere PKC�(�) (�77%; Fig. 10C,D).
Using a Cs-based internal solution, whole-cell record-ings were obtained from either SOM(�) (Fig. 10E) orSOM(�) neurons (Fig. 10F). As eYFP(�) neurons werepresent in the basal amygdala (Fig. 10B), we bath appliedCNQX (10 �M) during these recordings to ensure that therecorded IPSCs were monosynaptic. Under these condi-tions, in �91% of SOM(�) neurons (10 of 11 neurons) andall SOM(�) neurons (n � 9 neurons), stimulation ofSOM(�) terminals evoked an IPSC (Fig. 10G), and theseresponses were GABAA-R mediated (Fig. 10H). Moreover,SOM(�) ¡ SOM(�) IPSCs were significantly larger thanSOM(�) ¡ SOM(�) IPSCs (Fig. 10I).
Together with our connected paired recordings, theseresults are consistent with the presence of SOM(�) ¡SOM(�) and SOM(�) ¡ SOM(�) connections within theCeL. Furthermore, they suggest that, as with SOM(�)neurons, a high proportion of CeL neurons receive inhib-itory local connections from SOM(�) neurons, and withinhibition within the population being stronger than thatbetween populations.
DiscussionThe CeA is generally considered to be the main output
nucleus of the amygdalar complex and is divided into thelateral and medial sectors. It contains GABAergic neuronsthat have been divided into several distinct populationsusing immunohistochemical and electrophysiologicalmarkers. These cells form local, as well as long-rangeconnections, and different cell types have been associ-ated with distinct functional roles (McDonald, 1982; Sunand Cassell, 1993; Jolkkonen and Pitkänen, 1998; Ciocchiet al., 2010; Haubensak et al., 2010; Li et al., 2013). Here,using whole-cell paired recordings and optogenetics, wecharacterized neurons of the CeL and their intrinsic con-nections. We find that neurons in the CeL are extensivelyinterconnected, with local connections apparent betweenall types of neurons, but strongest between like neurons.Moreover, we describe a new type of neuron in the CeLwith distinct firing properties. These results highlight thecomplex intrinsic circuits within the CeL and suggest thatparticular cell groups identified using current methods,rather than mediating specific behaviors, participate in arange of different circuits.
Local networks in the CeLConsistent with previous studies, we found that PKC�
and SOM labeled two separate populations of neurons inthe CeL (�48% and �38%, respectively), with very littleoverlap (�1–2%), that account for 88% of the total cellpopulation. In response to current injection, these neu-rons show two types of discharge patterns, late firing(LF-NA) and early spiking (ES-Ac), and their overall inci-dences (�52% and �39% respectively) were comparableto those previously described in the mouse (Haubensaket al., 2010; Hou et al., 2016). While SOM(�) neurons weremostly LF-NA (�81%) and SOM(�) neurons (largely PKC�expressing) were more likely to be ES-Ac (�65%), theseelectrophysiological properties could not be used to sep-arate the two populations. A smaller number of neurons(�12%) were PKC�(�) and SOM(�). These neurons mayexpress CRF or one of the other peptides that are knownto be present in CeL neurons (Cassell and Gray, 1989;Haubensak et al., 2010).
A small number of neurons (�8%), had faster actionpotentials and a stuttering phenotype, with bursts of high-frequency AP discharge. This type of neuron has not beenpreviously reported in the mouse CeL, although a similar“fast-spiking” neuron has been described in rare cases inthe CeL and CeM of the guinea pig and cat (Martina et al.,1999; Dumont et al., 2002). These neurons were PKC�(�)in wild-type mice, and the one stuttering neuron in SOM-Cre mice was SOM(�), suggesting that they may reflect adistinct PKC�(�)/SOM(�) population. Although the role ofthis particular type of neuron is not clear, paired record-ings showed that stuttering neurons were always presyn-aptic, and in cases where we had successful recovery ofdendrites they had an aspiny morphology, different fromthat of the typically recovered CeL neurons. This, togetherwith its fast-spiking properties, suggests the presence inthe CeL of a local interneuron-like cell as opposed to theprincipal-type neurons typically found in the CeL.
Paired recordings demonstrated that neurons in theCeL were connected with an incidence of �29%. In theserecordings, we find that at the local level (�50–100 �m incoronal slices), the most common connection was unidi-rectional and between two PKC�(�) or two SOM(�) cells.In agreement with a recent report (Hou et al., 2016),connections between other pairs, as well as bidirectionalconnections were present but were much less prevalent.We did not, however, find cells that showed clear evi-dence of autapses, which were reported in �15% ofneurons in the Hou et al. (2016) study. In contrast, whenSOM(�) or SOM(�) neurons were transduced with ChR2,
continuedare shown with biocytin recovery shown in cyan (left), PKC� staining shown in purple (middle), and the merge shown in the right-hand panel. Thewhite arrowhead indicates one PKC�(�) neuron, and the yellow arrowhead indicates one PKC�(�) neuron across all three panels. I, To excludevariation in ChR2 infection and light intensity, and therefore to allow direct comparison of light-evoked IPSC amplitudes, we performedsimultaneous recordings from one SOM(�) neuron and one neighboring SOM(�) neuron within the same slice (top diagram). SOM(�) cellstypically had smaller IPSCs than their neighboring SOM(�) cell (SOM(�) mean amplitude, 1206 � 188 pA; SOM(�) mean amplitude, 399 � 64.8pA; p � 0.01 unpaired t test, Welch’s correction; bottom graph, dotted lines join cells that were recorded at the same time, n � 5 pairedrecordings). J, In two cases, light stimulation of SOM(�) terminals during connected paired recordings was possible. Ji, Here, a connectedSOM(�) ¡ SOM(�) paired recording is shown with example traces of the connection. Jii, Both the SOM(�) presynaptic and postsynaptic cellsof this pair also received SOM(�) inputs. These recordings were conducted using a KMeSO4 internal solution.
New Research 15 of 18
January/February 2017, 4(1) e0367-16.2017 eNeuro.org

Figure 10. Channelrhodopsin activation of SOM(�) terminals in the CeL of SOM-cre mice. A, to confirm whether SOM(�) neurons inthe CeL also form local connections, we injected an AAV-forward-channelrhodopsin-eYFP mixed with an AAV-DIO-tdTomato into theCeL of SOM-cre mice; infected SOM(�) neurons express ChR2-eYFP but not tdTomato (tdTom), whereas SOM(�) neurons expresstdTom but not ChR2-EYFP. B, Example image of maximal spread of ChR2-YFP expression at the injection site; the area showncorresponds to the orange square in A. Although the injection covered the majority of the CeL (outlined in white), eYFP(�) somas canstill be seen above the CeL and in the BA. Scale bar, 200 �m. Dorsal (D) and medial (M) orientation are shown in the bottom left corner.C, Closeups of the CeL in slices that were also stained for PKC�. ChR2-eYFP (green), tdTom (red), PKC� (purple), and merged panelsare shown (BA, basal amygdala). Scale bar, 100 �m. Insets in the merged panel show closeups of two neurons from a merged imageof eYFP and tdTom stainings (top) and a merged image of eYFP and PKC� staining (bottom). Arrowheads indicate the same neuronsin both insets: a tdTom(�)/eYFP(�) neuron that was PKC�(�) (white arrowhead), and a tdTom(�)/eYFP(�) neuron that was PKC�(�)(yellow arrowhead). D, Neurons were counted; 62% were eYFP(�)/tdTom(�) (mean n � 67 � 5 neurons/0.9 10�3 mm3), and 36%were eYFP(�)/tdTom(�) (mean n � 39 � 4 neurons/0.9 10�3 mm3). Theoretically, there should be no overlap of eYFP(�) andtdTom(�) as the presence of Cre recombinase should either allow the expression of tdTom or prevent the expression of ChR2-eYFP.In reality, however, we did observe an overlap between eYFP(�) and SOM(�) neurons, although this was only �2% of fluorescentlylabeled neurons, which represented one to three neurons per 0.9 10�3 mm3 of CeL. The majority of eYFP(�) neurons were alsoPKC�(�) (77%; mean, n � 51 � 2 neurons/0.9 10�3 mm3), whereas 23% (mean, n � 16 � 5 neurons/0.9 10�3 mm3) werePKC�(�). E, F, Whole-cell recordings (CsMeSO4 internal solution) of SOM(�) (E) and SOM(�) neurons (F) revealed that both neuronaltypes displayed light-activated IPSCs from SOM(�) neurons (SOM(�) mean amplitude: 73.0 � 19.7 pA; SOM(�) mean amplitude:427.2 � 77.8 pA). Example traces are shown with average traces in black and example individual traces in gray. G, Ten of 11 (91%)recorded SOM(�) neurons showed a response to light activation of SOM(�) terminals, whereas 9 of 9 of SOM(�) neurons receivedinhibitory terminals. H, Bicuculline (10 �M) blocked SOM(�)-driven IPSCs (aCSF mean amplitude, 375 � 137 pA; bicuculline meanamplitude, 16 � 7 pA; p � 0.03, one-tailed paired t test). I, As with our previous experiments, paired recordings between a SOM(�)neuron and a neighboring SOM(�) neuron allowed us to compare IPSC amplitudes from these two cell types (left diagram). Theserecordings showed that the amplitude of ChR2-driven SOM(�) ¡ SOM(�) IPSCs was significantly greater than that of ChR2-drivenSOM(�) ¡ SOM(�) IPSCs (mean SOM(�) amplitude, 68 � 18 pA; mean SOM(�) amplitude, 603 � 81 pA; p � 0.002 unpaired t test,Welch’s correction).
New Research 16 of 18
January/February 2017, 4(1) e0367-16.2017 eNeuro.org

we found that nearly all cells received a large input fromboth cell types. This difference in connectivity indicatesthat neurons make long-range connections within theCeL, perhaps in the rostrocaudal plane.
For the SOM neurons, using paired recordings, themonosynaptic connection had a mean amplitude of �20pA (at �40 mV), whereas when SOM neurons were trans-duced with ChR2, the optically driven IPSC had a meanamplitude of �160 pA, showing that on average approx-imately eight SOM(�) neurons innervate each SOM(�)neuron. In paired recordings, the IPSC had rapid risetimes, suggesting that these contacts were likely to besomatic, or close to the soma (Delaney and Sah, 2001),which is consistent with the ability of these connections tohalt spiking.
The CeL and behaviorThe role of the CeL in cued fear expression is clear: a
large body of data supports a model whereby conditionedstimulus-mediated disinhibition of CeM output drivesconditioned fear (Ciocchi et al., 2010; Haubensak et al.,2010; Li et al., 2013). However, it remains unclear how thehigh level of CeL connectivity (both intra-CeL and extra-CeL afferents) can be reconciled with the increasing num-ber of important behaviors in which CeL activity has beenimplicated. For example, fear expression has also beensuggested to require activation of the parabrachial nu-cleus (PB) input to the CeL (Han et al., 2015; Sato et al.,2015), and yet this PB ¡ CeL circuit has also beenimplicated in appetite suppression (Carter et al., 2013; Caiet al., 2014). Meanwhile, other CeL circuits have beenshown to underlie the switch between innate and condi-tioned fear (Isosaka et al., 2015), and anxiety generaliza-tion (Botta et al., 2015). Last, as well as forming localinhibitory connections (Li et al., 2013), SOM(�) neuronsare also projection neurons that target the PAG (Penzoet al., 2014), and this CeA ¡ PAG projection is engagedin mediating defensive behaviors (Tovote et al., 2016). Wehave shown that these neurons are also highly intercon-nected both within and between distinct neuronal popu-lations. Our results suggest that within the CeL, neithercytosolic markers (PKC� and SOM) nor their electrophys-iological properties alone can be used to identify cellsengaged in particular behavioral roles.
The physiologic role, if any, of SOM and PKC� are notknown; however, they clearly label separate populationsof neurons in the CeL. Developmentally, the CeL has astriatal origin (Medina et al., 2011), and SOM and PKC�,rather than specifying different populations that mediateddifferent functional roles, should be thought of as lineagemarkers. We suggest that PKC�-expressing and SOM-expressing neurons form heterogeneous populations ofneurons, with different populations contributing to differ-ent behavioral outcomes. Understanding the flow of infor-mation through the CeA and its outputs, in a behaviorallyspecific and relevant manner, will be a challenge for futureexperiments. Similarly, it will be important to take theseadditional local circuits into account in further investiga-tions of the CeL circuitry, particularly when judging the
effects of pharmacological treatments during in vivo stud-ies.
ReferencesAmano T, Amir A, Goswami S, Pare D (2012) Morphology, PKC�
expression, and synaptic responsiveness of different types of ratcentral lateral amygdala neurons. J Neurophysiol 108:3196–3205.CrossRef Medline
Apostolides PF, Trussell LO (2013) Rapid, activity-independent turn-over of vesicular transmitter content at a mixed glycine/GABAsynapse. J Neurosci 33:4768–4781. CrossRef
Botta P, Demmou L, Kasugai Y, Markovic M, Xu C, Fadok JP, Lu T,Poe MM, Xu L, Cook JM, Rudolph U, Sah P, Ferraguti F, Lüthi A(2015) Regulating anxiety with extrasynaptic inhibition. Nat Neu-rosci 18:1493–1500. CrossRef Medline
Cai H, Haubensak W, Anthony TE, Anderson DJ (2014) Centralamygdala PKC-�(�) neurons mediate the influence of multipleanorexigenic signals. Nat Neurosci 17:1240–1248. CrossRef Med-line
Carter ME, Soden ME, Zweifel LS, Palmiter RD (2013) Genetic iden-tification of a neural circuit that suppresses appetite. Nature 503:111–114. CrossRef Medline
Cassell MD, Gray TS (1989) Morphology of peptide-immunoreactiveneurons in the rat central nucleus of the amygdala. J Comp Neurol281:320–333. CrossRef Medline
Ciocchi S, Herry C, Grenier F, Wolff SB, Letzkus JJ, Vlachos I, EhrlichI, Sprengel R, Deisseroth K, Stadler MB, Müller C, Lüthi A (2010)Encoding of conditioned fear in central amygdala inhibitory cir-cuits. Nature 468:277–282. CrossRef Medline
Delaney AJ, Sah P (2001) Pathway-specific targeting of GABA(A)receptor subtypes to somatic and dendritic synapses in the centralamygdala. J Neurophysiol 86:717–723. Medline
Dumont EC, Martina M, Samson RD, Drolet G, Paré D (2002) Phys-iological properties of central amygdala neurons: species differ-ences. Eur J Neurosci 15:545–552. Medline
Duvarci S, Pare D (2014) Amygdala microcircuits controlling learnedfear. Neuron 82:966–980. CrossRef Medline
Gross CT, Canteras NS (2012) The many paths to fear. Nat RevNeurosci 13:651–658. CrossRef Medline
Grove EA (1988) Neural associations of the substantia innominata inthe rat: afferent connections. J Comp Neurol 277:315–346. Cross-Ref Medline
Han S, Soleiman MT, Soden ME, Zweifel LS, Palmiter RD (2015)Elucidating an affective pain circuit that creates a threat memory.Cell 162:363–374. CrossRef Medline
Haubensak W, Kunwar PS, Cai H, Ciocchi S, Wall NR, Ponnusamy R,Biag J, Dong HW, Deisseroth K, Callaway EM, Fanselow MS, LüthiA, Anderson DJ (2010) Genetic dissection of an amygdala micro-circuit that gates conditioned fear. Nature 468:270–276. CrossRefMedline
Hou WH, Kuo N, Fang GW, Huang HS, Wu KP, Zimmer A, Cheng JK,Lien CC (2016) Wiring specificity and synaptic diversity in themouse lateral central amygdala. J Neurosci 36:4549–4563. Cross-Ref Medline
Isosaka T, Matsuo T, Yamaguchi T, Funabiki K, Nakanishi S, Kobay-akawa R, Kobayakawa K (2015) Htr2a-expressing cells in thecentral amygdala control the hierarchy between innate and learnedfear. Cell 163:1153–1164. CrossRef Medline
Jolkkonen E, Pitkänen A (1998) Intrinsic connections of the ratamygdaloid complex: projections originating in the central nu-cleus. J Comp Neurol 395:53–72. Medline
Klüver H, Bucy PC (1939) Preliminary analysis of functions of thetemporal lobes in monkeys. 1939. J Neuropsychiatry Clin Neurosci9:606–620. CrossRef Medline
LeDoux JE (2000) Emotion circuits in the brain. Annu Rev Neurosci23:155–184. CrossRef Medline
Li H, Penzo MA, Taniguchi H, Kopec CD, Huang ZJ, Li B (2013)Experience-dependent modification of a central amygdala fearcircuit. Nat Neurosci 16:332–339. CrossRef Medline
New Research 17 of 18
January/February 2017, 4(1) e0367-16.2017 eNeuro.org

Lopez de Armentia M, Sah P (2004) Firing properties and connec-tivity of neurons in the rat lateral central nucleus of the amygdala.J Neurophysiol 92:1285–1294. CrossRef Medline
Martina M, Royer S, Paré D (1999) Physiological properties of centralmedial and central lateral amygdala neurons. J Neurophysiol 82:1843–1854. Medline
McDonald AJ (1982) Cytoarchitecture of the central amygdaloidnucleus of the rat. J Comp Neurol 208:401–418. CrossRef Medline
McDonald AJ, Augustine JR (1993) Localization of GABA-like immu-noreactivity in the monkey amygdala. Neurosci 52:281–294. Med-line
Medina L, Bupesh M, Abellán A (2011) Contribution of genoarchitec-ture to understanding forebrain evolution and development, withparticular emphasis on the amygdala. Brain Behav Evol 78:216–236. CrossRef Medline
Penzo MA, Robert V, Li B (2014) Fear conditioning potentiatessynaptic transmission onto long-range projection neurons in thelateral subdivision of central amygdala. J Neurosci 34:2432–2437.CrossRef
Sah P, Faber ES, Lopez De Armentia M, Power J (2003) The amyg-daloid complex: anatomy and physiology. Physiol Rev 83:803–834. CrossRef Medline
Sato M, Ito M, Nagase M, Sugimura YK, Takahashi Y, Watabe AM,Kato F (2015) The lateral parabrachial nucleus is actively involvedin the acquisition of fear memory in mice. Mol Brain 8:22 CrossRefMedline
Sosulina L, Graebenitz S, Pape HC (2010) GABAergic interneurons inthe mouse lateral amygdala: a classification study. J Neurophysiol104:617–626. CrossRef Medline
Spampanato J, Polepalli J, Sah P (2011) Interneurons in the baso-lateral amygdala. Neuropharmacol 60:765–773. CrossRef Medline
Sun N, Cassell MD (1993) Intrinsic GABAergic neurons in the ratcentral extended amygdala. J Comp Neurol 330:381–404. Cross-Ref Medline
Tovote P, Esposito MS, Botta P, Chaudun F, Fadok JP, Markovic M,Wolff SB, Ramakrishnan C, Fenno L, Deisseroth K, Herry C, ArberS, Lüthi A (2016) Midbrain circuits for defensive behaviour. Nature534:206–212. CrossRef Medline
Weiskrantz L (1956) Behavioral changes associated with ablation ofthe amygdaloid complex in monkeys. J Comp Physiol Psychol49:381–391. Medline
Woodruff AR, Sah P (2007) Networks of parvalbumin-positive in-terneurons in the basolateral amygdala. J Neurosci 27:553–563.CrossRef Medline
Yu K, Garcia da Silva P, Albeanu DF, Li B (2016) Central amygdalasomatostatin neurons gate passive and active defensive behav-iors. J Neurosci 36:6488–6496. CrossRef Medline
Zhao S, Ting JT, Atallah HE, Qiu L, Tan J, Gloss B, Augustine GJ,Deisseroth K, Luo M, Graybiel AM, Feng G (2011) Cell type-specific channelrhodopsin-2 transgenic mice for optogenetic dis-section of neural circuitry function. Nat Methods 8:745–752.Medline
New Research 18 of 18
January/February 2017, 4(1) e0367-16.2017 eNeuro.org


![Self-Regulation of Amygdala Activation Using Real-Time ...€¦ · amygdala participates in more detailed and elaborate stimulus evaluation [20,26,27]. The involvement of the amygdala](https://static.fdocuments.in/doc/165x107/5fa8a495e8acaa50d8405bd2/self-regulation-of-amygdala-activation-using-real-time-amygdala-participates.jpg)