Intraday Effect of News on Emerging European Forex Markets ... · on the forex market in general...
45
7239 2018 September 2018 Intraday Effect of News on Emerging European Forex Markets: An Event Study Analysis Evžen Kočenda, Michala Moravcová
Transcript of Intraday Effect of News on Emerging European Forex Markets ... · on the forex market in general...

7239 2018
September 2018
Intraday Effect of News on Emerging European Forex Markets: An Event Study Analysis Evžen Kočenda, Michala Moravcová
Impressum:
CESifo Working Papers ISSN 2364‐1428 (electronic version) Publisher and distributor: Munich Society for the Promotion of Economic Research ‐ CESifo GmbH The international platform of Ludwigs‐Maximilians University’s Center for Economic Studies and the ifo Institute Poschingerstr. 5, 81679 Munich, Germany Telephone +49 (0)89 2180‐2740, Telefax +49 (0)89 2180‐17845, email [email protected] Editors: Clemens Fuest, Oliver Falck, Jasmin Gröschl www.cesifo‐group.org/wp An electronic version of the paper may be downloaded ∙ from the SSRN website: www.SSRN.com ∙ from the RePEc website: www.RePEc.org ∙ from the CESifo website: www.CESifo‐group.org/wp

CESifo Working Paper No. 7239 Category 7: Monetary Policy and International Finance
Intraday Effect of News on Emerging European Forex Markets: An Event Study Analysis
Abstract We analyze the impact of Eurozone/Germany and U.S. macroeconomic news announcements and the communication of the monetary policy settings of the ECB and the Fed on the forex markets of new EU members. We employ an event study methodology to analyze intra-day data from 2011–2015. Our comprehensive analysis of the wide variety of macroeconomic information during the post-GFC period shows that: (i) macroeconomic announcements affect the value of the new-EU-country exchange rates, (ii) the origin of the announcement matters, (iii) the type of announcement matters, (iv) different types of news (good, bad, or neutral) result in different reactions, (v) markets react not only after the news release but also before, (vi) when the U.S. dollar is a base currency the impact of the news is larger than in the case of the euro, (vii) announcements on ECB monetary policy result in stronger effects than those of the Fed, (viii) temporary inefficiencies are present on new-EU-country forex markets, (ix) new-EU-country exchange rates react differently on positive US news during the EU debt crisis when compared to the rest of the period.
JEL-Codes: C520, F310, F360, G150, P590.
Keywords: foreign exchange markets, intraday data, abnormal returns, event study, macroeconomic announcements, monetary policy settings, European Union, new EU members.
Evžen Kočenda*
Institute of Economic Studies Charles University
Opletalova 26 Czech Republic – 11000 Prague
Michala Moravcová Institute of Economic Studies
Charles University Opletalova 26
Czech Republic – 11000 Prague [email protected]
*corresponding author We are thankful for comments from Ali Kutan (Editor), Gerhard Illing, Lucjan Orlowski, Pedro Piccoli, two anonymous referees, and participants at several presentations. We acknowledge support from GAČR grant No. 16-09190. The usual disclaimer applies.

1
1. Introduction and related literature
We analyze how the emerging European forex markets react to foreign macroeconomic news
and the monetary policy settings of the major central banks. Developments in macroeconomic
fundamentals are evidenced to be quite important for exchange rate movements (Cavusoglu,
2011). Their effects on exchange rates materialize via macroeconomic news (Andersen et al.,
2003), whose releases produce substantial exchange rate variation (Fratzscher, 2006;
Laakonen, 2007). The available evidence comes mostly from developed markets (Neely and
Dey, 2010), while emerging markets are much less explored, and the evidence from emerging
European forex markets is downright scarce. This is quite surprising because new European
Union (EU) markets are documented to be quite important for international portfolio
diversification (Jotikasthira et al., 2012; Wang and Bilson, 2017).1 Further, while the effects
of news on mature forex markets are well established, the potential reaction of the new EU
currencies to foreign macro news might be less than obvious; their reaction to shocks in the
U.S. dollar varies greatly (Orlowski, 2012), but at the same time there exist positive and
increasing co-movements between the euro and the new EU currencies (Orlowski, 2016).
The world forex market is responsive to a vast amount of information in the form of
macroeconomic and monetary news, as surveyed by Neely and Dey (2010). News originating
in large economies is empirically shown to matter most. Faust et al. (2003), Andersen et al.
(2003), and Chaboud et al. (2004) evidence the importance of U.S. news releases. Ehrmann
and Fratzscher (2005), Cakan et al. (2015), and Gilbert et al. (2016) show that both U.S. and
European news releases have significant effects on pricing on forex markets and on financial
markets in general (for recent evidence on other classes of assets see for example Savor and
Wilson, 2013; or Lucca and Moench, 2015).
There is also similar recent evidence on the impact of news on emerging (financial)
markets (Andritzky et al., 2007; Fedorova et al., 2014), including emerging European markets
(Hanousek et al., 2009; Hanousek and Kočenda, 2011; Büttner et al., 2012). That evidence
centers chiefly on stock markets, though.
Analyses of how macroeconomic and monetary news impact the emerging European
forex markets are rare. Scalia (2008; p. 544) finds only a weak effect of public news on the 1 According to Jotikasthira et al. (2012), new EU markets are important for the portfolio diversification of mutual and hedge funds domiciled mainly in developed markets. They show 270 active funds in the Czech Republic, 276 funds in Poland, and 295 funds in Hungary after the crisis. What is more important, these fund holdings account for 3.6% of the float-adjusted market capitalization in the Czech Republic, 8.6% in Hungary, and 4.7% in Poland; this is more than 2.6% of the average number of free-float market capitalization in 25 emerging markets examined by Jotikasthira et al. (2012). Wang and Bilson (2017) show that Eastern European emerging bond market returns exhibit low correlations with traditional fixed income investments and thus offer opportunities for portfolio diversification.

2
Czech koruna (CZK) exchange rate but suggests to analyze “the distinct news items and their
‘surprise’ component”. Further, Égert (2007) uses event study methodology to show that
central bank interventions coupled with communications (and backed by interest rate news),
have a significant effect on the exchange rate of the Czech, Hungarian, and Polish currencies.
A more detailed exercise is conducted by Égert and Kočenda (2014), who analyze the new-
EU forex markets and divide their analysis into the pre-crisis (2004–2007) and crisis (2008–
2009) periods. They show that, before the crisis, several types of macroeconomic news impact
forex markets, but during the crisis the relationships break down and the currencies react only
to news on the key economic indicator (real GDP growth) and do not react to other macro
announcements. The responsiveness of the currencies to central bank verbal interventions
follows a slightly different pattern: exchange rate-related verbal communications of central
banks matter when markets experience high uncertainty (crisis), while during calmer days
markets are less attentive. In this respect Égert and Kočenda (2014) show that important news
do not always produce significant effects on exchange rates.
However, to the best of our knowledge, so far there are no studies that analyze the
impact of macroeconomic and monetary news on the emerging European forex markets after
the 2007 crisis Hence, it is legitimate to ask relevant questions arising with respect to the
propagation of news in the new-EU forex markets. Do specific news—in terms of type and
quality—exhibit a markedly different impact? Is the impact dependent on the base currency?
What is the duration of the impact? Are the new-EU forex markets efficient when new
information arrives?
In this paper we differentiate from the existing literature in that we explore an under-
researched segment of the emerging European forex market during the post-crisis period. In
this, we contribute to the literature in several ways. We analyze how three new-EU currencies
(the Czech koruna, Polish zloty, and Hungarian forint) react to a large set of foreign
macroeconomic news and changes in ECB and Fed monetary policy settings. Because of the
underlying economic links between the new-EU and old-EU countries (Hayo et al., 2010), as
well as with the U.S., we examine both Eurozone and U.S. macroeconomic announcements
and the exchange rates denominated with respect to the euro and the U.S. dollar.
Macroeconomic data are a very important source of information not only for the actual state
of real economies, but more importantly for their future prospects. For this reason, we
examine both traditional macroeconomic announcements (GDP, Trade Balance, Industrial
Production, Retail Sales, NFP, CPI, PPI, and Core Durable Goods orders) and also forward-
looking indicators on the economic climate and prospects (PMI, ZEW, and Ifo indices). We

3
also assess the impact of the key monetary announcements as they are shown to be important
on the forex market in general (Neely and Dey, 2010). Because the post-2008 period is not
covered well, we employ intra-day, one-minute data and cover a relatively long post-crisis
period of 2011–2015.
In terms of methodology, most of the related research employs a GARCH-type
modeling approach. However, the vast amount of daily or even intraday data dwarf the
relatively limited number of announcements and this disproportion makes this technique
disadvantageous. Rather we opt for the event study approach in order to accurately assess the
“surprise component” of the qualitatively different good, bad, and neutral news, and the effect
of monetary policy settings on exchange rates. The technique is more suitable for our study
because it enables targeting the effect of specific macro news as well as monetary
announcements over a precisely defined time interval (Gürkaynak and Sack, 2005; Bredin et
al., 2009; Wongswan, 2009; Rai and Suchanek, 2014). 2 Further, systematically detected
nonzero abnormal returns that persist after a particular type of event are inconsistent with
market efficiency.
Our key results provide a comprehensive account of how new information entering the
emerging EU forex markets propagate during the post-GFC period and can be summarized in
the following points. We show that (i) macroeconomic announcements affect the value of the
exchange rates of the new EU countries, (ii) the origin of the announcement matters, (iii) the
type of the announcement matters, (iv) different types of news (good, bad, or neutral) result in
different reactions, (v) markets react not only after the news release, but also before, (vi)
when the U.S. dollar is a base currency, the impact of news is larger than in the case of the
euro, (vii) announcements on ECB monetary policy result in stronger effects than those of the
Fed, (viii) temporary inefficiencies are present on the forex markets of new EU countries, (ix)
new-EU-country exchange rates react differently on positive US news during the EU debt
crisis when compared to the rest of the period.
The rest of the paper is organized as follows. In Section 2 we describe our data on
exchange rates, macroeconomic announcements and central banks’ monetary policy. We
introduce the event study methodology and formulate our hypotheses in Section 3. Our
detailed results are brought forth and discussed in Section 4 that is followed by conclusions.
2 Other studies that applied the event study methodology on emerging markets are, for example, Gurgul and Wójtowicz (2014), Égert (2007), Naidu (2011), Leon and Williams (2012), and Menkhoff (2013).

4
2. Data: sources, description, and characteristics
We intentionally deviate from standard practice and introduce the data before outlining our
methodology. The reason is that when we describe our use of event study methodology in
Section 3, we need to refer to some specific details related to announcement releases.
2.1 Forex data
We analyze six exchange rates (R) of three new-EU currencies (the Czech koruna (CZK),
Hungarian forint (HUF), and Polish zloty (PLN)) quoted with respect to the euro (EUR) and
the U.S. dollar (USD); for example CZK/EUR denotes exchange rate between amount of
Czech currency per 1 euro. The set of six independently quoted intraday one-minute exchange
rates is taken from MetaQuotes corresponding to the CET time zone for the period beginning
on January 3, 2011 and ending on December 31, 2015. Raw data (Rt) are transformed into a
log-difference stationary series of percentage exchange rate returns (rt):
. (1)
Thus, a negative change in an exchange rate means an appreciation of the quoting currency i
(CZK, HUF, PLN) with respect to the reference currency j (EUR, USD); from a perspective
of a forex trader appreciation means a positive return because less units of the quoting
currency is needed to buy 1 unit of the reference currency. Conversely, a positive change
represents a depreciation of the quoting currency; depreciation means a negative return. Since
the EUR/USD is the most heavily traded currency pair globally, we assume that price changes
in EUR/USD exchange rate are directly reflected in prices of EUR-denominated and USD-
denominated exchange rates and prevent market from arbitrage opportunities. This way the
effect of the EUR/USD on new-EU currencies is effectively accounted for. In this respect we
follow the approach of Cai et al. (2009) who examine the impact of the U.S. and local news
announcement on forex emerging markets or Caporale at al. (2017) who analyze the effects of
news on the exchange rates vis-a-vis both the US dollar and the euro for the currencies of the
BRICS.
In Figures 1-2 we present the dynamics of the exchange rates under research. All three
examined CEE currencies depreciated against the U.S. dollar during the examined time period
(2011–2015). At the same time, the Czech crown and Hungarian forint weakened relative to
the euro. On the contrary, the Polish zloty has been resilient to the euro and has kept its value.
All three of the examined new EU countries use a free-floating exchange rate regime with
independent central banks aiming for price stability. The big spike in CZK/EUR and

5
CZK/USD daily returns shows the start of exchange rate interventions. The Czech National
Bank (CNB) decided to use the exchange rate as a monetary policy instrument and have
performed foreign exchange interventions since November 7, 2013 to prevent the excessive
appreciation of the koruna below CZK 27/EUR. On the weaker side of the CZK 27/EUR
level, the CNB is allowing the koruna exchange rate to float.
In terms of volatility, the exchange rates of the new-EU-country currencies with
respect to the U.S. dollar are generally more volatile than with respect to the euro.3 This can
be explained by the closer economic connection of the new EU countries to Germany, or the
EU in general, especially with respect to international foreign trade and foreign direct
investment. Still, the most volatile currency is the Hungarian forint. The volatility of the
Czech koruna is the lowest among the new-EU-country currencies.
2.2 Macroeconomic announcements
We gathered data on macroeconomic announcements coming from the Eurozone/Germany
and the U.S.A. An extensive data set on 22 different macroeconomic announcements (news)
from both regions is divided into four main categories. The Eurozone/Germany data set
contains announcements on (i) business climate (Markit’s Purchasing Managers' Index (PMI)
from the Manufacturing and Services sectors, the German Business Climate Index, and the
German ZEW Economic Sentiment Index), (ii) the real economy (Industrial Production, GDP,
Retail Sales, and Trade Balance), (iii) prices (measured by CPI and PPI), and (iv) monetary-
type indicators represented by central bank announcements of key interest rate changes and
monetary policy settings.4 In total we employ six German macroeconomic indicators (Ifo,
ZEW, PMI indices from the Manufacturing and Services sectors, Industrial Production, and
GDP) and four indicators related to the Eurozone economy (CPI, PPI, Trade Balance, and
Retail Sales).5
3 With regard to market volatility, we acknowledge that the Chicago Board Options Exchange SPX Volatility Index (VIX) stayed at relatively low levels during the period under research. However, Barunik et al. (2017) show that connectedness on the forex market was high during 2008–2010, was somewhat lower during 2011–2012, and increased during 2013–2015. This evidence means that while the overall market volatility might be relatively low, there were substantial volatility spillovers among currencies on the forex market during most of the time covering the span of the current research. 4 There are two versions of the CPI report released about two weeks apart: Flash and Final. We consider the Flash report, which is extremely early and therefore tends to have a significant impact. There are also two versions of the GDP report released approximately 10 days apart: preliminary and final. The preliminary release is the earliest and thus tends to have a larger impact. We examine the data for the preliminary GDP release. 5 Germany’s PMI indices are preferred to the Eurozone’s because they are published 30 minutes earlier. We expect the primary market reaction to the data released first. German GDP is published three hours before the aggregate GDP from the Eurozone. For this reason, we expect the primary market reaction to be on Germany’s data. As for the Ifo and ZEW indices, they do not have a composite Eurozone equivalent. Industrial Production is

6
The U.S. macroeconomic indicators are also divided into four categories. These are
announcements on (i) business climate (Purchasing Managers’ Index (PMI) from the
Manufacturing and Services sectors provided by ISM), (ii) the real economy (Industrial
Production, GDP, Retail Sales, Trade Balance, Core Durable Goods Orders, and Non-farm
Payrolls), (iii) prices (measured by CPI and PPI), and (iv) monetary-type indicators
represented by central bank announcements of key interest rate changes and monetary policy
settings.6
The macroeconomic announcements used in this paper are reported by Reuters with a
clearly defined calendar, the timing of news releases, and the market expectations of specific
news. The so-called consensus forecast of financial market analysts constitutes a proxy for
market expectations. We follow Andersen et al. (2007) and define the surprise news variable
(xnit) as:
xnit = (snit – Et-1[snit]) / σi ,
where snit stands for the value or extent of the Reuters scheduled announcement i at time t,
Et-1[snit] is the value of the announcement for time t expected by the market (market
consensus) at time t-1, and σi is the sample standard deviation of announcement i. The
standardization does not affect the properties of the coefficients’ estimates as the sample
standard deviation σi is constant for any announcement indicator i. This approach allows us to
divide all releases into three clusters of surprise announcements: better than expected (good
news), worse than expected (bad news), and in line with consensus (neutral news).
The reaction of exchange rates to news might not be always clear. First, while an
exchange rate-based contract might be considered a single instrument, an announcement
impacts the relative price of the two currencies. Second, under the prevailing economic
conditions, an announcement considered good news in one country might not be the same in
another country. For that reason, we refrain from forming overly specific expectations of the
effects of announcements on abnormal exchange rate returns. However, in accord with the
relevant literature, we can say that in case of the PMI Manufacturing index, the PMI Services
index, the German Ifo Business Climate Index, the German ZEW Economic Sentiment Index,
Retail Sales, Trade Balance, Core Durable Goods Orders, GDP, NFP, and Industrial
Production, an announcement above the consensus (good news) is expected to have a positive
the key feature of the German economy. We prefer aggregate CPI and PPI from the Eurozone even if they are published a few days after the German indices, because they are the key indicators followed by ECB monetary policy. Even if Germany is the largest economy of the Eurozone, aggregate Retail Sales and Trade Balance published a few days after Germany may produce different results than only the German data. 6 We prefer the NFP announcement to the unemployment rate number because Andersen et al. (2007) showed that Non-farm Payrolls is one of the most significant macroeconomic announcements.

7
impact on the quoting currency (Ramchander et al., 2008), whereas CPI or PPI above the
forecast (bad news) is expected to have a negative impact on the quoting currency (Ehrman
and Fratzscher, 2005). The same logic applies for the opposite surprises.
We provide a comprehensive overview of the employed news in Table 1; it includes
the release date and time as well as the sequencing of the news. The sequence in which
macroeconomic data is announced may play an important role in market reaction. Indicators
published at the beginning of the month may attract more investor attention and market
reaction than those published at the end of the month (Andersson et al., 2009). From this
perspective, we can hypothesize that the business climate indicators might ignite the most
significant reaction of the financial market. With respect to U.S. macroeconomic news
announcements, NFP and PMI are among the earliest indicators to be published each month.
Retail Sales, CPI, Industrial Production and PPI are released in the middle of the month. Core
Durable Goods Orders are announced at the end of the month, Trade Balance is released after
the month ends, and quarterly GDP is published one month after the respective quarter ends.
The first information about the German economy is provided via the business climate
indicators (Purchasing Managers Indices, Ifo Business Climate Index, and ZEW Economic
Sentiment Index). Later on, CPI, PPI, Retail Sales, Trade Balance, and Industrial Production
are available. The last one released is GDP.7
2.3 Monetary settings
We also analyze the effects of monetary policy decisions. We now provide a brief background
of the monetary policy settings in the U.S. and Europe and describe the events we investigate.
In December 2009, with the financial crisis in full swing, the Federal Open Market
Committee (FOMC) of the Fed lowered the target for the federal funds rate to nearly zero.
The unfamiliar monetary environment of the zero lower bound interest rate policy (ZIRP)
lasted until December 2015. Applying the ZIRP is a method of stimulating economic growth,
while keeping interest rates close to zero. Under this policy, the governing central bank can no
longer reduce interest rates, rendering conventional monetary policy ineffective. As a result,
unconventional monetary policy such as quantitative easing is used to increase the monetary
7 A confounding events problem may occur if two or more macroeconomic announcements are released on the same day, within a 90-minute time span, and do not have the same hypothesized effect on the quoting currency. In the U.S., the problem is chiefly connected with CPI, PPI, and Industrial Production. Industrial Production is always released 45 minutes after the price indices. We consider news on CPI, PPI and Industrial Production only if they do not contain contradictory information, i.e., if all the announcements have the same effect on the quoting currency (we follow the approach suggested by Park (2004) ; further details are provided in Table 1).

8
base. We analyze the impact of six events when the Fed changed the monetary policy settings
during the examined time period.
The main task of the European Central Bank (ECB) is to maintain price stability in the
euro area and to preserve the purchasing power of the joint currency. The ECB targets CPI at
a rate close to but below two percent. ECB announcements inform investors about decisions
on interest rates. Following the U.S. financial crisis and the European debt crisis, the ECB
gradually lowered all three main interest rates in the examined time period. We investigate the
market reaction to the ECB rate announcements only on the days when at least one of the
three main rates were changed. Furthermore, we look into two more ECB meetings. On
January 22, 2015 there was no rate change, but the ECB announced the planned launch of the
Quantitative Easing (QE) program at a press conference. This event took place after the rate
announcement at 2:30 p.m. CET and on March 5, 2015 the ECB introduced details of the QE
program.
The list, content, timing, and other details of the monetary policy settings are
presented in Table A7 in the Appendix. Because of the varied nature of Fed and ECB events,
we quantify these events in the form of dummy variables with precise time identification.
Thus, the monetary policy setting dummy reflects key information arising at the market from
each central bank. Because the number of such announcements is small, we set the dummy
variable to be equal to one for each event and zero otherwise. In this way, we do not
distinguish the qualitative nature of central bank announcements. Rather, we aim to capture
the potential effect of central bank announcements as well as the recognition of such
announcements by the market.
3. Event Study Methodology Approach
We analyze the effects of macroeconomic announcements and policy settings on exchange
rates using event study methodology (ESM) as outlined in Ball and Brown (1968) and Fama
et al. (1969). We opt for the ESM because of its precision in identifying the reaction of an
asset following each event. The approach is grounded in the fact that the effect of the
macroeconomic announcements is analyzed during periods when news enters the market and
avoids extended periods without announcements (Swanson, 2011). Further, in contrast with
time-series methods, the ESM allows to focus on examinations of specific events that are
isolated from other unwanted news disturbances (noise) that occur outside of the event
window (Fatum and Hutchinson, 2003b). Thus, the ESM avoids the problem of “noise”

9
affecting the precision of the time-series approach (Fratzscher, 2008).8 Further, with the ESM
we can test market efficiency as systematically nonzero abnormal security returns that persist
after a particular type of event are inconsistent with market efficiency (Busse and Green,
2002). The ESM has been widely employed to analyze forex markets in different regions
(Égert, 2007; Browman et al., 2015), with various data frequencies (Poole, 2005; Menkhoff,
2010), including intraday frequency (Ranaldo and Rossi, 2011; Fuentes et al., 2014).
The initial task of conducting an event study is to define the event of interest and to
identify the period over which an asset price will be examined, e.g. an event window. In this
paper, the assets are currency prices (new-EU-country exchange rates) and the events are
defined as the unexpected component of the macroeconomic news announcements and the
central bank’s monetary policy changes; they are described in detail in the data section. The
effect of such events is hypothesized to materialize in abnormal returns that are studied with
respect to pre-event and event windows.
3.1 Pre-event and event windows
The key element of an event study is the appropriate choice of pre-event and event windows,
and typically the estimation window and the event window do not overlap (MacKinlay,
1997). It is customary to define the pre-event window as larger than the event window. We
define the windows in the following way. First, similar to Gurgul and Wójtowicz (2014), we
set the pre-event window at 130 minutes. That is more than two hours before the event occurs.
Second, we choose the event window to have a length of 26 minutes. The event window
covers (i) exchange rate returns that occur five minutes before the event, (ii) returns at the
time of the news announcement (labeled as the zero-minute period that lasts for one minute)
and (iii) returns covering the 20 minutes after the macroeconomic news announcement.9 The
choice of the event window’s length is grounded in the following facts related to each
segment of the event window. First, because investors and traders know the calendar of
macroeconomic news announcements and form expectations about their values, abnormal
returns related to each specific event may also occur in the pre-event period. Thus, the event
window starts five minutes before the news announcement. Second, we consider 20 minutes 8 We acknowledge the wealth of research contained in studies examining the impact of macroeconomic news announcements and central bank monetary policy settings via in time-series approach. They employ various types of (G)ARCH models in order to examine jointly the conditional volatility and market reaction. Examples assessing the issue on emerging European financial markets include Egert and Kočenda (2007, 2011, 2014), Buttner et al. (2012), Hanousek et al. (2009), and Hanousek and Kočenda (2011). 9 When estimating pre-event period parameters, the event period is generally not included. This procedure prevents the event itself from influencing the parameters obtained from the estimation of the normal performance model.
10
after the news release to be a sufficiently long time for the news to be absorbed by the
financial market because Égert and Kočenda (2011) show that new information entering the
Czech, Hungarian, and Polish stock markets is largely absorbed by the markets within five
minutes after the announcement and it is fully absorbed within 20 minutes.10
3.2 Abnormal returns
Abnormal returns are defined as the difference between actual returns and their expected
values. Hence, for the ith event and time t the abnormal return (ARit) is defined formally as:
, (2)
where denotes the actual return and denotes the expected return, given the
conditioning information for the expected return model.
We follow the practice in the literature (MacKinlay, 1997; Kothari and Warner, 2006)
and calculate expected returns from a model estimated on the basis of the returns
materializing before the event window.11 All computations are based on one-minute log-
returns computed on the close prices.
When estimating the expected returns we test the currencies’ returns for
autocorrelation and heteroscedasticity over all 155-minute-long periods (pre-event plus event
windows) associated with ith event. 12 As either autocorrelation or heteroscedasticity are
largely absent in the returns we employ a Constant Mean Returns Model (CMRM); an
autoregressive model would be an alternative in case of detected autocorrelation. Hence, the
expected returns are derived based on the following CMRM regression:
, (3)
10 The pre-event window begins at t = -135 minutes and runs up to -6 minutes before the news announcement. The event window evolves from t = -5 to +20, that is from five minutes before the news announcement until 20 minutes after it. The time when the news is released (t0) is assigned as 0. 11 The same approach has recently been adopted by Shah and Arora (2014) and Gurgul and Wójtowicz (2014). 12 In appendix Tables A1-A6 we show in the parenthesis the distribution of the examined German/Eurozone and U.S. events (457 and 494 in total, respectively). In appendix Table A7 we show the number of the ECB and FED announcements on monetary policy settings (12 and 6 in total, respectively). We work with 3 new EU currencies denominated in EUR and USD; eg. we analyze 6 exchange rates. Hence, the number of all 155-minute-long periods (pre-event plus event windows) is 2907 [= 3*(457+12) + 3*(494+6)]. Accordingly, we perform the Ljung-Box test on all 2907 series of returns and squared returns. Absence of autocorrelation is shown in 2839 cases out of 2907 tests on returns and in 2868 cases out of 2907 tests on squared returns. Thus, in general, we do not find presence of autocorrelation or heteroskedasticity in returns. The results of these tests occupy substantial space; hence, they are not reported but are available upon request.

11
where μi is the mean return for asset i and ξit is the time period t disturbance term for event
i with an expectation of zero (E(ξit ) = 0) and variance var (ξi ) = σζi2. Although the constant
mean return model is perhaps the simplest model, Brown and Warner (1985) find that it often
yields a result similar to those of more sophisticated models. This logic corresponds to
MacKinlay (1997), who argues that the lack of sensitivity to a particular model is due to a
very small reduction of the variance of the abnormal returns when a more sophisticated model
is employed.
3.3 Standardized abnormal returns
In financial markets, volatility of abnormal returns tends to increase at the time of
macroeconomic news announcements, i.e. during event window. To effectively account for a
change in variance in abnormal returns and to ensure that each abnormal return will have the
same variance we proceed with their standardization. We calculate the standardized abnormal
returns, to be tested for statistical significance, instead of using the estimated ones (Corrado,
2011; Corrado and Truong, 2008). The standardized abnormal returns are defined as
the ratio of abnormal returns and standard deviation:
, (4)
where S(ARi) is the standard deviation of abnormal returns from the pre-event window (t
running from minus 135 to minus six). The standard deviation is calculated in the following
way:
(5)
Further, the standardized abnormal returns are classified into two categories in order to control for the event-induced volatility change in the cross-sectional variance:
, (6)
where
. (7)

12
S (SARt) is the cross-sectional standard deviation of standardized abnormal returns, is
average standardized abnormal return calculated as
and N is the number of
observations in the cluster.
To test the statistical significance of mean abnormal returns in the event window, we
employ the rank test of Corrado and Zivney (1992) with the correction of event-implied
volatility by using SAR as described above. The two main advantages of this nonparametric
test are that it does not need any assumption about the normality of abnormal returns and
compared to other tests used in event studies, it has higher power than other standardized tests
(Corrado, 2011). Furthermore, the rank test of Corrado and Zivney (1992) based on the event
period standardized returns has proven to be robust both against event-induced volatility
(Campbell and Wasley, 1993) and to cross-correlation due to event day clustering (Kolari and
Pynnönen, 2010).
The statistical significance of standardized abnormal returns is tested by the Corrado-
Zivney Tcz statistics; its calculation is based on the standardized ranks as defined in Corrado
(2011):
, (8)
where t0 stands for each individually examined minute in the event window, n represents the
size of the pre-event window (i.e., n = 130). Rank ( ) implies the rank of
within
the series of the standardized abnormal returns ( from the pre-event window calculated
by the Formula (6). With increasing number of observations (n), the distribution of Tcz
statistics converges quickly to the standard normal distribution.
The values of abnormal returns during pre-event and post-event windows are assessed
in conjunction with their statistical significance and serve as the basis for the interpretation of
our results, presented in the next section.
3.4 Testable hypotheses
Based on our research topic we formulate the following testable hypotheses. Hypothesis 1: Macroeconomic news announcements (for German/Eurozone and U.S.
economies) do not affect the value of new-EU-country exchange rates.

13
Hypothesis 2: There is no difference among types of macroeconomic news
announcements with respect to their effect on the value of new EU exchange rates.
Hypothesis 3: The origin of an announcement is irrelevant with respect to its effect on
the value of new-EU-country exchange rates.
Hypothesis 4: There is no difference in the qualitative direction of a news
announcement (good, bad, or neutral) with respect to the effect on the value of new-EU-
country exchange rates.
Hypothesis 5: There is no difference in the market reaction before and after the news
announcement.
Hypothesis 6: The new-EU-country currency market does not exhibit temporary
inefficiency related to news announcements.13
Hypothesis 7: Announcements about ECB or Fed monetary policy settings do not
affect the value of new-EU-country currencies.
Hypothesis 8: There is no difference in qualitative and quantitative market reaction on
the news announcements during the EU debt crisis.
4 Empirical Results
4.1 Abnormal returns: effect of the news
We assess the impact of German/Eurozone macroeconomic news announcements on
exchange rates quoted with respect to the euro (CZK/EUR, PLN/EUR, HUF/EUR). Similarly,
we assess the effect of U.S. macroeconomic news announcements on exchange rates quoted
with respect to the U.S. dollar (CZK/USD, PLN/USD, HUF/USD). The news announcements
are divided into three clusters: good, bad, and neutral news, as defined in Section 2.2. 14 The
results are presented in appendix in the Tables A1-A6. The impact of news announcements is
characterized by the mean abnormal returns (in percent). Hence, for each macroeconomic
13 Generally, in an efficient market new public information is incorporated very quickly into asset prices. Therefore, the effect of news announcements is visible only for a very short time. 14 Good news is news with a value above the market consensus, bad news is below the market consensus, and neutral news is in line with the market consensus. This logic applies to all macroeconomic announcements except for CPI and PPI, where good news is below the market consensus (i.e. lower than the expected inflation) and bad news is above the market consensus (i.e. higher than the expected inflation). There are no neutral news for PMI in the case of euro-denominated exchange rates. As a preliminary exercise, we also analyzed the effect of the news without distinguishing among good, bad and neutral news. We have found that all of the examined macroeconomic announcements are linked to significant abnormal returns over much of the event window. Moreover, the abnormal returns are often present also before the announcements are officially released. The biggest impact, in terms of the highest abnormal return, in euro-denominated currency pairs, occurs on the PMI indices, the Ifo index, and the GDP release. With respect to the U.S. dollar-denominated currency pairs, the highest abnormal returns are linked with the NFP and GDP releases. The exchange rates with respect to the U.S. dollar exhibit higher abnormal returns than the euro-denominated currency pairs. The detailed results are not reported but are available upon request.

14
news announcement and each minute we report the value of the percentage mean abnormal
return (AR%) and the corresponding p-value. We report the results from -5 up to +10
minutes, covering the period before and after the news release; later on the statistically
significant impact of the announcements quickly evaporates. The number of events in each
cluster is shown in parentheses, close to each announcement label.
Overall, from the tables we see that the immediate reaction during the first couple of
minutes after the news release can be observed in the case of CPI and PPI. The market
reaction to the news on prices and their movements is intuitively correct and can also be
understood based on the theory. 15 The longest reaction in terms of significant abnormal
returns after the news release can be traced to the announcements of PMI, Retail Sales, Ifo, or
Industrial Production. This finding indicates that news from the real economy does have
important information value for the market. It also indirectly hints that transactions on the
new-EU-country forex markets do reflect real economic activities despite the fact that
globally the majority of forex transactions are speculative in nature.16
Euro-denominated exchange rates (CZK/EUR, PLN/EUR, HUF/EUR)
The occurrence of statistically significant abnormal returns right at the time of a news release
(t = 0) is considerable, albeit not dominant (Tables A1-A3). Rather, the exchange rates react
to abnormal returns in the following minutes. The Hungarian forint (HUF/EUR) shows the
largest number of statistically significant abnormal returns, which implies a less efficient
market (Table A3). The strongest reaction of all of the new-EU-country currencies is
exhibited for the ZEW index, the PMI index, the Ifo index, and GDP as the abnormal returns
are farther from zero (Tables A1-A3). This finding might be related to the sequence of the
release of macroeconomic indicators. Generally, the strongest reaction of the market is
identified with neutral news. This may be explained by the fact that this cluster in most cases
15 A movement in prices affects the real interest rate along with terms of trade, and a movement in prices also affects the prices of forex options via interest rate parity. In both cases a movement in prices potentially strongly impacts the amount of money traded on the forex market. 16 The financial education website Investopedia states that “day-to-day corporate needs comprise only about 20% of the market volume. Fully 80% of trades in the currency market are speculative in nature” (http://www.investopedia.com/articles/forex/06/sevenfxfaqs.asp; retrieved on March 10, 2016). The data provided by the BIS (2013; p.6) do not provide a direct estimate of speculative trading but allow an indirect inference via foreign exchange market turnover by counterparty that is proportionally divided among non-financial customers (9%), reporting dealers (39%), and other financial institutions (53%). Further, in terms of instruments, “FX swaps were the most actively traded instruments in April 2013, at $2.2 trillion per day, followed by spot trading at $2.0 trillion” (BIS, 2013; p.3).

15
contains a small number of events. 17 The highest significant abnormal return appears in
HUF/EUR three minutes after a good German GDP data release (Table A3). ZEW, PMI, and
Ifo are the first indices giving us new information about the economy. Bad news about
industrial production is related to the longest statistically significant reaction for all new-EU-
country currencies. With respect to the euro-denominated exchange rates, we can observe
three key patterns (Tables A1-A3): (i) the values of abnormal returns are smaller, (ii) the
number of statistically significant abnormal returns is lower than with U.S. dollar-
denominated exchange rates, and (iii) the statistically significant abnormal returns in the case
of euro-denominated exchange rates appear immediately after the news announcements. We
also see that larger abnormal returns are in general linked more with good news than with bad
news; this is consistent with the graphical presentation in Figure 4. In the case of bad news,
there are significant abnormal returns even before the announcement of PMI, Retail Sales, and
Trade Balance significant for CZK/EUR and HUF/EUR. Based on the results presented in
Tables A1-A3 we can reject null Hypothesis 5 as we firmly document that there is a
difference in the market reaction before and after the news announcement. These pre-
announcement price drifts are important evidence that news does leak or are even traded
before their official release. This behavior is not uncommon and has been found in many
other studies. For example, Lucca and Moench (2015) confirm, that since 1994 international
equities react largely and with high statistical significance before official FOMC
announcements are released. Further, Kurov et al. (2017) show that prices of stock indices and
future prices of treasuries start to move in line with the direction of the news announcement
about 30 minutes before the release time.
U.S. dollar-denominated exchange rates
In the case of the U.S. dollar-denominated exchange rates, three key patterns emerge (Tables
A4-A6). First, the values of abnormal returns are larger. Second, statistically significant
abnormal returns occur more often than in the case of euro-denominated exchange rates.
Therefore, the results show that the segment of the new-EU-country forex market where
currencies are traded with respect to the U.S. dollar exhibits more temporary inefficiencies
than its euro-based counterpart. The results are also consistent with the graphical 17 The fact that neutral news is often linked to quite high abnormal returns might indicate that analysts, whose expectations form the market consensus, are understandably not always successful in predicting macroeconomic indicators with a complete accuracy. This can be explained by the wide range of possible outcomes of individual macroeconomic indicators. Some indicators are subject to less outcome possibilities and, for example, it is more probable to estimate the correct prediction for CPI than for NFP. The explanation is credited to an anonymous referee.

16
representation in Figure 4. Third, statistically significant abnormal returns occur much later,
usually two minutes after an announcement is released.
Some specific results further underline the above common patterns. The strongest
reaction in terms of abnormal returns is related to NFP and GDP announcements. Again, NFP
is one of the first news released at the beginning of each month, while GDP is a
comprehensive number representing the state of the whole economy. NFP news is possibly
leaked as the highest significant abnormal return emerges one minute before the (good) NFP
announcement is actually released.18 As a contrast to the above, announcements of Industrial
Production and Core Durable Goods Orders exhibit the weakest reaction in terms of the low
values of the associated abnormal returns.
Finally, one minute before the news announcement there is a strong statistically
significant reaction of all U.S. dollar-denominated exchange rates to the good news of the
NFP, PMI Services index, Retail Sales, and Core Durable Goods Orders (Tables A4-A6). The
U.S. dollar-denominated exchange rates exhibit the smallest amount of statistically significant
returns following the announcements of Industrial Production, CPI, PPI, and Trade Balance.
Based on the above evidence, we can reject null Hypothesis 1 because there is ample evidence
that macroeconomic news announcements affect abnormal returns. Further, we can also reject
the null Hypothesis 2 as specific macroeconomic news announcements exhibit different
effects on the value of new-EU-country exchange rates.
4.2 Size of abnormal returns
The impact of the announcements presented in Tables A1-A6 indicates the presence of
asymmetric reactions. We verify this feature and establish its statistical background. First, we
present the Box-and-Whisker plots of the percentage mean abnormal returns (AR%) in Figure
3. The plots show the distribution asymmetry of mean abnormal returns related to the three
clusters of macroeconomic news announcements, i.e. good, bad, and neutral. The abnormal
returns in the neutral cluster show the biggest dispersion. This may be explained either by the
low number of observations in the cluster or by the indecisiveness of investors whether
neutral news is actually positive or negative for the quoting currency. The mean abnormal
returns of the new-EU-country exchange rates denominated in USD reach higher absolute
values than those denominated in the euro. As a result, we may say that the forex segment
18 We consider only good and bad news clusters because there is a low number of observations of neutral news.

17
with new-EU-country exchange rates denominated in the U.S. dollar is less efficient than that
with new-EU-country currencies denominated in euro.
We further perform a nonparametric Kruskal-Wallis (KW) test to statistically establish
the evidence of the above asymmetry. Specifically, we compare the reaction of new EU
foreign exchange rates after the individual news announcements classified into appropriate
clusters of good, bad, or neutral news during the first minute after the news announcement
and alternatively also during the first five minutes in order to account for the cumulative
market reaction. The results show that in the case of euro-denominated exchange rates
abnormal returns react significantly differently to good news from the ZEW index (one
minute) and Retail Sales (one and five minutes), to bad news from the ZEW index (five
minutes) and Ifo index (one minute), and to neutral news on the CPI (one and five minutes).
For the U.S. dollar-denominated exchange rates the results show no asymmetry in the
distribution of abnormal returns for any type of news. To summarize, only euro-denominated
exchange rates react differently to some announcements and Hypothesis 4 of equal
distribution may be rejected. The detailed results are not reported but are available upon
request.
4.3 Duration of abnormal returns
An examination of post-event returns provides us with information on market efficiency.
Systematically nonzero abnormal returns following an event are inconsistent with market
efficiency and imply a profitable trading rule (ignoring trading costs). Therefore, the speed of
market adjustment to the information revealed at the time of the event is an empirical
question. We test the market efficiency hypothesis by applying the cumulative average
residual method (CAR). CAR uses the sum of each minute’s average abnormal returns in
percent (AR%). CAR starting at time t1 through time t2 (event window) is defined as:
CAR (t1 , t2 ) = , (9)
where t1 is equal to -5 (5 minutes before the news release) and t2 equals 20 (the last minute of
the event window).
The aggregation of mean abnormal returns through time provides us with information
about the overall influence of the event of interest on the new-EU-country currency market.
Moreover, CAR describes the duration and strength of each news cluster (good, bad, or
neutral) on euro- or U.S. dollar-denominated new-EU-country currencies in the first 20

18
minutes after the news announcement, as well as shortly before news is actually released
(Figure 4). The left and right portions of Figure 4 depict CAR for euro- and U.S. dollar-
denominated exchange rates, respectively.19
A visual inspection of Figure 4 shows a substantial effect of macroeconomic
announcements on new-EU-country currencies. However, important asymmetries can be
detected with respect to both base currencies. Good German/Eurozone macroeconomic news
leads to new EU (quoting) currency appreciation with respect to the euro (base currency).
This does not mean that the euro depreciates after good news is released. Rather, the CAR
evidences a stronger reaction of the new-EU-country currencies to good news from
Germany/the Eurozone. Similarly, neutral news that is in line with market consensus leads to
new-EU-country (quoting) currency appreciation as well. In a sense, we might say that the
finding resonates well with the common notion that “no news is good news”. On the contrary,
bad news leads towards a depreciation of the new-EU-country currencies with respect to the
euro.
The U.S. dollar-denominated exchange rates offer a different picture, though. Good
U.S. macroeconomic news leads to U.S. dollar (base currency) appreciation and local new-
EU-country (quoting) currency depreciation; the opposite pattern is linked to bad news. This
discrepancy in the reaction, when compared to the euro-denominated exchange rates, can be
reasonably explained, though. Earlier we stressed the importance of economic links between
the new EU countries and the Eurozone and specifically Germany. Hence, there is a strong
reaction of the new-EU-country currencies to German/Eurozone news. On the other hand, the
economic links of the new EU countries with the U.S. are less strong. Hence, when U.S.-
originated good news is released, both the U.S. dollar and other currencies react. It is no
surprise that the reaction of the U.S. dollar should be stronger than the reaction of any new-
EU-country currency. Therefore, a depreciation of a new-EU-country currency following
good U.S. news simply means that the reaction of the currency is weaker than the reaction of
the U.S. dollar itself. The reaction to neutral news is mixed. Finally, note that the reaction of
U.S. dollar-denominated exchange rates is greater than reaction of those linked to the euro.
This is clearly visible as the scales of the two parts of Figure 4 are not the same.
19 As we defined earlier in Section 2.1, a negative change (growth rate) in an exchange rate means an appreciation of the quoting currency (CZK, HUF, PLN) with respect to the reference currency (EUR, USD). In terms of the monetary profit realized by a forex trader, appreciation means a positive return because less units of the quoting currency is needed to buy 1 unit of the reference currency. Same analogy is valid for a currency’s depreciation. We graphically present positive (negative) cumulative abnormal returns (CAR) in a positive (negative) domain of the graph.

19
The CAR analysis provides an aggregate assessment and shows the pattern of the
market reaction. The cumulative abnormal returns of the euro-denominated exchange rates
reach lower values with a maximum of 0.2% and a minimum of -0.2% during the first 20
minutes after the news release, while those linked to the U.S. dollar reach three times higher
values with a maximum slightly above 0.9% and a minimum slightly below 0.%. This means
that the overall impact of macroeconomic news announcements is stronger for the U.S. pairs
than the euro pairs. The above results allow us to reject null Hypothesis 3. Hence, there are
considerable differences in the size of the news effect on the value of the new-EU-country
currencies with respect to the origin of the news. The above results also mean that the forex
market’s segment with new-EU-country currencies denominated in the U.S. dollar is less
efficient than that with currencies related to the euro.
The reaction of U.S.-denominated new-EU-country currencies to bad news is 50
percent stronger than the reaction to good news. The CARs of U.S. dollar-denominated new-
EU exchange rates reach 0.9% after bad news and -0.% following good news. Moreover, the
reaction of the market to bad news lasts longer. It takes twice as long for the CAR curve to get
flat. Conversely, euro-denominated new-EU-country currencies show a heavier reaction to
good news when it comes to CZK/EUR and PLN/EUR. This does not hold for HUF/EUR,
where CAR for bad news reaches higher values than for good news, especially from the 11th
minute after the news announcement. Null Hypothesis 4 about new-EU-country currencies’
equal reaction to all types of news (good, bad, and neutral) is rejected.
Concerning the duration of the news announcement effect, it is obvious that mean
abnormal returns appear on the market even before the news is released. Generally speaking,
CAR starts to move two minutes before the announcement. The strong immediate market
reaction takes place two minutes after the announcement for good news and approximately
five minutes after for bad news. This does not hold for PLN/EUR, which reacts indifferently
to bad news. Following the results above and in Figure 4 we can see that new public
information is relatively quickly incorporated into the currency prices, despite that some
temporary inefficiencies exist. In this respect, we can reject null Hypothesis 6 that the new-
EU-country forex market does not exhibit temporary inefficiency. On the other hand, based
on our results the new EU forex markets seem to be quite efficient in general.
4.4 ECB and Fed communication on their monetary policy settings
Finally, we examine the reaction of new-EU-country currencies to changes in the Eurozone
and U.S. monetary policy settings. We analyze these reactions during the period (2011–2015)
20
characterized by the fact that conventional monetary policy tools were unable to adequately
respond to the economic situation (Swanson and Williams, 2014). Many central banks had to
find new ways of using the tools at their disposal to stimulate economic activity in the face of
the prolonged downturn and sluggish recovery. One way of doing so was, and for many
central banks continues to be, further asset purchases on the central bank’s account with the
policy interest rate already at (or near) the zero bound.
We examine the forex market reaction when the ECB or the Fed announced changes in
their monetary policy settings mostly related to monetary expansion (see Table A7 in the
Appendix for details). The quantitative results are shown in Table 2: all three currencies react
to steps taken by the two key central banks in a remarkably different manner.
The Czech koruna reacted immediately after the ECB loosened monetary policy
conditions. The CZK/EUR exchange rate exhibits the strongest reaction among the euro-
denominated exchange rates as the abnormal returns are statistically significant immediately
after the news release. The forceful and quick reaction of CZK/EUR is, however, complicated
with alternating signs of abnormal returns. Such an undetermined direction of movement may
be explained by the CNB currency interventions and its presence on the currency market as,
on the stronger side of the CZK 27/EUR level, the CNB is preventing the koruna from further
appreciation by intervening on the foreign exchange market. Mean abnormal returns of
PLN/CZK is mostly consistent in the direction of the currency reaction, even though
significant abnormal returns appear only five minutes after information release. The result
shows that easier monetary conditions in the Eurozone led to the depreciation of the Polish
currency and euro appreciation. The reaction of HUF/EUR is the mildest one.
The impact of U.S. monetary policy changes on the new-EU-country currencies is
present but is less significant than that of the ECB monetary policy.20 Both PLN/USD and
HUF/USD depreciate after the Fed eases monetary policy. Negative abnormal returns appear
in the first minute after the news release and depreciation reaches 0.024% (PLN) and 0.49%
(HUF). There is no statistically significant impact on CZK/USD, though.
20 We acknowledge that the more significant impact of ECB monetary policy settings in comparison with Fed statements might be also due to the timing of when reports are published. ECB reports are published at 1:45 pm CET (7:45 am EST) followed by a press conference at 2:30 pm CET (8:30 am EST). This means that the ECB policy reports are published during the period of highest market activity, when UK and U.S. forex trading sessions overlap. Conversely, the Fed's statements are always published at 2:00 pm EST (8:00 pm CET) followed by a press conference at 2:30 pm EST (8:30 pm CET), i.e., during the U.S. trading session when many traders in Europe are no longer active in the markets. On the other hand, 24-hour trading on the forex market does allow for the policy announcements to affect exchange rates around the clock.

21
Based on the above findings we can reject null Hypothesis 7 because we provide
evidence that ECB and Fed monetary policy changes do affect short-term changes in the value
of new-EU currencies.
4.5 Impact of the European sovereign debt crisis
The sample period considered in our empirical study covers a post-U.S. financial crisis period
but it also involves the European sovereign debt crisis period. In this section we explore the
impact of the EU debt crisis on the new EU currency pairs during the interval January 1,
2011-July 26, 2012.21
Draghi (2014) clearly distinguishes timing of both crises, plus shows the differences in
the relationship between financial stress and unemployment during the financial crisis (from
2008) and debt crisis (from 2011). Hence, we begin the analysis of the debt crisis interval in
early 2011 "because during this period, the sovereign debt crisis erupted in full force" as
argued by Frutos et al. (2016; p. 17) who, in their analysis of the stress on the euro-area
interbank market, also show a progressing divergence of the government bonds’ yield within
the euro-area. The end of the debt crisis interval coincides with the remarkable verbatim of
the ECB President Mario Draghi who, at the Global Investment Conference in London on
July 26, 2012, said: “Within our mandate, the ECB is ready to do whatever it takes to preserve
the euro. And believe me, it will be enough” (Draghi, 2012). Fiordelisi and Ricci (2016) show
that the European financial markets started to rally immediately after the above statement and
economic situation begun to improve as well.22
We assess the issue of the European sovereign debt crisis based on the cumulative
abnormal returns (CAR) shown separately for the debt crisis (Figure 5) and post-debt crisis
(Figure 6) periods. The dynamics of the post-debt crisis period’s CAR is remarkably similar
to that reported already for the full span of our analysis (Figure 4). However, the dynamics of
the debt-crisis CAR (Figure 5) differs for the CAR of the U.S. dollar denominated exchange
rate returns. The debt-crisis CAR patterns for the U.S. dollar-denominated exchange rates
(Figure 5) indicate that during the European sovereign debt crisis the new-EU markets reacted
quite sensitively to the positive U.S. macro news. Such sensitivity might be strengthened by
the fact that the three new EU countries were to some extent protected from the negative
impact of the euro-area debt-crisis by having their own currencies. Further, during the 21 We are grateful to anonymous referee for bringing this issue to our attention. The Section 4.5 is the result. 22 Eurostoxx gained 4.3% on the day of the speech (8.1% up to the end of July 2012); other important stock indices performed in a similar way: IBEX 6.1% (13.1%), S&PMIB 5.6% (12.4%), CAC40 4.1% (7.1%), DAX 2.8% (6.0%).

22
European sovereign debt crisis the U.S. economic situation was better compared to that in the
EU (McKee et al., 2012). Hence, despite the dominating connection of the new EU countries
to the EU and the euro-area, the positive U.S. announcements were received by the new EU
forex markets remarkably well. In sum, the debt-crisis CAR patterns for the U.S. dollar-
denominated exchange rates (Figure 5) indicate that during the European sovereign debt crisis
the new-EU markets reacted quite sensitively to positive macro news. In this respect, positive
U.S. macroeconomic data have been conveying the sign of restored economic growth in the
U.S. and signaled some potential of the economy recovery coming to the euro-area as well.
Hence, the contrast between the positive news coming from the U.S. and bleak economic
prospects during the European sovereign debt crisis seems to be a realistic factor behind the
finding.
Our interpretation can be further corroborated by the findings of Baruník et al. (2017)
who, in their intra-day analysis, show that negative volatility spillovers among the key world
currencies during 2011-2012 were chiefly tied to the sovereign debt crisis in Europe. In
addition, when comparing the CAR values during the sovereign debt crisis and post-crisis
periods, we observe that the market segment with the euro-denominated exchange rates is
more efficient in post-crisis period. The situation is different in the market segment with the
U.S. dollar-denominated exchange rates that becomes less efficient after the European debt
crisis in terms of high CAR values. Finally, the set of the above findings allows us to reject
Hypothesis 8.
5. Conclusions
In this paper, we analyze the impact of specific information entering the forex market on the
currencies of new EU members (Czech koruna, Hungarian forint, and Polish zloty); the
exchange rates are denominated in the euro and the U.S. dollar. The information covered
includes Eurozone/Germany and U.S. macroeconomic news announcements, and
communication on the monetary policy settings of the ECB and the Fed. In our analysis, we
fully exploit the wealth of intraday data and cover a relatively long period after the global
financial crisis (2011–2015). As a tool, we use event study methodology (ESM) because of its
precision in identifying the reaction of an asset following each event, i.e. a macroeconomic
announcement or policy setting communication. The impact of the events is characterized by
the behavior of the mean abnormal returns. Hence, by using ESM we are also able to assess
temporary forex market inefficiencies.

23
The results of our analysis can be summarized as follows. The biggest impact, in terms
of the highest abnormal return, in euro-denominated currency pairs, occurs on PMI indices,
the Ifo index, and the GDP release. With respect to the U.S. dollar-denominated currency
pairs, the highest abnormal returns are linked with the NFP and GDP releases. The longest
reaction in terms of significant abnormal returns after the news release can be traced to
announcements of the PMI, Retail Sales, Ifo, or Industrial Production. The exchange rates
with respect to the U.S. dollar exhibit higher abnormal returns than euro-denominated
currency pairs.
We distinguish the surprise element in the announcements by dividing the news into
three clusters—good, bad, and neutral news—which are defined by the difference between the
announcement and its expectation. Larger abnormal returns after Eurozone/Germany news
announcements are in general linked with good news. Conversely, in the case of U.S. dollar-
denominated exchange rates, larger abnormal returns are linked to bad news. The results also
show that the values of statistically significant abnormal returns of the euro-denominated
exchange rates are smaller, occur less often, and last for a shorter time than for U.S. dollar-
denominated exchange rates. Finally, the segment of the new EU forex market, where
currencies are traded with respect to the euro, is more efficient than its U.S. dollar-based
counterpart. Examining the EU debt crisis separately, we noticed that the dynamics of the
debt-crisis CAR differs for the U.S. dollar denominated exchange rate returns during the
European debt crisis. Particularly, positive U.S. announcements result in positive CAR. Sharp
difference in the economic development between the U.S. and the euro-area during the debt
crisis seem to be a plausible factor behind the result.
Communications on the monetary policy settings show that ECB communication
matters. The CZK/EUR exchange rate exhibits the strongest and HUF/EUR the quietest
reaction among euro-denominated exchange rates. The impact of Fed monetary policy
changes on the new-EU-country currencies is present but less significant than that of the
ECB: both PLN/USD and HUF/USD depreciate after the Fed eases monetary policy but there
is no statistically significant impact on the CZK/USD exchange rate.
Our analysis is the first of its kind, providing a comprehensive analysis of the reaction
of selected new EU forex markets to a wide array of macroeconomic information during the
post-GFC period. We show strong and specific reactions along with temporary inefficiencies
present on these forex markets.

24
References
Andersen, T. G., Bollerslev, T., Diebold, F. X., Vega, C. (2003). Micro Effects of Macro Announcements: Real-Time Price Discovery in Foreign Exchange. American Economic Review, 93(1), 38-62.
Andersen, T. G., Bollerslev, T., Diebold, F. X., Vega, C. (2007). Real-time price discovery in global stock, bond and Foreign Exchange markets. Journal of International Economics, 73(2), 251–277.
Andersson, M., Overby, L. J., Sebestyén, S. (2009). Which News Moves the Euro Area Bond Market? German Economic Review, 10(02), 1-31.
Andritzky, J. R., Bannister, G. J., Tamirisa, N. T. (2007). The Impact of Macroeconomic Announcements on Emerging Market Bonds. Emerging Markets Review, 8(1), 20–37.
Ball, R., Brown, P. (1968). An Empirical Evaluation of Accounting Income Numbers. Journal of Accounting Research, 6(2), 159–78.
Baruník, J., Kočenda, E., Vácha, L. (2017). Asymmetric Volatility Connectedness on the Forex Market. Journal of International Money and Finance, 77, 39–56.
BIS (2013). Triennial central bank survey. Foreign exchange turnover in April 2013: preliminary global results. Technical report, Monetary and Economic Department, Bank for International Settlements.
Bredin, D., Hyde, S. J., O'Reilly, G. P. (2009). European monetary policy surprises: the aggregate and sectoral stock market response. International Journal of Finance & Economics, 14(2), 156-171.
Bowman, D., Londono, J.M., Sapriza, H. (2015). U.S. unconventional monetary policy and transmission to emerging market economies. Journal of International Money and Finance, vol. 55(C), 27-59.
Brown, S. J., Warner, J. B. (1980). Measuring security price performance. Journal of Financial Economics, 8(3), 205-258.
Busse, A., Green, T.C. (2002). Market efficiency in real time. Journal of Financial Economics, 65(3), 415-437.
Büttner, D., Hayo, B., Neuenkirch, M. (2012). The impact of foreign macroeconomic news on financial markets in the Czech Republic, Hungary, and Poland. Empirica, 39(1), 19-44.
Cai, F., Joo, H., Zhang, Z. (2009). The Impact of Macroeconomic Announcements on Real Time Foreign Exchange Rates in Emerging Markets. International Finance Discussion Papers, no. 973. Board of Governors of the Federal Reserve System (U.S.).
Cakan, E., Doytch, N., Upadhyaya, K.P. (2015). Does U.S. macroeconomic news make emerging financial markets riskier? Borsa Istanbul Review, 15(1), 37-43.
Campbell, C., Wasley, C. (1993). Measuring Security Price Performance Using Daily NASDAQ Returns. Journal of Financial Economics, 33(1), 73-92.
Caporale, G.M., Spagnolo, F., Spagnolo, N. (2017). Macro news and exchange rates in the BRICS. Finance Research Letters 21, 140–143.
Cavusoglu, N. (2011). Exchange rates and the effectiveness of actual and oral interventions: A survey on findings, issues and policy implications. Global Economy Journal, 10(4), 1-40.
Chaboud, A. P., Chernenko, S. V., Howorka, E., Iyer, R. S. K., Liu, D., Wright, J. H. (2004). The High-Frequency Effects of U.S. Macroeconomic Data Releases on Prices and Trading Activity in the Global Interdealer Foreign Exchange Market. Board of Governors of the Federal Reserve System, International Finance DP No. 823.
Corrado, C. J. (2011). Event studies: A methodology review. Accounting and Finance, 51(1), 207-234.
25
Corrado, C. J., Truong, C. (2008). Conducting event studies with Asia-Pacific security market data. Pacific-Basin Finance Journal, 16(5), 493–521.
Corrado, C. J., Zivney, T. L. (1992). The specification and power of the sign test in event study hypothesis tests using daily stock returns. Journal of Financial and Quantitative Analysis, 27(03), 465–478.
Draghi, M. (2012). Verbatim of the remarks made by Mario Draghi. Speech by Mario Draghi, President of the European Central Bank at the Global Investment Conference in London, 26 July 2012. Available at: https://www.ecb.europa.eu/press/key/date/2012/html/sp120726.en.html (Accessed on July 26, 2017).
Draghi, M. (2014). Unemployment in the euro area. Speech by Mario Draghi, President of the ECB, Annual central bank symposium in Jackson Hole, 22 August 2014. Available at: https://www.ecb.europa.eu/press/key/date/2014/html/sp140822.en.html (Accessed on July 26, 2017).
Egert, B. (2007). Central bank interventions, communication and interest rate policy in emerging European economies. Journal of Comparative Economics, 35(2), 387-413.
Egert, B., Kočenda, E. (2007). Interdependence between Eastern and Western European Stock Markets: Evidence from Intraday Data. Economic Systems, 31(2), 184-203.
Egert, B., Kočenda, E. (2011). Time-Varying Synchronization of the European Stock Markets. Empirical Economics, 40(2), 393-407.
Egert, B., Kočenda, E. (2014). The impact of macro news and central bank communication on emerging European forex markets. Economic Systems, 38(1), 73-88.
Ehrmann, M., Fratzscher, M. (2005). Equal size, equal role? Interdependence between the euro area and the United States. The Economic Journal, 115(506), 928-948.
Fama, E. F., Fisher, L., Jensen, M. C., Roll, R. (1969). The Adjustment of Stock Prices to New Information. International Economic Review, 10(1), 1–21.
Fatum, Rasmus and Hutchison, Michael M. Is Sterilised Foreign Exchange Intervention Effective After All? An event study Approach. The Economic Journal, April 2003b, 113(487), 390-411.
Faust, J., Rogers, J. H., Swanson, E., Wright, J. H. (2003). Identifying the Effects of Monetary Policy Shocks on Exchange Rates Using High Frequency Data. Journal of the European Economic Association, 1(5), 1031–1057.
Fedorova, E., Wallenius, L., Collan, M., (2014). The Impact of Euro Area Macroeconomic Announcements on CIVETS Stock Markets. Procedia Economics and Finance, vol. 15, 27-37.
Fiordelisi, F., Ricci, O. (2016). “Whatever it takes”: An Empirical Assessment of the Value of Policy Actions in Banking. Review of Finance, 20(6), 2321–2347.
Fratzscher, M. (2006). On the long-term effectiveness of exchange rate communication and interventions. Journal of International Money and Finance, 25(1), 146-167.
Fratzscher, M. (2008). Oral Interventions Versus Actual Interventions in Fx Markets – An Event-Study Approach. The Economic Journal, 118(530), 1079–1106.
Frutos, J.C., Garcia-de-Andoain, C., Heider, F., Papsdorf, P. (2016). Stressed interbank markets: evidence from the European financial and sovereign debt crisis. European Central Bank WP No. 1925.
Fuentes, M., Pincheira, P., Julio, J.M., Rincón, H., García-Verdú, S., Zerecero, M., Vega, M., Lahura, E., Moreno, R. (2014). The effects of intraday foreign exchange market operations in Latin America: results for Chile, Colombia, Mexico and Peru. BIS Working Papers No. 462.

26
Gilbert, T., Scotti, Ch., Strasser, G., Vega, C. (2016). Is the intrinsic value of macroeconomic news announcements related to their asset price impact? ECB Working Paper No. 1882.
Gurgul, H., Wójtowicz, T. (2014). The impact of US macroeconomic news on the Polish stock market. Central European Journal of Operations Research, 22(4), 795-817.
Gürkaynak, R. S., Sack, B., Swanson, E. (2005). Do Actions Speak Louder Than Words? The Response of Asset Prices to Monetary Policy Actions and Statements. International Journal of Central Banking, 1(1), 55-93.
Hanousek, J., Kočenda, E. (2011). Foreign News and Spillovers in Emerging European Stock Markets. Review of International Economics, 19(1), 170-188.
Hanousek, J., Kočenda, E., Kutan, A. (2009). The Reaction of Asset Prices to Macroeconomic Announcements in New EU Markets: Evidence from Intraday Data. Journal of Financial Stability, 5(2), 199–219.
Hayo, B., Kutan, A. M., Neuenkirch, M. (2010). The impact of U.S. central bank communication on European and pacific equity markets. Economics Letters, 108(2), 172-174.
Jotikasthira, C., Lundblad, C., Ramadorai, T. (2012). Asset Fire Sales and Purchases and the International Transmission of Funding Shocks. Journal of Finance, 67(6), 2015-2050.
Kolari, J. W., Pynnönen, S. (2010). Event study testing with cross-sectional correlation of abnormal returns. Review of Financial Studies, 23(11), 3996-4025.
Kothari, S. P., Warner, J. B. (2006). Econometrics of Event Studies. In Eckbo, B.E. (Ed.), Handbook of Corporate Finance: Empirical Corporate Finance, Elsevier/North-Holland, vol. 1, Ch. 1.
Kurov, A., Sancetta, A., Strasser, G., Wolfe, M.H. (2017). Price drift before U.S. macroeconomic news: private information about public announcements? Forthcoming in Journal of Financial and Quantitative Analysis.
Laakkonen, H. (2007). Exchange Rate Volatility, Macro Announcements and Choice of the Intraday Seasonality Filtering Method. Bank of Finland Research DP No. 23/2007.
Leon, H., Williams, O. H. (2012). Effectiveness of intervention in a small emerging market: an event study approach. Applied Financial Economics, 22(21), 1811-1820
Lucca, D.O., Moench, E. (2015). The Pre-FOMC Announcement Drift. The Journal of Finance, 70(1), 329–371.
MacKinlay, A. C. (1997). Event studies in economics and finance. Journal of Economic Literature, 35(1), 13–39.
McKee, M., Karanikolos, M., Belcher, P., Stuckler, D. (2012). Austerity: a failed experiment on the people of Europe. Clinical Medicine, 12(4), 346-350.
Menkhoff, L. (2010). High-frequency analysis of foreign exchange interventions: What do we learn? Journal of Economic Surveys. 24(1), 85–112.
Menkhoff, L. (2013). Foreign Exchange Intervention in Emerging Markets: A Survey of Empirical Studies. The World Economy, 36(9), 1187-1208.
Naidu, A. S. H. (2011). Effectiveness of Foreign Exchange Market Intervention in India: An Event Study Analysis. Institute of Public Enterprise. Journal of Economic Policy & Research, 6(2).
Neely, CJ., Dey, S.R. (2010). A Survey of Announcement Effects on Foreign Exchange Returns. Federal Reserve Bank of St. Louis Review, 92(5), 417-463.
Orlowski, L.T., 2012. Financial crisis and extreme market risks: Evidence from Europe. Review of Financial Economics, 21(3), 120-130.
Orlowski, L.T., 2016. Co-movements of non-Euro EU currencies with the Euro. International Review of Economics & Finance, 45(C), 376-383.
27
Park, N.K. (2004). A guide to using event study methods in multi-country settings. Strategic Management Journal, 25, 655–668.
Poole, W. (2005). How predictable is Fed policy? Federal Reserve Bank of St. Louis Review, 87(6), 659-68.
Rai, V., Suchanek, L. (2014). The Effect of the Federal Reserve’s Tapering Announcements on Emerging Markets. Bank of Canada Working Paper, No. 2014-50.
Ramchander, S., Simpson, M. W., Thiewes, H., (2008). The Effects of Macroeconomic News on German Closed-End Funds. Quarterly Review of Economics and Finance, 48(4), 708–724.
Ranaldo, A., Rossi, E. (2010). The reaction of asset markets to Swiss National Bank communication. Journal of International Money and Finance, 29(3), 486-503.
Savor, P., Wilson, M. (2013). How Much Do Investors Care About Macroeconomic Risk? Evidence from Scheduled Economic Announcements. Journal of Financial and Quantitative Analysis, 48(2), 343-375.
Scalia, A. (2008). Is foreign exchange intervention effective? Some microanalytical evidence from the Czech Republic. Journal of International Money and Finance, 27(4), 529–546.
Shah, P., Arora, P. (2014). M&A Announcements and Their Effect on Return to Shareholders: An Event Study. Accounting and Finance Research, 3(2), 170-190.
Swanson, E. T. (2011). Let's Twist Again: A High-Frequency Event-study Analysis of Operation Twist and Its Implications for QE2. Brookings Papers on Economic Activity, 42 (1), 151-207.
Swanson, E.T., Williams, J.C.,(2014). Measuring the Effect of the Zero Lower Bound on Medium- and Longer-Term Interest Rates. American Economic Review, 104(10): 3154–3185.
Wang, J., Bilson, J. (2017). An Empirical Investigation of Eastern European Bond Markets, Emerging Markets Finance and Trade, 53(1), 199-212.
Wongswan, J. (2009). The response of global equity indexes to U.S. monetary policy announcements. Journal of International Money and Finance, 28(2), 344-365.

Table 1: German/Eurozone and U.S.A macroeconomic news release calendar
Notes: The table shows the sequence of examined macroeconomic news announcements in Germany/Eurozone and the U.S.A. The time difference between the European and U.S. financial markets is accounted for by setting a homogenous CET time for all news releases so there is no time difference. We took into consideration that Daylight Savings Time starts in the U.S.A. two weeks earlier than in Europe in the spring and ends one week later in the fall. All announcements are released monthly, except for GDP, which is measured quarterly.
The announcements are abbreviated as follows: NFP – Nonfarm Payrolls, PMI – Purchasing Managers’ Indices from Manufacturing and Non-Manufacturing (Serv. – Service) Sectors, GDP – Gross Domestic Product, Ind. Prod. – Industrial Production, Core DGO – Core Durable Goods Orders, Trade. Bal. – Trade Balance, CPI – Consumer Price Index, PPI – Producer Price Index, ZEW – German Economic Sentiment Index, IFO – German Business Climate Index, Ret. Sales – Retail Sales.
A confounding events problem may occur if two or more macroeconomic announcements are released on the same day, within a 90-minute time span, and do not have the same hypothesized effect on the quoting currency. In the U.S., the problem is chiefly connected with CPI, PPI, and Industrial Production. Industrial Production is always released 45 minutes after the price indices. We consider news on CPI, PPI and Industrial Production only if they do not contain contradictory information, i.e., if all the announcements have the same effect on the quoting currency. Altogether, there are only 39 of 60 price announcements examined (CPI and PPI). Regarding German PMI indices, we analyze 32 out of 60 events, because PMI indices from the manufacturing and non-manufacturing sectors are usually released on the same date and hour.
Time (CET)11:00 a.m. ZEW German Economic Sentiment Index (on 2nd or 3rd Tuesday of the current month)9:30 a.m. PMI German Manufacturing & Non-Manufacturing Sector (3 weeks into current month)10:00 a.m. IFO German Business Climate Index (3 weeks into current month)11:00 a.m. Eurozone Flash CPI (around the end of the current month)11:00 a.m. Eurozone Retail Sales (around 35 days after the month 11:00 a.m. Eurozone PPI (around 35 days after the month ends)8:00 a.m. German Industrial Production (about 40 days after the month ends)11:00 a.m. Eurozone Trade Balance (about 45 days after the month ends)8:00 a.m. German preliminary GDP (about 45 days after quarter ends)
16 19 22 25 28 31 5 9 10 14 15 17 18 20 21 24 25 27 30 30 1 15 20 30
Germany/Eurozone
Month X+2Month X Month X+1
Time (CET)
4:00 p.m. PMI Manufacturing Index (1st business day after the month ends)2:30 p.m. NFP (1st Friday after the month ends)4:00 p.m. PMI Non-manufacturing Index (3rd business day after the month ends)2:30 p.m. Retail Sales (about 13 days after the month ends)2:30 p.m. PPI (about 14 days after the month ends)3:15 p.m. Industrial Production about 16 days after the month ends)2:30 p.m. CPI (about 16 days after the month ends)2:30 p.m. Core Durable Good orders (about 26 days after month ends)2:30 p.m. Trade Balance (about 35 days after month ends)2:30 p.m. Advance GDP (about 30 days after quarter ends)
25 28 31 2 3 5 11 12 14 15 17 18 20 21 24 25 26 30 1 5 10 15 20 30
USA
Month X Month X+1 Month X+2

Table 2: Effect of Monetary Policy on Abnormal Returns
Panel A: Effect of the ECB Monetary Policy on Abnormal Returns
AR % Tcz Q AR % Tcz Q AR % Tcz Q
-5 0,000 c 1,69 0,020 -0,56 0,003 a 3,49
-4 0,003 a 3,56 -0,002 b 2,05 0,001 1,09
-3 0,006 0,64 0,005 0,18 0,003 0,20
-2 -0,002 0,56 -0,016 a 3,18 -0,005 1,39
-1 -0,005 c 1,89 0,013 0,37 0,005 c 1,91
0 0,021 -0,57 0,007 -0,20 0,016 -1,46
1 0,000 a 2,77 0,042 -1,00 0,007 0,47
2 0,007 b 2,30 0,025 -3,00 0,005 -0,21
3 -0,018 a 2,66 0,027 -0,13 0,024 -1,76
4 -0,001 b 2,08 -0,009 1,53 0,000 -0,08
5 0,005 0,95 -0,012 a 3,54 0,018 0,80
6 0,001 a 2,77 0,005 0,17 0,001 0,61
7 0,011 0,38 -0,003 c 1,65 -0,008 1,34
8 0,019 -0,02 -0,004 b 2,51 0,000 0,86
9 0,011 1,40 0,002 0,90 0,024 -0,71
10 0,011 b 2,15 0,024 -1,77 0,004 0,91
11 -0,003 c 1,66 -0,007 b 2,44 0,004 -0,46
12 0,021 0,37 -0,006 1,09 0,027 -0,51
13 -0,005 1,43 0,025 -0,45 0,005 0,20
14 0,008 1,33 -0,007 1,44 -0,010 a 3,33
15 -0,007 a 2,74 -0,008 a 2,71 0,004 -0,14
Tim
e CZK/EUR (12) PLN/EUR (12) HUF/EUR (12)
Note: Symbols a, b, and c denote statistical significance at the 1, 5, and 10% levels based on the Corrado-Zivney Tcz statistics.

Panel B: Effect of the Fed Monetary Policy on Abnormal Returns
AR % Tcz Q AR % Tcz Q AR % Tcz Q
-5 0,002 1,11 -0,001 0,08 -0,015 a 2,94
-4 0,002 0,86 0,009 -0,83 0,001 0,18
-3 -0,010 1,54 0,002 0,55 0,009 0,03
-2 -0,032 1,47 -0,019 1,19 -0,002 1,15
-1 -0,002 1,21 -0,064 1,58 -0,076 a 3,16
0 -0,013 0,51 -0,024 c 1,70 -0,049 b 2,19
1 -0,045 1,61 0,010 -0,15 0,015 -0,12
2 0,018 -0,36 0,002 0,76 0,020 0,12
3 0,004 0,54 0,000 0,98 0,020 -0,82
4 0,010 -0,29 0,027 -0,85 -0,007 c 1,67
5 -0,021 0,86 0,000 -0,03 0,024 0,08
6 0,002 0,88 0,031 0,05 0,005 0,52
7 0,004 0,88 0,027 -0,30 -0,005 -0,03
8 0,073 0,02 0,020 0,03 0,013 0,38
9 0,015 -0,12 -0,039 a 2,64 0,017 0,22
10 0,008 0,31 0,027 0,59 -0,008 1,32
11 0,039 -0,04 0,046 -0,36 0,040 -0,25
12 0,001 1,15 -0,005 c 1,71 0,023 -0,88
13 -0,014 1,31 0,001 0,69 -0,019 b 2,36
14 -0,018 0,98 0,005 0,26 -0,008 0,61
Tim
e CZK/USD (6) PLN/USD (6) HUF/USD (6)
Note: Symbols a, b, and c denote statistical significance at the 1, 5, and 10% levels based on the Corrado-Zivney Tcz statistics.

Figure 1: One-minute spot exchange rates of local currencies denominated in Euro (left) and
their percentage returns (right).
(January 3, 2011 - December 31, 2015)

Figure 2: One-minute spot exchange rates of local currencies denominated in U.S. dollar (left)
and their percentage returns (right).
(January 3, 2011 - December 31, 2015)

Figure 3: Box-and-whisker plots of percentage abnormal returns (AR%) linked to clusters of
good, bad, and neutral news
Panel A: Exchange rates of local currencies denominated in Euro
Panel B: Exchange rates of local currencies denominated in U.S. dollar
-.20
-.15
-.10
-.05
.00
.05
.10
.15
.20
Good Bad Neutral Good Bad Neutral Good Bad Neutral
CZK/USD PLN/USD HUF/USD
AR (%)

Figure 4: Cumulative mean abnormal returns (CAR in %) on the currency pairs linked to good,
bad, and neutral news
Total examined period (2011-2015)

Figure 5: Cumulative mean abnormal returns (CAR in %) on the currency pairs linked to good,
bad, and neutral news
EU debt crisis (3.1.2011- 26.7.2012)
Figure 6: Cumulative mean abnormal returns (CAR in %) on the currency pairs linked to good,
bad, and neutral news
Post-EU debt crisis (27.7.2012 – 31.12.2015)

Appendix
Table A1: Effect of Macroeconomic Announcements on Abnormal Returns of CZK/EUR
A: Good News
B: Bad News
C: Neutral News
Note: Table contains values of mean abnormal percentage returns (AR%) on a currency pair as an effect of the macroeconomic announcements in the event window running from -5 to 10 minutes; announcement occurs at 0 minute. We report statistical significance (denoted by a symbol) at the 1 (a), 5 (b), and 10% (c) levels based on the Corrado-Zivney Tcz statistics with the corresponding critical values of 2,58 (1%), 1,96 (5%), and 1,65 (10%). The sample runs from January 3, 2011 to December 31, 2015. The announcements are abbreviated as follows: , ZEW – German Economic Sentiment Index, PMI – Purchasing Managers’ Indices from Manufacturing and Services Sectors, IFO – German Business Climate Index, GDP – Gross Domestic Product, CPI – Consumer Price Index, PPI – Producer Price Index. Number of examined events is indicated in the parentheses.
AR % AR % AR % AR % AR % AR % AR % AR % AR %
-5 -0.002 a 0.009 c 0.002 -0.003 0.001 -0.001 c 0.000 0.000 b 0.001-4 0.001 -0.007 a 0.002 -0.001 a 0.000 0.004 b 0.002 0.002 0.002 c
-3 0.002 0.005 0.001 b 0.004 0.001 -0.001 c -0.003 a 0.000 0.000 c
-2 0.001 0.005 -0.004 a 0.007 -0.005 b -0.004 -0.001 c -0.001 c 0.003 b
-1 0.011 0.007 0.008 0.001 0.000 0.001 c -0.003 c 0.000 b -0.001 c
0 0.000 b 0.000 0.004 b 0.002 0.002 0.004 -0.002 b 0.000 b 0.000 b
1 0.001 0.012 0.011 0.000 -0.004 a 0.004 -0.005 a -0.002 a 0.0042 -0.001 0.015 0.002 0.003 a 0.007 -0.002 b -0.002 0.001 0.0003 0.002 a -0.002 b 0.001 a -0.001 c 0.001 b 0.000 0.001 0.001 -0.005 a
4 -0.002 0.000 c 0.008 -0.003 a -0.003 a 0.006 0.001 b -0.005 a 0.0005 0.001 a 0.004 a -0.005 a 0.003 0.001 -0.003 a 0.002 b 0.004 -0.0016 0.000 -0.006 b -0.001 a 0.002 b 0.001 -0.001 0.001 a 0.000 b 0.0017 -0.003 a 0.003 b 0.000 a 0.001 c -0.001 c 0.001 c 0.002 0.001 a 0.0058 -0.003 0.000 0.008 -0.004 b -0.002 a 0.002 -0.006 a 0.001 0.001 a
9 0.004 0.000 0.003 0.002 -0.001 b 0.002 a 0.008 0.000 0.002 c
10 -0.001 c 0.005 0.005 b 0.000 a -0.006 0.001 b 0.000 0.001 0.001
CPI (21) PPI (24)PMI (13) IFO (31)Ind. Prod.
(24)GDP (9)
Retail Sales
(23)
Trade
Balance (23)ZEW (24)
Tim
e
AR % AR % AR % AR % AR % AR % AR % AR % AR %
-5 0.002 0.001 b 0.003 -0.002 c 0.003 -0.001 -0.001 0.000 b 0.001-4 0.003 -0.002 c 0.000 a -0.002 a -0.007 a 0.000 c 0.004 b 0.002 0.002 c
-3 -0.004 a -0.005 b -0.003 a 0.002 0.001 0.003 -0.001 b 0.000 0.000 c
-2 0.001 -0.004 a 0.001 -0.001 b 0.006 -0.003 a 0.001 b -0.001 c 0.003 b
-1 -0.007 a -0.002 b -0.002 c -0.004 a -0.015 a -0.002 a -0.002 b 0.000 b -0.001 c
0 -0.001 -0.019 a -0.001 a -0.002 c -0.006 c 0.001 0.002 c 0.000 b 0.000 b
1 0.002 0.004 0.000 c -0.002 a -0.005 b 0.000 a -0.005 c -0.002 a 0.0042 0.000 -0.006 a 0.000 c -0.001 a 0.002 b 0.003 -0.005 0.001 0.0003 -0.004 a -0.005 a 0.006 -0.002 a -0.006 0.004 -0.002 b 0.001 -0.005 a
4 -0.001 -0.003 b -0.001 b 0.000 a -0.004 0.002 -0.001 a -0.005 a 0.0005 0.001 a -0.003 a 0.000 a 0.000 0.004 -0.004 a 0.002 a 0.004 -0.0016 0.003 -0.001 0.001 b -0.007 a 0.001 0.000 0.000 a 0.000 b 0.0017 0.004 0.000 c 0.001 a 0.001 a -0.002 -0.002 a 0.001 a 0.001 a 0.0058 0.002 -0.002 0.002 0.004 0.002 0.005 -0.001 a 0.001 0.001 a
9 0.001 -0.002 b 0.003 0.000 -0.004 a -0.001 a -0.002 0.000 0.002 c
10 0.003 -0.004 b -0.002 a -0.003 a 0.006 -0.002 a 0.002 0.001 0.001
Retail Sales
(29)
Trade
Balance (30)CPI (21) PPI (24)
Tim
e ZEW (32) PMI (19) IFO (26)Ind. Prod.
(33)GDP (7)
AR % AR % AR % AR % AR % AR % AR % AR %
-5 0.007 0.008 0.011 -0.007 a -0.003 0.000 0.000 -0.002 c
-4 -0.015 b -0.010 -0.012 a 0.007 0.002 0.000 -0.003 b 0.000 b
-3 -0.037 b 0.000 0.009 0.002 -0.003 b -0.008 0.000 0.002-2 -0.007 0.008 0.004 0.005 0.007 0.000 0.014 -0.007-1 0.026 -0.014 c 0.010 -0.005 b 0.006 0.004 -0.008 -0.002 c
0 0.007 -0.007 0.001 0.001 0.000 -0.002 -0.001 a -0.003 a
1 -0.004 -0.007 -0.001 0.016 0.004 0.002 -0.003 a 0.002 b
2 -0.011 c 0.015 0.002 -0.001 b 0.012 0.000 -0.001 -0.0013 -0.007 c 0.004 0.000 b 0.007 0.004 -0.002 0.001 -0.014 a
4 0.004 -0.018 b 0.000 0.002 0.002 0.000 c 0.005 0.0025 0.015 0.047 0.011 -0.004 b 0.003 0.000 c -0.003 b -0.0016 -0.007 0.000 0.003 0.002 -0.001 0.004 -0.005 b -0.0017 0.004 0.000 -0.009 a 0.005 0.006 0.002 -0.003 a 0.002 c
8 0.018 0.000 0.001 -0.005 b 0.006 0.002 -0.002 a 0.000 a
9 -0.007 -0.010 0.000 -0.003 -0.001 a 0.002 -0.001 0.001 b
10 0.000 -0.021 b 0.001 0.002 -0.002 0.002 0.000 0.001
Retail Sales
(7)
Trade
Balance (2)CPI (19) PPI (14)
Tim
e ZEW (1) IFO (1)Ind. Prod.
(3)GDP (4)

Table A2: Effect of Macroeconomic Announcements on Abnormal Returns of PLN/EUR
A: Good News
B: Bad News
C: Neutral News
Note: Table contains values of mean abnormal percentage returns (AR%) on a currency pair as an effect of the macroeconomic announcements in the event window running from -5 to 10 minutes; announcement occurs at 0 minute. We report statistical significance (denoted by a symbol) at the 1 (a), 5 (b), and 10% (c) levels based on the Corrado-Zivney Tcz statistics with the corresponding critical values of 2,58 (1%), 1,96 (5%), and 1,65 (10%). The sample runs from January 3, 2011 to December 31, 2015. The announcements are abbreviated as follows: , ZEW – German Economic Sentiment Index, PMI – Purchasing Managers’ Indices from Manufacturing and Services Sectors, IFO – German Business Climate Index, GDP – Gross Domestic Product, CPI – Consumer Price Index, PPI – Producer Price Index. Number of examined events is indicated in the parentheses.
AR % AR % AR % AR % AR % AR % AR % AR % AR %
-5 -0.003 c 0.012 -0.001 c 0.001 0.002 0.000 -0.001 c -0.001 a -0.003 a
-4 0.001 -0.001 -0.002 a -0.001 b -0.002 -0.002 b -0.005 a 0.006 -0.002 a
-3 0.004 0.015 -0.008 a -0.004 a -0.006 -0.006 a -0.003 b 0.002 b 0.002-2 0.004 0.004 0.004 -0.001 a -0.004 0.001 -0.002 b 0.004 0.007-1 0.020 0.009 0.017 0.007 0.013 0.006 0.007 -0.005 b 0.001 a
0 0.003 -0.002 a 0.005 a 0.007 -0.005 a 0.006 0.002 -0.003 a 0.0041 0.003 0.005 0.004 -0.006 a 0.005 -0.001 b 0.004 0.008 0.002 b
2 0.002 -0.013 a -0.003 b -0.002 b -0.006 a 0.002 -0.007 a 0.005 0.0013 0.002 a -0.005 b 0.002 c 0.003 0.003 b 0.003 0.001 0.000 0.000 c
4 0.000 0.008 -0.004 b -0.002 a 0.001 b 0.001 c -0.003 a -0.001 b -0.003 b
5 0.000 c -0.007 a -0.001 c 0.002 b -0.001 0.005 0.003 -0.002 a -0.0016 -0.005 a 0.003 -0.001 a 0.002 b 0.002 -0.002 b 0.002 0.004 -0.003 a
7 0.000 -0.004 -0.011 a -0.003 a 0.016 -0.002 b 0.001 -0.001 b 0.0038 0.004 a -0.002 b 0.002 0.004 a 0.009 -0.002 a -0.004 a 0.002 0.0009 -0.006 b 0.005 0.001 b -0.005 a 0.003 -0.006 a 0.000 b 0.001 0.000 b
10 0.002 -0.008 a -0.006 a -0.003 a -0.002 b -0.001 b -0.005 a 0.001 -0.002
Retail Sales
(23)
Trade
Balance (23)CPI (21) PPI (24)
Tim
e
ZEW (24) PMI (13) IFO (31)Ind. Prod.
(24)GDP (9)
AR % AR % AR % AR % AR % AR % AR % AR % AR %
-5 -0.003 a -0.002 c 0.001 0.000 b 0.002 -0.003 a -0.011 a 0.005 -0.009 a
-4 0.005 -0.007 a 0.004 0.000 a 0.001 -0.003 a 0.001 0.002 -0.002 b
-3 -0.002 a -0.022 a -0.001 a -0.002 b -0.005 a 0.004 c 0.001 a -0.004 b 0.001-2 0.002 -0.004 b -0.005 a 0.001 -0.002 -0.003 b 0.009 -0.001 0.005-1 -0.007 a -0.019 a -0.003 b -0.001 a 0.004 0.000 0.005 -0.002 0.0080 0.000 b -0.004 b 0.012 -0.002 a -0.004 0.000 c -0.004 a 0.004 0.0071 0.000 b 0.007 0.000 a -0.001 b 0.012 -0.001 b -0.001 0.001 0.0022 0.009 -0.009 a 0.008 -0.002 a -0.007 b 0.000 a 0.000 0.005 -0.003 b
3 0.000 0.005 0.001 0.002 a -0.003 c 0.003 0.006 0.001 0.0024 0.004 -0.003 -0.006 a 0.002 c -0.012 a -0.002 b -0.003 b 0.002 -0.002 c
5 0.006 0.011 0.002 0.000 b -0.004 b -0.003 a -0.001 b -0.007 a -0.006 b
6 0.001 -0.010 a 0.000 -0.002 a -0.008 a 0.003 0.000 c -0.004 b 0.0017 -0.002 c -0.006 a 0.004 0.002 a -0.001 b -0.002 a 0.000 c -0.005 b 0.0018 0.000 a -0.007 a 0.003 -0.001 a -0.003 -0.001 a 0.000 0.002 0.002 c
9 0.001 0.000 -0.002 a 0.000 a -0.003 b -0.003 a -0.004 b 0.004 0.00310 0.001 0.004 -0.006 a 0.002 b 0.000 -0.002 b -0.002 -0.002 0.001 c
Retail Sales
(29)
Trade
Balance (30)CPI (18) PPI (20)
Tim
e
ZEW (32) PMI (19) IFO (26)Ind. Prod.
(33)GDP (7)
AR % AR % AR % AR % AR % AR % AR % AR %
-5 -0.002 -0.014 0.003 -0.005 a -0.003 0.004 -0.002 b -0.005 a
-4 0.000 0.000 0.008 0.000 -0.009 a -0.011 -0.002 a 0.005-3 -0.002 0.000 0.003 0.002 0.000 -0.026 a -0.011 a 0.007-2 -0.004 0.031 -0.010 b -0.002 -0.003 c -0.006 0.000 0.003-1 0.027 -0.021 c 0.005 0.000 0.012 0.005 0.002 0.000 b
0 0.000 -0.002 0.002 -0.005 b 0.006 -0.002 -0.003 b 0.0011 0.012 0.010 0.010 0.025 0.004 0.013 0.005 -0.0042 0.015 0.017 -0.003 b 0.011 0.010 0.007 -0.006 a -0.0043 -0.009 b 0.000 -0.004 b -0.006 c 0.005 0.016 0.001 0.0074 -0.004 c 0.000 0.004 -0.010 a -0.006 0.000 -0.007 a 0.000 b
5 0.000 -0.007 -0.002 0.003 0.008 0.000 -0.001 -0.0036 0.000 -0.049 b 0.000 0.001 -0.003 a 0.013 -0.003 a -0.0027 0.000 -0.021 0.002 -0.013 0.007 -0.007 c 0.001 0.0018 -0.004 0.015 0.015 0.000 c -0.004 b -0.008 b -0.006 a 0.0029 0.000 0.003 -0.001 b 0.000 -0.006 b 0.003 -0.004 0.001
10 0.000 -0.004 -0.004 b 0.000 -0.002 b 0.004 0.005 -0.005
Retail
Sales (7)
Trade
Balance (2)CPI (19) PPI (20)
Tim
e
ZEW (1) IFO (1)Ind. Prod.
(3)GDP (4)

Table A3: Effect of Macroeconomic Announcements on Abnormal Returns of HUF/EUR
A: Good News
B: Bad News
C: Neutral News
Note: Table contains values of mean abnormal percentage returns (AR%) on a currency pair as an effect of the macroeconomic announcements in the event window running from -5 to 10 minutes; announcement occurs at 0 minute. We report statistical significance (denoted by a symbol) at the 1 (a), 5 (b), and 10% (c) levels based on the Corrado-Zivney Tcz statistics with the corresponding critical values of 2,58 (1%), 1,96 (5%), and 1,65 (10%). The sample runs from January 3, 2011 to December 31, 2015. The announcements are abbreviated as follows: , ZEW – German Economic Sentiment Index, PMI – Purchasing Managers’ Indices from Manufacturing and Services Sectors, IFO – German Business Climate Index, Ind. Prod. – Industrial Production, GDP – Gross Domestic Product, CPI – Consumer Price Index, PPI – Producer Price Index. Number of examined events is indicated in the parentheses.
AR % AR % AR % AR % AR % AR % AR % AR % AR %
-5 0.005 0.006 -0.002 a 0.003 0.001 0.000 0.000 0.005 -0.003 c
-4 -0.002 0.008 -0.001 0.002 0.000 0.012 0.004 c 0.005 -0.003 c
-3 0.001 b 0.012 -0.004 a 0.006 -0.002 -0.004 b -0.004 b 0.008 -0.004 a
-2 0.004 0.002 b -0.002 a -0.002 b 0.000 -0.005 a -0.007 a -0.004 b -0.011 a
-1 0.018 0.020 0.024 0.016 0.008 0.011 0.006 0.009 0.0060 0.011 -0.002 a 0.013 0.005 0.000 -0.002 a 0.003 b 0.000 c -0.0011 0.004 0.003 -0.003 a 0.000 a -0.002 c -0.002 b -0.004 b 0.003 0.0012 -0.005 a -0.004 c 0.005 0.000 b 0.000 0.002 -0.005 b 0.005 0.0003 0.001 a -0.001 b 0.002 b 0.008 -0.034 b -0.004 a 0.006 b 0.002 0.0014 0.008 -0.010 a -0.005 a 0.003 b 0.017 -0.011 a 0.008 0.003 0.002 c
5 -0.005 a 0.002 -0.001 a -0.001 a 0.010 0.004 0.002 -0.008 a -0.003 a
6 -0.008 a 0.002 -0.007 a -0.006 a 0.002 -0.001 a 0.000 a 0.008 -0.008 a
7 0.004 -0.003 -0.001 a 0.002 -0.002 0.001 c 0.011 0.004 0.000 a
8 -0.002 a -0.006 c -0.004 a -0.006 a 0.010 -0.002 b 0.000 0.002 0.0059 -0.005 a -0.007 a 0.003 0.000 0.011 -0.001 b 0.008 0.000 0.003
10 -0.003 a 0.004 b -0.003 a -0.004 a -0.003 c -0.001 a -0.011 a -0.003 b -0.004 c
Retail Sales
(23)
Trade
Balance (23)CPI (21) PPI (24)
Tim
e
ZEW (1) PMI (13) IFO (31)Ind. Prod.
(24)GDP (9)
AR % AR % AR % AR % AR % AR % AR % AR % AR %
-5 -0.001 b -0.004 b 0.001 c -0.006 a -0.002 c 0.002 -0.004 0.007 -0.003 b
-4 0.007 0.002 -0.004 a 0.000 a -0.001 -0.004 a 0.013 -0.004 b -0.001-3 0.004 -0.020 a -0.005 b 0.000 0.000 -0.003 a 0.007 0.005 0.003 b
-2 0.003 b 0.000 -0.003 b 0.000 a -0.005 b -0.001 c 0.008 b 0.005 0.000 c
-1 -0.011 a -0.009 b -0.006 a -0.016 a -0.023 0.001 0.000 a 0.003 0.0020 -0.009 a -0.003 b -0.005 b 0.001 a 0.004 -0.002 0.001 0.011 0.0051 0.001 c -0.002 b -0.004 a -0.001 b 0.003 0.001 -0.001 b -0.001 0.001 c
2 0.005 0.002 0.004 0.003 b -0.012 b -0.011 a -0.012 0.003 a 0.000 c
3 0.004 -0.002 0.002 0.002 c -0.002 b 0.006 0.003 0.006 0.0044 0.001 -0.004 b 0.000 b 0.000 a -0.009 a -0.001 a -0.010 a -0.002 -0.0035 0.004 0.000 c 0.004 0.007 -0.007 b 0.005 -0.010 a -0.002 b -0.003 a
6 0.000 -0.003 0.000 a -0.001 a 0.001 0.003 0.003 0.000 -0.001 b
7 0.003 0.002 b 0.000 b -0.001 c 0.006 -0.003 a 0.003 0.000 0.0038 -0.002 c -0.005 c -0.002 a 0.005 -0.007 b -0.005 a -0.002 a 0.000 -0.003 a
9 0.001 b -0.004 a -0.002 a -0.004 b -0.006 b 0.005 0.003 -0.008 a 0.00210 -0.001 b -0.003 c 0.006 0.001 a -0.006 a -0.001 c 0.008 -0.006 -0.006 a
Retail Sales
(29)
Trade
Balance (30)CPI (18) PPI (20)
Tim
e
ZEW (32) PMI (19) IFO (26)Ind. Prod.
(33)GDP (7)
AR % AR % AR % AR % AR % AR % AR % AR %
-5 0.003 0.000 0.002 -0.024 c 0.014 -0.017 0.007 -0.002 b
-4 0.017 -0.003 -0.007 b -0.014 -0.003 c -0.004 -0.004 b -0.001 c
-3 -0.007 0.003 0.001 0.003 0.005 0.002 0.005 0.016-2 0.000 -0.003 0.025 -0.003 -0.001 b -0.003 0.005 0.008-1 0.000 0.019 -0.029 a -0.002 0.004 0.025 0.003 -0.001 b
0 -0.003 -0.009 c 0.008 -0.003 0.008 -0.004 c 0.011 -0.0111 0.003 0.010 -0.006 b 0.003 0.013 0.012 -0.001 -0.0042 0.003 0.003 -0.004 0.000 -0.011 a 0.004 0.003 a -0.0013 -0.003 -0.003 0.000 -0.003 c -0.007 0.010 0.006 0.0044 0.007 0.000 0.004 0.003 0.016 -0.014 b -0.002 -0.004 c
5 -0.010 c 0.013 0.003 0.007 0.005 -0.001 -0.002 b -0.001 b
6 0.003 0.026 0.004 0.013 0.005 0.006 0.000 0.0027 0.000 0.007 -0.005 b -0.017 0.011 0.002 0.000 -0.005 b
8 -0.007 0.019 0.011 -0.004 -0.008 0.014 0.000 0.0029 -0.007 c 0.007 0.006 0.014 -0.005 a -0.009 -0.008 a -0.001 b
10 -0.007 -0.032 b -0.002 0.003 -0.007 a 0.003 -0.006 -0.006 b
Retail
Sales (7)
Trade
Balance (2)CPI (18) PPI (14)
Tim
e
ZEW (1) IFO (1)Ind. Prod.
(3)GDP (4)

Table A4: Effect of Macroeconomic Announcements on Abnormal Returns of CZK/USD
A: Good News
B: Bad News
C: Neutral News
Note: Table contains values of mean abnormal percentage returns (AR) on a currency pair as an effect of the macroeconomic announcements in the event window running from -5 to 10 minutes; announcement occurs at 0 minute. We report statistical significance (denoted by a symbol) at the 1 (a), 5 (b), and 10% (c) levels based on the Corrado-Zivney Tcz statistics with the corresponding critical values of 2,58 (1%), 1,96 (5%), and 1,65 (10%). The sample runs from January 3, 2011 to December 31, 2015. The announcements are abbreviated as follows: NFP – Nonfarm Payrolls, PMI – Purchasing Managers’ Indices from Manufacturing and Services Sectors, GDP – Gross Domestic Product, Core DGO – Core Durable Goods Orders, CPI – Consumer Price Index, PPI – Producer Price Index. Number of examined events is indicated in the parentheses.
AR % AR % AR % AR % AR % AR % AR % AR % AR % AR %
-5 0.007 0.002 0.001 c -0.002 b 0.017 -0.004 a 0.005 -0.007 a 0.001 c 0.003-4 0.013 0.002 -0.002 b 0.001 0.009 0.004 -0.005 a -0.006 a -0.011 a -0.009 a
-3 0.017 -0.001 b 0.004 c 0.005 0.000 -0.001 b -0.004 c 0.001 b -0.001 0.009-2 -0.005 c 0.002 0.008 0.000 -0.014 a -0.003 b -0.003 a -0.002 c 0.017 -0.002-1 -0.204 a -0.008 a -0.041 a -0.063 a -0.081 0.001 c -0.043 a -0.025 a 0.029 0.0360 -0.029 -0.011 a -0.002 a 0.000 -0.005 -0.007 a 0.000 0.013 -0.007 c -0.0101 -0.004 a -0.004 b -0.011 a 0.005 -0.019 b 0.003 b 0.021 -0.002 c 0.005 0.0052 -0.016 b -0.001 -0.003 a 0.004 0.039 -0.002 a -0.005 a -0.019 a -0.007 b 0.0123 0.002 0.007 c 0.004 -0.009 b -0.027 b 0.002 0.004 0.003 -0.001 0.0114 -0.019 a -0.013 a 0.000 c -0.002 c 0.000 -0.004 a -0.016 a -0.003 0.001 -0.0035 -0.019 a 0.000 a -0.005 a 0.000 b 0.003 -0.005 b -0.005 b -0.014 a -0.005 -0.005 b
6 -0.005 c 0.000 a -0.001 b 0.016 0.002 0.002 0.002 c -0.009 a 0.009 -0.0057 0.002 0.012 0.002 0.003 0.016 0.010 0.001 c 0.003 0.000 c -0.005 b
8 -0.006 a 0.000 b 0.011 0.013 0.036 0.003 -0.002 b 0.004 -0.012 a 0.0119 -0.014 a -0.003 a 0.004 0.016 -0.002 0.001 b 0.002 -0.005 a -0.007 c 0.021
10 -0.014 a 0.002 -0.006 a -0.003 b 0.012 0.000 c 0.000 b -0.004 b 0.000 0.005
Ind. Prod.
(12)
Core DGO
(20)
Trade
Balance (24)CPI (16) PPI (16)GDP (7)
Tim
e NFP (30)PMI Man
(31)
PMI
Services (30)
Retail Sales
(18)
AR % AR % AR % AR % AR % AR % AR % AR % AR % AR %
-5 0.002 -0.006 a 0.000 c 0.005 0.002 -0.002 0.004 0.009 0.008 -0.001-4 -0.005 a 0.001 b 0.008 -0.010 a 0.019 0.004 0.000 b -0.004 a 0.007 0.000-3 0.004 c 0.002 0.002 0.009 0.010 -0.003 b 0.003 -0.002 0.002 0.007-2 0.000 b 0.012 0.009 0.014 -0.016 a 0.004 0.001 b -0.012 a -0.001 0.008-1 0.128 0.022 0.042 0.080 0.026 -0.002 a 0.015 0.023 -0.071 a -0.016 a
0 -0.014 a 0.002 -0.004 a 0.014 0.037 -0.001 0.003 -0.012 a -0.010 c 0.0051 0.014 -0.017 a -0.005 a -0.015 a -0.010 a 0.010 0.009 0.008 0.031 0.000 b
2 -0.001 a -0.008 b 0.011 0.021 0.008 0.006 0.004 c 0.021 -0.016 b -0.005 b
3 0.012 b 0.004 -0.005 a 0.005 0.004 c 0.008 0.007 0.017 0.022 0.0124 0.000 a 0.014 -0.001 b 0.013 -0.012 a 0.009 -0.003 b 0.010 0.017 0.0115 -0.006 b 0.000 b -0.017 a 0.006 0.004 -0.002 -0.005 a -0.010 a 0.000 0.0076 0.003 -0.003 a 0.014 -0.013 a 0.009 0.011 0.004 c -0.008 a -0.005 -0.005 b
7 -0.005 -0.008 a 0.022 0.010 0.040 0.011 0.008 0.013 0.019 0.002 c
8 0.004 c -0.007 a 0.000 -0.004 a 0.002 0.004 -0.008 a -0.004 a -0.014 a 0.0099 0.010 0.005 -0.004 a 0.009 0.010 -0.006 a 0.005 0.011 -0.006 b 0.001 b
10 -0.002 a -0.001 a -0.005 b 0.001 0.000 0.009 -0.013 a -0.004 b 0.005 -0.004 a
Ind. Prod.
(14)
Core DGO
(38)
Trade
Balance (26)CPI (5) PPI (17)GDP (11)
Tim
e NFP (29)PMI Man.
(28)
PMI
Services (26)
Retail Sales
(24)
AR % AR % AR % AR % AR % AR % AR % AR % AR % AR %
-5 0.032 0.000 0.003 0.008 -0.005 -0.019 a 0.023 -0.026 0.000 -0.001-4 -0.092 b 0.010 0.025 0.005 0.012 0.004 0.014 -0.010 0.004 -0.008 b
-3 -0.032 c -0.020 0.003 0.009 -0.012 b 0.005 -0.009 -0.063 b 0.006 -0.014 a
-2 0.005 0.000 0.007 0.005 0.049 -0.009 c 0.028 0.016 0.002 -0.001-1 0.037 0.000 0.011 0.006 -0.073 a 0.018 0.009 0.000 -0.077 a 0.0260 -0.032 c 0.000 0.010 -0.007 0.022 -0.014 -0.005 0.016 -0.001 0.0201 0.000 0.000 0.002 0.015 -0.037 b -0.001 0.032 -0.073 b -0.021 b 0.0112 -0.134 b -0.010 0.031 -0.003 0.063 -0.004 0.028 -0.052 0.008 0.001 c
3 0.011 0.124 0.018 0.006 -0.051 a -0.012 -0.005 -0.005 0.001 -0.016 c
4 -0.065 b 0.000 0.024 0.014 -0.012 -0.006 c -0.028 c -0.026 0.000 0.0075 -0.059 b 0.005 0.010 -0.007 -0.012 -0.006 0.000 0.026 0.010 0.0066 -0.155 b -0.020 -0.025 b 0.003 -0.063 0.001 -0.005 -0.042 0.001 -0.011 c
7 -0.032 c -0.010 0.022 -0.004 -0.053 0.011 0.000 0.026 0.002 0.0058 0.037 -0.020 -0.011 0.015 0.066 0.011 0.005 0.031 -0.005 b 0.0159 0.075 0.035 0.004 -0.022 b -0.017 0.006 0.014 0.016 -0.003 b -0.003
10 -0.086 b -0.035 c 0.010 0.006 0.037 -0.024 a -0.005 -0.052 -0.016 a 0.013
Tim
e NFP (1) PMI Man (1) CPI (18) PPI (6)PMI
Services (4)
Retail Sales
(5)GDP (2)
Ind. Prod.
(4)
Core DGO
(1)
Trade
Balance (1)

Table A5: Effect of Macroeconomic Announcements on Abnormal Returns of PLN/USD
A: Good News
B: Bad News
C: Neutral News
Note: Table contains values of mean abnormal percentage returns (AR) on a currency pair as an effect of the macroeconomic announcements in the event window running from -5 to 10 minutes; announcement occurs at 0 minute. We report statistical significance (denoted by a symbol) at the 1 (a), 5 (b), and 10% (c) levels based on the Corrado-Zivney Tcz statistics with the corresponding critical values of 2,58 (1%), 1,96 (5%), and 1,65 (10%). The sample runs from January 3, 2011 to December 31, 2015. The announcements are abbreviated as follows: NFP – Nonfarm Payrolls, PMI – Purchasing Managers’ Indices from Manufacturing and Services Sectors, GDP – Gross Domestic Product, Core DGO – Core Durable Goods Orders, CPI – Consumer Price Index, PPI – Producer Price Index. Number of examined events is indicated in the parentheses.
AR % AR % AR % AR % AR % AR % AR % AR % AR % AR %-5 0.001 0.005 c -0.005 a -0.002 a 0.020 -0.001 a -0.001 a -0.006 a -0.003 b 0.003-4 0.009 0.004 -0.005 b 0.000 0.013 0.003 -0.012 a -0.005 a -0.016 a -0.008 a-3 0.016 -0.005 a 0.007 0.004 -0.003 -0.002 c -0.009 a 0.003 -0.006 a 0.009-2 0.006 -0.003 a 0.001 0.005 -0.011 b -0.009 a -0.001 -0.002 c -0.006 b 0.007-1 -0.194 a -0.001 a -0.033 a -0.058 a -0.103 b -0.002 -0.027 a -0.026 a 0.058 0.0430 -0.037 -0.006 a 0.006 c -0.010 b -0.007 -0.012 a -0.007 b 0.013 -0.009 b -0.014 c1 0.000 b 0.005 -0.012 a 0.029 0.003 0.010 0.024 0.005 0.004 0.0042 0.008 0.003 0.000 a 0.003 0.016 -0.007 b -0.004 b -0.024 a -0.007 b 0.0153 -0.013 b 0.003 -0.001 -0.014 b 0.012 0.006 0.003 0.000 -0.001 0.0074 0.000 b -0.019 a -0.002 c 0.008 -0.003 -0.010 b -0.026 a -0.005 -0.004 -0.001 c5 -0.016 a 0.008 -0.003 -0.002 b 0.009 0.002 -0.004 -0.013 b -0.014 c -0.003 c6 0.002 0.000 a -0.003 b 0.022 0.002 -0.007 a 0.005 -0.008 a 0.003 -0.0027 0.002 0.018 -0.016 a 0.005 0.023 0.004 0.010 -0.002 0.002 0.000 c8 0.003 c 0.007 0.011 0.013 0.001 -0.001 -0.003 c -0.005 b -0.013 a 0.0059 -0.015 a -0.011 a 0.001 b 0.011 0.006 0.017 -0.002 -0.005 b 0.003 0.027
10 -0.018 a 0.003 c -0.005 a -0.006 a 0.021 -0.011 a -0.007 a -0.002 0.003 0.000 c
Ind. Prod.
(12)
Core DGO
(20)
Trade
Balance (24)CPI (16) PPI (16)GDP (7)
Tim
e NFP (30)PMI Man
(31)
PMI
Services (30)
Retail Sales
(18)
AR % AR % AR % AR % AR % AR % AR % AR % AR % AR %
-5 0.000 -0.006 a -0.004 b 0.001 b 0.008 -0.005 c 0.001 c 0.007 0.007 -0.008 a
-4 -0.014 a -0.006 a 0.003 -0.002 0.009 -0.001 c 0.003 -0.007 a 0.006 0.000-3 0.003 a 0.001 0.010 0.009 0.004 0.004 0.005 -0.007 a 0.001 -0.010 a
-2 0.008 0.005 0.010 0.000 b -0.008 c -0.002 0.004 -0.008 a 0.004 0.002-1 0.172 0.025 0.044 0.091 0.023 0.009 0.018 0.016 -0.086 a -0.020 a
0 -0.020 a 0.005 -0.005 a 0.013 0.025 -0.004 0.009 -0.006 a -0.013 b -0.003 c
1 0.033 -0.016 a -0.013 a -0.012 a -0.010 b 0.002 0.007 0.015 0.029 -0.006 b
2 0.015 -0.006 c 0.003 0.028 0.000 0.012 0.004 0.017 -0.023 c -0.002 c
3 0.004 c 0.007 -0.005 a 0.015 0.006 0.001 0.005 c 0.013 0.025 0.0264 -0.020 a 0.013 -0.009 a 0.012 -0.023 a 0.005 -0.008 a 0.005 0.026 0.0075 -0.017 a 0.003 -0.014 a -0.002 a 0.006 -0.002 -0.006 a -0.004 a 0.010 0.0076 0.002 c -0.004 b 0.014 -0.019 a 0.008 0.012 0.002 b -0.002 b -0.015 b -0.011 a
7 0.000 -0.008 c 0.031 0.021 0.042 0.004 0.002 c 0.012 0.007 0.0038 0.011 -0.003 b 0.002 0.001 -0.005 -0.001 b -0.010 a 0.002 c -0.002 0.0129 0.016 0.002 -0.007 a 0.008 0.006 -0.007 a 0.005 0.009 -0.005 c -0.001
10 0.000 a -0.006 a 0.005 -0.008 a -0.006 b 0.005 -0.009 a -0.003 0.006 -0.004 b
Ind. Prod.
(14)
Core DGO
(38)
Trade
Balance (26)CPI (5) PPI (17)GDP (11)
Tim
e NFP (29)PMI Man
(28)
PMI
Services (26)
Retail Sales
(24)
AR % AR % AR % AR % AR % AR % AR % AR % AR % AR %
-5 0.051 c 0.003 -0.008 0.008 -0.011 -0.023 a 0.058 b -0.018 -0.001 -0.005-4 0.000 0.030 c 0.021 0.004 0.007 0.008 0.009 -0.033 -0.001 -0.016-3 -0.127 0.000 0.023 0.015 0.008 -0.007 b 0.024 c -0.125 0.007 -0.011-2 0.036 -0.036 0.024 0.012 0.028 c -0.008 -0.006 0.012 0.003 0.011-1 0.115 c -0.010 -0.004 0.014 -0.084 0.012 -0.025 -0.042 -0.071 -0.0190 -0.049 0.017 0.009 -0.003 0.018 -0.019 b -0.009 0.015 0.000 0.0151 0.042 0.007 0.007 0.020 -0.046 -0.004 0.052 c -0.077 -0.026 0.0212 -0.155 0.000 0.060 c -0.006 0.077 b 0.002 0.055 c 0.017 0.013 0.0183 -0.034 0.036 0.009 0.028 -0.053 -0.004 0.027 c -0.071 0.003 -0.0214 -0.037 0.062 c 0.017 0.003 -0.007 0.001 0.024 c 0.012 -0.001 0.0175 -0.061 -0.003 0.037 b 0.001 -0.026 -0.002 -0.025 -0.071 0.009 -0.0056 -0.027 0.000 -0.031 -0.007 -0.053 0.027 0.021 -0.045 0.006 -0.0197 -0.033 -0.010 0.015 -0.008 -0.035 0.001 0.000 0.038 0.004 0.0008 0.003 -0.020 0.007 0.037 b 0.051 c 0.004 -0.025 0.062 c -0.007 0.0159 -0.121 0.033 -0.006 -0.010 -0.032 -0.006 -0.009 0.003 -0.006 0.007
10 0.012 -0.016 0.055 b -0.009 0.033 -0.010 a -0.009 -0.048 -0.007 0.011
Ind. Prod.
(4)
Core DGO
(1)
Trade
Balance (1)CPI (18) PPI (6)GDP (2)
Tim
e NFP (1) PMI Man (1)PMI
Services (4)
Retail Sales
(5)
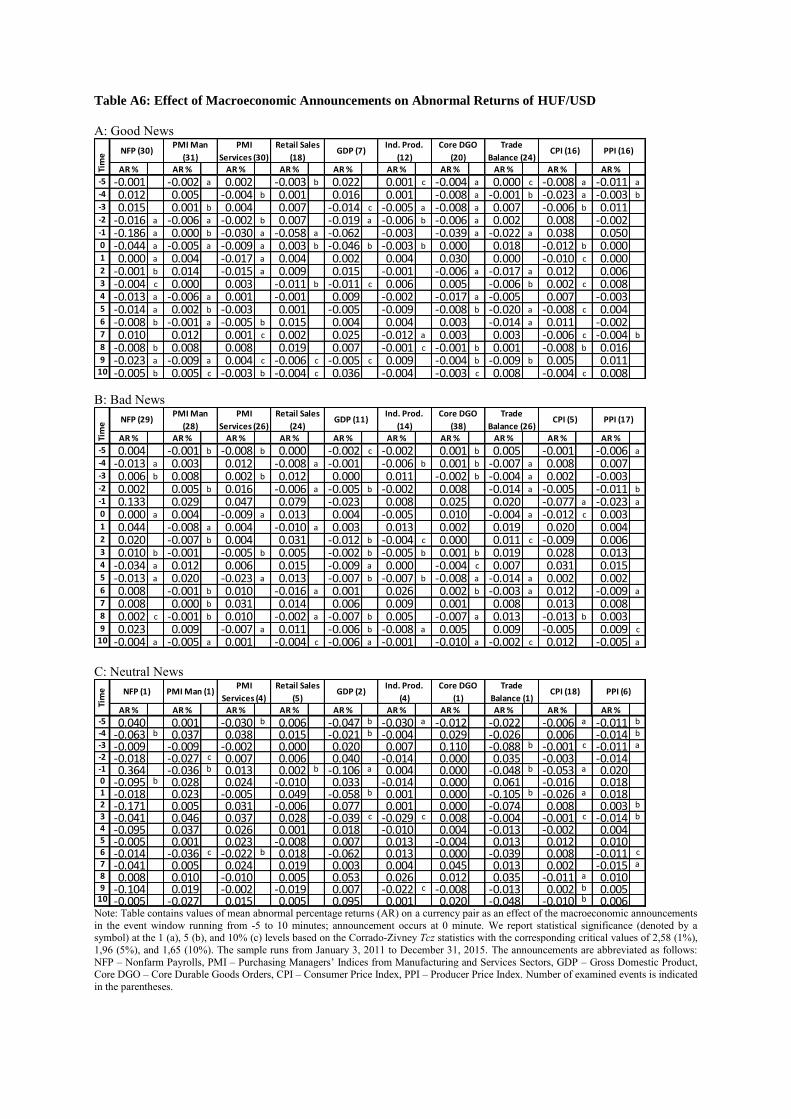
Table A6: Effect of Macroeconomic Announcements on Abnormal Returns of HUF/USD
A: Good News
B: Bad News
C: Neutral News
Note: Table contains values of mean abnormal percentage returns (AR) on a currency pair as an effect of the macroeconomic announcements in the event window running from -5 to 10 minutes; announcement occurs at 0 minute. We report statistical significance (denoted by a symbol) at the 1 (a), 5 (b), and 10% (c) levels based on the Corrado-Zivney Tcz statistics with the corresponding critical values of 2,58 (1%), 1,96 (5%), and 1,65 (10%). The sample runs from January 3, 2011 to December 31, 2015. The announcements are abbreviated as follows: NFP – Nonfarm Payrolls, PMI – Purchasing Managers’ Indices from Manufacturing and Services Sectors, GDP – Gross Domestic Product, Core DGO – Core Durable Goods Orders, CPI – Consumer Price Index, PPI – Producer Price Index. Number of examined events is indicated in the parentheses.
AR % AR % AR % AR % AR % AR % AR % AR % AR % AR %
-5 -0.001 -0.002 a 0.002 -0.003 b 0.022 0.001 c -0.004 a 0.000 c -0.008 a -0.011 a
-4 0.012 0.005 -0.004 b 0.001 0.016 0.001 -0.008 a -0.001 b -0.023 a -0.003 b
-3 0.015 0.001 b 0.004 0.007 -0.014 c -0.005 a -0.008 a 0.007 -0.006 b 0.011-2 -0.016 a -0.006 a -0.002 b 0.007 -0.019 a -0.006 b -0.006 a 0.002 0.008 -0.002-1 -0.186 a 0.000 b -0.030 a -0.058 a -0.062 -0.003 -0.039 a -0.022 a 0.038 0.0500 -0.044 a -0.005 a -0.009 a 0.003 b -0.046 b -0.003 b 0.000 0.018 -0.012 b 0.0001 0.000 a 0.004 -0.017 a 0.004 0.002 0.004 0.030 0.000 -0.010 c 0.0002 -0.001 b 0.014 -0.015 a 0.009 0.015 -0.001 -0.006 a -0.017 a 0.012 0.0063 -0.004 c 0.000 0.003 -0.011 b -0.011 c 0.006 0.005 -0.006 b 0.002 c 0.0084 -0.013 a -0.006 a 0.001 -0.001 0.009 -0.002 -0.017 a -0.005 0.007 -0.0035 -0.014 a 0.002 b -0.003 0.001 -0.005 -0.009 -0.008 b -0.020 a -0.008 c 0.0046 -0.008 b -0.001 a -0.005 b 0.015 0.004 0.004 0.003 -0.014 a 0.011 -0.0027 0.010 0.012 0.001 c 0.002 0.025 -0.012 a 0.003 0.003 -0.006 c -0.004 b
8 -0.008 b 0.008 0.008 0.019 0.007 -0.001 c -0.001 b 0.001 -0.008 b 0.0169 -0.023 a -0.009 a 0.004 c -0.006 c -0.005 c 0.009 -0.004 b -0.009 b 0.005 0.011
10 -0.005 b 0.005 c -0.003 b -0.004 c 0.036 -0.004 -0.003 c 0.008 -0.004 c 0.008
Ind. Prod.
(12)
Core DGO
(20)
Trade
Balance (24)CPI (16) PPI (16)GDP (7)
Tim
e NFP (30)PMI Man
(31)
PMI
Services (30)
Retail Sales
(18)
AR % AR % AR % AR % AR % AR % AR % AR % AR % AR %
-5 0.004 -0.001 b -0.008 b 0.000 -0.002 c -0.002 0.001 b 0.005 -0.001 -0.006 a
-4 -0.013 a 0.003 0.012 -0.008 a -0.001 -0.006 b 0.001 b -0.007 a 0.008 0.007-3 0.006 b 0.008 0.002 b 0.012 0.000 0.011 -0.002 b -0.004 a 0.002 -0.003-2 0.002 0.005 b 0.016 -0.006 a -0.005 b -0.002 0.008 -0.014 a -0.005 -0.011 b
-1 0.133 0.029 0.047 0.079 -0.023 0.008 0.025 0.020 -0.077 a -0.023 a
0 0.000 a 0.004 -0.009 a 0.013 0.004 -0.005 0.010 -0.004 a -0.012 c 0.0031 0.044 -0.008 a 0.004 -0.010 a 0.003 0.013 0.002 0.019 0.020 0.0042 0.020 -0.007 b 0.004 0.031 -0.012 b -0.004 c 0.000 0.011 c -0.009 0.0063 0.010 b -0.001 -0.005 b 0.005 -0.002 b -0.005 b 0.001 b 0.019 0.028 0.0134 -0.034 a 0.012 0.006 0.015 -0.009 a 0.000 -0.004 c 0.007 0.031 0.0155 -0.013 a 0.020 -0.023 a 0.013 -0.007 b -0.007 b -0.008 a -0.014 a 0.002 0.0026 0.008 -0.001 b 0.010 -0.016 a 0.001 0.026 0.002 b -0.003 a 0.012 -0.009 a
7 0.008 0.000 b 0.031 0.014 0.006 0.009 0.001 0.008 0.013 0.0088 0.002 c -0.001 b 0.010 -0.002 a -0.007 b 0.005 -0.007 a 0.013 -0.013 b 0.0039 0.023 0.009 -0.007 a 0.011 -0.006 b -0.008 a 0.005 0.009 -0.005 0.009 c
10 -0.004 a -0.005 a 0.001 -0.004 c -0.006 a -0.001 -0.010 a -0.002 c 0.012 -0.005 a
Ind. Prod.
(14)
Core DGO
(38)
Trade
Balance (26)CPI (5) PPI (17)GDP (11)
Tim
e NFP (29)PMI Man
(28)
PMI
Services (26)
Retail Sales
(24)
AR % AR % AR % AR % AR % AR % AR % AR % AR % AR %-5 0.040 0.001 -0.030 b 0.006 -0.047 b -0.030 a -0.012 -0.022 -0.006 a -0.011 b
-4 -0.063 b 0.037 0.038 0.015 -0.021 b -0.004 0.029 -0.026 0.006 -0.014 b
-3 -0.009 -0.009 -0.002 0.000 0.020 0.007 0.110 -0.088 b -0.001 c -0.011 a
-2 -0.018 -0.027 c 0.007 0.006 0.040 -0.014 0.000 0.035 -0.003 -0.014-1 0.364 -0.036 b 0.013 0.002 b -0.106 a 0.004 0.000 -0.048 b -0.053 a 0.0200 -0.095 b 0.028 0.024 -0.010 0.033 -0.014 0.000 0.061 -0.016 0.0181 -0.018 0.023 -0.005 0.049 -0.058 b 0.001 0.000 -0.105 b -0.026 a 0.0182 -0.171 0.005 0.031 -0.006 0.077 0.001 0.000 -0.074 0.008 0.003 b
3 -0.041 0.046 0.037 0.028 -0.039 c -0.029 c 0.008 -0.004 -0.001 c -0.014 b
4 -0.095 0.037 0.026 0.001 0.018 -0.010 0.004 -0.013 -0.002 0.0045 -0.005 0.001 0.023 -0.008 0.007 0.013 -0.004 0.013 0.012 0.0106 -0.014 -0.036 c -0.022 b 0.018 -0.062 0.013 0.000 -0.039 0.008 -0.011 c
7 -0.041 0.005 0.024 0.019 0.003 0.004 0.045 0.013 0.002 -0.015 a
8 0.008 0.010 -0.010 0.005 0.053 0.026 0.012 0.035 -0.011 a 0.0109 -0.104 0.019 -0.002 -0.019 0.007 -0.022 c -0.008 -0.013 0.002 b 0.005
10 -0.005 -0.027 0.015 0.005 0.095 0.001 0.020 -0.048 -0.010 b 0.006
Tim
e NFP (1) PMI Man (1)PMI
Services (4)PPI (6)
Retail Sales
(5)GDP (2)
Ind. Prod.
(4)
Core DGO
(1)
Trade
Balance (1)CPI (18)

Table A7: Monetary policy settings
Panel A: ECB meetings
Day of the ECB
meeting
Time of the
announcement
Deposit
Interest Rate
Main
Refinancing
Operations
Marginal
Lending
Facility
7.4.2011 1:45 p.m. CET 0,50 1,25 2,00
7.7.2011 1:45 p.m. CET 0,75 1,50 2,25
3.11.2011 1:45 p.m. CET 0,50 1,25 2,00
8.12.2011 1:45 p.m. CET 0,25 1,00 1,75
5.7.2012 1:45 p.m. CET 0,00 0,75 1,50
2.5.2013 1:45 p.m. CET 0,00 0,50 1,00
7.11.2013 1:45 p.m. CET 0,00 0,25 0,75
5.6.2014 1:45 p.m. CET −0,10 0,15 0,40
4.9.2014 1:45 p.m. CET −0,20 0,05 0,30
22.1.2015 2:30 p.m. CET QE announcement
5.3.2015 2:30 p.m. CET QE details announcement
3.12.2015 1:45 p.m. CET −0,30 0,05 0,30
Panel B: FOMC meetings
Date of the
FOMC
meeting
Time of the
announcement Unconventional monetary policy settings
21.9.2011 8:00 p.m. CET
FOMC meeting with the announcement of operation Twist planning to purchase 400 billion dollars of bonds with maturities of 6 to 30 years and to sell the bond
within less than 3 years, thereby extending the average maturity of the Fed's own portfolio.
20.6.2012 8:00 p.m. CET FOMC announced an extension to the Twist program by adding 267 billion dollars.
13.9.2012 8:00 p.m. CET FOMC announced the 3rd round of the Quantitative Easing program (QE3) with monthly purchases worth 40 billion dollars of mortgage-backed securities.
12.12.2012 8:00 p.m. CET FOMC voted to expand its QE program with an additional monthly 45 billion USD of longer-term Treasury securities.
18.12.2013 8:00 p.m. CET FOMC announced tapering back QE3 purchases at a rate of 10 billion USD each month.
16.12.2015 8:00 p.m. CET FOMC announced its key interest rate (the Fed Fund rate) increase for the first
time after June 2006. The hike was from the range (0%–0.25%) to the range (0.25%–0.5%).