INTRA-URBAN MOVEMENT FLOW ESTIMATION … MOVEMENT FLOW ESTIMATION USING LOCATION BASED SOCIAL...
5
INTRA-URBAN MOVEMENT FLOW ESTIMATION USING LOCATION BASED SOCIAL NETWORKING DATA A. Kheiri a , F. Karimipour b,* , M. Forghani b a Faculty Technical and Engineering, Eslamic Azad University of Larestan, Iran - [email protected] b Faculty of Surveying and Geospatial Engineering, College of Engineering, University of Tehran, Tehran, Iran - (fkarimipr, mo.forghani)@ut.ac.ir KEY WORDS: Location Based Social Network, Check-in Data, O/D Matrix, Mobility ABSTRACT: In recent years, there has been a rapid growth of location-based social networking services, such as Foursquare and Facebook, which have attracted an increasing number of users and greatly enriched their urban experience. Location-based social network data, as a new travel demand data source, seems to be an alternative or complement to survey data in the study of mobility behavior and activity analysis because of its relatively high access and low cost. In this paper, three OD estimation models have been utilized in order to investigate their relative performance when using Location-Based Social Networking (LBSN) data. For this, the Foursquare LBSN data was used to analyze the intra-urban movement behavioral patterns for the study area, Manhattan, the most densely populated of the five boroughs of New York city. The outputs of models are evaluated using real observations based on different criterions including distance distribution, destination travel constraints. The results demonstrate the promising potential of using LBSN data for urban travel demand analysis and monitoring. 1. INTRODUCTION An important part of human activities in an urban environment is their mobility behavior. Nowadays, measuring the movement of people is a fundamental activity in modern societies. First insight regarding the mobility within a region can be captured by extracting the origin–destination (O/D) matrix, which specifies the travel demands between the origin and destination nodes on a network. This matrix could be on different scales including macroscopic scales, e.g., at the inter-urban level, or at microscopic scales, e.g., at the intra-urban level. In the intra- urban level, OD matrix is indicative of the movement of people between different areas of the city. Many methods have been suggested for OD-matrix estimation, which can be classified into three main categories (Jin et al., 2013): survey-based methods, traffic counts, and methods based on the positioning technology. Survey-based methods as traditional OD estimation methods such as telephone, in-person interview, mail or email survey are always time-consuming and costly tasks and they have limited sample sizes and lower frequencies. Moreover, the survey data cannot provide up-to-date information to reflect the rapid changes in travel demand pattern. Traffic count based methods calibrate an OD matrix based on traffic detector data (Jin et al., 2014). These methods are based on an existing metering infrastructure, which may be expensive to install or maintain. Moreover, estimation of OD matrices from this data is extremely challenging because the data is very often limited in extent, which can lead to multiple plausible non-unique OD matrices (Jin et al., 2013; Igbal et al., 2014). Using LBSN data for OD matrix estimation is a method based on the positioning technology which is raised in recent literatures as a new travel demand data source and has attracted an increasing number of users and significantly raised their urban experience. Location based social networking sites such as Foursquare allow a user to “check in” at a real-world POI (point of interest, e.g., a hotel, coffee shop, art gallery, etc.), leave tips about the POI, and share the check-in with their online friends. Compared to traditional GPS data, location based social networks data have unique features with many information to reveal human mobility, i.e., “when and where a user (who) has been to for what,” and the temporal check-in sequence of a specific person can be considered as his/her trajectory. Therefor, these information provides opportunities to better understand human mobility from spatial, temporal, social, and content aspects. Additionally, with the rapid growth of smartphones, the LBSN application can be easily built in personal mobiles and tablets without concerning the maintenance and update issues in the traditional traffic monitor infrastructure. The sample size can be much larger than other methods because the penetration rate of social networking service is growing at a rapid pace. Moreover this data has the potential to provide origin-destination movement estimation with significantly higher spatial and temporal resolution at a much lower cost in comparison with traditional methods. On the other hand, despite the long history of modeling human mobility, predicting mobility patterns in cities has been a challenging task until now, and the lack of an accurate approach with low data requirements for predicting mobility patterns in cities can still be felt. So far, many of researchers have tried to predict intra-urban movement using mobile positioning technologies but the results show that there is not significant achievements (Calabrese et al., 2011). This study examines the efficiency of LBSN check-in data provided by Foursquare in the estimation of the intra-urban OD matrix. The remainder of this paper is organized as follows: Section 2 introduces the used dataset and an initial analysis conducted for the characteristics of check-ins collected. The data- filtering steps are presented in Section 3. Section 4 presents OD estimation models and our proposed approach, which are evaluated using a MTA OD matrix in Section 5. Finally, Section 6 presents some discussions and conclusions. 2. DATASET AND PRELIMINARY ANALYSIS 2.1 Review of the Dataset In this paper, Manhattan, the most densely populated of the five boroughs of New York city, is selected as the study area. The International Archives of the Photogrammetry, Remote Sensing and Spatial Information Sciences, Volume XL-1/W5, 2015 International Conference on Sensors & Models in Remote Sensing & Photogrammetry, 23–25 Nov 2015, Kish Island, Iran This contribution has been peer-reviewed. doi:10.5194/isprsarchives-XL-1-W5-781-2015 781
-
Upload
truongxuyen -
Category
Documents
-
view
213 -
download
0
Transcript of INTRA-URBAN MOVEMENT FLOW ESTIMATION … MOVEMENT FLOW ESTIMATION USING LOCATION BASED SOCIAL...
INTRA-URBAN MOVEMENT FLOW ESTIMATION USING LOCATION BASED
SOCIAL NETWORKING DATA
A. Kheiri a, F. Karimipour b,*, M. Forghani b
a Faculty Technical and Engineering, Eslamic Azad University of Larestan, Iran - [email protected]
b Faculty of Surveying and Geospatial Engineering, College of Engineering, University of Tehran, Tehran, Iran -
(fkarimipr, mo.forghani)@ut.ac.ir
KEY WORDS: Location Based Social Network, Check-in Data, O/D Matrix, Mobility
ABSTRACT:
In recent years, there has been a rapid growth of location-based social networking services, such as Foursquare and Facebook, which
have attracted an increasing number of users and greatly enriched their urban experience. Location-based social network data, as a new
travel demand data source, seems to be an alternative or complement to survey data in the study of mobility behavior and activity
analysis because of its relatively high access and low cost. In this paper, three OD estimation models have been utilized in order to
investigate their relative performance when using Location-Based Social Networking (LBSN) data. For this, the Foursquare LBSN
data was used to analyze the intra-urban movement behavioral patterns for the study area, Manhattan, the most densely populated of
the five boroughs of New York city. The outputs of models are evaluated using real observations based on different criterions including
distance distribution, destination travel constraints. The results demonstrate the promising potential of using LBSN data for urban
travel demand analysis and monitoring.
1. INTRODUCTION
An important part of human activities in an urban environment is
their mobility behavior. Nowadays, measuring the movement of
people is a fundamental activity in modern societies. First insight
regarding the mobility within a region can be captured by
extracting the origin–destination (O/D) matrix, which specifies
the travel demands between the origin and destination nodes on
a network. This matrix could be on different scales including
macroscopic scales, e.g., at the inter-urban level, or at
microscopic scales, e.g., at the intra-urban level. In the intra-
urban level, OD matrix is indicative of the movement of people
between different areas of the city. Many methods have been
suggested for OD-matrix estimation, which can be classified into
three main categories (Jin et al., 2013): survey-based methods,
traffic counts, and methods based on the positioning technology.
Survey-based methods as traditional OD estimation methods
such as telephone, in-person interview, mail or email survey are
always time-consuming and costly tasks and they have limited
sample sizes and lower frequencies. Moreover, the survey data
cannot provide up-to-date information to reflect the rapid
changes in travel demand pattern. Traffic count based methods
calibrate an OD matrix based on traffic detector data (Jin et al.,
2014). These methods are based on an existing metering
infrastructure, which may be expensive to install or maintain.
Moreover, estimation of OD matrices from this data is extremely
challenging because the data is very often limited in extent,
which can lead to multiple plausible non-unique OD matrices (Jin
et al., 2013; Igbal et al., 2014). Using LBSN data for OD matrix
estimation is a method based on the positioning technology
which is raised in recent literatures as a new travel demand data
source and has attracted an increasing number of users and
significantly raised their urban experience. Location based social
networking sites such as Foursquare allow a user to “check in” at
a real-world POI (point of interest, e.g., a hotel, coffee shop, art
gallery, etc.), leave tips about the POI, and share the check-in
with their online friends.
Compared to traditional GPS data, location based social networks
data have unique features with many information to reveal human
mobility, i.e., “when and where a user (who) has been to for
what,” and the temporal check-in sequence of a specific person
can be considered as his/her trajectory. Therefor, these
information provides opportunities to better understand human
mobility from spatial, temporal, social, and content aspects.
Additionally, with the rapid growth of smartphones, the LBSN
application can be easily built in personal mobiles and tablets
without concerning the maintenance and update issues in the
traditional traffic monitor infrastructure. The sample size can be
much larger than other methods because the penetration rate of
social networking service is growing at a rapid pace. Moreover
this data has the potential to provide origin-destination movement
estimation with significantly higher spatial and temporal
resolution at a much lower cost in comparison with traditional
methods.
On the other hand, despite the long history of modeling human
mobility, predicting mobility patterns in cities has been a
challenging task until now, and the lack of an accurate approach
with low data requirements for predicting mobility patterns in
cities can still be felt. So far, many of researchers have tried to
predict intra-urban movement using mobile positioning
technologies but the results show that there is not significant
achievements (Calabrese et al., 2011).
This study examines the efficiency of LBSN check-in data
provided by Foursquare in the estimation of the intra-urban OD
matrix. The remainder of this paper is organized as follows:
Section 2 introduces the used dataset and an initial analysis
conducted for the characteristics of check-ins collected. The data-
filtering steps are presented in Section 3. Section 4 presents OD
estimation models and our proposed approach, which are
evaluated using a MTA OD matrix in Section 5. Finally, Section
6 presents some discussions and conclusions.
2. DATASET AND PRELIMINARY ANALYSIS
2.1 Review of the Dataset
In this paper, Manhattan, the most densely populated of the five
boroughs of New York city, is selected as the study area.
The International Archives of the Photogrammetry, Remote Sensing and Spatial Information Sciences, Volume XL-1/W5, 2015 International Conference on Sensors & Models in Remote Sensing & Photogrammetry, 23–25 Nov 2015, Kish Island, Iran
This contribution has been peer-reviewed. doi:10.5194/isprsarchives-XL-1-W5-781-2015
781
Manhattan had a population of 1.6363m people in July 2014
according to the U.S. Census Bureau estimate and encompasses
an area of 87.46 km2. The data used in this study for analysis on
the intra-urban movement can be categorized into three parts: the
2010 census tracts data of New York city from U.S. Census
Bureau, New York Customer Travel Survey data from the
Metropolitan Transportation Authority (MTA)1 and the check-
ins data from Foursquare.
The census tract data is used as spatial resolution to estimate
movement distribution. There are 288 identified tracts within the
borough of Manhattan, which will serve as the study area for this
paper. MTA origin-destination survey data serves as the ground
truth data used for comparison. The Survey provided a rich
source of information about the tract to tract travel behavior of
New York city residents from May through November 2008. This
survey captured detailed information on the travel of 4,014
residents in 3,433 households in the borough of Manhattan. In
this paper, Foursquare data set was chosen to study the human
movement behavioral patterns based on geo-social networks
because Foursquare is the most popular LBSN, with 31% of
mobile users active on social networks using it. The check-ins
data related to study area is extracted from source data. The
resulted dataset contains 100,879 check-ins of 1083 users for
about 10 month (from 12 April 2012 to 16 February 2013).
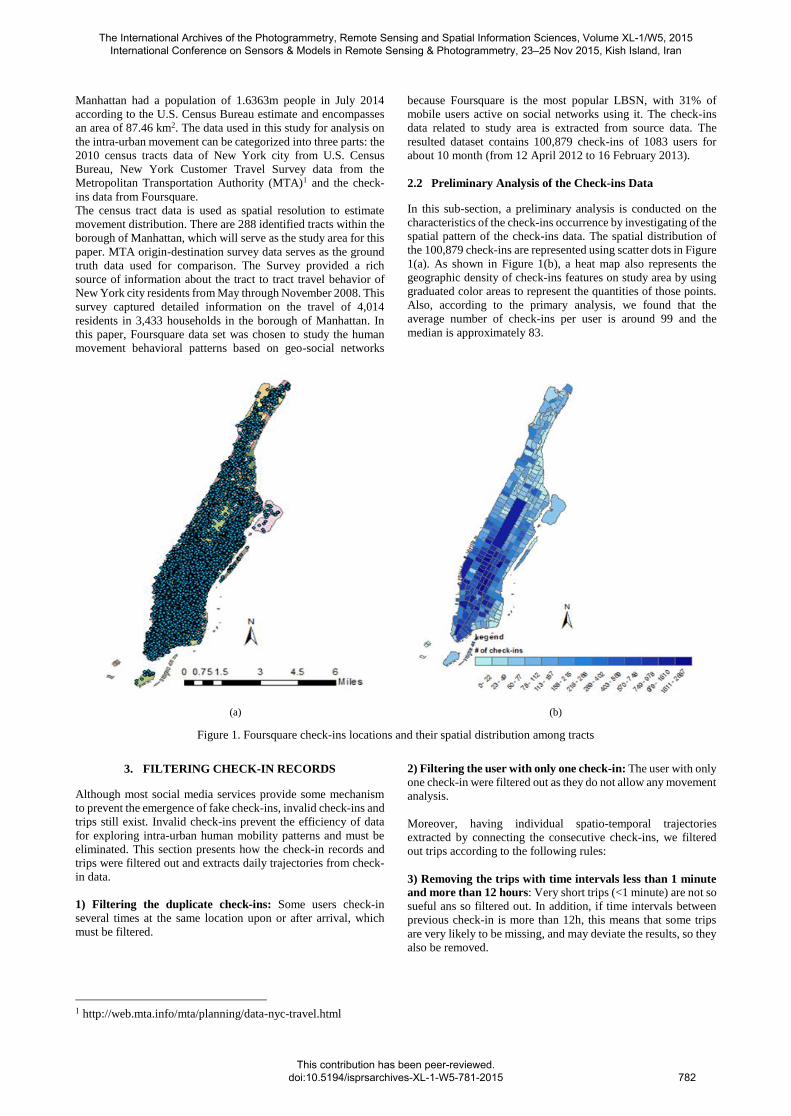
2.2 Preliminary Analysis of the Check-ins Data
In this sub-section, a preliminary analysis is conducted on the
characteristics of the check-ins occurrence by investigating of the
spatial pattern of the check-ins data. The spatial distribution of
the 100,879 check-ins are represented using scatter dots in Figure
1(a). As shown in Figure 1(b), a heat map also represents the
geographic density of check-ins features on study area by using
graduated color areas to represent the quantities of those points.
Also, according to the primary analysis, we found that the
average number of check-ins per user is around 99 and the
median is approximately 83.
(a) (b)
Figure 1. Foursquare check-ins locations and their spatial distribution among tracts
3. FILTERING CHECK-IN RECORDS
Although most social media services provide some mechanism
to prevent the emergence of fake check-ins, invalid check-ins and
trips still exist. Invalid check-ins prevent the efficiency of data
for exploring intra-urban human mobility patterns and must be
eliminated. This section presents how the check-in records and
trips were filtered out and extracts daily trajectories from check-
in data.
1) Filtering the duplicate check-ins: Some users check-in
several times at the same location upon or after arrival, which
must be filtered.
1 http://web.mta.info/mta/planning/data-nyc-travel.html
2) Filtering the user with only one check-in: The user with only
one check-in were filtered out as they do not allow any movement
analysis.
Moreover, having individual spatio-temporal trajectories
extracted by connecting the consecutive check-ins, we filtered
out trips according to the following rules:
3) Removing the trips with time intervals less than 1 minute
and more than 12 hours: Very short trips (<1 minute) are not so
sueful ans so filtered out. In addition, if time intervals between
previous check-in is more than 12h, this means that some trips
are very likely to be missing, and may deviate the results, so they
also be removed.
The International Archives of the Photogrammetry, Remote Sensing and Spatial Information Sciences, Volume XL-1/W5, 2015 International Conference on Sensors & Models in Remote Sensing & Photogrammetry, 23–25 Nov 2015, Kish Island, Iran
This contribution has been peer-reviewed. doi:10.5194/isprsarchives-XL-1-W5-781-2015
782
4) Removing trips with speed greater than 200 km/h. If the
speed of the trip is more than 200 km/h, it means the user is
traveling at a speed extremely higher than any urban
transportation modes, including bus, subway, car, etc. Such trips
were considered fake trips and were removed.
After applying the above filtering process, 69675 check-ins and
31978 trips were finally obtained.
4. METHODOLOGY
Since the 1940s, various models such as gravity model (Zipf,
1946), intervening opportunity model (Stouffer, 1940), radiation
model (Simini et al., 2012), rank-based model (Noulas et al.,
2012) and population-weighted opportunities (PWO) model
(Yan et al., 2014) have been proposed for estimation of OD
matrix. In this study, the three following models have been
utilized to compare their performance for LBSN data analysis:
4.1 Radiation Model
The “radiation model” (Simini et al., 2012) defines a commuting
flux from location i to j as:
𝑇𝑖𝑗 = 𝑇𝑖𝑚𝑖𝑛𝑗
(𝑚𝑖+𝑠𝑖𝑗)(𝑚𝑖+𝑛𝑗+𝑠𝑖𝑗) (1)
where mi and nj are the population of locations i and j, Ti is the
number of trips starting from i, and sij is the total population in
the circle of radius rij (the distance between the origin i and
destination j) centered at location i (excluding the source and
destination population). This model needs only the spatial
distribution of population as an input, without any adjustable
parameters. Therefore, as an advantage, this model can be applied
in areas where the previous mobility measurements are not
available.
4.2 Rank-based Model
The “rank-based model” is inspired by the theory of intervening
opportunities (Stouffer, 1940), which presents the rank distance
as a key component, accounting in the number of places between
origin and destination, rather than the pure physical distance.
This model assumes that the probability of an individual
travelling from an origin to a destination depends (inversely) only
upon the rank-distance between the destination and the origin.
The model is described as:
𝑇𝑖𝑗 = 𝑇𝑖𝑅𝑖(𝑗)−𝛾
∑ 𝑅𝑖(𝑗)−𝛾𝑁𝑘≠𝑖
(2)
where Ri(j) is the rank-distance from location j to i (e.g., if j is the
closest location to i, Ri(j) = 1; if j is the second closest location to
i, Ri(j) = 2, and so on) and is an adjustable parameter. This model
belongs to the category of parameterized models. However, 𝛾
presents minor variations from city to city. This model needs very
low input information to reproduce some key characteristics of
human mobility patterns.
4.3 Population-weighted Opportunities Model
Finally, the “population-weighted opportunities model” (Yan et
al., 2014) assumes that the attraction of a destination is inversely
proportional to the population Sji in the circle centered at the
destination with radius rij (the distance between the origin i and
destination j) minus a finite-size correction 1/M:
𝐴𝑗 = 𝑜𝑗 (1
𝑆𝑗𝑖−
1
𝑀) (3)
where Aj is the relative attraction of destination j to travelers at
origin i, oj is the total opportunities of destination j and M is the
total population in the city. Hence, probability of travel from i to
j is proportional to the attraction of j. Moreover, with the
assumption that the number of opportunities oj is proportional to
the population mj, the travel from i to j is defined as:
𝑇𝑖𝑗 = 𝑇𝑖
𝑚𝑗(1
𝑆𝑗𝑖−
1
𝑀)
∑ 𝑚𝑘(1
𝑆𝑘𝑖
𝑁𝑘≠𝑖 −
1
𝑀) (4)
where Ti is the trips starting from i and N is the number of
locations in the city.
4.4 Proposed Approach
In order to evaluate the efficiency of LBSN data in the estimation
of the intra-urban OD matrix using three mentioned models,
firstly, Foursquare check-ins data for Manhattan, was collected
and the collected raw data was filtered according to the approach
described in section 3. Secondly, as each LBSN data record has
a time attribute, check-ins were sorted based on time and
individuals’ trajectories were extracted using consecutive check-
ins. The study area was then partitioned based on census tracts
and using aggregated trajectories between these areas, the
movement flow intensity between each pair of tracts was
estimated by each of the mentioned models. Although the
mentioned models have no adjustable parameters, they require
information on variables such as population distribution and
location attraction as inputs. In order to extract these inputs from
location-based social networking data and make the proposed
models compatible with this kind of data, it is essential to renew
and develop the models, considering specific characteristics and
limitations of LBSN data. Therefore, in radiation and population-
weighted opportunities, the number of check-ins were used
instead of the population in the models. And in rank-based model,
the number of venues that are closer in terms of distance to origin
than destination were used instead of the rank-distance from
location j to i. In this paper, 𝛾 was assigned the value 0.84 as
proposed by (Noulas et al., 2012).
5. EVALUATION OF MODELS
This section compares the estimated Foursquare OD matrix using
mentioned models with the MTA ground truth matrix. To
evaluate the performance of the models we investigated the travel
distance distribution by three models based on ground truth data.
Travel distance distribution is an important statistical property to
capture human mobility behaviours (Yan et al., 2014).
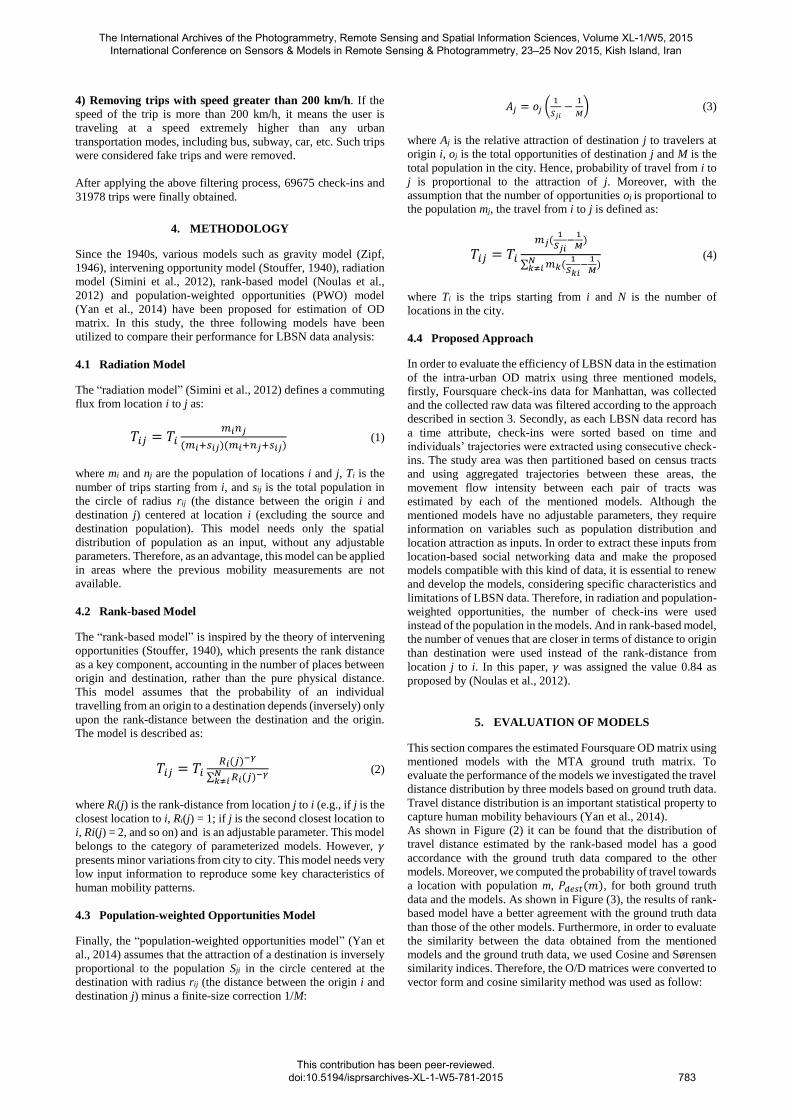
As shown in Figure (2) it can be found that the distribution of
travel distance estimated by the rank-based model has a good
accordance with the ground truth data compared to the other
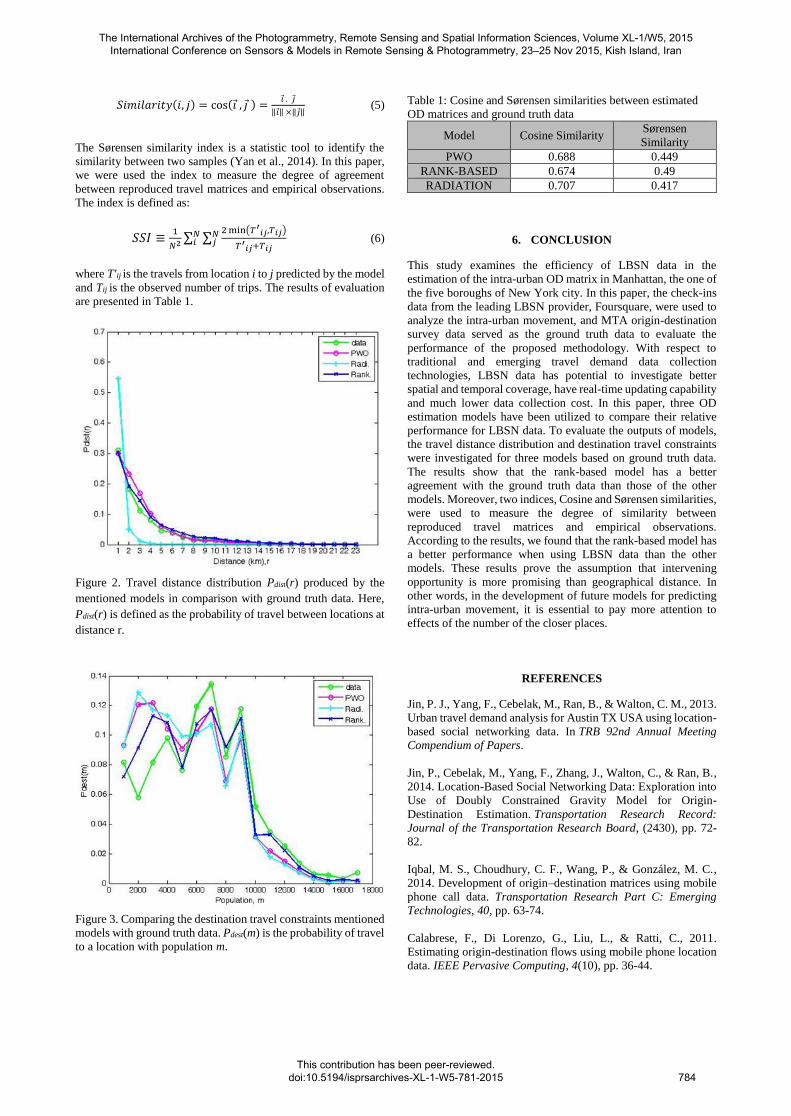
models. Moreover, we computed the probability of travel towards
a location with population m, 𝑃𝑑𝑒𝑠𝑡(𝑚), for both ground truth
data and the models. As shown in Figure (3), the results of rank-
based model have a better agreement with the ground truth data
than those of the other models. Furthermore, in order to evaluate
the similarity between the data obtained from the mentioned
models and the ground truth data, we used Cosine and Sørensen
similarity indices. Therefore, the O/D matrices were converted to
vector form and cosine similarity method was used as follow:
The International Archives of the Photogrammetry, Remote Sensing and Spatial Information Sciences, Volume XL-1/W5, 2015 International Conference on Sensors & Models in Remote Sensing & Photogrammetry, 23–25 Nov 2015, Kish Island, Iran
This contribution has been peer-reviewed. doi:10.5194/isprsarchives-XL-1-W5-781-2015
783
𝑆𝑖𝑚𝑖𝑙𝑎𝑟𝑖𝑡𝑦(𝑖, 𝑗) = cos(𝑖 , 𝑗 ) =𝑖 . 𝑗
‖𝑖‖ ×‖𝑗‖ (5)
The Sørensen similarity index is a statistic tool to identify the
similarity between two samples (Yan et al., 2014). In this paper,
we were used the index to measure the degree of agreement
between reproduced travel matrices and empirical observations.
The index is defined as:
𝑆𝑆𝐼 ≡1
𝑁2∑ ∑
2 min(𝑇′𝑖𝑗,𝑇𝑖𝑗)
𝑇′𝑖𝑗+𝑇𝑖𝑗
𝑁𝑗
𝑁𝑖 (6)
where T'ij is the travels from location i to j predicted by the model
and Tij is the observed number of trips. The results of evaluation
are presented in Table 1.
Figure 2. Travel distance distribution Pdist(r) produced by the
mentioned models in comparison with ground truth data. Here,
Pdist(r) is defined as the probability of travel between locations at
distance r.
Figure 3. Comparing the destination travel constraints mentioned
models with ground truth data. Pdest(m) is the probability of travel
to a location with population m.
Table 1: Cosine and Sørensen similarities between estimated
OD matrices and ground truth data
Model Cosine Similarity Sørensen
Similarity
PWO 0.688 0.449
RANK-BASED 0.674 0.49
RADIATION 0.707 0.417
6. CONCLUSION
This study examines the efficiency of LBSN data in the
estimation of the intra-urban OD matrix in Manhattan, the one of
the five boroughs of New York city. In this paper, the check-ins
data from the leading LBSN provider, Foursquare, were used to
analyze the intra-urban movement, and MTA origin-destination
survey data served as the ground truth data to evaluate the
performance of the proposed methodology. With respect to
traditional and emerging travel demand data collection
technologies, LBSN data has potential to investigate better
spatial and temporal coverage, have real-time updating capability
and much lower data collection cost. In this paper, three OD
estimation models have been utilized to compare their relative
performance for LBSN data. To evaluate the outputs of models,
the travel distance distribution and destination travel constraints
were investigated for three models based on ground truth data.
The results show that the rank-based model has a better
agreement with the ground truth data than those of the other
models. Moreover, two indices, Cosine and Sørensen similarities,
were used to measure the degree of similarity between
reproduced travel matrices and empirical observations.
According to the results, we found that the rank-based model has
a better performance when using LBSN data than the other
models. These results prove the assumption that intervening
opportunity is more promising than geographical distance. In
other words, in the development of future models for predicting
intra-urban movement, it is essential to pay more attention to
effects of the number of the closer places.
REFERENCES
Jin, P. J., Yang, F., Cebelak, M., Ran, B., & Walton, C. M., 2013.
Urban travel demand analysis for Austin TX USA using location-
based social networking data. In TRB 92nd Annual Meeting
Compendium of Papers.
Jin, P., Cebelak, M., Yang, F., Zhang, J., Walton, C., & Ran, B.,
2014. Location-Based Social Networking Data: Exploration into
Use of Doubly Constrained Gravity Model for Origin-
Destination Estimation. Transportation Research Record:
Journal of the Transportation Research Board, (2430), pp. 72-
82.
Iqbal, M. S., Choudhury, C. F., Wang, P., & González, M. C.,
2014. Development of origin–destination matrices using mobile
phone call data. Transportation Research Part C: Emerging
Technologies, 40, pp. 63-74.
Calabrese, F., Di Lorenzo, G., Liu, L., & Ratti, C., 2011.
Estimating origin-destination flows using mobile phone location
data. IEEE Pervasive Computing, 4(10), pp. 36-44.
The International Archives of the Photogrammetry, Remote Sensing and Spatial Information Sciences, Volume XL-1/W5, 2015 International Conference on Sensors & Models in Remote Sensing & Photogrammetry, 23–25 Nov 2015, Kish Island, Iran
This contribution has been peer-reviewed. doi:10.5194/isprsarchives-XL-1-W5-781-2015
784
Zipf, G. K., 1946. The P1 P2/D hypothesis: On the intercity
movement of persons. American sociological review, pp. 677-
686.
Stouffer, S. A., 1940. Intervening opportunities: a theory relating
mobility and distance. American sociological review, 5(6), pp.
845-867.
Simini, F., González, M. C., Maritan, A., & Barabási, A. L.,
2012. A universal model for mobility and migration
patterns. Nature, 484(7392), pp. 96-100.
Noulas, A., Scellato, S., Lambiotte, R., Pontil, M., & Mascolo,
C., 2012. A tale of many cities: universal patterns in human urban
mobility. PloS one, 7(5), e37027.
Yan, X. Y., Zhao, C., Fan, Y., Di, Z., & Wang, W. X., 2014.
Universal predictability of mobility patterns in cities. Journal of
The Royal Society Interface, 11(100), 20140834.
The International Archives of the Photogrammetry, Remote Sensing and Spatial Information Sciences, Volume XL-1/W5, 2015 International Conference on Sensors & Models in Remote Sensing & Photogrammetry, 23–25 Nov 2015, Kish Island, Iran
This contribution has been peer-reviewed. doi:10.5194/isprsarchives-XL-1-W5-781-2015
785