Intra Rural and Urban Primary Care Physician Findings ... · Intra Rural and Urban Primary Care...
84
Intra Rural and Urban Primary Care Physician Findings: AAMC 2009 Physician Survey of Primary Care Chartbook February 2015 U.S. Department of Health and Human Services Health Resources and Services Administration Federal Office of Rural Health Policy
Transcript of Intra Rural and Urban Primary Care Physician Findings ... · Intra Rural and Urban Primary Care...
Intra Rural and Urban Primary Care Physician
Findings: AAMC 2009 Physician Survey of Primary
Care Chartbook
February 2015
U.S. Department of Health and Human Services
Health Resources and Services Administration
Federal Office of Rural Health Policy

2
The publication was produced for the U.S. Department of Health and Human Services, Health
Resources and Services Administration, Office of Rural Health Policy by Gary Hart Associated
under HRSA contract number HHSH250201000125P.
The views and content in these resources have not been formally approved by the U.S.
Department of Health and Human Services (HHS) or the Health Resources and Services
Administration (HRSA). Neither HHS nor HRSA endorses the products or services of the listed
resources.
Intra Rural and Urban Primary Care Physician Findings: AAMC 2009 Physician Survey of
Primary Care Chartbook is not copyrighted. Readers are free to duplicate and use all or part of
the information contained in this publication; however, photographs require permission to be
reproduced.
Pursuant to 42 U.S.C. § 1320b-10, this publication may not be reproduced, reprinted, or
redistributed for a fee without specific written authorization from HHS.
Suggested Citation: U.S. Department of Health and Human Services, Health Resources and
Services Administration, Office of Rural Health Policy. Intra Rural and Urban Primary Care
Physician Findings: AAMC 2009 Physician Survey of Primary Care Chartbook. Rockville,
Maryland, 2014.

3
Table of Contents
INTRODUCTION/PURPOSE ................................................................................................................................ 4
METHODS ............................................................................................................................................................. 5
PHYSICIAN DEMOGRAPHIC CHARACTERISTICS ...................................................................................... 10
PHYSICIAN SATISFACTION ............................................................................................................................ 12
PRACTICE CHARACTERISTICS ...................................................................................................................... 23
PHYSICIAN PRACTICE ACTIVITY AND CHARACTERISTICS .................................................................. 46
PATIENT CENTERED MEDICAL HOME ........................................................................................................ 65
ENDING COMMENTS ........................................................................................................................................ 83

4
Introduction/Purpose
The purpose of this report is to use primary care physician (PCP) survey data, collected by the
Association of American Medical Colleges (AAMC) in 2009/2010 shortly before the Affordable
Care Act was made law, to create baseline data that can be compared to similar survey data once
the Affordable Care Act is fully implemented. The Affordable Care Act is clearly influencing
nearly all aspects of PCP professional activities. The AAMC survey was not an attempt to
obtain comprehensive PCP data in depth on a single practice/physician theme. Instead, it was
aimed at acquiring information on several themes thought to relate to the Affordable Care Act’s
objectives. The information on these themes is informative but not comprehensive about any of
the themes. The main theme areas as set forth by the sections of the survey instrument are:
Active in Medicine, Work Arrangements, Activity Levels in Your Principal Practice Site, Patient
Centered Medical Home, Work Preferences, Background, and Addressing Primary Care
Shortages. For the purposes of this report, the survey questions have been reorganized into the
following report divisions: Introduction/Purpose, Methods, Physician Demographic
Characteristics, Physician Satisfaction, Practice Characteristics, Physician Practice Activity and
Characteristics, Patient Centered Medical Home, and Ending Comments.
The straightforward purpose of this report is to provide baseline information on nearly all of the
survey’s questions by the three PCP specialties (i.e., family medicine, general internal medicine,
and general pediatrics) by their Rural/Urban status. By analyzing the data and presenting the
base survey information in this report, it preserves a baseline from which to compare future post
Affordable Care Act implementation surveys. This will help to answer parts of the questions
about how health reform has influenced PCP activities and perceptions. Graphs were extensively
used to present the findings so that they will be available to those who want to show portions of
the findings either by themselves for 2009 or in combination with subsequent findings from
survey data gathered after the Affordable Care Act is more fully implemented.

5
Methods
The survey responses and other linked data for family physicians (FPs), general internists, and
general pediatricians were obtained from the AAMC. The AAMC performed the survey with
help from a subcontractor. A brief overview of the survey methods is provided here in the
Methods section. A more detailed description of the methods from the AAMC is located at the
following web link: http://Ruralhealth.und.edu/pdf/aamc-2009-physician-primary-care-survey-
methods.pdf. This information includes the sampling, surveying, responses, and weighting
procedures. A copy of the survey questionnaire is located at the following web address:
http://Ruralhealth.und.edu/pdf/aamc-2009-workforce-questionnaire.pdf.
As indicated in the AAMC methodology (link above), the survey was intended “… for
physicians who provide primary care services. In addition to those in the traditional primary care
specialties, we surveyed physicians in internal medicine subspecialties and pediatric
subspecialties.” This report only deals with the traditional primary care specialties of family
medicine (and those physicians who identified themselves as general practitioners), general
internal medicine, and general pediatrics.
The main methodological components are:
1) Use of 2008 American Medical Association (AMA) Masterfile as the sampling frame:
a. Limited to specialties as indicated above
b. Had valid deliverable address in the U.S.
c. Could be assigned a valid Rural-Urban Commuting Area (RUCA) code
d. Had no contact restrictions
e. Physicians still in training were excluded (i.e., residents and fellows)
f. Other physicians excluded were those who were retired, semi-retired, temporarily
not in practice, and those not active for other reasons
g. The sample size was 9,000 owing due to fiscal constraints
h. The random sample was selected for each stratified physician group defined by
several Masterfile variables (e.g., specialty, type of physician, Massachusetts
practice) – 48 strata
i. Location of practice and preferred mailing address information was used to assign
state and ZIP code – in the final data set the ZIP code practice response to the
survey ZIP question is used
2) Mailing of questionnaire for the traditional PCPs
a. After a first mailing to all sampled PCPs, a second and third mailing were made to
non-respondents
b. Survey mailings used professional association letters, postcard reminders, a $2
bill, business-reply return envelope, instructions for completing the survey on-line
(as an alternative), and third mailing Federal Express/USPS priority delivery
package
c. Data collection ended on February 10, 2010
d. Response survey instruments were scanned into an electronic database through an
optical mark scanner
e. Online data were merged with the electronic database
f. AMA Physician Masterfile data (e.g., sex and age) were link to the database

6
g. An SPSS data file was created for analysis
3) Response Rates
a. After a first mailing to all sampled PCPs, a second and third mailing were made to
non-responders
b. The response rates adjusted for non-deliverables (e.g., deceased) were: general
pediatrics (49.4 percent), family medicine (44.0 percent), and general internal
medicine (37.2 percent). The response rates for specialties not included in this
report were: obstetrics/gynecology (33.7 percent), internal medicine
subspecialties (31.3 percent), and pediatric subspecialties (31.1 percent). The
complicated compensatory weighting methodology attempts to adjust for some
aspects of the relatively low response rates (see AAMC methodology document
at:
http://Ruralhealth.und.edu/pdf/aamc-2009-physician-primary-care-survey-
methods.pdf
c. Among respondents the item response rates were high
4) Weighting
a. A comparison of the respondents and the non-respondents using the AMA
Masterfile information was performed. Significant differences were found per the
following variables per each of this report’s primary care specialties:
i. Family medicine: degree type, location of medical education, location of
practice, age, and present employment
ii. General internal medicine: degree type, location of medical education,
and age
iii. General pediatrics: location of medical education, age, and present
employment
b. Weights were constructed and were designed to adjust for:
i. Differences in response rates by specialty
ii. Differences in response rates by AMA information physician types by
degree type, Metropolitan/Non Metropolitan status, international medical
school graduate status, Massachusetts location, and more.
iii. A second weight was created for the primary care specialties to facilitate
comparing them
1. The aim of the primary care specialty adjustment of the general
weights (named “weightrp”) was to better hone the weights to
create better comparisons between primary care specialties using
response rates and other data available from the AMA Masterfile
for the three specialties
2. The resulting primary care specialty variable was named
“weightrp” and was used throughout the tables for this report
As signified above, a more detailed description of the methods can be found at the following
link: http://Ruralhealth.und.edu/pdf/aamc-2009-physician-primary-care-survey-methods.pdf
A copy of the survey questionnaire can be viewed at the following web address:
http://Ruralhealth.und.edu/pdf/aamc-2009-workforce-questionnaire.pdf.
The analyses for this report were directed toward generalist physicians who worked half time or
more. Physicians were deleted from these analyses if either or both of the following two
conditions were not met: 1) they reported professionally working 20 or more hours per week

7
excluding on-call time, and 2) they reported having 20 or more weekly visits/encounters with
patients.
In this study, the practice ZIP codes as reported by the respondents were matched to the
associated RUCA codes, with the 33 codes being aggregated into four focus categories (i.e.,
Urban, Large Rural, Small Rural, and Isolated and Small Rural). The RUCAs are a geographic
taxonomy that utilizes ZIP codes to characterize the Rural/Urban status of ZIP code areas. The
RUCAs are based on the populations of Census Bureau defined Urban Areas and the work
commuting flows between ZIP code areas. The codes are based on primary and secondary work
commuting flows. This study’s four aggregated focus categories are can be characterized as
follows: Urban (cities of 50,000 or greater population and those additional ZIP code areas
wherein the primary work commuting flows are to the city); Large Rural (cities/towns of 10,000
through 49,999 and those additional ZIP code areas wherein the primary work commuting flows
are to the city/town); Small Rural (town of 2,500 through 9,999 and those additional ZIP code
areas wherein the primary work communities flows are to the town); and Isolated Small Rural
(ZIP codes that are not a part of a Urban Area of 2,500 or more and do not have large primary
work commuting flows to Urban Areas of 2,500 or more). In addition, all ZIP code areas with
work commuting flows of from 30 percent through 49 percent are grouped with the Urban focus
category. For a more complete explanation of the RUCA geographic taxonomy, see the
following website: http://depts.washington.edu/uwruca/
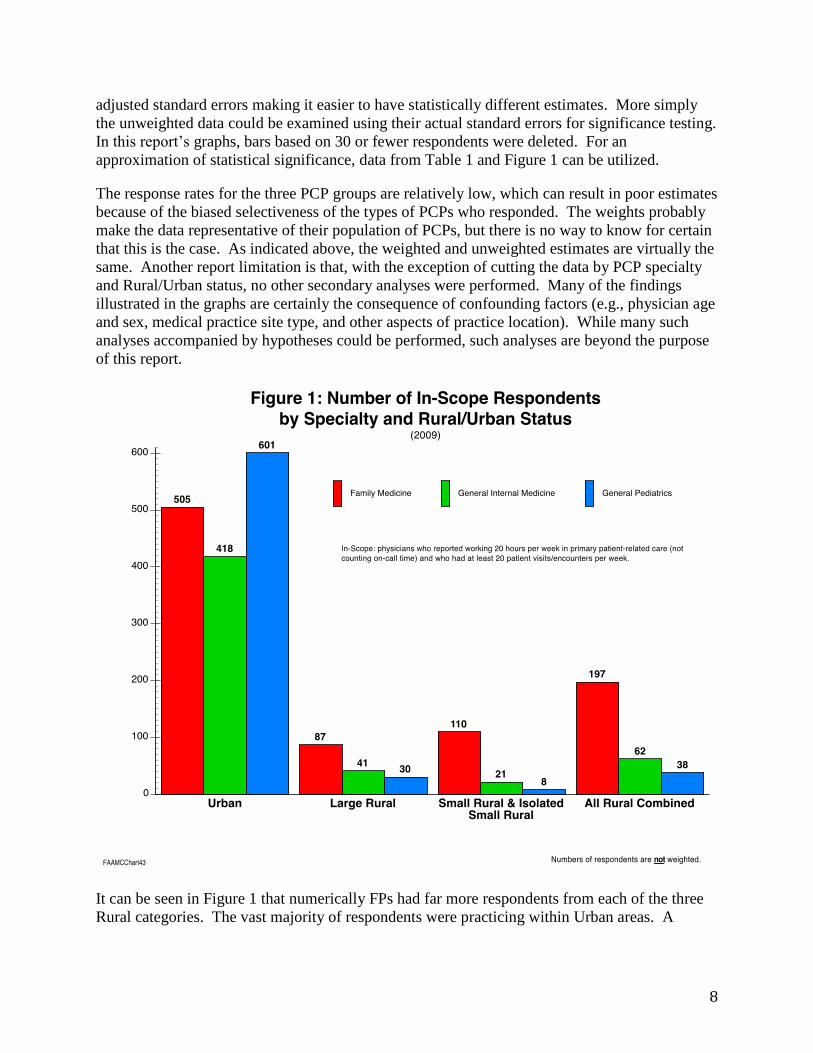
Figure 1 shows the number of survey respondent physicians (unweighted) by Rural/Urban status
(four categories) and specialty (three categories). Because of the small number of respondents in
the Isolated and Small Rural category, it was prudent to combine the Small Rural and Isolated
Small Rural RUCA categories into one category entitled in this study as Small Rural and Isolated
Small Rural category. As can be seen in Figure 1, the final number of respondents included in
the analyses was: FPs (702), general internists (480), and general pediatricians (639) for a total
of 1,821 survey respondents of whom 594 were located within Rural areas.
The compensatory AAMC-created population weights were designed to make analysis estimates
unbiased (i.e. representative). The weighting process usually increases the standard errors,
which has the effect of creating a design effect that reduces the power of statistical tests (e.g., the
number of cases is virtually reduced). In this case, it was determined that the adjusted
confidence intervals were dramatically increased as a result of the weighting strategy (mostly
because the sampling method, differential response rates, and weighting methodology with its
too numerous cells ended up having a small number of weights that were comparatively larger
than for the majority of responses).
Interestingly the differences in estimates when weights were used and not used were universally
not meaningful (i.e., differences were small in magnitude when there were differences). For
instance, an estimate with 197 responses yields a weighted estimate of 83.4 percent and an
unweighted estimate of 84.3 percent – this is typical. The weighted estimates are presented
throughout this report, with the knowledge that there is little difference between them and their
unweighted counterparts. Because this is a descriptive report where there are no hypotheses
being tested, this is appropriate, with a caution to be cautious of estimates based on a number of
actual cases that are small (for instance 30 or fewer). A revised weighting strategy could be
devised that would only very marginally change the estimates but that would decrease the
8
adjusted standard errors making it easier to have statistically different estimates. More simply
the unweighted data could be examined using their actual standard errors for significance testing.
In this report’s graphs, bars based on 30 or fewer respondents were deleted. For an
approximation of statistical significance, data from Table 1 and Figure 1 can be utilized.
The response rates for the three PCP groups are relatively low, which can result in poor estimates
because of the biased selectiveness of the types of PCPs who responded. The weights probably
make the data representative of their population of PCPs, but there is no way to know for certain
that this is the case. As indicated above, the weighted and unweighted estimates are virtually the
same. Another report limitation is that, with the exception of cutting the data by PCP specialty
and Rural/Urban status, no other secondary analyses were performed. Many of the findings
illustrated in the graphs are certainly the consequence of confounding factors (e.g., physician age
and sex, medical practice site type, and other aspects of practice location). While many such
analyses accompanied by hypotheses could be performed, such analyses are beyond the purpose
of this report.
It can be seen in Figure 1 that numerically FPs had far more respondents from each of the three
Rural categories. The vast majority of respondents were practicing within Urban areas. A

9
consequence of the small numbers of Rural general pediatricians is indicative of their small
number of respondents.
The analyses focus on the survey variables of interest by Rural/Urban status (three levels) by
primary care specialty (three types). Higher order analyses are not reported here. For each
report division (e.g., physician satisfaction) title page, the questions reported on are listed by
their numbers that correspond to the questionnaire at the following web address:
http://Ruralhealth.und.edu/pdf/aamc-2009-workforce-questionnaire.pdf.
The questions in each section are in the same order in which they appear in the survey
instrument. A few questions are not included in this report for various reasons (apparent from
responses) ranging from not knowing whether the respondents included themselves in the
number asked for to inappropriate double counting to no longer being relevant. The following
questions were not included in this report: Q2b, Q16, Q25, and Q34. The following questions
were only partially used in this report: Q3 and Q6.
The report’s data, analyses, and findings have several limitations and weaknesses that should be
recognized. Users should selectively be cautious in their use. For some of the Rural/specialty
categories, there are a relatively small number of cases, which makes estimates subject to error.

10
Physician Demographic Characteristics
Questionnaire Questions:
AMA Sex
AMA Age
Q31
Q32

11
Table 1: Physician Demographic Characteristics (2009 & Weighted)
Characteristics
Urban Large Rural Small and Isolated Small Rural
FP
General Internal
Medicine
General
Pediatrics
FP
General Internal
Medicine
General
Pediatrics
FP
General Internal
Medicine
General
Pediatrics
Age (AMA) (mean years) 50.0 48.9 50.0 51.9 46.7 50.8 51.7 51.2 53.8
Female (AMA) (%) 35.1 32.0 56.6 18.8 25.6 33.3 19.5 21.1 33.3
Hispanic Ethnicity (%) 5.4 6.1 7.3 6.0 2.4 4.8 3.8 0.0 0.0
Race:
Asian 15.0 23.2 16.6 8.7 25.6 9.9 9.9 14.3 20.0
Native Hawaiian or
Pacific Islander 0.9 0.6 0.7 1.4 0.0 0.0 0.0 0.0 0.0
Black/African American 5.5 4.3 5.9 2.9 0.0 0.0 0.0 4.8 16.7
American Indian or
Alaska Native 0.9 0.0 0.7 0.0 0.0 0.0 0.0 0.0 0.0
White 71.3 67.3 68.6 84.1 62.8 84.0 84.0 81.0 66.7
Other 6.2 4.3 6.2 4.3 4.8 3.7 3.7 0.0 20.0
Number of respondents 505 418 601 87 41 30 110 21 8
*Estimates can add to greater than 100 percent because respondents could mark more than one race.
44.1 Underlined estimates are based on small number of cases (<38) and should only be used with appropriate
caution. In many places in the analyses that follow, specialty/geographic category groups are aggregated in the
analyses. For instance, all the Rural categories of general pediatricians are aggregated into an “All Rural”
category. ________________________________________________
As shown in Table 1, 1,524 (83.7 percent) of the respondents were from Urban category
communities (i.e., FPs, 505; general internists, 418; and general pediatricians, 601 respondents).
Rural physician respondents accounted for 26.3 percent of respondents (i.e., 297 respondents). A
prime purpose of the AAMC survey was not to highlight Rural physician information, which
explains the relatively low number of Rural respondents. Nevertheless, the Rural responses do
provide valuable information though they are limited and sometimes have to be aggregated to
provide usable estimates.
In the methods section above, significant differences between the physician population and the
weighted project estimates are noted. White physicians make up the majority of all
specialty/geography category cells. Physician mean category age/specialty is similar. General
pediatricians are more likely to be female across all geographies.

12
Physician Satisfaction
Questionnaire Questions:
Q26a through Q27

13
As can be seen in Figure 2, Urban general pediatricians and Rural FPs reported being more
satisfied with their careers in medicine than general internists in both Rural and Urban practices.
The total Rural satisfaction levels by specialty (irrespective of practice location) are: family
medicine, 87.0 percent; general internal medicine, 76.2 percent; and general pediatrics, 84.7
percent. Urban FPs and general internists have similar satisfaction ratings regarding their careers
in medicine (FPs, 80.1 percent; and general internists, 77.8 percent).

14
When asked about their satisfaction with their choice of specialty, Urban group general
pediatricians reported being very and somewhat more satisfied than the other
specialty/geographic category physicians (Figure 3). General internists reported being least
satisfied with their specialty choice. The total Rural satisfaction levels by specialty (irrespective
of practice location) are: family medicine, 83.5 percent; general internal medicine, 73.0 percent;
and general pediatrics, 92.6 percent.

15
Again, Urban general pediatricians reported being more very and somewhat satisfied (87.8
percent) this time with their job/position, than the other primary care specialties by location types
(Figure 4). General internists reported being least satisfied. The total Rural satisfaction levels
by specialty (irrespective of practice location) are: family medicine, 82.6 percent; general
internal medicine, 76.2 percent; and general pediatrics, 84.6 percent.
16
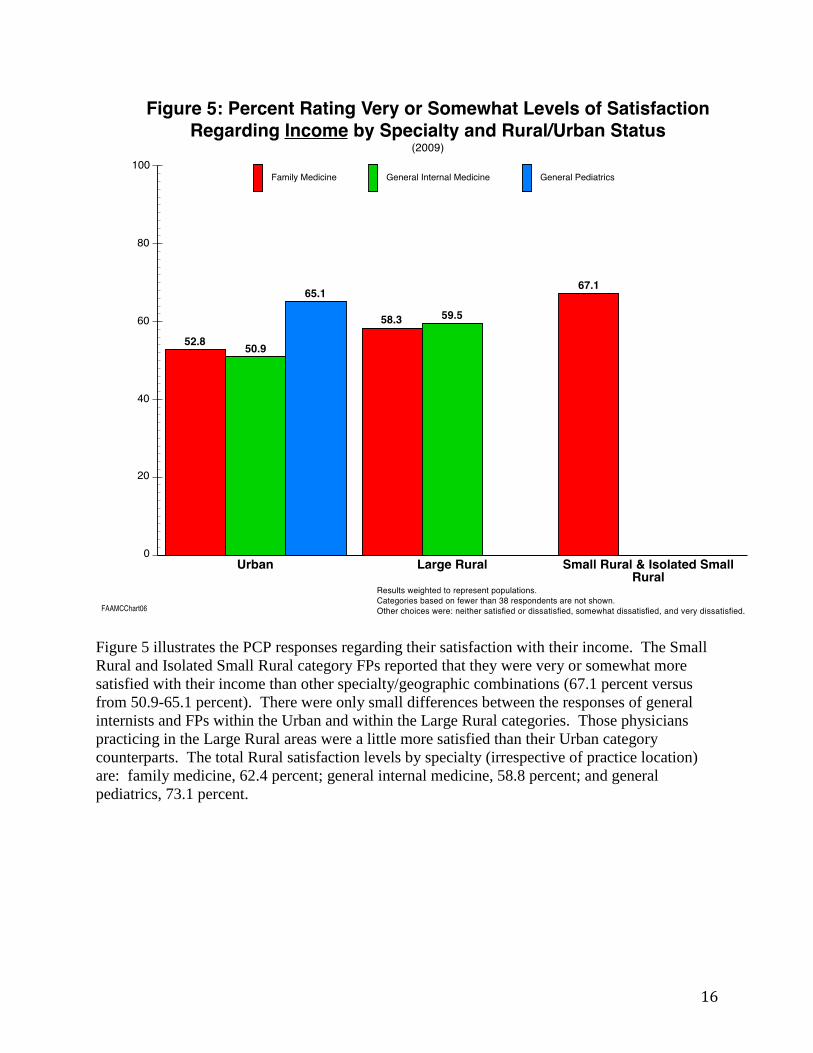
Figure 5 illustrates the PCP responses regarding their satisfaction with their income. The Small
Rural and Isolated Small Rural category FPs reported that they were very or somewhat more
satisfied with their income than other specialty/geographic combinations (67.1 percent versus
from 50.9-65.1 percent). There were only small differences between the responses of general
internists and FPs within the Urban and within the Large Rural categories. Those physicians
practicing in the Large Rural areas were a little more satisfied than their Urban category
counterparts. The total Rural satisfaction levels by specialty (irrespective of practice location)
are: family medicine, 62.4 percent; general internal medicine, 58.8 percent; and general
pediatrics, 73.1 percent.

17
Urban general pediatricians expressed being very and somewhat satisfied with the amount of
time they spend with patients relatively more often than the other specialty/geographic
combination groups of PCPs. FPs were not far behind across all three of the geographic groups.
General internists were lowest in satisfaction but not meaningfully lower in Urban practices than
their FP counterparts. The total Rural satisfaction levels by specialty (irrespective of practice
location) are: FPs, 62.1 percent; general internal medicine, 50.8 percent; and general pediatrics,
73.1 percent.

18
Most of the PCPs whose data are shown in Figure 7 did not differ meaningfully in their rating of
satisfaction with their ability to control their hours and schedules (general pediatricians highest at
62.5 percent). Only Urban general internists differed by being lower than the rest (50.7 percent).
The total Rural satisfaction levels by specialty (irrespective of practice location) are: FPs, 61.1
percent; general internists, 59.7 percent; and general pediatrics, 57.7 percent.

19
A major life issue with many physicians is their ability to balance their work and their personal
lives. As can be seen from Figure 8, the most very and somewhat satisfied of the
specialty/geographic groups are Large Rural FPs (63.6 percent) followed closely by Urban
general pediatricians (59.1 percent). As with the other satisfaction-related questions, the general
internists are least satisfied (46.8 and 40.5 percent for Urban and Large Rural). The total Rural
satisfaction levels by specialty (irrespective of practice location) are: FPs, 58.8 percent; general
internists, 46.1 percent; and general pediatricians, 53.9 percent.

20
The very and somewhat satisfaction responses of FPs across all of the satisfaction questions are
depicted in Figure 9. The FPs reported higher satisfaction with their career in medicine,
specialty choice, and job/position satisfaction questions (range 79.1 to 87.9 percent). The overall
satisfaction across geographic area types for FPs was lowest on the income, time with patients,
ability to control hours and schedule, and balance work and home life satisfaction questions
(range 52.8 to 67.1 percent). An important takeaway from Figure 9 is that Rural FPs are
generally more satisfied than their Urban counterparts. Of the Rural practice location categories,
FPs practicing in small and isolated small communities are most satisfied.
21
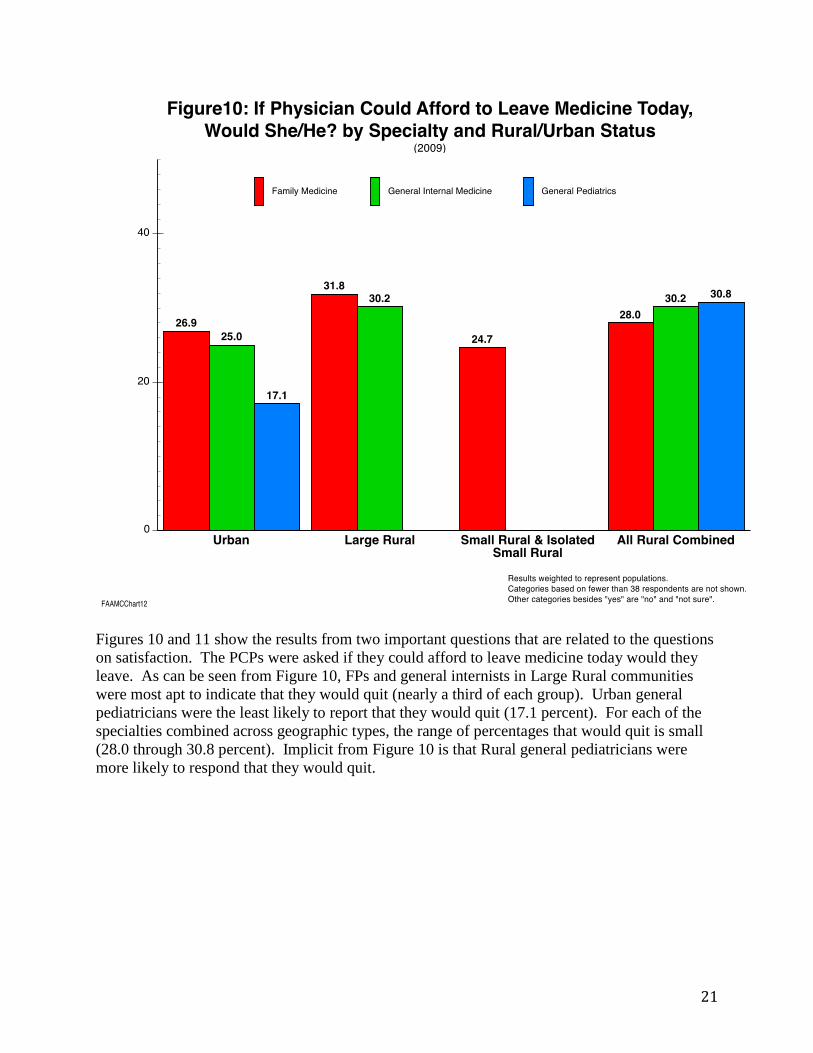
Figures 10 and 11 show the results from two important questions that are related to the questions
on satisfaction. The PCPs were asked if they could afford to leave medicine today would they
leave. As can be seen from Figure 10, FPs and general internists in Large Rural communities
were most apt to indicate that they would quit (nearly a third of each group). Urban general
pediatricians were the least likely to report that they would quit (17.1 percent). For each of the
specialties combined across geographic types, the range of percentages that would quit is small
(28.0 through 30.8 percent). Implicit from Figure 10 is that Rural general pediatricians were
more likely to respond that they would quit.

22
Figure 11 displays primary care responses by specialty and Rural/Urban status per the following
question: “If you could afford to today, would you reduce work hours?” As a comparison
between Figure 10 and Figure 11 shows, PCPs by specialty and Rural/Urban status were much
more likely to report that they would reduce their working hours than to report that they would
leave medicine if they could afford it (60-74 percent versus 17-31 percent). Across Rural
physicians, general pediatricians were least likely to report that they would reduce their working
hours. There were not large variations by general internists and FPs by geographic practice site
types. The most likely to indicate that they would reduce their hours were Urban FPs at 73.8
percent followed by Small Rural and Isolated Small Rural at 73.3 percent.

23
Practice Characteristics
Questionnaire Questions:
Q4, Q6-Q12, and Q24

24
Rural FPs are more likely to practice in solo practices than their Urban counterparts (27.0 percent
versus 19.2 percent) (Figure 12). Urban FPs are more likely to have practices that fall under the
other category (i.e., freestanding ambulatory clinics, HMOs, medical schools, governments, and
others) (18.7 percent versus 10.8 percent).

25
Unlike FPs, Urban general internists are more likely to be in solo practice than Rural general
internists (24.3 versus 13.8 percent) (Figure 13). Rural general internists are much more likely to
be in multi-specialty group practice than their Urban counterparts (27.7 versus 16.1 percent).
The remaining Rural/Urban differences were not noteworthy. Few general internists responded
that they were practicing in Federal Qualified Health Centers.

26
General pediatricians are more likely to practice in single specialty group practices in both Rural
and Urban communities (39 percent and 47 percent respectively [Figure 14]) than FPs (31
percent in both Rural and Urban [Figure 12]) and general internists (25 percent in Rural and 27
percent in Urban [Figure 13]). Rural general pediatricians are practicing more often in multi-
specialty groups than their Urban complements (23.1 percent versus 12.9 percent). Few Rural
and Urban general pediatricians are practicing at Federal Qualified Health Centers and hospital
inpatient services.

27
In Figure 15, the median numbers of PCPs, specialist physicians, physician assistants (PAs), and
nurse practitioners (NPs) are shown by Rural/Urban status. Medians are utilized because some
physicians reported exceedingly large numbers of providers (Figures 15-17). In addition,
because of the question’s wording, it cannot be known whether the PCP respondents counted
themselves in their responses to the PCP subpart of the question (Figures 15-17). Among the
responding FPs (weighted to their national population), the median number of PCPs that they
share practice with at their principal practice site by Rural/Urban status are: Urban, 4; Large
Rural, 2; Small Rural and Isolated Small Rural, 3. The comparable medians for PAs and NPs are
one and one across all geographic groups. The median across all geographies is zero for
specialist physicians.

28
The results for Urban general internists are the same as for Urban FPs except that the internists
report working in practices with a median of one specialty physician whereas the FPs median is
zero. In Large Rural practices, the general internists reported practicing with more providers
than in Urban practices and their FP counterparts. The general internist practice staffing for
Small Rural and Isolated Small Rural communities is lower than for Urban and Large Rural
practices. All general internists had medians of one or higher regarding PAs and NPs.

29
General pediatricians reported working with fewer PAs than did FPs and general internists but
about the same number with NPs. In Small Rural and Isolated Small Rural practices, the general
pediatrician median number of PCPs was five. Figures 15-17 show that the PCPs practice with
PAs and NPs but only the Urban and Large Rural general internists work with specialist
physicians.

30
Figure 18 depicts by Rural/Urban status the percent of FPs who work regularly with PAs and
NPs. Implicitly the percentages of FPs who do not work regularly with PAs and NPs by
Rural/Urban status are: Urban, 51.8 percent; Large Rural, 46.5 percent; Small Rural and Isolated
Small Rural, 36.6 percent; and All Rural, 41.3 percent. Thus, the more Rural and smaller
practices are more likely to use PAs and NPs. Figure 18 shows that FP practices are more likely
to include only NPs than only PAs across the four geographic types. If the “both PAs and NPs”
are added to these figures, 35 percent of Urban FPs reported working with NPs, while 42 percent
of Rural FPs so reported. The comparable numbers for PAs are 30 percent and 35 percent.

31
Implicitly the percentages of general internists who do not work regularly with PAs and NPs by
Rural/Urban status are: Urban, 66.3 percent; Large Rural, 55.0 percent; and All Rural, 43.1.
Across geographic types, general internists are more likely to work with NPs than PAs (Urban,
16.8 versus 6.8 percent; Large Rural, 25.6 versus 9.3 percent; and All Rural, 29.2 versus 9.2
percent). If the “both PAs and NPs” are added to these figures, 27 percent of Urban FPs reported
working with NPs, while 48 percent of Rural FPs so reported. The comparable numbers for PAs
are 17 percent and 28 percent.

32
General pediatricians who do not work regularly with PAs and/or NPs by Rural/Urban status are:
Urban, 58.9 percent; and All Rural, 46.2 percent (Figure 20). For all three primary care
specialties, Rural practitioners were much more likely to be working with PAs and/or NPs. If the
“both PAs and NPs” are added to these figures, 36 percent of Urban FPs reported working with
NPs, while 50 percent of Rural FPs so reported. The comparable numbers for PAs are 12
percent and 19 percent.

33
Figures 21-23 show the percentages of PCPs by specialty type who are formally affiliated with a
network of other practices or health providers. It can be seen that Urban FPs are more liable to
work in such networks (51.8 percent) than their Rural colleagues (40.5, percent, Large Rural;
Small Rural and Isolated Small Rural, 37.2 percent; and overall Rural, 38.6 percent [Figure 21]).
By far across Rural/Urban status, FPs are most likely to be practicing in physician-hospital
organizations and least apt to practice in staff model HMOs.

34
For general internists, the most common form of network affiliation was reported to be
physician-hospital organizations for Urban, 21.9 percent; Large Rural, 40.9 percent; and All
Rural, 46.8 percent categories. Comparatively more of the general internists are affiliated with
physician-hospital networks in Large Rural practices than elsewhere.

35
As can be seen from Figure 23, Rural general pediatricians are somewhat more likely to be
affiliated with networks than their Urban counterparts (48.1 versus 41.6). As with the other PCP
specialties, the physician-hospital organization was reported for both Rural and Urban general
pediatricians most often (25.9 versus 19.6 percent). Across the three physician specialties by
Rural and Urban (Figure 21 – Figure 23) the comparative percentages are: Urban (FP, 51.8
percent; general internist, 45.0 percent; and general pediatrician, 41.6 percent) versus All Rural
(FP, 38.6 percent; general internist, 46.8 percent; and general pediatrician, 48.1 percent). Thus,
the highest affiliation group was Urban FPs and the lowest affiliation group was Rural FPs.

36
About 30 percent of FP compensation was reported to be from salary with incentives/bonus
across all the Rural/Urban categories (Figure 24). In fact, there were not large differences in the
responses of the FPs across the four geographic categories. Rural FPs were more apt to indicate
that they received their compensation via self-employed practice income than did Rural general
internists and general pediatricians (Figures 25 and 26). A smaller percentage of the FPs
indicated they were compensated through some form of productivity model.

37
For general internist compensation, the Large Rural physician group seems most different both
within Figure 25 and when compared to FPs (Figure 24) and general pediatricians (Figure 26).
This may be related to the propensity of general internists in large Rural practices to be
hospitalists (see Figure 51) (also related to fewer being compensated through self-employment
practice income). General internists practicing in Large Rural communities were more likely to
be reimbursed through productivity models (no salary) than their Urban counterparts (Large
Rural, 25.6 percent versus Urban, 15.9 percent).

38
The responses of the general pediatricians (Figure 26) were generally similar to those of the
other two PCP groups. Comparisons between Rural and Urban general pediatricians do not
show large differences in their reimbursement patterns. Urban general pediatricians received
30.2 percent of their reimbursement from self-employed practice income and 29.5 percent from
salary with incentives/bonus. The comparable numbers for All Rural general pediatricians are
23.1 percent and 34.6 percent.

39
Figures 27 through 29 illustrate PCP responses related to the difficulty of recruiting different
provider types into their practices/communities. In Figure 27, it is apparent that the responding
FPs felt it was most difficult to recruit PCPs to their practices when compared to the other
provider types about which they were asked (Urban, 37.1 percent versus All Rural, 46.0 percent).
This more frequent mention of the difficulty of PCP recruitment was across all four of the
Rural/Urban status categories. Across the other provider types, there were not great differences
with a pattern of Rural being perceived as more difficult than Urban. There is little difference
between the difficulty ratings of the other four provider types: specialist physicians, PAs, NPs,
and registered nurses (RNs). However, PAs were only mentioned as difficult by 10.9 percent of
the Urban survey respondents (weighted) compared to 19.3 percent for specialty physicians, 13.5
percent for NPs, and 18.0 percent for RNs. Across the four non-PCP categories, Small Rural and
Isolated Small Rural FPs reported the most recruiting difficulty for geographic categories for
specialist physicians, PAs, and RNs.

40
The pattern of responses for general internists is similar to that for FPs in that recruiting
difficulty is mentioned more often for Rural practices across all provider types, though the
difference is not consequential for the PAs (Figure 28). For Rural general internists high
percentages indicated difficulty recruiting PCPs (Large Rural, 61.9 percent; All Rural, 64.5
percent) and specialist physicians (Large Rural, 41.0 percent; All Rural, 36.8 percent).
As with FPs (Figure 27), the most often mention across the provider types of difficulty recruiting
is for PCPs, with specialist physician difficult for general internists listed much more often than
for FPs. Note that the difficulty of recruiting NPs and RNs across Rural areas was mentioned
more often than for PAs (e.g., All Rural, 22.4 percent; and 20.8 percent versus 10.9 percent).

41
The pattern of recruitment difficulty responses of the general pediatricians varied from those of
the other two PCP specialties, though not as it has to do with Rural difficulty being mentioned
more often than Urban difficulty, with the exception of RNs (Figure 29). General pediatricians
generally perceived the difficulty of recruiting all provider types as less often difficult than FPs
and general internists (Figures 27 and 28). All Rural general pediatricians reported PCPs
recruitment difficulty much more often than did their Urban colleagues (all Rural, 34.6 percent
versus Urban, 17.5 percent). Across the other four provider types, Rural general pediatricians
indicated greater difficulty than their Urban counterparts with the exception of RNs (Urban RNs,
19.8 percent versus All Rural, 16.0 percent).

42
Medical school and residency-training location and experience influences what and where
trainees eventually practice. Survey questions 11 and 12 asked respondents to indicate in which
training capacities they were involved. Question 12’s inquiry regarding belonging to a faculty
practice plan was included with the other categories because it is an indication of the physicians
being linked to the formal education system. The percentages of FP involvement for all the
geographic categories were highest for the precept or supervise medical students or resident
category (Urban, 74.9 percent; Large Rural, 74.2 percent; Small Rural and Isolated Small Rural,
83.7 percent; and All Rural, 79.7 percent) (Figure 30). For the medical school faculty
appointment and residency program faculty appointment categories, Urban FPs had more
involvement than their Rural counterparts. Few of the FPs indicated that they belonged to
faculty practice plans and there was little variation by location groups.
43
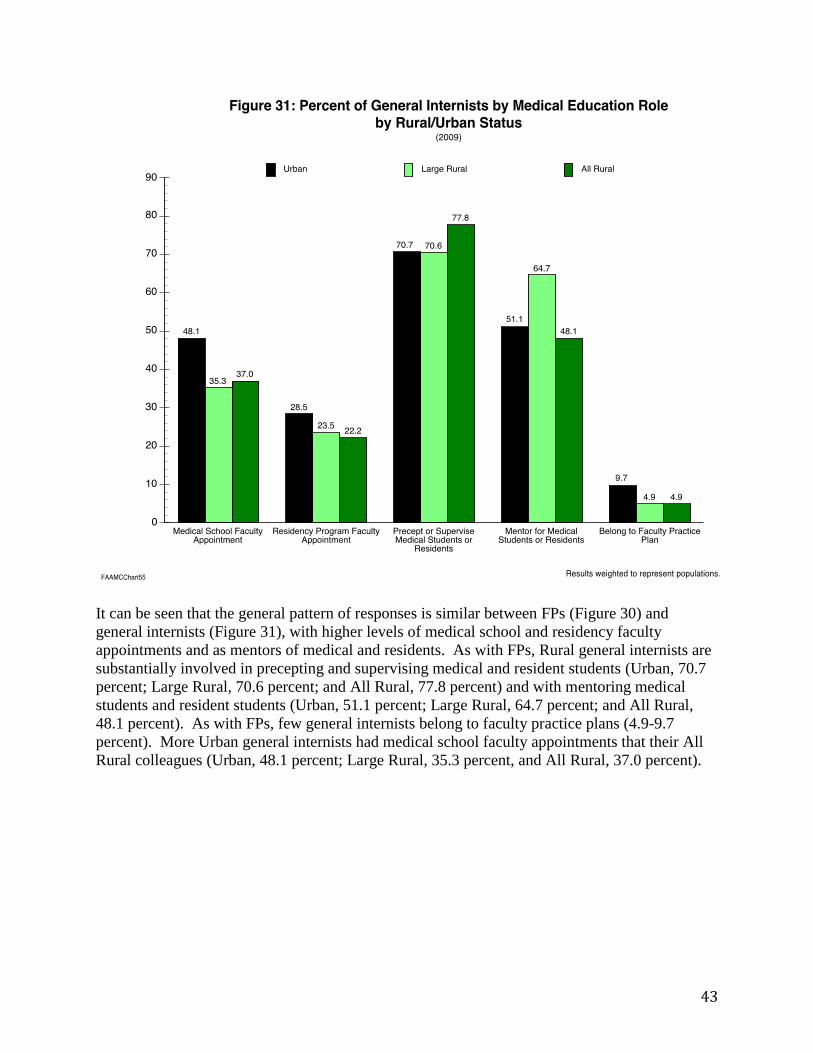
It can be seen that the general pattern of responses is similar between FPs (Figure 30) and
general internists (Figure 31), with higher levels of medical school and residency faculty
appointments and as mentors of medical and residents. As with FPs, Rural general internists are
substantially involved in precepting and supervising medical and resident students (Urban, 70.7
percent; Large Rural, 70.6 percent; and All Rural, 77.8 percent) and with mentoring medical
students and resident students (Urban, 51.1 percent; Large Rural, 64.7 percent; and All Rural,
48.1 percent). As with FPs, few general internists belong to faculty practice plans (4.9-9.7
percent). More Urban general internists had medical school faculty appointments that their All
Rural colleagues (Urban, 48.1 percent; Large Rural, 35.3 percent, and All Rural, 37.0 percent).

44
The pattern of medical education role responses for general pediatricians is somewhat different
than for FPs and general internists. As shown in Figure 32, Rural pediatricians reported being
substantially less involved in all the question categories except for the medical school faculty
appointment (Urban, 38.9 percent; All Rural, 40.0 percent) and the precept of supervise medical
and resident student category (Urban, 76.0 percent; All Rural, 62.5 percent). Comparatively few
general pediatricians had residency program faculty appointments and belonged to faculty
practice plans.

45
The surveyed PCPs were asked whether in their principal practice site they used electronic health
records (either fully or partially) (survey question 24) (Figure 33). For the All Rural category,
there is little difference between the percentages reported by the three PCP specialties (54.8
percent, 57.7 percent, and 59.4 percent). Examination of the responses for the Urban category
across the three PCP specialties shows that FPs and general internists responded yes at nearly the
same rate (61.8 percent versus 61.4 percent), while general pediatricians responded yes
somewhat less often at 54.2 percent. There is not an apparent pattern with regards to Rural and
Urban being higher or lower.

46
Physician Practice Activity and Characteristics
Questionnaire Questions:
Q2a, Q13-Q15, Q17-18, Q29, Q30, and Q33.

47
Figure 34 shows the mean weekly patient PCP hours excluding on-call hours by specialty and
Rural/Urban status. Rural physicians spend more time performing care per on-call hours than do
Urban physicians. Note that to be included in the study one of the criteria was that the PCP spent
20 or more hours per week active in medicine (and have 20 or more patient visits/encounters).
General pediatricians reported fewer mean working hours than FPs and general internists (Urban:
36.1 percent versus 40.2 and 41.9 percent; All Rural: 39.6 percent versus 42.5 percent and 44.6
percent). Overall general internists had a higher mean for hours than FPs across all geographic
categories, though the differences were not large and do not include on-call hours.

48
An important Affordable Care Act related question that was asked the PCPs was how their
workload capacity is in respect to their patient panel (Figures 35, 36, and 37). A patient panel is
the total number of individual patients a physician cares for (as opposed to how many visits they
perform). As can be seen from the three graphs, a considerable percentage of each specialty and
Rural/Urban status category combination are both above and below the workload middle
category (i.e., “My Panel Size is About Right”). For FPs (Figure 35), approximately 30 percent
responded that their panel was too large, about 35 percent responded that it was about right, and
about 30 percent reported that they were looking to increase their panel size. Slightly over a
third (34.3 percent) of the Urban FPs reported that they had too large a panel (combination of
“Panel Larger Than Want But Accepting New Patients” and “Panel Closed to New Patients”).
This percentage is only rivaled by 33.9 percent for All Rural general internists (Figure 36). The
three types of responses for FPs are pretty balanced across geographic categories.

49
The observations regarding FPs are similar for general internists (Figure 36). There is a balance
in general internist responses above and below the “My Panel Size is About Right” category
across the geographic categories. As with the FPs, Rural and Urban differences are not
substantial. Rural general internists were more apt to report that their practices were closed to
new patients than did Urban general internists (Large Rural, 16.3 percent; and All Rural, 15.4
percent versus Urban, 10.7 percent). The plurality of all general internist responses across the
three geographic categories was that their panel size was about right.
50
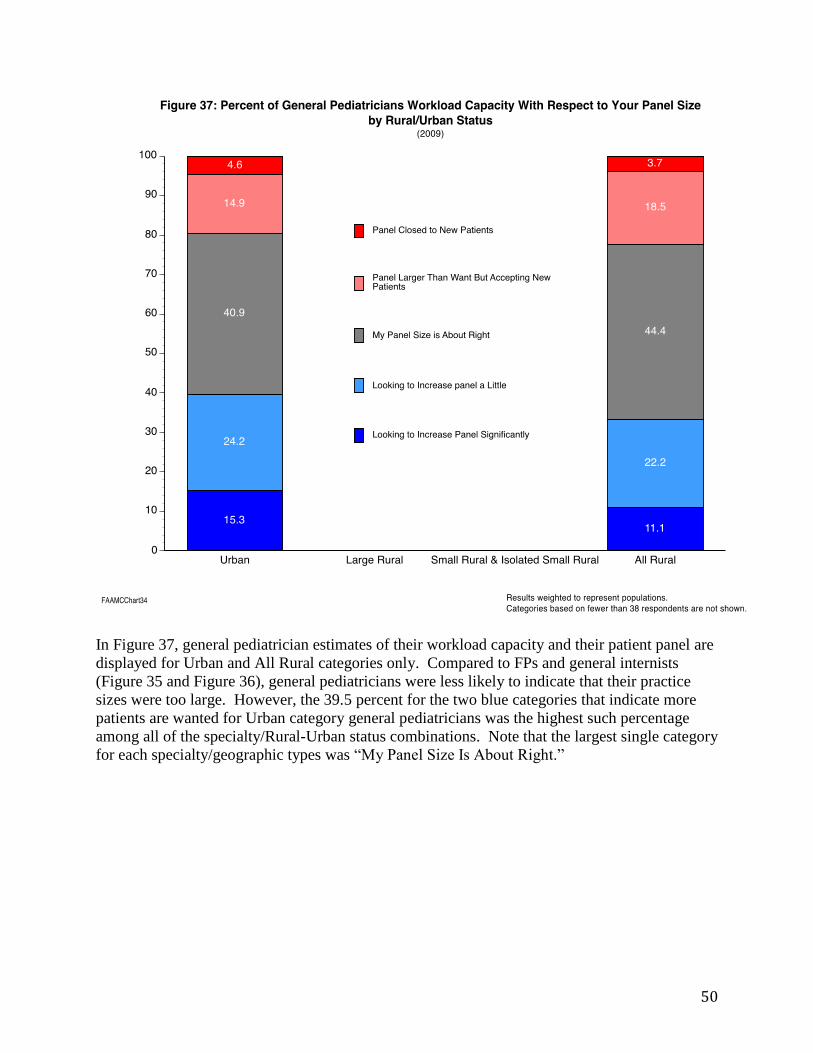
In Figure 37, general pediatrician estimates of their workload capacity and their patient panel are
displayed for Urban and All Rural categories only. Compared to FPs and general internists
(Figure 35 and Figure 36), general pediatricians were less likely to indicate that their practice
sizes were too large. However, the 39.5 percent for the two blue categories that indicate more
patients are wanted for Urban category general pediatricians was the highest such percentage
among all of the specialty/Rural-Urban status combinations. Note that the largest single category
for each specialty/geographic types was “My Panel Size Is About Right.”

51
Mean weekly patient visits/encounters were reported by the survey respondents (and weighted to
represent their populations) (Figure 38). Note that one of the selection criteria for including the
PCPs in the analyses is that they had 20 or more patient visits/encounters. General pediatricians
averaged the most visits in both Rural and Urban practices (All Rural, 115.4 visits). Between the
FPs and general internists, the FPs reported more visits (and thus the general internists reported
the smallest averages of patient visits). Though not large, Urban category PCPs by specialty
averaged fewer patient visits than their All Rural counterparts. For the FPs, the highest mean
number of visits was for the Large Rural category physicians (100.1)
52
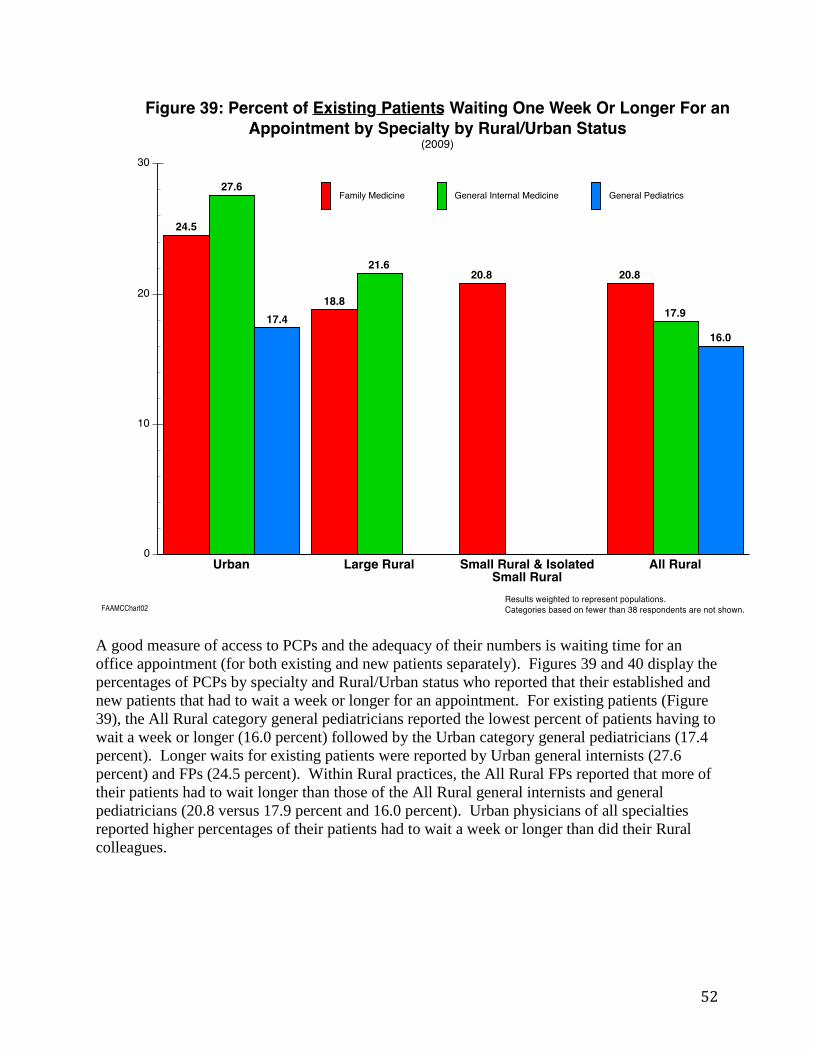
A good measure of access to PCPs and the adequacy of their numbers is waiting time for an
office appointment (for both existing and new patients separately). Figures 39 and 40 display the
percentages of PCPs by specialty and Rural/Urban status who reported that their established and
new patients that had to wait a week or longer for an appointment. For existing patients (Figure
39), the All Rural category general pediatricians reported the lowest percent of patients having to
wait a week or longer (16.0 percent) followed by the Urban category general pediatricians (17.4
percent). Longer waits for existing patients were reported by Urban general internists (27.6
percent) and FPs (24.5 percent). Within Rural practices, the All Rural FPs reported that more of
their patients had to wait longer than those of the All Rural general internists and general
pediatricians (20.8 versus 17.9 percent and 16.0 percent). Urban physicians of all specialties
reported higher percentages of their patients had to wait a week or longer than did their Rural
colleagues.

53
For new patients (Figure 40), more of the PCPs reported waits of a week or longer than they did
for existing patients (Figure 39). For instance, the comparable figures for Urban group general
internists for existing versus new patients is large (27.6 percent versus 44.5 percent) and for
Large Rural (21.6 percent versus 67.7 percent). As can be seen, as reported by physicians the
highest percentages of 1-week waiting times or longer were for Rural general internists.

54
Because the 2009 survey took place during the height of a national recession, PCPs were asked
to indicate whether or not they observed each of seven changes in their practices that they
perceived to be related to the recession. About 30 percent of Rural and Urban FPs indicated they
observed patients delaying preventive/ongoing care (Urban, 30.9 percent; All Rural, 29.0
percent). This was the most frequent of the seven responses that were reported and attributed.
The Urban group of FPs reported about the same or a little more recession-related changes as the
Rural FPs except for the “seeking care out of fear of losing insurance” and ‘increase in new
patients” categories. In both these cases the Urban FPs reported observing the recession changes
more (25.2 percent versus 18.6 percent; and 13.1 percent versus 8.2 percent). As can be seen,
Rural and Urban FPs reported 10-25 percent of all the recession related options, with little
difference between the Urban category FPs and the Rural category FPs.

55
Just like for FPs, general internists indicated they observed more recession-related changes in the
“delaying preventive/ongoing care” category (All Rural, 33.8 percent; and Urban, 29.5 percent).
Urban general internists, as is true for FPs, reported recession changes more than their Rural
colleagues for “seeking care out of fear of losing insurance” category. The Rural general
internists reported more “increases in charity care provided” than did Urban general internists.
Near 20 percent of Rural and Urban FPs and general internists reported a reduction in practice
income.

56
Overall general pediatricians reported markedly fewer recession-related attributed changes than
did the FPs and general internists. For six of the seven categories, Urban general pediatricians
noted more recession-related changes than their All Rural counterparts. The exception was for
the “Increase in new patients” category where Rural general pediatricians were more than twice
as likely to indicate that they had noticed an increase related to the recession (All Rural, 11.5
percent versus Urban, 4.5 percent). The differences between the responses of Urban and Rural
general pediatricians on the various observed behaviors are more dramatic than for FPs and
general internists. The differences that stand out the most are for the reduction in patient visit
frequency (Urban, 16.4 percent versus All Rural, 7.7 percent), delaying preventive/ongoing care
(Urban, 18.9 percent versus All Rural, 11.5 percent), and seeking care out of fear of losing
insurance (Urban, 14.0 percent versus All Rural, 7.7 percent).
57
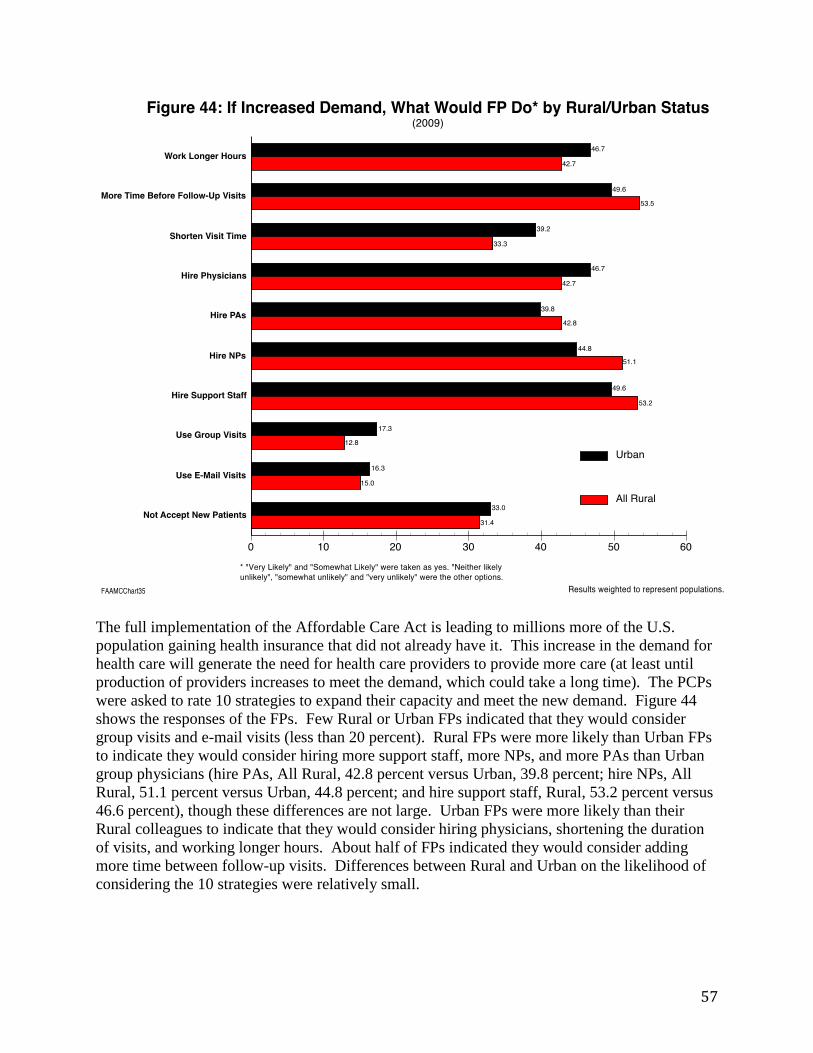
The full implementation of the Affordable Care Act is leading to millions more of the U.S.
population gaining health insurance that did not already have it. This increase in the demand for
health care will generate the need for health care providers to provide more care (at least until
production of providers increases to meet the demand, which could take a long time). The PCPs
were asked to rate 10 strategies to expand their capacity and meet the new demand. Figure 44
shows the responses of the FPs. Few Rural or Urban FPs indicated that they would consider
group visits and e-mail visits (less than 20 percent). Rural FPs were more likely than Urban FPs
to indicate they would consider hiring more support staff, more NPs, and more PAs than Urban
group physicians (hire PAs, All Rural, 42.8 percent versus Urban, 39.8 percent; hire NPs, All
Rural, 51.1 percent versus Urban, 44.8 percent; and hire support staff, Rural, 53.2 percent versus
46.6 percent), though these differences are not large. Urban FPs were more likely than their
Rural colleagues to indicate that they would consider hiring physicians, shortening the duration
of visits, and working longer hours. About half of FPs indicated they would consider adding
more time between follow-up visits. Differences between Rural and Urban on the likelihood of
considering the 10 strategies were relatively small.

58
General internists were asked to rate 10 strategies to consider to expand their capacity and meet
the new demand. Figure 45 shows the responses of the general internists. Few Rural or Urban
general internists indicated that they would consider group visits and e-mail visits. Rural general
internists were more likely than Urban general internists to indicate they would consider hiring
more NPs and PAs (NPs, Rural, 51.7 percent versus Urban 39.7 percent; PAs, 40.0 percent
versus 35.7 percent). Urban general internists were more likely to indicate they would consider
hiring more support staff (Urban, 46.9 percent versus All Rural, 38.3 percent) but less likely to
consider increasing the time before follow-up visits (Urban, 44.2 percent versus All Rural, 55.0
percent). About 35-45 percent of both Rural and Urban general internists indicated they would
consider the remaining strategies to meet demand, with relatively small differences between
Rural and Urban.

59
General pediatricians were asked to rate 10 strategies to consider to expand their capacity and to
meet the new Affordable Care Act demands. Figure 46 shows the responses of the general
pediatricians. Few Rural or Urban general pediatricians indicated that they would consider
group visits and e-mail visits. The Urban general pediatricians indicated they would consider not
accepting new patients more often than their All Rural counterparts (22.8 percent versus 16.0
percent). All Rural general pediatricians were much more likely than Urban general
pediatricians to indicate they would consider hiring more NPs (54.5 percent versus 37.6 percent),
more PAs (47.8 percent versus 23.3 percent), and more physicians (53.9 percent versus 47.4
percent). Over half of both All Rural and Urban general pediatricians indicate they would
consider hiring more staff. About 35-45 percent of both All Rural and Urban general
pediatricians indicated they would consider the remaining strategies to meet demand, with little
differences between All Rural and Urban respondents.

60
Figure 47 illustrates the FP’s responses to a 10-part question wherein they were asked which
actions they would consider to have the most potential to expand capacity to meet future
increased demand without decreasing quality of care. Three of the activities/policies clearly
were selected most often by the FPs: paying more for primary care services, reducing
paperwork/administration insurance, and paying for more care coordination and management. In
all three cases, Urban FPs and Rural FPs indicated they would consider them at nearly the same
rate (e.g., for paying more for PC services; Urban general internists, 80.5 percent versus All
Rural FPs, 79.7 percent). In fact, there were only small All Rural and Urban differences across
the 10 activities/policies. Neither Rural nor Urban FPs responded that there was a lot of
potential to expand capacity by increasing non-physician clinical supply, increasing non-
physician scope of practice, or expanding retail clinics in malls and other public locations. For
the remaining four strategies, about a third of All Rural and Urban category FPs thought there
was potential to expand capacity.

61
Figure 48 shows the general internist’s responses to a 10-part question wherein they were asked
which actions would you consider to have the most potential to expand capacity to meet future
increased demand without decreasing quality of care. As with FPs, three of the activities/policies
clearly were selected most often by the general internists: paying more for primary care services,
reducing paperwork/administration insurance, and paying for more care coordination and
management. In all three cases, Rural general internists were more apt to select these categories
as having strong potential than their Urban counterparts. In fact, there were not Large Rural and
Urban differences across many of the 10 activities/policies. Neither All Rural nor Urban general
internists responded that there was great potential to expand capacity by increasing non-
physician clinical supply, increasing non-physician scope of practice, or expanding retail clinics
in malls and other public locations. For the remaining four strategies, about 40 percent of All
Rural and Urban general internists thought there was potential to expand capacity, with All Rural
general internists indicating they have more potential than their Urban colleagues.

62
Figure 49 shows the general pediatrician’s responses to a 10-part question wherein they were
asked which actions would you consider to have the most potential to expand capacity to meet
future increased demand without decreasing quality of care. As with FPs and general internists,
three of the activities/policies clearly were selected most often by the general pediatricians:
paying more for primary care services, reducing paperwork/administration insurance, and paying
for more care coordination and management. In all three cases, Urban general pediatricians were
more likely to select these categories as having strong potential than their All Rural colleagues,
especially for the paying more for primary care services. In fact, there were not notable Rural
and Urban differences across many of the 10 activities/policies. Similar to FPs and general
internists, neither Rural nor Urban general pediatricians responded that there was much potential
to expand capacity by increasing non-physician clinical supply, increasing non-physician scope
of practice, or expanding retail clinics in malls and other public locations. For the remaining
four strategies, about 35-40 percent of Rural and Urban general pediatricians thought there was
potential to expand capacity, with no large differences in their propensities to do so.

63
Figure 50 illustrates the three PCP specialties by their Rural/Urban status regarding professional
board certification. The variation in board certification between the various groups is not large.
All the general internists responding from Large Rural areas were board certified. The lowest
percentages of board certified providers were for all the FP groups: Urban, 88.5 percent; Large
Rural, 88.2 percent; Small Rural and Isolated Small Rural, 90.0 percent; and All Rural, 88.8
percent. However, variations between Rural and Urban and between specialties were not large.
64
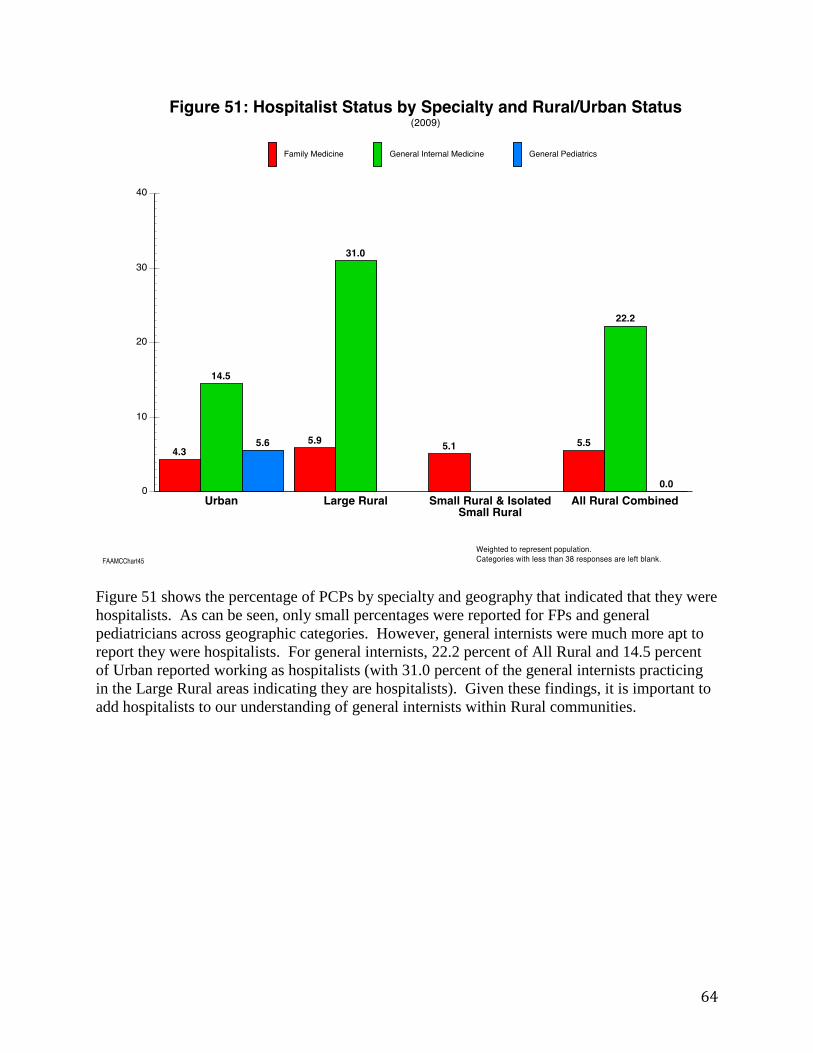
Figure 51 shows the percentage of PCPs by specialty and geography that indicated that they were
hospitalists. As can be seen, only small percentages were reported for FPs and general
pediatricians across geographic categories. However, general internists were much more apt to
report they were hospitalists. For general internists, 22.2 percent of All Rural and 14.5 percent
of Urban reported working as hospitalists (with 31.0 percent of the general internists practicing
in the Large Rural areas indicating they are hospitalists). Given these findings, it is important to
add hospitalists to our understanding of general internists within Rural communities.

65
Patient Centered Medical Home
Questionnaire Questions:
Q19a – Q23

66
The surveyed PCPs were asked about whether they were familiar with the patient centered
medical home (PCMH) before the administration of the survey. As can be seen from Figure 52,
the three PCP specialty groups, when aggregated to Urban and All Rural, responded similarly
across specialties and Rural/Urban status (70-82 percent). The highest knowledge for PCMH
was for the Large Rural category FPs and general internist groups. The physician group least
familiar with PCMHs was the Urban general internists.

67
In Figure 53, the FPs responded to their status per their principal practice in terms of its PCMH
recognition level. As can be seen, the highest percentages of the three geographic groups all
expressed interest in the PCMH but they indicated that they needed to know more, with the more
Rural practice FPs expressing the most interest but needing to know more (Large Rural, 44.8
percent; Small Rural and Isolated Small Rural, 55.8 percent). Very few respondents indicated
the National Committee for Quality Assurance (NCQA) currently recognized them as PCMH. A
quarter of the Urban FPs indicated that they were not interested in PCMH and this was also
indicated a little less often by the Rural FPs (Urban, 25.4 percent; Large Rural, 17.9 percent; and
Small Rural and Isolated Small Rural, 23.4 percent).

68
Aggregating the survey responses into Urban and All Rural for FPs is shown in Figure 54. This
graph shows Figure 53 in less geographic detail. This Figure is added to make it parallel with
Figures 55 and 56 for comparisons. In Figure 54, the FPs responded to their status per their
principal practice in terms of its PCMH recognition level. As can be seen, the highest
percentages for the two geographic groups all expressed interest in the PCMH but they indicated
that they needed to know more, with the Rural practice FPs expressing the most interest (All
Rural, 50.7 percent versus 39.6 percent). Very few Rural and Urban respondents indicated that
they were currently recognized as PCMH by NCQA (All Rural, 4.2 percent versus Urban 2.5
percent). A quarter of the Urban category FPs indicated that they were not interested in PCMH
and this was also indicated a little less often by the All Rural FPs (Urban, 25.4 percent versus All
Rural, 21.5 percent).
69
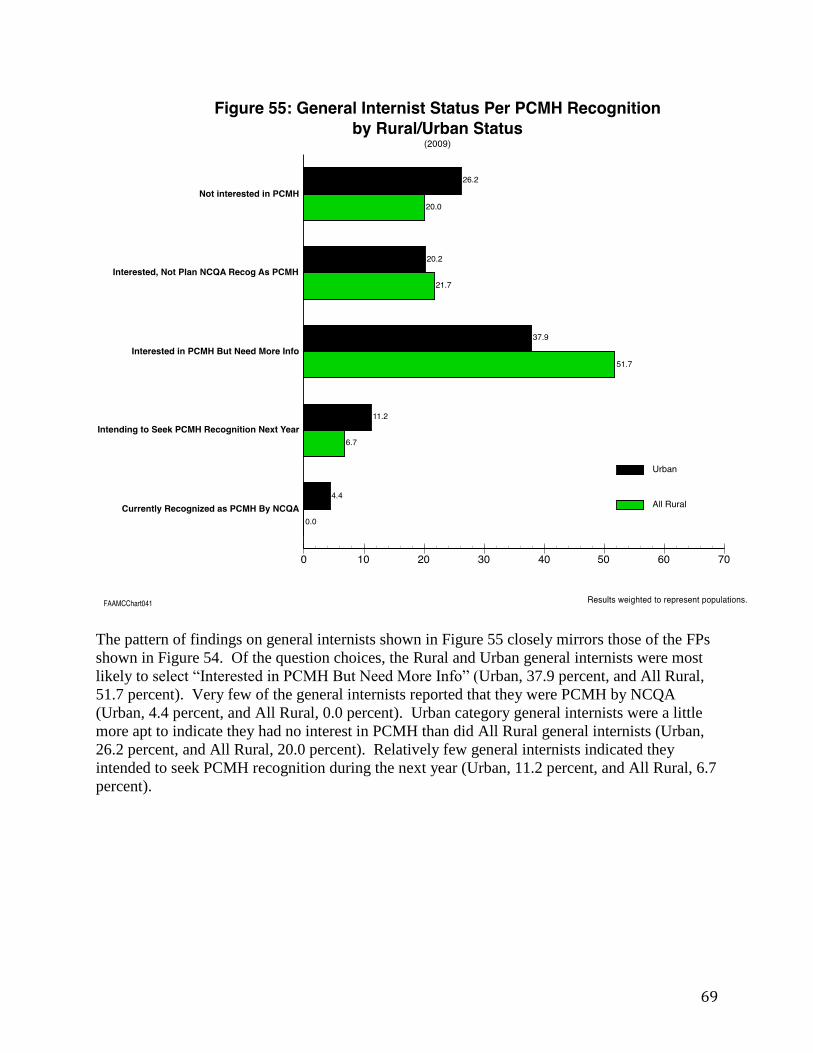
The pattern of findings on general internists shown in Figure 55 closely mirrors those of the FPs
shown in Figure 54. Of the question choices, the Rural and Urban general internists were most
likely to select “Interested in PCMH But Need More Info” (Urban, 37.9 percent, and All Rural,
51.7 percent). Very few of the general internists reported that they were PCMH by NCQA
(Urban, 4.4 percent, and All Rural, 0.0 percent). Urban category general internists were a little
more apt to indicate they had no interest in PCMH than did All Rural general internists (Urban,
26.2 percent, and All Rural, 20.0 percent). Relatively few general internists indicated they
intended to seek PCMH recognition during the next year (Urban, 11.2 percent, and All Rural, 6.7
percent).

70
The findings related to PCMH recognition for general pediatricians are depicted in Figure 56.
The general pediatrician pattern of responses mirrors that of FPs and general internists, with the
exception that fewer Rural pediatricians were not interested (general pediatricians: Urban, 19.6
percent, and All Rural, 9.1 percent). The plurality of general pediatricians indicated that they
were interested in PCMH but needed more information, with All Rural general pediatricians
indicating so more often than Urban category general pediatricians (All Rural, 50.0 percent,
Urban, 41.3 percent). Although the percentages are low, more general internists reported that
they were PCMH by NCQA than did FPs and general internists (i.e., about twice as likely).

71
As the title to Figure 57 indicates, the PCPs were asked about the activities of the physician
and/or a practice team across eight activities for their chronically ill patients. Physicians could
mark all the activities that applied. Three of the activities stand out as being the most often
participated in by the PCPs: 1) review medicine lists for appropriateness, provide post-hospital
discharge follow-up, and coordinate referrals to medical and support services. For all three,
there was little difference between Rural and Urban physician responses (review medicines:
Urban, 82.4 percent versus All Rural, 85.0 percent; coordinate referrals: Urban, 79.1 percent
versus All Rural, 80.0 percent; and post-hospital follow-up: Urban, 77.6 percent versus All
Rural, 81.2 percent). Only about five percent of the weighted respondents indicated that they did
not participate in any of the activities. For the other five activities, about 30 percent of the PCP
respondents indicated participation, with Rural PCPs responding positively about five percent
points less often than their Urban counterparts. Figures 58, 59, and 60 show the more specific
results for each of the three PCP specialties.

72
FPs were asked about the activities of the physician and/or practice team across eight activities
for their chronically ill patients. The FP responses for the eight activities for Urban and All
Rural respondents are shown in Figure 58. The FP responses closely reflect those for all PCPs
that are described under Figure 57. Few FPs reported not participating in any of the eight
activities (Urban, 6.7 percent and All Rural, 5.5 percent). Nearly 90 percent of the Rural FPs
reported that they and/or their practice team coordinate referrals for medical and support
services, with Urban FPs only a little lower. Large percentages of the FPs also reported elevated
activity with regards to reviewing medicine lists and post-hospital discharge follow-up. In both
these cases, All Rural FPs were slightly higher than Urban FP responses (elevated activity with
regards to reviewing medicine lists: Urban, 84.0 percent and All Rural, 85.5 percent; and post-
hospital discharge follow-up: Urban, 75.9 percent and All Rural, 80.0 percent).

73
General internists were asked about the activities of the physician and/or practice team across
eight activities for their chronically ill patients (Figure 59). The general internist responses
closely parallel those for all PCPs that are described under Figure 57. Few general internists
reported not participating in any of the eight activities (Urban, 4.0 percent and All Rural, 3.2
percent). Nearly 90 percent of the Rural and Urban general internists reported that they and/or
their practice team review medicine lists for appropriateness (All Rural, 88.7 percent and Urban,
88.4 percent). For the remaining quality activities, the Urban general internists were about 4
percent to 9 percent more likely to report performing the listed activities.

74
General pediatricians were asked about the activities of the physician and/or a practice team
across eight activities for their chronically ill patients (see Figure 60). The general pediatricians’
responses closely mirror those for all PCPs that are described below Figure 57. Few general
pediatricians reported not participating in any of the eight activities (Urban, 5.3 percent and All
Rural, 3.8 percent). Far fewer Rural general pediatricians indicated that they provide a
documented (and agreed upon) treatment plan to the patient/family than their Urban counterparts
(Urban, 44.1 percent versus All Rural, 26.9 percent). As with FPs and general internists, general
pediatricians were most likely to indicate that they coordinate referrals(Urban, 84.3 percent and
All Rural, 88.9 percent), provide post-hospitalizations follow-up (Urban, 78.7 percent and All
Rural, 81.5 percent), and review medicine lists (Urban, 68.8 percent and All Rural, 74.1 percent).

75
Survey question 21 asked PCPs to indicate which of three team-based care attributes can be
found in their practices (mark all that apply), with an additional category to indicate that none of
the three are performed. The responses are aggregated for all the PCPs and broken out by Rural
and Urban as shown in Figure 61. Less than 35 percent of the PCP Rural and Urban respondents
(weighted) indicated that they performed each of the listed three activities of care individually.
Few Rural and Urban PCPs indicated they had regular meetings of the practice team to
coordinate care for an identified group of patients (15.4 percent All Rural and 16.9 percent for
the Urban group). About a third of Rural and Urban PCPs indicated they had: an identified
practice team that includes physician(s) and other staff, and a practice team that shares
responsibility for care delivered. Finally, over half of the PCPs reported that they were not
involved in any of the activities (Urban, 52.1 percent and All Rural, 56.1 percent).

76
In survey question 21, FPs were asked to indicate which of three team-based care attributes can
be found in their practices, with an additional category to indicate that none of the three are done
(Figure 62). Over 45.0 of the Rural and Urban category FP respondents indicated that they did
none of the listed three team-based activities (Urban, 50.3 percent; Large Rural, 47.0 percent;
Small Rural and Isolated Small Rural, 65.8 percent; and All Rural, 57.0 percent). Few Rural and
Urban FPs indicated they had regular meetings of the practice team to coordinate care for an
identified group of patients (Urban, 19.1 percent; Large Rural, 21.2 percent; Small Rural and
Isolated Small Rural, 8.0 percent; and All Rural, 14.8 percent). With one exception, about a
third of Rural and Urban FPs indicated they had: an identified practice team that includes
physician(s) and other staff, and a practice team that shares responsibility for care delivered, with
little Rural/Urban location differences. The exception is that Small Rural and Isolated Small
Rural FPs responded that their practices were less apt to perform the attributes of team-based
care.
77
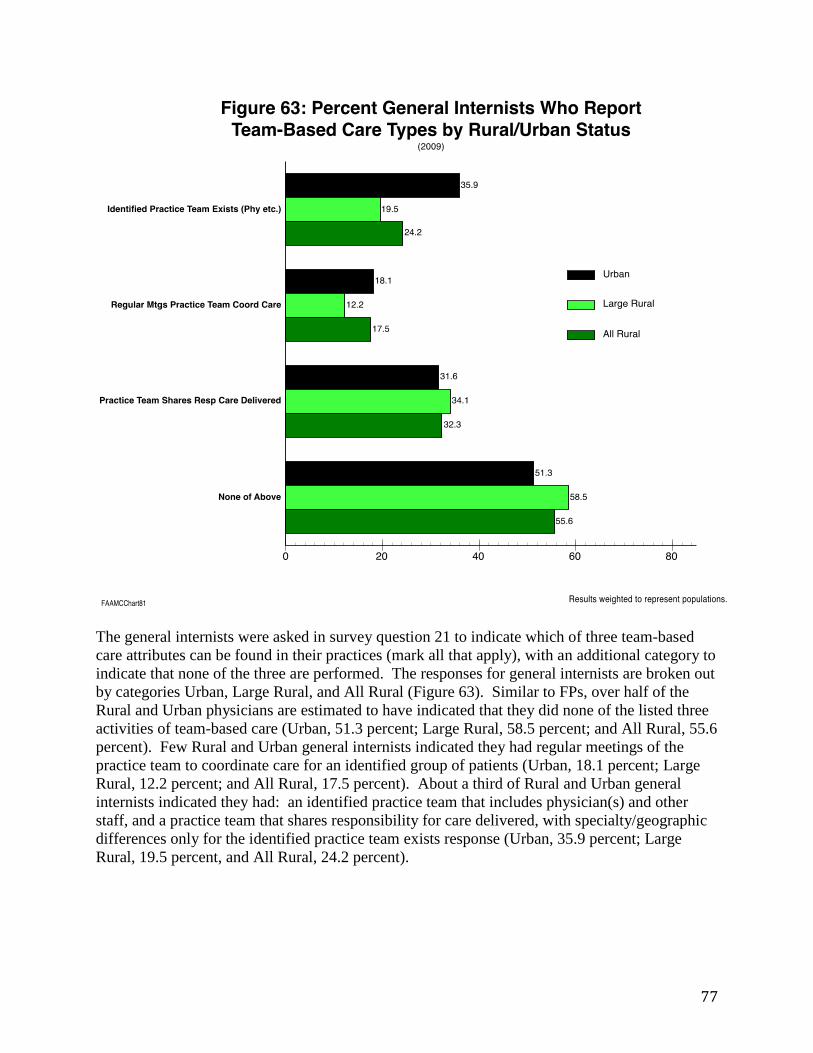
The general internists were asked in survey question 21 to indicate which of three team-based
care attributes can be found in their practices (mark all that apply), with an additional category to
indicate that none of the three are performed. The responses for general internists are broken out
by categories Urban, Large Rural, and All Rural (Figure 63). Similar to FPs, over half of the
Rural and Urban physicians are estimated to have indicated that they did none of the listed three
activities of team-based care (Urban, 51.3 percent; Large Rural, 58.5 percent; and All Rural, 55.6
percent). Few Rural and Urban general internists indicated they had regular meetings of the
practice team to coordinate care for an identified group of patients (Urban, 18.1 percent; Large
Rural, 12.2 percent; and All Rural, 17.5 percent). About a third of Rural and Urban general
internists indicated they had: an identified practice team that includes physician(s) and other
staff, and a practice team that shares responsibility for care delivered, with specialty/geographic
differences only for the identified practice team exists response (Urban, 35.9 percent; Large
Rural, 19.5 percent, and All Rural, 24.2 percent).
78
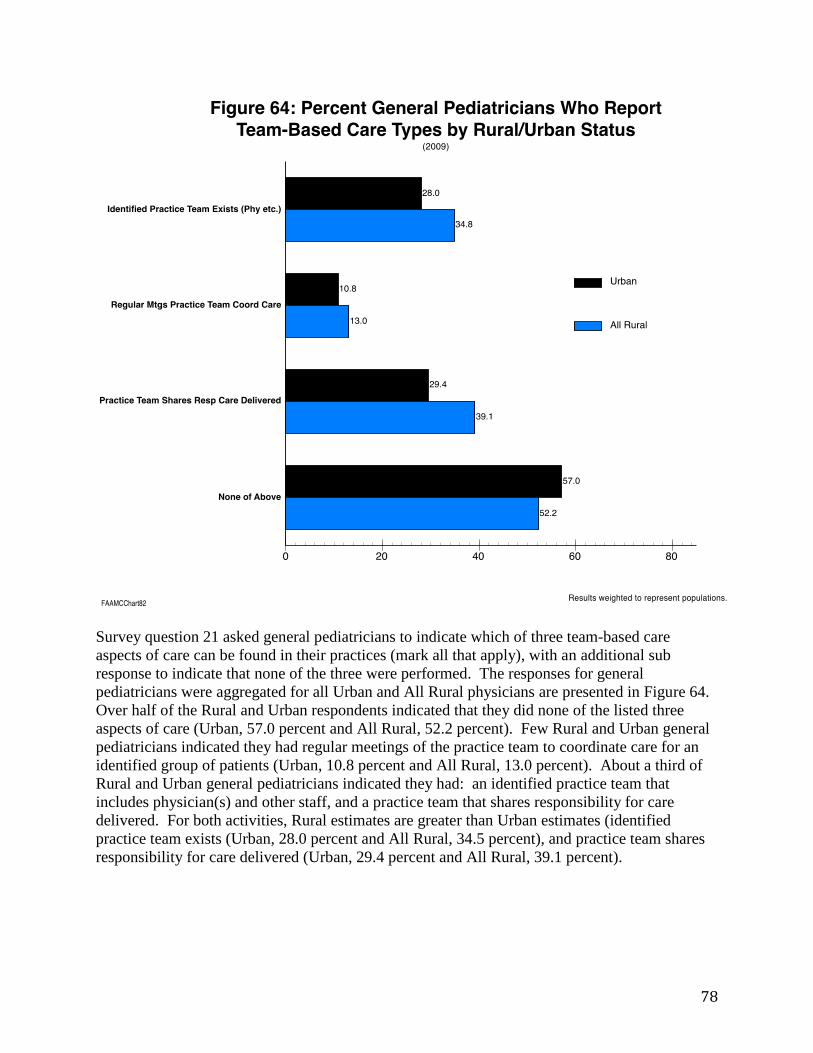
Survey question 21 asked general pediatricians to indicate which of three team-based care
aspects of care can be found in their practices (mark all that apply), with an additional sub
response to indicate that none of the three were performed. The responses for general
pediatricians were aggregated for all Urban and All Rural physicians are presented in Figure 64.
Over half of the Rural and Urban respondents indicated that they did none of the listed three
aspects of care (Urban, 57.0 percent and All Rural, 52.2 percent). Few Rural and Urban general
pediatricians indicated they had regular meetings of the practice team to coordinate care for an
identified group of patients (Urban, 10.8 percent and All Rural, 13.0 percent). About a third of
Rural and Urban general pediatricians indicated they had: an identified practice team that
includes physician(s) and other staff, and a practice team that shares responsibility for care
delivered. For both activities, Rural estimates are greater than Urban estimates (identified
practice team exists (Urban, 28.0 percent and All Rural, 34.5 percent), and practice team shares
responsibility for care delivered (Urban, 29.4 percent and All Rural, 39.1 percent).

79
The PCP physicians were asked whether they use clinical performance measures for local quality
improvement within their practices (Figure 65) (this is the percentage of only those who
indicated “yes” in survey question 22 that their principal practice site does use clinical
performance measures for local quality improvement efforts). The percentage of the three
specialties that indicated they used clinical performance measures for local quality improvement
are: FPs, 49.9 percent; general internists, 51.7 percent; and general pediatricians, 37.0 percent.
The corresponding percentages of physicians who indicated that they were not sure are: 17.3,
18.1, and 26.0 percent. Urban physicians were more prone to respond that they did not know
than Rural physicians.
General pediatricians responded that they were less likely to use performance measures than FPs
and general internists (general pediatricians (Urban, 37 percent and All Rural, 33.3 percent
versus FPs/general internists who had a range of responses from 52.2 percent through 39.5
percent across all their geographic/specialty categories)). The Urban FPs and general internists
were most apt to use clinical performance measures in their practices (FPs, 51.5 percent; and
general internists, 52.2 percent). Overall, Rural results were lower than for Urban category FPs
and general internists by seven percentage points and four percentage points.

80
FPs were asked about which of three-listed performance measures were used in their practices
(this is the percentage of only those who indicated “yes” in survey question 22 that their
principal practice site does use clinical performance measures for local quality improvement
efforts – see results in Figure 65). For each of the three types of clinical performance measure
use types, the Urban FPs reported more use than Rural FPs (Figure 66). The most reported
activity for Rural and Urban FPs was the “make changes to practice based on results of
performance measurement” category (Urban, 84.6 percent; and All Rural, 77.8 percent). Over
half of both Rural and Urban FPs reported routinely discussing measures with the practice team
(Urban, 61.3 percent; and All Rural, 57.1 percent). Only about a third (32.7 percent) of the
Urban FPs used measure feedback to reward staff, with All Rural FPs reporting that they only
did so 19.0 percent of the time.

81
General internists were asked about which of three-listed performance measures were used in
their practices (this is the percentage of only those who indicated “yes” in Q22 that their
principal practice site does use clinical performance measures for local quality improvement
efforts – see results in Figure 65). For each of the three types of clinical performance measure
use types, the Urban category general internists reported more use than All Rural general
internists (Figure 67). The most reported activity for general internists was the “make changes to
practice based on results of performance measurement” category (Urban, 74.2 percent). Half or
more of Rural and Urban general internists reported routinely discussing measures with the
practice team (Urban, 59.6 percent; and All Rural, 50.0 percent). Only a third (35.5 percent) of
the Urban general internists used measure feedback to reward staff, with Rural general internists
reporting that they only did so 23.3 percent of the time. The pattern for general internists is the
mirror image of the one for FPs except that the percentages are all higher for the FPs.
82
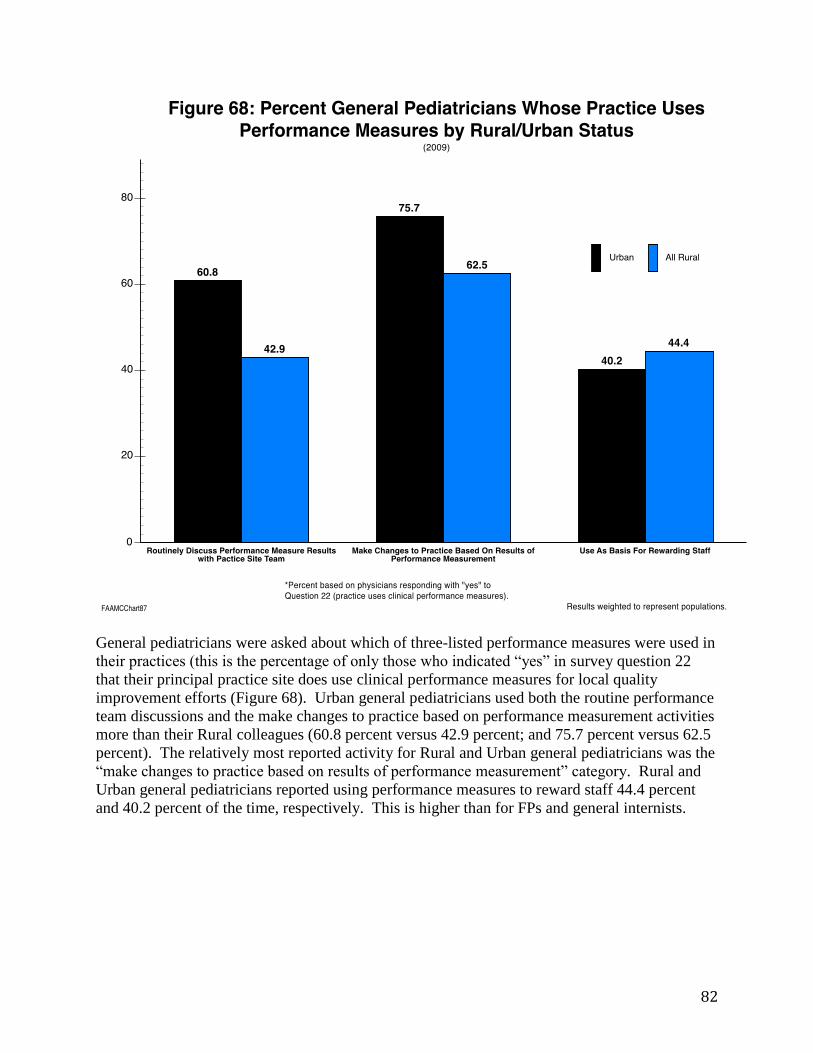
General pediatricians were asked about which of three-listed performance measures were used in
their practices (this is the percentage of only those who indicated “yes” in survey question 22
that their principal practice site does use clinical performance measures for local quality
improvement efforts (Figure 68). Urban general pediatricians used both the routine performance
team discussions and the make changes to practice based on performance measurement activities
more than their Rural colleagues (60.8 percent versus 42.9 percent; and 75.7 percent versus 62.5
percent). The relatively most reported activity for Rural and Urban general pediatricians was the
“make changes to practice based on results of performance measurement” category. Rural and
Urban general pediatricians reported using performance measures to reward staff 44.4 percent
and 40.2 percent of the time, respectively. This is higher than for FPs and general internists.

83
Ending Comments
The contents of AAMC’s 2009 Physician Survey on Primary Care covered a varied group of
topics. Many of the survey questions relate to aspects of the Affordable Care Act. The survey
was administered during the second half of 2009 not long before the Affordable Care Act was
passed by Congress and signed by President Obama (March 23, 2010). Respondents returned
their filled out questionnaires between July 2009 and March 2010. The purpose of this report is
to document and exhibit the survey’s PCP findings, with an emphasis on Rural estimates. The
physicians analyzed in this report are FPs, general internists, and general pediatricians who on,
average, work professionally 20 hours or more a week and who perform 20 or more weekly
patient visits/encounters.
The findings as presented here are basic and provide a baseline for PCPs just before the
Affordable Care Act began to be implemented. These data findings will then be available at a
later time to compare with future similar surveys. The emphasis above is on the primary care
specialties of family medicine, general internal medicine, and general pediatrics cross tabulated
by Urban, Large Rural, Small Rural and Isolated Small Rural geographic practice location
categories. The significant limitation of the respondent data is the relatively small numbers of
Rural respondents, especially for general internists and general pediatricians. These small
numbers are weighted to represent the populations of the three specialties. However, such
weighting may not compensate for systematic biases caused by unknown differences between
respondents and non-respondents. Of note is that the data results are virtually the same whether
the weights are employed or not.
Many of the differences shown in the tables and figures may be a function of interactions with
other factors that are available in the current database or not available. For instance, physicians
who report high numbers of professional hours are less likely to indicate that they would
consider working longer hours to meet increased demands for care that may occur as a result of
the Affordable Care Act.
A few of the more important or interesting findings are as follows:
1. General pediatricians and FPs are more satisfied with all survey satisfaction
questions than general internists.
2. Results indicate that Rural and Urban general pediatricians are more satisfied
with their choice of specialty than FPs and general internists. Rural FPs are also
more satisfied with their specialty choice than general internists.
3. Rural and Urban PCPs work with significant numbers of NPs and PAs, with the
exception of general pediatricians who work with fewer PAs.
4. Only about 15-20 percent of PCPs are compensated based on productivity
models.
5. The PCPs indicate they have the most difficulty PCPs when compared to
specialist physicians, NPs, PAs, and RNs. Rural and Urban general
pediatricians report more difficulty with recruiting RNs than do FPs and general
internists.
84
6. High percentages of Rural FPs (80 percent) and general internists (78 percent)
precept or supervise medical students and residents. General pediatricians are
less apt to report such roles (63 percent).
7. There is little reported difference between the PCP specialties by Rural/Urban
status regarding the use of electronic medical records (ranging from 53 percent
to 67 percent).
8. As many of the Rural and Urban FPs, general internists, and general
pediatricians that indicated their practices were not busy enough also indicated
their practices were too busy.
9. Rural general internists were much more likely to be practicing as hospitalists
than their Rural and Urban colleagues across the three study specialties.
10. Appointment waiting times for existing and new patient visits were lower for
Rural and Urban general pediatricians than for the other respondent groups.
11. Around 30 percent of Rural and Urban FPs and general internists reported that
they had observed during the recession that patients were delaying preventive
and ongoing care.
12. Rural FPs were more likely to indicate that they would deal with an increase in
demand for primary care by hiring physicians, NPs, PAs, and support staff than
did their Urban colleagues.
13. Rural FPs were less apt to indicate that they would deal with an increase in
demand for care by increasing their work hours than their Urban counterparts.
14. Rural general internists were much more likely to report that they work as
hospitalists than Urban general internists or Rural and Urban FPs and general
pediatricians.
15. About 20-30 percent of PCPs indicated that they are not familiar with the
PCMH.
16. Across PCP specialties and the Rural/Urban categories, PCP knowledge and
plans regarding PCMH were relatively low.
17. Across the PCMH questions, Rural PCPs were as likely as their Urban
colleagues to include PCMH activities in their practices.
There are other large differences and survey results that are not listed above that may be of
interest or felt to be important by others. The importance of some of the findings may not be
evident until these findings are compared to new surveys after the Affordable Care Act is
implemented. The above list is meant to be illustrative of some of the results, and is not intended
to be an encyclopedic account of all survey findings.