Intra Industry Trade and Product Quality: China and … of...
14
International Journal of Business and Economics, 2013, Vol. 12, No. 1, 59-72 Intra Industry Trade and Product Quality: China and Eight Developing Countries Mastooreh Eshraghi School of Graduate Studies, University Putra Malaysia, Malaysia Normaz Wana Ismail Faculty of Economics and Management, University Putra Malaysia, Malaysia 1. Introduction In the trade literature, product quality is mostly discussed in relation to the concept of intra-industry trade (IIT). IIT refers to the exporting and importing of products belonging to the same industry or the same types of goods and services, such as trade in automobiles, foodstuffs, computers, and minerals. IIT can be divided into two categories: horizontal intra-industry trade (HIIT) refers to different varieties of a specific product with similar quality and at the same stage of processing and vertical intra-industry trade (VIIT) is driven by differences in skill content or at different stages of processing. In VIIT, where goods are differentiated by quality, high quality goods require more high skilled labor as compared to low quality goods. Product quality is closely associated to vertical differentiation since Correspondence to: Department of Economics, Faculty of Economics and Management, University Putra Malaysia, Selangor, Malaysia. E-mail: [email protected]. Abstract This study aims to measure the export product quality improvement for trade between China and eight selected developing countries: Argentina, Brazil, Chile, Egypt, South Africa, Mexico, Turkey, and the Russian Federation based on disaggregated four-digit SITC data for the two periods 2000–2004 and 2004–2008. Vertical intra-industry trade high (VIITH) is considered as high quality products. The results revealed that the highest benefits of intra-industry trade with China are for South Africa in the first period and for Egypt in the second period. The highest positive growth of high quality products during the two periods is reported for Russia in the first period and for Brazil and Argentina in the second period. In conclusion, there is a massive potential for economic cooperation between China and these three partners. Key words: intra industry trade; product quality value; China JEL classification: F10; L15
Transcript of Intra Industry Trade and Product Quality: China and … of...

International Journal of Business and Economics, 2013, Vol. 12, No. 1, 59-72
Intra Industry Trade and Product Quality: China and Eight
Developing Countries
Mastooreh Eshraghi
School of Graduate Studies, University Putra Malaysia, Malaysia
Normaz Wana Ismail
Faculty of Economics and Management, University Putra Malaysia, Malaysia
1. Introduction
In the trade literature, product quality is mostly discussed in relation to the
concept of intra-industry trade (IIT). IIT refers to the exporting and importing of
products belonging to the same industry or the same types of goods and services,
such as trade in automobiles, foodstuffs, computers, and minerals. IIT can be
divided into two categories: horizontal intra-industry trade (HIIT) refers to different
varieties of a specific product with similar quality and at the same stage of
processing and vertical intra-industry trade (VIIT) is driven by differences in skill
content or at different stages of processing. In VIIT, where goods are differentiated
by quality, high quality goods require more high skilled labor as compared to low
quality goods. Product quality is closely associated to vertical differentiation since
Correspondence to: Department of Economics, Faculty of Economics and Management, University Putra
Malaysia, Selangor, Malaysia. E-mail: [email protected].
Abstract
This study aims to measure the export product quality improvement for trade between
China and eight selected developing countries: Argentina, Brazil, Chile, Egypt, South
Africa, Mexico, Turkey, and the Russian Federation based on disaggregated four-digit SITC
data for the two periods 2000–2004 and 2004–2008. Vertical intra-industry trade high
(VIITH) is considered as high quality products. The results revealed that the highest benefits
of intra-industry trade with China are for South Africa in the first period and for Egypt in the
second period. The highest positive growth of high quality products during the two periods
is reported for Russia in the first period and for Brazil and Argentina in the second period. In
conclusion, there is a massive potential for economic cooperation between China and these
three partners.
Key words: intra industry trade; product quality value; China
JEL classification: F10; L15

60 International Journal of Business and Economics
the latter is defined as the behavior of firms producing goods of different quality
(Shaked and Sutton, 1987).
The aim of this study is to measure product quality improvement in trade
between China and selected developing countries for the periods 2000–2004 and
2004–2008. Using the methodology of Azhar and Elliott (2003, 2006), we calculate
the S index to measure the dynamic IIT and the product quality value (PQV) index.
We split VIIT and HIIT for every product that has an S index between ± 0.4 to
reveal the variability in vertical and horizontal IIT. Azhar and Elliot (2003, 2006)
used the PQV index to differentiate whether the product is high or low in VIIT. High
VIIT represents the home country exporting high quality products, while low VIIT
indicates that the home country is importing high quality products. This study focuses on China’s trade with eight newly industrialized countries
(NICs) that have a similar level of development: Argentina, Brazil, Chile, Egypt,
South Africa, Mexico, Turkey, and Russia. The NICs have higher trade costs
compared to other developing countries since they are countries with economies that
have not yet reached First World status but that have, in a macroeconomic sense,
outpaced their developing counterparts. China is the largest country in the world
with 19.2% of the world population in 2011. It was also the world’s second largest
exporter of merchandise in 2011. With the increase in volume of high quality
products in the world trade market, developing countries such as China have begun
to increase their trade in this sector. During the past decade, trade between China
and other developing countries has grown rapidly. Developing countries are
significant trade partners and the annual growth rates of China’s bilateral trade are
increasing more quickly than that of China’s total trade. IIT in manufacturing plays
an important role in China’s foreign trade. This study contributes to the trade quality
literature since, while some research has examined the quality of exports from China,
empirical tests of the recent graphical method of PQV indexes remains an untouched
area. This study uses an empirical examination that represents the improvements of
export product quality of China and developing countries during the period of study
that is important to the foundation of its trade quality. There is massive potential for
wider economic cooperation between China and its selected developing partners.
The existing scope of high quality IIT between China and developing countries
show the remarkable power of China’s exports, and it is worthwhile for China’s
economy to focus more on exporting high quality products, particularly in
manufacturing.
2. Literature Review
Initial works on IIT measurement focused on the degrees and patterns of IIT.
The first measurement was proposed by Balassa (1966), who suggested using the
amount to which exports of a given good are offset by imports of an equivalent good.
He proposed an index with a value of one for IIT and zero otherwise. Subsequent
studies determined the extent of IIT using an improved method based on Balassa’s
index, established by Grubel and Lioyd (1975). Their study used an index that

Mastooreh Eshraghi and Normaz Wana Ismail 61
clearly shows IIT as the fraction of trade that is not inter-industry. If there is no IIT
the index is zero, and if all trade involves IIT the index is one. Newer models
introduced by Dixit and Stiglitz (1977) and Lancaster (1979) offer formal analysis
on IIT through alternative representations of horizontal differentiation. Falvey (1981)
established a model of product quality in a multi-product industry with a restricted
output range that is obtained from a specific kind of capital. This study found that
IIT is a natural result of this structure, with no requirement of increasing returns to
scale or an imperfect competitive market.
Helpman and Krugman (1987) proposed the Chamberlin-Heckscher-Ohlin
(CHO) model, which included factor endowment, falling costs, and horizontal
product differentiation to examine both intra- and inter-industry trade. Falvey and
Kierzkowski (1987) expanded a model for north-south trade based on vertical
product differentiation, which produced rich patterns of trade dynamics. A similar
model by Flam and Helpman (1987) illustrated inter-temporal changes in intra-
industry and inter-sectoral trade. IIT occurs since consumers with different incomes
demand products of different qualities since domestic products may not offer choice
variability in qualities. Based on the differences in technology and income
distribution, these IIT models showed that the south exports low quality and low
cost varieties, whereas the north exports high quality and high cost varieties.
In Abd-el-Rahman (1991), microeconomic and macroeconomic determinants
are mixed to analyze foreign trade through the presence of a firm’s individual
performances. He concluded that there are three kinds of foreign trade: one-way
trade, intra-range or vertical differentiation trade, and two-way trade in similar
commodities or horizontal differentiation trade, either bilateral or triangular. Since
then, there has been a large increase in empirical research on splitting IIT flows into
HIIT and VIIT. Greenaway et al. (1994) developed a model based on the
methodology of Abd-el-Rahman (1991) while another model was established by
Fontagne and Freudenberg (1997) based on an earlier approach from Abd-el-
Rahman (1986). Both models use the ratio of export to import unit values to show
quality differences. The two models differ in defining IIT and the degree of trade
overlap that is required for an organization involved in IIT.
Greenaway and Hine (1991) reported that the link between IIT and adjustment
costs could not be supported with conclusive empirical evidence. They compared
three proxy measures of adjustment costs and considered the significance of
different IIT formations by measuring VIIT and marginal intra-industry trade (MIIT).
Fontagne et al. (1997) explored the theory of monopolistic competition and
increasing returns in IIT between similar countries. They proposed that comparative
advantage is useful for countries that are divided by high economic distance,
different factor endowments, or technology levels.
Later, Azhar and Elliott (2003) introduced a method of measuring the trade
induced adjustment. They extended an instrument and an index to show the changes
in trade patterns, which can be used to analyze time series or cross sectional data for
bilateral trade flows. Azhar and Elliott (2006) summarized the previous method in
differentiating trade flows between HIIT and VIIT, compared the model with

62 International Journal of Business and Economics
Fontagne et al. (1997) and Greenaway et al. (1994), and proposed a third method
with a PQV index based on the Grubel and Lloyd index. Applying the PQV index,
the extent of quality differences at the product level associated with various bilateral
trade relationships are quantified for measuring product quality changes.
Complementing Greenaway et al. (1994) and Fontagne et al. (1997), their geometric
instrument represents the range VIIT and HIIT in a diagram and shows import and
export unit values as Cartesian coordinates. Azhar and Elliott (2008) formulated the
marginal quality (MQ) index to measure the quality changes in matched trade
changes that support the dynamic measures of MIIT or volume based IIT. Azhar et
al. (2008) reviewed the main distinguishing factor of the three existence approaches
and made a systematic comparison of them using data for China trade with its East
Asian neighbors. They determined that the main difference in using Azhar’s method
is that it classifies more intra-industry trade as horizontal intra-industry trade. Azhar
and Elliott (2011) further expanded their S and MQ indexes by introducing a new
VQ index which combined changes in the volume and quality in IIT.
3. Methodology
Our data is obtained from the UN COMTRADE database, which gives imports
and exports in quantities and values for the 4-digit Standard International Trade
Classification (SITC 5-8). To separate HIIT and VIIT there are three approaches:
Greenaway et al. (1994), Fontagne et al. (1997), and Azhar and Elliott (2003, 2006).
This study is based on the methodology of Azhar and Elliott (2003, 2006) to show
the extent of dynamic changes of intra-industry trade in China’s trade flows and its
quality improvements that were evident over the time period of study. The
justification for choosing this method relates back to the scaling problem or
disproportionate scaling of the unit value ratio in both the Greenaway et al. (1994)
and Fontagne et al. (1997) approaches (Appendix A). We use a two-stage approach
to measure product quality changes and analyze quality differentiated trade patterns
for various type of goods, during two calendar periods and in many types of
industries, to measure the share of product quality in VIIT and HIIT. In the first
stage, the S index is used to measure dynamic IIT or to measure products that may
have experienced a large increase or decrease in matched trade during the time of
analysis. The S index is calculated using the formula:
( ){ }( )
1 ΔΧ ΔMS = ΔΧ ΔM = ,
2L 2 max ΔΧ t, ΔM t
for t ϵ N = 1,...,n, (1)
where L is the largest change in exports (X) and imports (M) over the study period
and −1 ≤ S ≤ 1. However, based on Devadason (2008), L is the largest change in
exports and imports over the period studied, and for inferring about adjustments
posed by matched trade, products with little IIT change and those that represent
inter-industry trade are removed. Therefore the S index values are restricted to −0.4
≤ S ≤ 0.4. An S index of 0 means X and M are exactly matched. At the extremes, X

Mastooreh Eshraghi and Normaz Wana Ismail 63
and M move in opposite directions in favor of the exporter or home country with S
indices of +0.4 or −0.4, respectively. Thus, S=0 means there is a similar quality of
exports and imports and there is no benefit or loss in trade. A positive S index means
that the quality of exports is higher than the quality of imports and the benefit of
trade is for the exporter, while the negative S index means that the quality of the
import is greater than the quality of export and so the benefit of trade is for the
importer. Although the S index shows some information about the direct benefits of
trade in bilateral trade, the results of the PQV index are more suitable for use by
policymakers or economists.
In the second stage, we use the restricted S index to calculate the PQV index.
The PQV index that is adopted to differentiate horizontal and vertical intra-industry
trade high and vertical intra-industry trade low and represents a measure of the
dispersion of product quality in IIT flows. The PQV is given as:
PQV=1+ MX
MX
UVUV
UVUV
with 0 < PQV < 2, (2)
where unit value (UV) is a proxy for quality and is calculated as the ratio of total
value to total volume of traded commodities. Price plays a role in this measure
through factor price (which indicates quality) and trade costs. This approach is
rooted in the belief that higher quality goods sell at higher prices and thus higher
unit price denotes higher quality. Hallak (2006) found a positive relationship
between price and quality. In Greenaway et al. (1995), Schott (2004), and Hummels
and Skiba (2004) also recognized that unit value is positively related to vertical
differentiation, justifying the use of unit values as an indicator of quality.
The UVM is the unit value of imports and UVX is the unit value of exports. If
exports and imports share at least 85% of their costs, products are defined as HIIT.
Therefore, the PQV index is one if every two-way trade is equivalent in quality and
VIIT is equal to zero (PQV =1 if VIIT=0). The interval 0.85–1.15 is used to
determine whether the PQV index is suitably far from one to specify quality
differences (see Fontagné and Freudenberg, 1997; Greenaway et al., 1994;
Chiarlone, 2000). The range of HIIT is as follows:
0.85 ≤ PQV ≤ 1.15. (3)
Products are considered as VIIT if imports and exports share only 50% of their costs.
The VIIT is categorized as high or low (VIITH and VIITL) based on whether the
quality of exports is higher than imports. Specifically, VIIT is categorized as high if:
PQV > 1.15. (4)
Products are considered as VIITL if the home country is exporting quality and:
PQV < 0.85. (5)

64 International Journal of Business and Economics
VIITH means that the home country is exporting quality products and VIITL means
that the home country is importing quality products.
4. Results and Discussion
This study measures product quality improvement in trade between China and
other developing countries: Argentina, Brazil, Chile, Egypt, South Africa, Mexico,
Turkey, and the Russian Federation during the two periods 2000–2004 and 2004–
2008. Table 1 reports the S indexes, given the total number of products and the IIT
numbers. Trade flows between China and Argentina yield 303 products that changed
significantly in matched trade in the first period and 144 products in the second
period. Based on the percentage of positive S indexes, the second period performs
better with 56.9% as compared to 49.8% in the first period. This means that 56.9%
of trade between China and Argentina in the second period benefits China.
Meanwhile, the quality of exports from China to Argentina is greater than the
quality of its imports. While the IIT decreased from 246 to 160 in bilateral trade
between China and Brazil, the percentage of positive S indexes increased from
47.2% to 61.%. This result supports Brazil as a profitable partner for China.
Table 1. The S Indexes for Trade between China and Eight Developing Countries
Time Period 2000-2004 2004-2008
China’s
Trading
Partner
Total
Numbers
of
Products
IIT
Number
Number
of
Products
with
Positive
S Index
Percentage
of
Positive S
Index
Total
Numbers
of
Products
IIT
Number
Number
of
Products
with
Positive
S Index
Percentage
of
Positive S
Index
Argentina 3110 303 151 49.83 3320 144 82 56.94
Brazil 3350 246 116 47.15 3465 160 98 61.25
Chile 3160 216 119 55.09 3315 157 95 60.50
Egypt 3270 264 148 56.06 3350 190 161 84.73
South Africa 3435 211 124 58.76 3490 190 112 58.94
Mexico 2580 178 77 43.25 3400 218 134 61.46
Turkey 3300 215 117 54.41 3430 213 127 59.62
Russia 3510 291 118 40.54 3515 161 104 64.59
Notes: Calculated from the UN COMTRADE using the S index. The IIT represents the total number of products that
have experienced significant changes in matched trade based on the S index (−0.4 ≤ S ≤ 0.4).
The total numbers of products traded between China and Chile increased from
3160 in the first period to 3315 in the second period. Although the number of
products that had large changes in IIT decreased from 216 to 157, the percentage of
positive S indexes increased from 55.1% in the first period to 60.5% in the second
period. This shows that the benefits of trade for China improved between the two
periods. As for China’s trade with Egypt, the percentage of positive S indexes
increased from 56.1% to 84.7%, implying that IIT with Egypt during these periods is
also profitable for China. Trade with South Africa shows a decrease in both IIT
Mastooreh Eshraghi and Normaz Wana Ismail 65
numbers and number of products with positive S indexes in the second period. In
both periods, benefits of trade to China reach approximately 58%. The IIT numbers
for products traded between China and Mexico increased from 178 in the first period
to 218 in the second period. The number of products with positive S indexes rose
from 77 to 134, and the percentage of positive S indexes increased from 43.3% to
61.5%, indicating benefits of trade in favor of China. Trade benefits to China are
also evident in the bilateral trade with Turkey and Russia where the percentage of
positive S indexes increased from 54.4% to 59.6% and 40.5% to 64.6%, respectively.
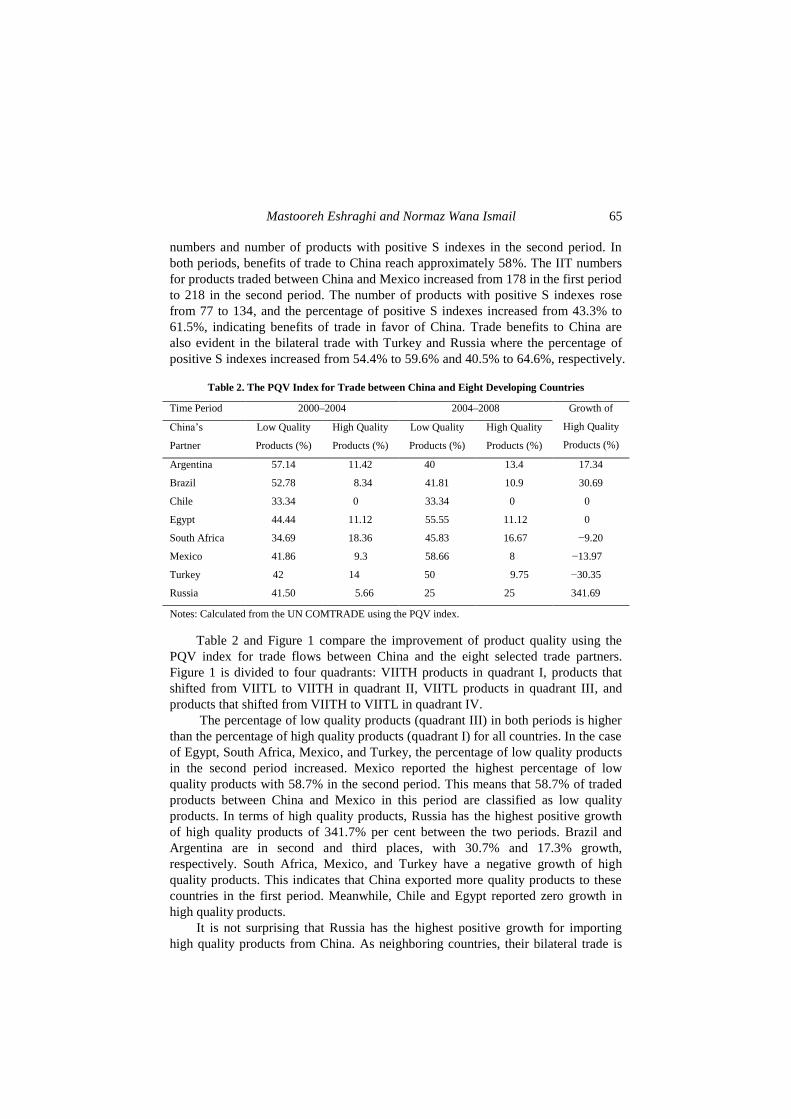
Table 2. The PQV Index for Trade between China and Eight Developing Countries
Growth of
High Quality
Products (%)
2004–2008 2000–2004 Time Period
High Quality
Products (%)
Low Quality
Products (%)
High Quality
Products (%)
Low Quality
Products (%)
China’s
Partner
17.34 13.4 40 11.42 57.14 Argentina
30.69 10.9 41.81 8.34 52.78 Brazil
0 0 33.34 0 33.34 Chile
0 11.12 55.55 11.12 44.44 Egypt
−9.20 16.67 45.83 18.36 34.69 South Africa
−13.97 8 58.66 9.3 41.86 Mexico
−30.35 9.75 50 14 42 Turkey
341.69 25 25 5.66 41.50 Russia
Notes: Calculated from the UN COMTRADE using the PQV index.
Table 2 and Figure 1 compare the improvement of product quality using the
PQV index for trade flows between China and the eight selected trade partners.
Figure 1 is divided to four quadrants: VIITH products in quadrant I, products that
shifted from VIITL to VIITH in quadrant II, VIITL products in quadrant III, and
products that shifted from VIITH to VIITL in quadrant IV.
The percentage of low quality products (quadrant III) in both periods is higher
than the percentage of high quality products (quadrant I) for all countries. In the case
of Egypt, South Africa, Mexico, and Turkey, the percentage of low quality products
in the second period increased. Mexico reported the highest percentage of low
quality products with 58.7% in the second period. This means that 58.7% of traded
products between China and Mexico in this period are classified as low quality
products. In terms of high quality products, Russia has the highest positive growth
of high quality products of 341.7% per cent between the two periods. Brazil and
Argentina are in second and third places, with 30.7% and 17.3% growth,
respectively. South Africa, Mexico, and Turkey have a negative growth of high
quality products. This indicates that China exported more quality products to these
countries in the first period. Meanwhile, Chile and Egypt reported zero growth in
high quality products.
It is not surprising that Russia has the highest positive growth for importing
high quality products from China. As neighboring countries, their bilateral trade is

66 International Journal of Business and Economics
expected to increase over time. Furthermore, Russia recorded its ninth straight year
of annual growth by the end of 2008, averaging 7% between 2000 and 2008, and
trade between Russia and China continues to recover after the global economic crisis.
In 2011, the Russian prime minister expected that trade with China will reach
US$100 billion by 2015 and US$200 billion by 2020 (Novo-Ogaryovo, 2011).
According to the International Monetary Fund and the World Bank reports in
2011, Brazil has the seventh largest purchasing power parity in the world, and its
economy has been predicted to become one of the five largest in the world in the
decades to come. Its positive growth of high quality products is evident as the total
trade between Brazil and China expanded strongly during the past 12 years.
Furthermore, Brazil’s exports and imports with China grew by a compound annual
growth rate of 46.9% and 37.8% from 1999 to 2010, respectively.
Trade between China and Argentina grew rapidly, and China became
Argentina’s second largest trading partner in 2009. As shown in Table 2, the
percentage of high quality products in Argentina increased from 11.4% in the first
period to 13.4% in the second period, showing positive growth between these two
periods. However, the product quality of bilateral trade between China and Chile
was unchanged between periods. All traded products are classified as HIIT or low
quality IIT, where China imports quality products from Chile and the percentage of
high quality products in both periods are zero. Finally, trade between China and
Egypt has an increasing percentage of low quality products, while the percentage of
high quality products in both periods remains at 11.1%.
5. Conclusion
This study focuses on the measurement of product quality improvement in
trade between China and selected trading partners during the two periods 2000–2004
and 2004–2008. Examining the PQV index, the highest positive growth of high
quality products during the two periods is reported by Russia, while Brazil and
Argentina place second and third. Trade between Russia and China is rapidly
recovering after the global slowdown in 2008. China is Brazil’s biggest export
market, and its large market size is a prospective key destination for China’s high
quality exports. According to International Monetary Fund and World Bank Reports
(2011), Brazil was the seventh largest country in the world in terms of GDP and PPP
in 2009, and it is expected to become one of the five largest economies in the next
decade. China was also noted as Argentina’s second largest trading partner in 2009.
The emerging economies of both Argentina and Brazil play important roles in world
trade, leading to agreements to improve their partnership. In conclusion, there is a
massive potential for wider economic cooperation between China and its three major
partners. The recent increase in high quality IIT between China and other
developing countries also shows the remarkable power of China’s exports.

Mastooreh Eshraghi and Normaz Wana Ismail 67
Figure 1. PQV Index, Trade between China and Eight Developing Countries
(2000–2004) (2004–2008)
China-Argentina
China-Brazil
China-Chile

68 International Journal of Business and Economics
China-Egypt
China-South Africa
China-Mexico
Mastooreh Eshraghi and Normaz Wana Ismail 69
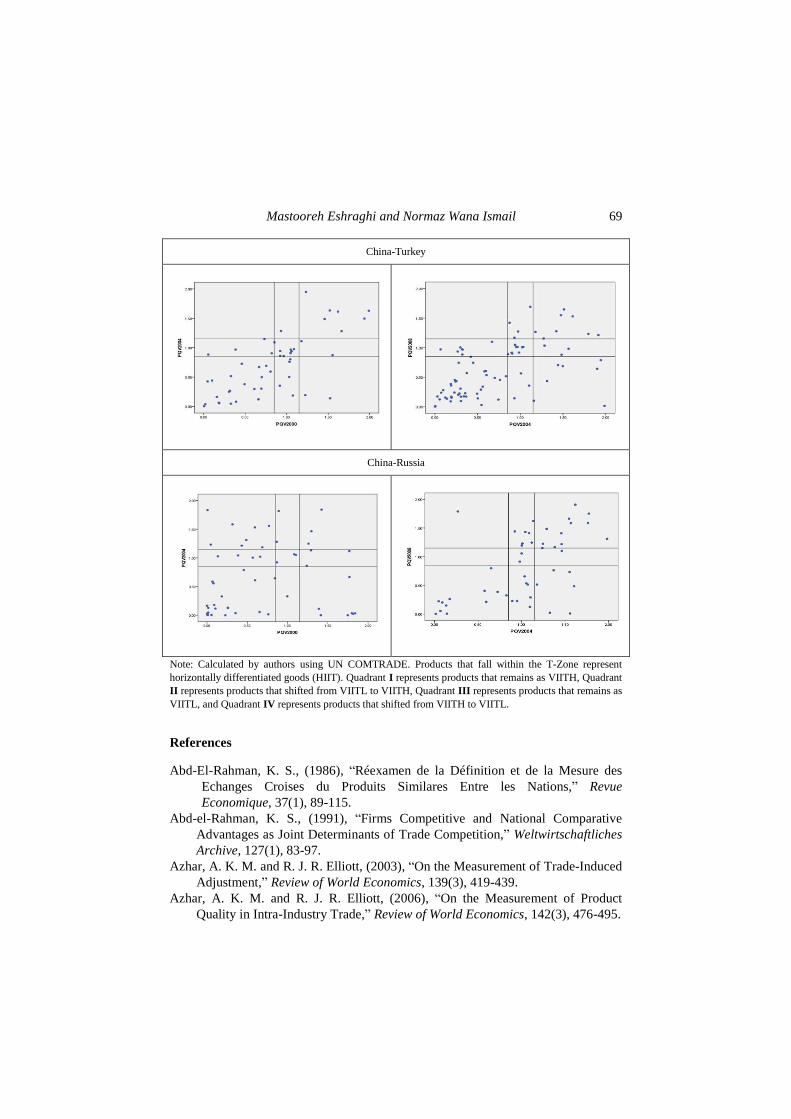
China-Turkey
China-Russia
Note: Calculated by authors using UN COMTRADE. Products that fall within the T-Zone represent
horizontally differentiated goods (HIIT). Quadrant I represents products that remains as VIITH, Quadrant
II represents products that shifted from VIITL to VIITH, Quadrant III represents products that remains as
VIITL, and Quadrant IV represents products that shifted from VIITH to VIITL.
References
Abd-El-Rahman, K. S., (1986), “Réexamen de la Définition et de la Mesure des
Echanges Croises du Produits Similares Entre les Nations,” Revue
Economique, 37(1), 89-115.
Abd-el-Rahman, K. S., (1991), “Firms Competitive and National Comparative
Advantages as Joint Determinants of Trade Competition,” Weltwirtschaftliches
Archive, 127(1), 83-97.
Azhar, A. K. M. and R. J. R. Elliott, (2003), “On the Measurement of Trade-Induced
Adjustment,” Review of World Economics, 139(3), 419-439.
Azhar, A. K. M. and R. J. R. Elliott, (2006), “On the Measurement of Product
Quality in Intra-Industry Trade,” Review of World Economics, 142(3), 476-495.

70 International Journal of Business and Economics
Azhar, A. K. M. and R. J. R. Elliott, (2008), “On the Measurement of Changes in
Product Quality in Marginal Intra-Industry Trade,” Review of World Economics,
144(2), 225-247.
Azhar, A. K. M. and R. J. R. Elliott, (2011), “A Measure of Trade Induced
Adjustment in Volume and Quality Space,” Open Economies Review, 22, 955-
968.
Azhar, A. K. M., R. J. R. Elliott, and J. Liu, (2008), “On the Measurement of
Product Quality in Intra-Industry Trade: An Empirical Test for China,” China
Economic Review, 19(2), 336-344.
Balassa, B., (1966), “Tariff Reductions and Trade in Manufactures among the
Industrial Countries,” The American Economic Review, 56(3), 466-473.
Chiarlone, S., (2000), “Evidence of Product Differentiation and Relative Quality in
Italian Trade,” Centre for Research on Innovation and Internationalization,
Universita' Bocconi, Milano, Italy, CESPRI Working Papers, No. 114.
Dixit, A. K. and J. E. Stiglitz, (1977), “Monopolistic Competition and Optimum
Product Diversity,” The American Economic Review, 67(3), 297-308.
Falvey, R. E., (1981), “Commercial Policy and Intra-Industry Trade,” Journal of
International Economics, 11(4), 495-511.
Falvey, R. E. and H. Kierzkowski, (1987), Product Quality, Intra-Industry Trade
and Imperfect Competition, Oxford: Basil Blackwell.
Flam, H. and E. Helpman, (1987), “Vertical Product Differentiation and North-
South Trade,” The American Economic Review, 77(5), 810-822.
Fontagne, L. and M. Freudenberg, (1997), “Intra-Industry Trade: Methodological
Issues Reconsidered,” CEPII Working Paper, No. 97/02.
Greenaway, D., R. Hine, and C. Milner, (1995), “Vertical and Horizontal Intra-
Industry Trade: A Cross Industry Analysis for the United Kingdom,” The
Economic Journal, 105(433), 1505-1518.
Greenaway, D. and R. C. Hine, (1991), “Intra-Industry Specialization, Trade
Expansion and Adjustment in the European Economic Space,” Journal of
Common Market Studies, 29(6), 603-622.
Greenaway, D., R. C. Hine, and C. Milner, (1994), “Country-Specific Factors and
the Pattern of Horizontal and Vertical Intra-Industry Trade in the UK,”
Weltwirtschaftliches Archiv, 130(1), 77-100.
Grubel, H. G. and P. J. Lloyd, (1975), Intra-Industry Trade: The Theory and
Measurement of International Trade in Differentiated Products, New York:
Wiley.
Hallak, J. C., (2006), “Product Quality and the Direction of Trade,” Journal of
International Economics, 68(1), 238-265.
Helpman, E. and P. R. Krugman, (1987), Market Structure and Foreign Trade:
Increasing Returns, Imperfect Competition, and the International Economy,
The MIT Press.
Hummels, D. and A. Skiba, (2004), “Shipping the Good Apples Out? An Empirical
Confirmation of the Alchian-Allen Conjecture,” Journal of Political Economy,
112(6), 1384-1402.

Mastooreh Eshraghi and Normaz Wana Ismail 71
Lancaster, K., (1979), Variety, Equity, and Efficiency: Product Variety in an
Industrial Society, New York: Columbia University Press.
Novo-Ogaryovo, (2011), RIA Novosti, September 14.
Schott, P. K., (2004), “Across-Product versus Within-Product Specialization in
International Trade,” The Quarterly Journal of Economics, 119(2), 647-678.
Shaked, A. and J. Sutton, (1987), “Product Differentiation and Industrial Structure,”
The Journal of Industrial Economics, 36(2), 131-146.
Appendix A: Scaling Problem
The unit value ratio for Greenaway et al. (1994) and Fontagne et al. (1997) is:
r =M
X
UV
UV.
For all XUV > 0, MUV > 0, and XUV > MUV we have 1< r < ∞ and when XUV < MUV we have 0 < r <1; the function r can be described as being heavy on its
denominator. A description of the disproportionate scaling of r is given by noticing
that:
r = ( ) =
X
M X
M
UVf UV ,UV
UV.
and so:
MUV
rUV X = −
2M
X
UV
UV ⇒
as MUV → 0, then,
MUV
rUV X → ∞,
XUV
r MUV =
MUV
1⇒ as XUV → 0, now,
XUV
r MUV =MUV
1.
Therefore, the rates of change of r with respect to XUV and MUV are not same; this
is the so-called disproportionate scaling or proportionality effect, while for the PQV
index of Azhar and Elliott we have ( ) ( )PQV =1+ X M X MUV UV UV UV . Here,
for all XUV > 0, MUV > 0, and XUV > MUV we have 1 < PQV < 2 and when XUV
< MUV we have 0 < PQV < 1. A description of the proportionate scaling of PQV is
given by noticing that PQV= ( )M Xf UV ,UV = ( ) ( )1+ X M X MUV UV UV UV .
Then:
X
MUV
UV
PQV
= −
2
2MX
X
UVUV
UV
⇒ as MUV → 0, X
MUV
UV
PQV
=
XUV
2.

72 International Journal of Business and Economics
M
XUV
UV
PQV
= 2
2MX
M
UVUV
UV
⇒ as XUV
→ 0, M
XUV
UV
PQV
=
MUV
2.
Hence, the PQV exhibits proportionate scaling.