INTRA-ASIAN FDI FLOWS: TRENDS, PATTERNS AND DETERMINANTS by Rabin Hattari and Ramkishen Rajan.
40
INTRA-ASIAN FDI FLOWS: TRENDS, PATTERNS AND DETERMINANTS by Rabin Hattari and Ramkishen Rajan
-
Upload
franklin-hamilton -
Category
Documents
-
view
215 -
download
0
Transcript of INTRA-ASIAN FDI FLOWS: TRENDS, PATTERNS AND DETERMINANTS by Rabin Hattari and Ramkishen Rajan.

INTRA-ASIAN FDI FLOWS: TRENDS, PATTERNS AND
DETERMINANTS
by
Rabin Hattari and Ramkishen Rajan
i) i) DefinitionsDefinitions
ii)ii) Trends in FDI OutflowsTrends in FDI Outflows
iii)iii) Data and MethodologyData and Methodology
iv)iv) FindingsFindings
v)v) ConclusionsConclusions
Contents

““FDI refers to an investment made to FDI refers to an investment made to acquire lasting interest in enterprises acquire lasting interest in enterprises operating outside of the economy of the operating outside of the economy of the investor. Further, in cases of FDI, the investor. Further, in cases of FDI, the investor´s purpose is to gain an effective investor´s purpose is to gain an effective voice in the management of the voice in the management of the enterprise. The foreign entity or group of enterprise. The foreign entity or group of associated entities that makes the associated entities that makes the investment is termed the ‘direct investment is termed the ‘direct investor’.”investor’.”
Definitions

FDI commonly bears three broad characteristics:FDI commonly bears three broad characteristics:
Refers to a source of external financingRefers to a source of external financing rather than net net physical investment or real activity.physical investment or real activity.
As matter of convention FDI involves a 10 percent As matter of convention FDI involves a 10 percent threshold value of ownership. threshold value of ownership.
FDI involves both the initial transaction that creates (or FDI involves both the initial transaction that creates (or liquidates) investments as well as subsequent liquidates) investments as well as subsequent transactions between the direct investor and the direct transactions between the direct investor and the direct investment enterprises aimed at maintaining, expanding investment enterprises aimed at maintaining, expanding or reducing investments.or reducing investments.
Definitions (cont’d.)

At an operational level FDI consists of three broad At an operational level FDI consists of three broad aspects:aspects:
a)a) New foreign equity flowsNew foreign equity flows (either M&A of existing local (either M&A of existing local enterprises or Greenfield investments).enterprises or Greenfield investments).
b)b) Inter-company debt transactions Inter-company debt transactions (which refer to (which refer to short-term or long-term borrowing and lending of short-term or long-term borrowing and lending of funds including debt securities and trade credits funds including debt securities and trade credits between the parent company and its affiliates).between the parent company and its affiliates).
c) c) Reinvested earnings Reinvested earnings (which comprise the investor’s (which comprise the investor’s share of earnings not distributed as dividends by share of earnings not distributed as dividends by affiliates or remitted to the home country but rather affiliates or remitted to the home country but rather reinvested in the host country). reinvested in the host country).
Definitions (cont’d.)

At an operational level FDI consists of At an operational level FDI consists of three broad aspects:three broad aspects:
Most M&A statistics tend to include announced Most M&A statistics tend to include announced rather than actual financial flows and may not rather than actual financial flows and may not always even include activities considered to be always even include activities considered to be FDI (as defined above).FDI (as defined above).
Announced flows often includes funding of Announced flows often includes funding of capital via equity from local minority share-capital via equity from local minority share-holders or local/international borrowing (as holders or local/international borrowing (as opposed to funds from the parent or sister opposed to funds from the parent or sister companies) or swapping of shares.companies) or swapping of shares.
Definitions (cont’d.)
Trends
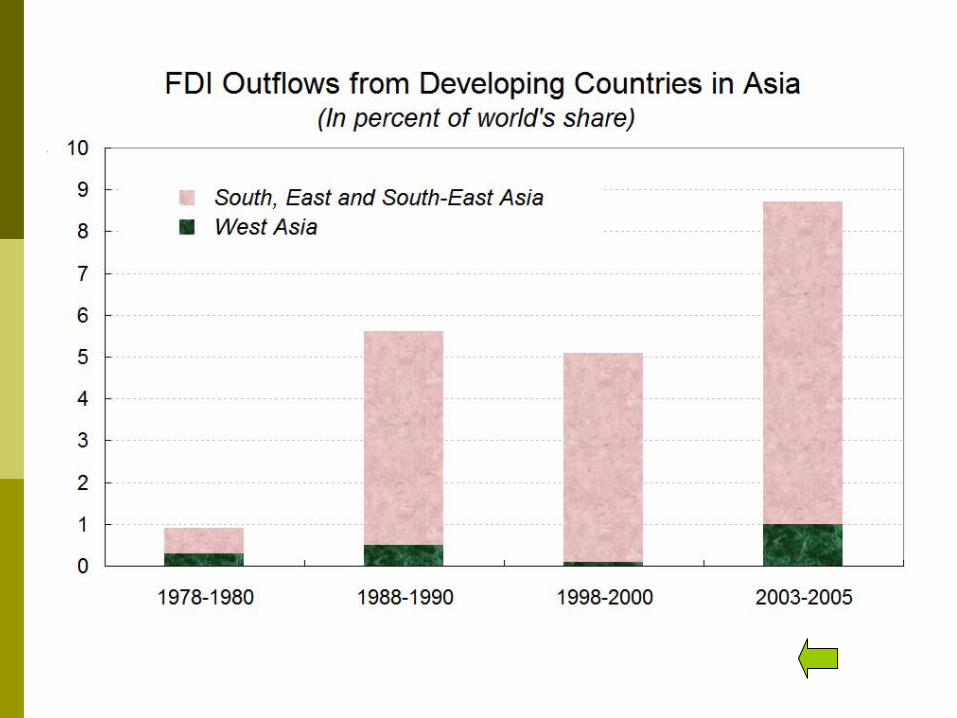
Developing countries continue to attract more direct investment from abroad but are increasingly also becoming significant investors abroad.

Trends (cont’d.)
However, most of the outward direct investment activities have so far involved Asian economies.

Trend (cont’d.)
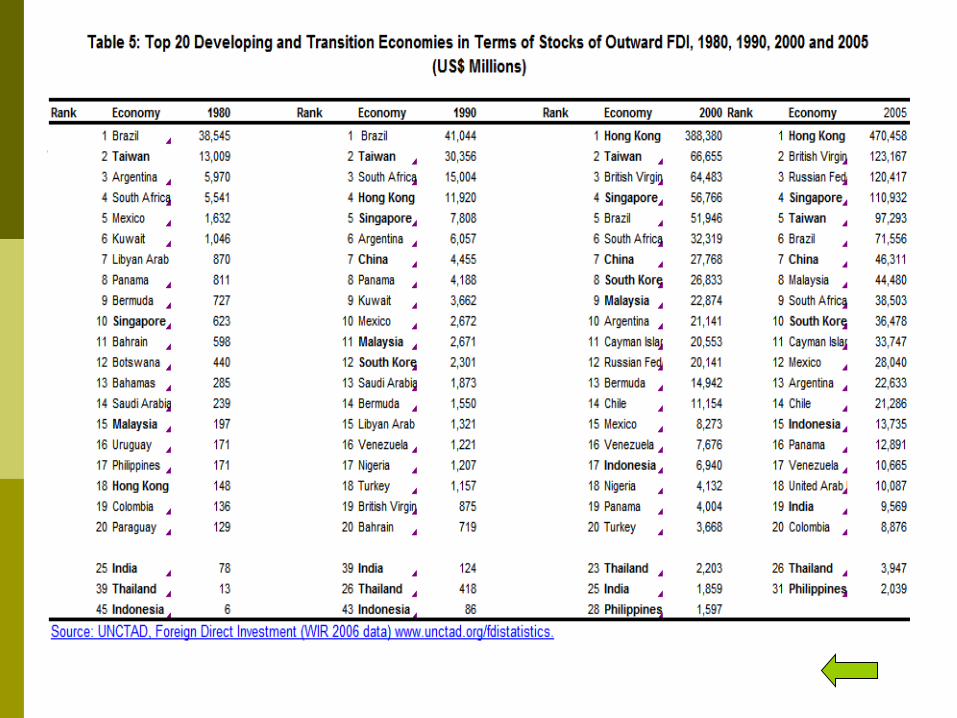
Developing Asia, in the past 3 decades, has become the leader in FDI outward stock for developing countries.
The location and types of their investments have varied.
Hong Kong’s outflows are far higher than any other developing economy. A large part of outflows from Hong Kong is bound for Mainland China (part of which is round-tripping from the Mainland to begin with).
The other three NIEs of Singapore, South Korea and Taiwan have consistently remained among the top developing economy sources of FDI.
Trend (Cont’d)

Trend (cont’d.) Malaysia’s outward FDI flows have picked
up since the 1990s. Indonesia remains an important source of FDI, while more aggressive internationalization strategies by Indian companies has seen it rise in the rankings from 39 in 1990 to top 20 by 2005.

Trend (cont’d.): Developing Asian
economies are also investing in their own backyard.
Hong Kong, China, Singapore and Taiwan are particularly important investors.
Asia 2/In percent
of AsiaIn percent of World
Asia 2/In percent
of AsiaIn percent of World
Donor countriesBangladesh 0.2 0.0 0.0 0.5 0.0 0.0China 7,356.8 15.7 0.8 5,646.9 13.5 0.8Hong Kong SAR 18,869.8 40.2 2.0 18,652.4 44.6 2.6India 43.9 0.1 0.0 34.9 0.1 0.0Indonesia 254.9 0.5 0.0 190.7 0.5 0.0Korea 656.4 1.4 0.1 274.1 0.7 0.0Malaysia 376.6 0.8 0.0 433.1 1.0 0.1Pakistan 1.4 0.0 0.0 6.2 0.0 0.0Philippines 180.4 0.4 0.0 263.8 0.6 0.0Singapore 7,018.5 14.9 0.8 5,188.5 12.4 0.7Sri Lanka 2.7 0.0 0.0 0.2 0.0 0.0Taiwan POC 3,376.5 7.2 0.4 4,016.6 9.6 0.6Thailand 289.3 0.6 0.0 232.0 0.6 0.0Developing Asia 3/ 8,525.0 18.1 0.9 6,846.1 16.4 0.9
Asia 2/ 46,996.1 100.0 5.1 41,834.8 100.0 5.8
Source: UNCTAD FDI/TNC database.
1/ Asia data is based on FDI inflow data in host economy; world data is based on FDI outflow
from donor economy.
2/ Asia consists of Bangladesh, Brunei Darussalam, Cambodia, China, Hong Kong SAR, India,
Indonesia, Korea, Lao PDR, Malaysia, Myanmar, Pakistan, Philippines, Singapore,
Sri Lanka, Taiwan POC, Thailand, and Vietnam
3/ Developing Asia consists of Bangladesh, Cambodia, China, Hong Kong SAR, India,
Indonesia, Lao PDR, Malaysia, Myanmar, Pakistan, Philippines, Sri Lanka,
Thailand, and Vietnam
(1997-00)
(In millions of U.S. dollars, unless otherwise noted)Host region 1/
Average of Intra-Asian Bilateral FDI Outward Flows
(2001-05)

Trend (cont’d.)
East Asia 2/
South-East Asia 3/
South Asia 4/
East Asia 2/
South-East Asia 3/
South Asia 4/
Donor regionEast Asia 2/ 28,453.6 1,604.2 201.6 27,482.5 1,028.7 78.9South-East Asia 3/ 6,328.7 1,748.2 86.6 3,622.3 2,623.4 111.1South Asia 4/ 0.0 42.9 5.2 0.0 27.3 14.6Rest of the world 42,812.3 21,340.5 3,732.2 46,489.8 21,056.5 3,821.0
Source: UNCTAD FDI/TNC database.
1/ Based on FDI inflow data in host economy.
2/ East Asia consists of China, Hong Kong SAR, Korea, Taiwan POC, and Macau SAR.3/ South-East Asia consists of Brunei Darussalam, Cambodia, Lao PDR, Malaysia, Myanmar, Singapore, Phillippines,
Thailand, and Vietnam.
4/ South Asia consists of Bangladesh, India, Sri Lanka, and Pakistan.
(1997-00) (2001-05)
Average Intra-Asian Bilateral FDI Outward Flows 1/(In millions of U.S. dollars)
Host region
Most of the direct investment activities are between East Asian countries.

Trend (cont’d.)
Most of the direct investment activities are between East Asian countries.
Donor Host (1997-00) (2001-05) (1997-00) (2001-05)
Hong Kong SAR China 17,750.8 17,819.1 37.8 42.6China Hong Kong SAR 7,266.9 5,459.4 15.5 13.0Taiwan POC China 2,774.8 3,361.3 5.9 8.0Singapore China 2,706.3 2,136.7 5.8 5.1Singapore Thailand 441.7 1,381.9 0.9 3.3Singapore Malaysia 844.1 1,133.8 1.8 2.7Taiwan POC Hong Kong SAR 268.9 446.6 0.6 1.1Singapore Hong Kong SAR 2,835.3 353.1 6.0 0.8Malaysia China 290.8 316.7 0.6 0.8Hong Kong SAR Malaysia 272.3 296.5 0.6 0.7Philippines China 135.9 212.2 0.3 0.5Thailand China 185.8 183.7 0.4 0.4Hong Kong SAR Thailand 360.1 160.8 0.8 0.4Hong Kong SAR Macau 0.0 158.0 0.0 0.4Korea Hong Kong SAR 313.0 155.7 0.7 0.4Malaysia Hong Kong SAR 62.0 147.2 0.1 0.4Indonesia China 115.0 134.0 0.2 0.3Hong Kong SAR Myanmar 0.0 132.0 0.0 0.3Thailand Hong Kong SAR -3.1 110.7 0.0 0.3China Singapore -17.3 99.9 0.0 0.2Taiwan POC Thailand 130.8 96.1 0.3 0.2Taiwan POC Singapore 96.0 87.9 0.2 0.2Hong Kong SAR Singapore 250.1 81.9 0.5 0.2Singapore Philippines 88.9 76.1 0.2 0.2Singapore India 22.0 67.6 0.0 0.2Hong Kong SAR Philippines 50.0 54.4 0.1 0.1Hong Kong SAR Korea 79.2 51.5 0.2 0.1Philippines Thailand 4.9 48.4 0.0 0.1China Cambodia 18.3 33.4 0.0 0.1Korea Thailand 24.5 32.4 0.1 0.1
Source: UNCTAD FDI database
1/ Based on FDI inflow data in host economy.
In percent to Asia
Table 9. Top 30 Bilateral Flow Between Asian Countries 1/
(In million of U.S. dollars)
Average

Trend (cont’d.) FDI outflows and inflows for most countries
during the sub-periods 1990 to 1996 and 1997 to 2005 are positively correlated.
This indicates periods of economic liberalization have been characterized by simultaneous rises in both FDI inflows as well as outflows.

Question: What are the determinants of intra-Asian
(excluding Japan) bilateral direct investment flows over the period 1990-2004?

Methodology and Data We use a gravity model on a panel data of
intra-Asia bilateral direct investment flows from 15 Asian countries to other 10 Asian countries from 1990 to 2004.
Econometric methodology: Pooled OLS. Country-pair fixed effects to filter out any
time invariant variables.

Methodology and Data (cont’d.)
Variables Source
FDI Outflows UNCTAD FDI/TNC databaseReal GDP, PPP World Development Indicators, World BankExchange rate World Economic Outlook, IMFDistance CIPEEIndex of Capital and Trade Restrictions KOFIndex of Information Flows KOFIndex of Personal Contacts KOFIndex of Cultural Proximity KOFIndex of Political Globalization KOFCommon official language CIPEELand border CIPEE
Table A1
Table A2. Countries Included in the Dataset
Source countries in datasetBangladesh Korea Sri LankaChina Malaysia Taiwan POCHong Kong SAR Pakistan ThailandIndia Philippines VietnamIndonesia Singapore
Destination countriesBangladesh MalaysiaChina PakistanHong Kong SAR PhilippinesIndia SingaporeKorea Thailand

Data Our data is based FDI inflows to the host
economy (i.e. we focus on the sources of inflows rather than destination of outflows).
Reasons: UNCTAD FDI outflows data from source countries are
incomplete for many countries. For example, some donor countries (Malaysia and Thailand) have relatively complete outflows data, others either have incomplete data (India and Singapore), or no data all (Mainland China).
FDI inflow data reported in host economy are more complete and data are available for all developing Asian economies under consideration here.
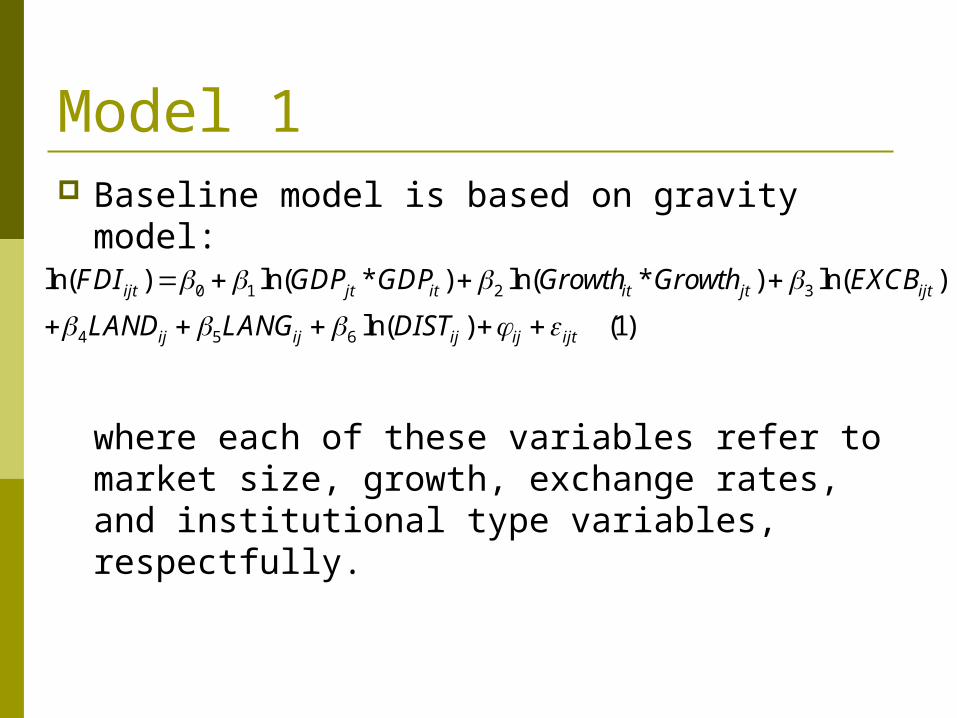
Model 1 Baseline model is based on gravity model:
where each of these variables refer to market size, growth, exchange rates, and institutional type variables, respectfully.
0 1 2 3
4 5 6
ln( ) ln( * ) ln( * ) ln( )
ln( ) (1)
ijt jt it it jt ijt
ij ij ij ij ijt
FDI GDP GDP Growth Growth EXCB
LAND LANG DIST

Model 2 We augmented our model to include KOF-
index of globalization.
0 1 2 3
4 5 6 7 8
9 10 11
ln( ) ln( * ) ln( * ) ln( )
ln( ) ln( 1 1 ) ln( 1 1 )
ln( 2 2 ) ln( 3 3 ) ln( )
ijt jt it it jt ijt
ij ij ij it jt it jt
it jt it jt it jt
FDI GDP GDP Growth Growth EXCB
LAND LANG DIST KAP KAP SOC SOC
SOC SOC SOC SOC POL POL
(2)ij ijt

Model 2
Economic Globalization
Index
Social Globalization
Index
Political Globalization
Index
Globalization Index
Japan 93.6 86.7 44.3 78.2Bangladesh 70.9 55.9 70.6 65.1Sri Lanka 53.5 48.7 78.5 58.2India 50.0 48.6 69.7 54.6Indonesia 48.0 37.0 79.9 52.1Korea 51.2 39.3 63.4 49.8Malaysia 47.8 26.7 76.1 47.1Philippines 51.0 39.4 52.5 47.0Singapore 26.6 24.9 88.1 41.9Thailand 42.6 32.3 40.1 38.1China 16.0 16.5 63.0 28.4
Source: KOF Index database1/ Average from 1990 to 2004
Table. KOF-Index of Globalization for Selected Asian Countries 1/

Models 1 and 2 We re-ran both models by taking into account the country-pair effects. By pairing countries, we take out any time invariant variables (e.g. institutional type variables). In this way, an Asian country that has traditionally invested directly in another Asian country
will affect the coefficients of market size, growth, and bilateral exchange rate.

Our Findings Dependent variable: Regression Regression Regression RegressionLn of bilateral FDI outflows (1) (2) (3) (4)
ln (GDP i * GDP j) 0.125** 0.404 0.638*** 0.958**(0.06) (0.41) (0.09) (0.47)
ln (Real GDP growth i * Real GDP growth j) 0.582*** 0.211** 0.331*** 0.234**(0.11) (0.08) (0.13) (0.09)
Bilateral exchange rate 0.033* -0.443** -0.011 -0.609***(0.02) (0.19) (0.02) (0.22)
common border 0.193 1.218***(0.29) (0.32)
common languange 1.082*** 0.293(0.19) (0.23)
ln distance -0.521*** -0.255(0.17) (0.19)
ln (Restrictions i + Restictions j) -1.558* -3.179***(0.83) (0.75)
ln (Personal contacts i + Personal contacts j) 1.866*** 1.178(0.33) (0.99)
ln (Information flows i + Information flows j) 0.16 0.352(0.60) (0.64)
ln (Cultural proximity i + Cultural proximity j) 1.206*** 0.164(0.29) (0.31)
ln (Political globalization i + Political globalization j) -1.734*** -1.939***(0.65) (0.68)
Constant 0.842 -19.331 -27.275*** -32.4(3.22) (22.16) -5.178 -24.68
Observations 1004 1004 854 854R-squared 0.12 0.09 0.24 0.13Country Pair Dummies No Yes No YesYear Dummies Yes Yes Yes Yes
Notes: Robust standard error in parentheses.* significant at 10%; ** significant at 5%; *** significant at 1%
Source: Authors calculation
Table 10. The Determinants of Intra-Asia Bilateral FDI Outflows

Findings – Equation 1
Our findings are consistent with study on determinants of bilateral FDI outflows based on cross-section.
Country-pair fixed effects show that market-size, growth, and bilateral exchange rate have significant effect with correct sign.

Findings 2
The economic globalization process (trade and capital restrictions) negatively impacts intra-Asia bilateral flows.
The political globalization process negatively impacts intra-Asia bilateral flow.

Conclusion
Asia remains a favoured destination for FDI inflows but firms from the region are also rapidly expanding operations overseas.
Determinants of intra-Asia FDI flows (bilateral) appear broadly similar to determinants of FDI flows globally.
Against the background of rising reserve, policy makers in many emerging economies like China, Korea and India are actively promoted an internationalization thrust through gradual liberalization of rules governing capital account outflows and providing a financing mechanism to domestic firms looking to invest abroad.
Conclusion (Cont’d)
Singapore through “International Enterprise” specifically aims “to promote overseas growth of Singapore-based enterprises” www.iesingapore.gov.sg/
Thailand and Malaysia are actively assisting their firms to invest abroad.
Conclusion (Cont’d)

This study has focused on bilateral FDI flows and their determinants, rather than determinants that are specific to host or source countries.
Specific rationale, types, and destination of outward FDI will vary between countries and require more careful country analyses.
Conclusion (Cont’d)
Conclusion (Cont’d) Bilateral and regional trade and investment
agreements within the region might facilitate the cross-border flow of FDI. In turn, intensified intra-Asian FDI flows will help promote closer de facto regional integration.

Thank you for your attention


Trends (Cont’d) Round-tripping significantly increases the amount
of FDI outward from China. Studies have estimated 25% (WIR03, p. 45) to 50%
(Xiao 2004) of FDI inward to China is round-tripped via Hong Kong.
Donor Host (1997-00) (2001-05) (1997-00) (2001-05)
Hong Kong SAR China 17,750.8 17,819.1 37.8 42.6China Hong Kong SAR 7,266.9 5,459.4 15.5 13.0Taiwan POC China 2,774.8 3,361.3 5.9 8.0Singapore China 2,706.3 2,136.7 5.8 5.1Singapore Thailand 441.7 1,381.9 0.9 3.3Singapore Malaysia 844.1 1,133.8 1.8 2.7Taiwan POC Hong Kong SAR 268.9 446.6 0.6 1.1Singapore Hong Kong SAR 2,835.3 353.1 6.0 0.8Malaysia China 290.8 316.7 0.6 0.8Hong Kong SAR Malaysia 272.3 296.5 0.6 0.7
Source: UNCTAD FDI database
1/ Based on FDI inflow data in host economy.
In percent to Asia
Top 10 Bilateral Flow Between Asian Countries 1/
(In million of U.S. dollars)
Average