
Intra- and inter-laboratory variation in the scoring of ...superfund.berkeley.edu/pdf/221.pdfr Vinca...
20
Mutation Research 534 (2003) 45–64 Intra- and inter-laboratory variation in the scoring of micronuclei and nucleoplasmic bridges in binucleated human lymphocytes Results of an international slide-scoring exercise by the HUMN project Michael Fenech a , Stefano Bonassi b,∗ , Julie Turner a , Cecilia Lando b , Marcello Ceppi b , Wushou Peter Chang c , Nina Holland d , Micheline Kirsch-Volders e , Errol Zeiger f , Maria Paola Bigatti g , Claudia Bolognesi h , Jia Cao i , Giuseppe De Luca j , Marina Di Giorgio k , Lynnette R. Ferguson l , Aleksandra Fucic m , Omar Garcia Lima n , Valeria V. Hadjidekova o , Patrizia Hrelia p , Alicja Jaworska q , Gordana Joksic r , A.P. Krishnaja s , Tung-Kwang Lee t , Antonietta Martelli u , Michael J. McKay v , Lucia Migliore w , Ekaterina Mirkova x , Wolfgang-Ulrich Müller y , Youichi Odagiri z , Thierry Orsiere a1 , Maria Rosaria Scarf` ı a2 , Maria J. Silva a3 , Toshio Sofuni a4 , Jordi Suralles a5 , Giorgio Trenta a6 , Irena Vorobtsova a7 , Anne Vral a8 , Andrea Zijno a9 a CSIRO Health Sciences and Nutrition, P.O. Box 10041, Adelaide, SA 5000, Australia b Department of Environmental Epidemiology, Istituto Nazionale per la Ricerca sul Cancro, L. go R. Benzi 10, I-16132 Genova, Italy c Institute of Environmental Health Sciences, National Yang Ming University Medical School, 155 Section 2 Lih-non Street, 11200 Taipei, Taiwan d School of Public Health, University of California, 217 Warren, Berkeley, CA 94720-7360, USA e Laboratory for Cell Genetics, Vrije Universiteit Brussel, Pleinlaan 2, 1050 Brussel, Belgium f Errol Zeiger Consulting, Chapel Hill, NC 27517, USA g Dipartimento di Biologia Animale e dell’ Uomo, University of Turin, V. Accademia Albertina 17, 10123 Turin, Italy h Toxicological Evaluation Unit, Istituto Nazionale per la Ricerca sul Cancro, L. go R. Benzi 10, 16132 Genova, Italy i Molecular Toxicology Laboratory, Third Military Medical University, Chong Qing 400038, China j ANPA, Via V. Brancati 48, 00144 Rome, Italy k Laboratorio Dosimetria Biologica, Autoridad Regulatoria Nuclear, Av. del Libertador 8250, 1429 Capital Federal, Buenos Aires, Argentina l Auckland Cancer Society Research Center, Private Bag 92019, Auckland 1000, New Zealand m Institute for Medical Research end Occupational Health, 10000 Zagreb, Ksaverska C2, Croatia n Centro de Proteccion e Higiene de las Radiaciones, Calle 20 No. 4109 e/41y47 Miramar, AP 6195 Habana 6, Cuba o Laboratory Radiation Mutagenesis, National Center Radiobiology and Radiation Protection, Bul. Kl. Ochridski 132, Sofia 1756, Bulgaria p Department of Pharmacology, University of Bologna, Via Irnerio 48, 40126 Bologna, Italy q Norwegian Radiation Protection Authority, P.O. Box 55, 1332 Oesteraas, Norway r Vinca Institute of Nuclear Sciences, Medical Protection Center, 300-110, P.O. Box 522, 11001 Belgrade, Yugoslavia s Cell Biology Division, Bhabha Atomic Research Center, Mumbai 400 085, India t Department of Radiation Oncology, Brody school of Medicine at ECU, Greenville, NC 27858, USA u DIMI, V. le Benedetto XV 2, 16132 Genoa, Italy ∗ Corresponding author. E-mail address: [email protected] (S. Bonassi). 1383-5718/02/$ – see front matter © 2002 Elsevier Science B.V. All rights reserved. PII:S1383-5718(02)00248-6
Transcript of Intra- and inter-laboratory variation in the scoring of ...superfund.berkeley.edu/pdf/221.pdfr Vinca...

Mutation Research 534 (2003) 45–64
Intra- and inter-laboratory variation in the scoring of micronucleiand nucleoplasmic bridges in binucleated human lymphocytes
Results of an international slide-scoring exerciseby the HUMN project
Michael Fenecha, Stefano Bonassib,∗, Julie Turnera, Cecilia Landob,Marcello Ceppib, Wushou Peter Changc, Nina Hollandd, Micheline Kirsch-Volderse,
Errol Zeigerf, Maria Paola Bigattig, Claudia Bolognesih, Jia Caoi, Giuseppe De Lucaj,Marina Di Giorgiok, Lynnette R. Fergusonl, Aleksandra Fucicm, Omar Garcia Liman,
Valeria V. Hadjidekovao, Patrizia Hreliap, Alicja Jaworskaq, Gordana Joksicr,A.P. Krishnajas, Tung-Kwang Leet, Antonietta Martelliu, Michael J. McKayv,
Lucia Migliorew, Ekaterina Mirkovax, Wolfgang-Ulrich Müllery, Youichi Odagiriz,Thierry Orsierea1, Maria Rosaria Scarfı̀ a2, Maria J. Silvaa3, Toshio Sofunia4,
Jordi Surallesa5, Giorgio Trentaa6, Irena Vorobtsovaa7, Anne Vrala8, Andrea Zijnoa9
a CSIRO Health Sciences and Nutrition, P.O. Box 10041, Adelaide, SA 5000, Australiab Department of Environmental Epidemiology, Istituto Nazionale per la Ricerca sul Cancro, L. go R. Benzi 10, I-16132 Genova, Italy
c Institute of Environmental Health Sciences, National Yang Ming University Medical School, 155 Section 2 Lih-non Street, 11200 Taipei,Taiwan
d School of Public Health, University of California, 217 Warren, Berkeley, CA 94720-7360, USAe Laboratory for Cell Genetics, Vrije Universiteit Brussel, Pleinlaan 2, 1050 Brussel, Belgium
f Errol Zeiger Consulting, Chapel Hill, NC 27517, USAg Dipartimento di Biologia Animale e dell’ Uomo, University of Turin, V. Accademia Albertina 17, 10123 Turin, Italyh Toxicological Evaluation Unit, Istituto Nazionale per la Ricerca sul Cancro, L. go R. Benzi 10, 16132 Genova, Italy
i Molecular Toxicology Laboratory, Third Military Medical University, Chong Qing 400038, Chinaj ANPA, Via V. Brancati 48, 00144 Rome, Italy
k Laboratorio Dosimetria Biologica, Autoridad Regulatoria Nuclear, Av. del Libertador 8250, 1429 Capital Federal, Buenos Aires, Argentinal Auckland Cancer Society Research Center, Private Bag 92019, Auckland 1000, New Zealand
m Institute for Medical Research end Occupational Health, 10000 Zagreb, Ksaverska C2, Croatian Centro de Proteccion e Higiene de las Radiaciones, Calle 20 No. 4109 e/41y47 Miramar, AP 6195 Habana 6, Cuba
o Laboratory Radiation Mutagenesis, National Center Radiobiology and Radiation Protection, Bul. Kl. Ochridski 132, Sofia 1756, Bulgariap Department of Pharmacology, University of Bologna, Via Irnerio 48, 40126 Bologna, Italy
q Norwegian Radiation Protection Authority, P.O. Box 55, 1332 Oesteraas, Norwayr Vinca Institute of Nuclear Sciences, Medical Protection Center, 300-110, P.O. Box 522, 11001 Belgrade, Yugoslavia
s Cell Biology Division, Bhabha Atomic Research Center, Mumbai 400 085, Indiat Department of Radiation Oncology, Brody school of Medicine at ECU, Greenville, NC 27858, USA
u DIMI, V. le Benedetto XV 2, 16132 Genoa, Italy
∗ Corresponding author.E-mail address:[email protected] (S. Bonassi).
1383-5718/02/$ – see front matter © 2002 Elsevier Science B.V. All rights reserved.PII: S1383-5718(02)00248-6

46 M. Fenech et al. / Mutation Research 534 (2003) 45–64
v Divisions of Radiation Oncology and Research, Peter McCallum Cancer Institute, Smorgon Family Building, St. Andrews Place EastMelbourne, Melbourne, Vic. 3002, Australia
w Dipartimento di Scienze dell’Uomo e dell’Ambiente, University of Pisa, Via S. Giuseppe 22, 56126 Pisa, Italyx National Center of Hygiene, Medical Ecology and Nutrition, 15 Boul. D. Nestorov, Sofia 1431, Bulgaria
y Institute fur Medizinische Strahlenbiologie, Universitatsklinikum Essen, Hufelandstrasse 55, D45122 Essen, Germanyz Division of Human and Health Sciences, Yamanashi Prefectural College of Nursing, 1-6-1 Ikeda, Kofu 400-0062, Japan
a1Laboratoire de Biogenotoxicologie et de Mutagenese Env., Faculte de Medicine, Universite de la Mediterranee,27 Bld. Jean Moulin, F-13385 Marseille Cedex 05, Francea2CNR-IRECE, Via Diocleziano 328, 80124 Naples, Italy
a3Centro de Genetica Humana, Portugal National Institute of Health, Av. Padre Cruz, 1649-016 Lisboa, Portugala4Chromosome Research Center, Olympus Optical Co. Ltd., 2-3 Kuboyama-cho, Hachioji-shi, Tokyo 192-8512, Japan
a5Dpt de Genetica i de Microbiologia, Facultat de Ciencies, Universitat Autonoma de Barcelona, 08193 Bellaterra, Barcelona, Spaina6DOSIME Group, Occupational Medicine Service, National Institute of Nuclear Physic, Via E. Fermi 40, 00044 Frascati (Rome), Italy
a7Central Research Institute of Roentgenology and Radiology, 189646 Leningradskaya Str. 70/4, Pesochny-2, St. Petersburg, Russiaa8Department of Radiation Protection, Faculty of Medicine, Proeftuinstraat 86, B-9000 Ghent, Belgium
a9Laboratory of Comparative Toxicology and Ecotoxicology, ISS, V. le Regina Elena 229, 00161 Rome, Italy
Received 6 May 2002; received in revised form 29 August 2002; accepted 20 September 2002
Abstract
One of the objectives of the HUman MicroNucleus (HUMN) project is to identify the methodological variables that have animportant impact on micronucleus (MN) or micronucleated (MNed) cell frequencies measured in human lymphocytes usingthe cytokinesis-block micronucleus assay. In a previous study we had shown that the scoring criteria used were likely to be animportant variable. To determine the extent of residual variation when laboratories scored cells from the same cultures usingthe same set of standard scoring criteria, an inter-laboratory slide-scoring exercise was performed among 34 laboratoriesfrom 21 countries with a total of 51 slide scorers involved. The results of this study show that even under these optimizedconditions there is a great variation in the MN frequency or MNed cell frequency obtained by individual laboratories andscorers. All laboratories ranked correctly the MNed cell frequency in cells from cultures that were unirradiated, or exposedto 1 or 2 Gy of gamma rays. The study also estimated that the intra-scorer median coefficient of variation for duplicate MNedcell frequency scores is 29% for unexposed cultures and 14 and 11% for cells exposed to 1 and 2 Gy, respectively. Thesevalues can be used as a standard for quality or acceptability of data in future studies. Using a Poisson regression model it wasestimated that radiation dose explained 67% of the variance, while staining method, cell sample, laboratory, and covarianceexplained 0.6, 0.3, 6.5, and 25.6% of the variance, respectively, leaving only 3.1% of the variance unexplained. As part of thisexercise, nucleoplasmic bridges were also estimated by the laboratories; however, inexperience in the use of this biomarkerof chromosome rearrangement was reflected in the much greater heterogeneity in the data and the unexplained variationestimated by the Poisson model. The results of these studies indicate clearly that even after standardizing culture and scoringconditions it will be necessary to calibrate scorers and laboratories if MN, MNed cell and nucleoplasmic bridge frequenciesare to be reliably compared among laboratories and among populations.© 2002 Elsevier Science B.V. All rights reserved.
Keywords:Micronucleus; HUMN project; Nucleoplasmic bridges; Scoring; Human lymphocytes; DNA damage; Variability; Protocol
1. Introduction
The HUman MicroNucleus (HUMN) Project isan international collaborative project which has
Abbreviations: BN, binucleated; CBMN assay, cytokinesis-block micronucleus assay; MN, micronucleus or micronuclei;MONO, mononucleated; MULT, multinucleated; NDI, nuclear di-vision index; NPB, nucleoplasmic bridge
three main goals: (a) compilation and comparisonof base-line micronucleus (MN) frequencies in hu-man populations to establish “normal” base-line fre-quencies of DNA damage and determine the maindemographic, environmental, and methodologicalvariables that impact on this index; (b) comparisonof the various methods used to measure MN frequen-cies in human blood and epithelial cells to identify

M. Fenech et al. / Mutation Research 534 (2003) 45–64 47
important methodological variables and establishstandard protocols to enable more reliable compari-son of data among laboratories and among popula-tions; and (c) to establish prospective epidemiologicalstudies aimed at determining whether the MN fre-quency predicts risk of cancer and other degenerativediseases associated with DNA damage and ageing[1,2].
The HUMN Project was established in 1997[1]and currently involves the participation of more than35 laboratories worldwide. The impetus for thisproject was derived from the widespread use of thecytokinesis-block micronucleus (CBMN) assay tostudy DNA damage in human populations, and therecognition that by 1997 more than 12,000 measure-ments in human subjects had been reported in theliterature using this method. Micronuclei are one ofthe best established biomarkers of chromosome dam-age. They are used in the in vitro testing of chemicalsand radiation for genotoxicity[3–5] and also as anin vivo biomarker of exposure to genotoxins, anddeficiency in folate and Vitamin B12[6–13]. Mi-cronuclei originate from chromosome fragments orwhole chromosomes that lag at anaphase because theylack a centromere, or the centromere is defective, orthere is a defect in the mechanism that enables thechromosomes to distribute correctly to the poles ofthe cell at anaphase[3–5]. As a consequence, MNare expressed in dividing cells. In human lympho-cytes some MN are present as a result of a priorcell division in vivo, but most MN are expressed inlymphocytes after the cells are stimulated to dividein vitro. The CBMN assay relies on the observationthat cells that have completed nuclear division andhave had their cytokinesis blocked with cytochalasin,express chromosome damage as MN in the resultingbinucleated (BN) cells[14–16]. It has recently beenshown that it is possible to also score nucleoplasmicbridges (NPB), in addition to MN, in BN cells[3,5].NPB are an important biomarker of chromosome re-arrangement that is otherwise not measured in theCBMN assay, and originate from dicentric chromo-somes that are pulled to opposite poles of the cell atanaphase[3,5].
The first objective of the HUMN project, i.e.compilation and comparison of data bases ofbase-line MN frequencies in human populations incytokinesis-blocked lymphocytes, has already been
completed and described[2]. This study of MN fre-quency in 6583 human subjects (measured in 25laboratories distributed in 16 countries) verified thatage and gender were the most important host factorsinfluencing baseline MN frequency. A model basedon the negative binomial function of probability wasused to estimate the proportion of variability of MNfrequency that can be explained by the studied param-eters. The total amount of variability explained by thecomplete model (which included host factors, expo-sure to genotoxic agents, methodological parametersrelating to culture, slide preparation and scoring cri-teria) was approximately 75%. Due to the correlationamong parameters investigated, the sum of varianceexplained by all individual sources is greater than thisvalue.
Because the CBMN assay is currently based onvisual scoring of slides, the inter-scorer variation inthe interpretation of scoring criteria and in the recog-nition of BN cells, MN, and NPB could account fora large proportion of the observed variability in theassay. Therefore, we designed an interlaboratory col-laborative study to determine the extent of variabilityin the frequency of MN and other abovementionedendpoints as a function of visual scoring of slidesby different laboratories and scorers, staining methodand radiation dose.
The specific aims of this study were
1. To determine the extent of inter-laboratory varia-tion in the MN assay scores when a common set ofscoring criteria is used to score cells sampled fromthe same culture.
2. To determine the extent of intra-laboratory andintra-scorer variation in the CBMN assay.
3. To determine the effect of different staining meth-ods on the micronucleus assay scores.
4. To evaluate the contribution of various parametersmeasured in the study to the total variability of theassay.
Other parallel aims were (a) to establish a com-prehensive set of scoring criteria with an extensiveset of photomicrographs to assist in the interpretationof slides (reported in accompanying paper[17]), and(b) to determine an acceptable coefficient of variationfor duplicate measurements by a single scorer as ameans for quality control of acceptable data in futurestudies.
48 M. Fenech et al. / Mutation Research 534 (2003) 45–64
2. Materials and methods
2.1. Study design
The study was advertised via the HUMN projectemail network. A total number of 34 laboratories from21 countries indicated an interest in participating andeach of these completed the study. Details about thelaboratories, including geographical location, affilia-tion, principal investigators, number of scorers, andthe staining method used is inTable 1.
The study design is shown schematically inFig. 1. A blood sample was collected from a healthy30-year-old male. Isolated lymphocyte cultures forthe CBMN assay were prepared using published pro-cedures[3,6,16]. Briefly, three cultures in RPMI 1640with 10% foetal calf serum were prepared with acell concentration of 1× 10⁶ ml−1. Two of the cul-tures were exposed to gamma-rays (1 or 2 Gy at adose rate of 5 Gy/min). The lymphocytes were stim-ulated to divide with phytohaemagglutin and 44 hlater cytochalasin-B (4.5 ug/ml) (Sigma) was addedand the cells harvested following an additional 28 h.A cytocentrifuge (Shandon) was used to prepareslides with two spots of cells on each slide. Thecells were air-dried for 10 min and then fixed in ab-solute methanol for 10 min. Half of the slides werestained with Diff-Quik (Lab-Aids, Australia) and therest left unstained and stored desiccated at 4◦C. Thestained slides were mounted in DEPEX using a cov-erslip. Forty-seven stained and 47 unstained slideswere prepared from each culture. The slides werecoded using random numbers.
During September 2000, each laboratory received(by express courier) a package that contained (a) adetailed set of instructions, (b) one set of fixed andstained slides (control, 1 and 2 Gy), (c) one set ofslides that were fixed but not stained (control, 1 and2 Gy), (d) a detailed scoring procedure with diagramsand photomicrographs, and (e) a standard Excel tem-plate for recording MN and NPB scores. Any brokenslides were replaced immediately with slides thathad been made from the same culture. The unstainedslides were stained upon arrival at the laboratoriesor kept desiccated at 4◦C until stained. Some labo-ratories (N = 6) had to alter their standard stainingprocedure by increasing staining time to adequatelystain the fixed, but unstained, slides. A second batch
Table 1Laboratories that contributed data to the HUMN inter-laboratorymethod comparison (affiliation can be obtained from the authorslist)
Country Principalresearcher(s)
Scorers Staining method
Argentina M. Di Giorgio 1 GiemsaAustralia M. Fenech 4 Diff-QuikAustralia M. McKay 1 DAPIa
Belgium M. Kirsch-Volders 2 GiemsaBelgium H. Thierens and
A. Vral1 Azure B—Eosin
Bulgaria V. Hadjidekova 1 GiemsaBulgaria E. Mirkova 1 GiemsaCroatia A. Fucic 1 GiemsaCuba O. Garcia Lima 1 GiemsaFrance T. Orsiere and
A. Botta1 Giemsa
Germany W.U. Muller 2 GiemsaIndia A.P. Krishnaja 2 GiemsaItaly P.M. Bigatti 2 Giemsab
Italy C. Bolognesi 2 GiemsaItaly G. De Luca 1 GiemsaItaly P. Hrelia 1 GiemsaItaly A. Martelli 2 May-Grunwald,
GiemsaItaly L. Migliore 2 GiemsaItaly M.R. Scarf̀ı 2 GiemsaItaly G. Trenta 1 GiemsaItaly A. Zijno 1 GiemsaJapan Y. Odagiri 1 GiemsaJapan T. Sofuni 1 Acridine Orangea
New Zealand L.R. Ferguson 1 GiemsaNorway A. Jaworska and
K. Bredholt2 Giemsa
Portugal M.J. Silva 1 GiemsaPR China J. Cao Jia 3 GiemsaRussia I. Vorobtsova 1 May Grunwald,
GiemsaSpain R. Marcos and
J. Suralles1 Giemsa
Taiwan W.P. Chang 1 HemacolorUSA N. Holland 4 DAPIa
USA T.K. Lee 1 Diff-QuikYugoslavia G. Joksic 1 Giemsa
The order of the laboratories in this table does not reflect theassigned laboratory numbers.
a Indicates fluorescent staining method.b Data not available for lab-stained slides because of difficulty
with staining of the unstained slides provided.
of fixed but unstained slides were sent (to four labora-tories) which were subsequently successfully stainedin two laboratories but not in the other two, whichwere therefore unable to provide scores for these

M. Fenech et al. / Mutation Research 534 (2003) 45–64 49
Fig. 1. Schematic diagram of the study design.
slides. Participants were advised to read the scoringprocedure and scoring criteria carefully and requestednot to proceed with scoring if they were uncertainabout any aspect of the scoring procedure. If the lab-
oratories had uncertainties regarding the proceduresto be followed, they were directed to consult with Dr.Michael Fenech, who was responsible for preparationof the slides. Participants were advised to record the

50 M. Fenech et al. / Mutation Research 534 (2003) 45–64
data in the Excel template provided and to send theresults to Dr. Stefano Bonassi by email by November30, 2000 for analysis. The results from each labora-tory were randomly allocated a code number from1 to 34 to allow a blind statistical analysis and toallow descriptions of results from single laboratories.After data collection we were informed that one lab-oratory did not follow the scoring criteria provided;their scores were excluded from the study, which istherefore based on results from 33 laboratories.
2.2. Scoring procedure
Each laboratory could choose to have more thanone person score the same set of slides, but a separatedata sheet had to be generated for each scorer. Eachscorer scored the full set of six slides (pre-stained andthose stained in their laboratory). Each scorer obtainedseparate scores for the cells in the spot closest to thelabel on the slide (spota) and the cells in the spotfarthest from the label (spotb) (a total of 12 spots).It was requested that cells in spota and spotb bescored on separate days to enable an analysis of theday to day variation in scoring and a derivation ofthe coefficient of variation for duplicate scores by onescorer. Information about the individual experience ofscorers involved in the study was collected in terms ofyears of scoring and number of slides scored per year.This allowed the calculation of a new variable, i.e.number of slides scored in their lifetime, which wasused in the following statistical analyses to measurethe influence of a scorer’s past experience.
For each spot of cells, the number of mononu-cleated (MONO) cells, binucleated (BN) cells, andmultinucleated (MULT) cells in 500 viable cells werescored to determine the nuclear division index (NDI),as previously described[3,18]. It is important to notethat participants were instructed not to score necroticor apoptotic cells when determining the proportionof MONO, BN and MULT cells. They were alsonot required to distinguish between tri-nucleated andquadri-nucleated cells when scoring multinucleatedcells because often it is hard to distinguish between thetwo and this adds an unnecessary burden to the assay.
For each spot of cells participants scored the fol-lowing to determine chromosome damage:
1. The number of cells in 1000 BN cells containingone or more micronuclei.
2. The total number of micronuclei in 1000 BNcells.
3. The number of cells in 1000 BN cells containingone or more nucleoplasmic bridges (NPBs).
A BN cell that has both a micronucleus and an NPBwas scored separately as a BN cell with a micronucleusand as a BN cell with a NPB.
Slides were examined at 1000× magnificationfor both light or fluorescence microscopy. Partic-ipants were requested not to score cells that theywere unable to classify according to the criteriaprovided. They were asked to simply skip any cellthat was unclassifiable and move on to the next.Similarly, MN and NPB where to be scored onlyif the scorer was confident that they met the givencriteria.
2.3. Scoring criteria
A standard set of detailed scoring criteria, togetherwith a comprehensive set of photomicrographs exem-plifying the various types of cells, micronuclei, andnucleoplasmic bridges, were provided to each labo-ratory. These scoring criteria and the set of photomi-crographs are described in the accompanying paper[17] and were based to a large extent on previouslypublished procedures which however, did not providephotomicrographs[3,18].
2.4. Statistical methods
A Poisson regression analysis[19] was performedto estimate the contribution of each covariate to thetotal variance. According to the study design, the datahave been considered as clusters which are hierarchi-cally nested as follows: laboratory, scorer, staining,irradiation, and spot. Since observationswithin acluster are (generally) more similar than observationsbetweenclusters, this lack of independence betweendata will lead to overdispersion, i.e. data showedmore residual variability than expected according toan ordinary regression model[19,20]. Ignoring theclustered nature of data generally causes an underes-timation of the variability of regression coefficients.A useful methodology that takes the hierarchicalstructure of the data into account is the multilevel ap-proach[21]. The simplest multilevel model contains a

M. Fenech et al. / Mutation Research 534 (2003) 45–64 51
two-level structure, i.e. individuals (first level) withingroups (second level). The model is
yij = α + αxij + ωj + αij
where an observationyij referring to theith indi-vidual in the jth group is modeled by the followingparameters:α, the overall mean;β, the regressioncoefficient of the predictor variablexij ; ωj , the de-parture of thejth group mean from the overall mean;andεij , the residual. In this model,α andβ representthe fixed part of the model whileωj and εj are therandom part. In particular, we assume thatωj followsa normal distribution with zero mean and varianceσ 2
w. The multilevel approach consists in estimatingα, β and σ 2
w. This last parameter is the index ofheterogeneity among groups. This is a parsimoniousmethod to quantify the differences among groupsavoiding the estimate of a regression coefficient foreach group. It is possible to evaluate the relative vari-ance component for each level of clustering, i.e. thewithin-laboratory variability in the estimate of the pa-rameter, the intra-laboratory-inter-scorer variability,the proportion of variance due to staining, and theheterogeneity between spots. Since our observationsare counts, we can fit a Poisson multilevel model toour data. All analyses were carried out with GLIM[22] and MLwiN [23] statistical software.
Table 2Descriptive statistics concerning endpoints evaluated in the standardization study
End-pointa Dose Gray Pre-stained slides (51 scorers) Lab-stained slides (44 scorers)
Median Mean S.D. Min–max Median Mean S.D. Min–max
MNed 0 8.0 8.8 4.3 2–28 7.0 7.4 3.3 1–191 116.5 118.4 29.8 59–217 95.0 98.8 33.5 35–2002 305.9 302.2 69.9 165–563 257.5 255.4 77.6 63–564
MN 0 9.0 9.8 4.9 2–28 7.6 8.0 3.7 1–231 138.5 140.8 37.1 61–265 105.0 115.3 39.5 36–2302 401.4 405.5 104.8 191–753 345.5 334.2 109.6 78–763
NPB 0 2.0 5.2 13.5 0–125 2.0 5.0 15.0 0–1211 18.0 22.3 18.1 3–124 16.8 19.6 16.0 0–932 45.1 51.8 36.7 9–300 36.2 40.8 29.0 1–191
NDI 0 1.95 1.94 0.18 1.56–2.47 1.92 1.92 0.19 1.49–2.391 1.89 1.88 0.19 1.44–2.37 1.86 1.84 0.19 1.43–2.212 1.77 1.75 0.15 1.45–2.19 1.73 1.74 0.15 1.39–2.12
a MNed, micronucleated cells per 1000 BN cells; MN, micronuclei per 1000 BN cells; NPB, nucleoplasmic bridges per 1000 BN cells;NDI, nuclear division index.
3. Results
All participating labs completed the scoring of thepre-stained slides. Only 2 labs (#1 and 22) were unableto adequately stain the unstained slides provided andwere therefore unable to provide data for this part ofthe study.
3.1. Descriptive statistics
A summary of results is reported inTable 2. Mea-sures of central tendency (median and mean) andvariability (S.D. and range) by dose of radiation arereported for each endpoint studied. Data from slidesstained by the referent laboratory (pre-stained) anddata from those stained by the preferred method ofparticipating laboratories (lab-stained) were analyzedseparately. An evident and significant positive as-sociation (P < 0.01) with the level of irradiationis present for all the genotoxicity end-points eval-uated apart from NDI, which decreased with dose(P < 0.01). The mean frequency of MN per 1000binucleated cells at 1 Gy is 8–11% higher that of mi-cronucleated cells (MNed) at the background level.This difference is more pronounced at higher dosesof irradiation, up to 34% at 2 Gy. The frequency ofMN scored on pre-stained slides was generally higher

52 M. Fenech et al. / Mutation Research 534 (2003) 45–64
than those of lab-stained slides, with a difference inmean values of 14% (P < 0.01).
Also in Table 2, it is evident that there is substan-tial overlap between MNed and MN in describing theeffect of irradiation. Scoring the number of MN percell gives a slightly better performance over scoringthe frequency of MNed (with a regression coefficient,β = 1.570 versus 1.452 in the trend test by dose),although the improvement in precision is offset bya higher variability of the MN index (standard error(S.E.) 0.032 versus 0.028). Considering that most lab-oratories prefer to report the frequency of MNed cells,and given the need of selecting among the overwhelm-ing amount of descriptive material we have produced,in the following parts of this paper we will describein detail only the MNed cell frequency data, with theunderstanding that graphs and statistics presented cor-respond closely to those obtained for MN.
The scoring of NPB was an important aspect ofthe protocol. This endpoint is not widely used as yet,and all but one of the participating laboratories wereinexperienced, having scored this biomarker for thefirst time within the framework of this study. A goodassociation of NPB frequency with the irradiation doseis present (β = 1.007;P < 0.01), but the large extentof variability observed when compared with scoringMNed cells and MN cells for a more intense effort tostandardize scoring procedures for this endpoint.
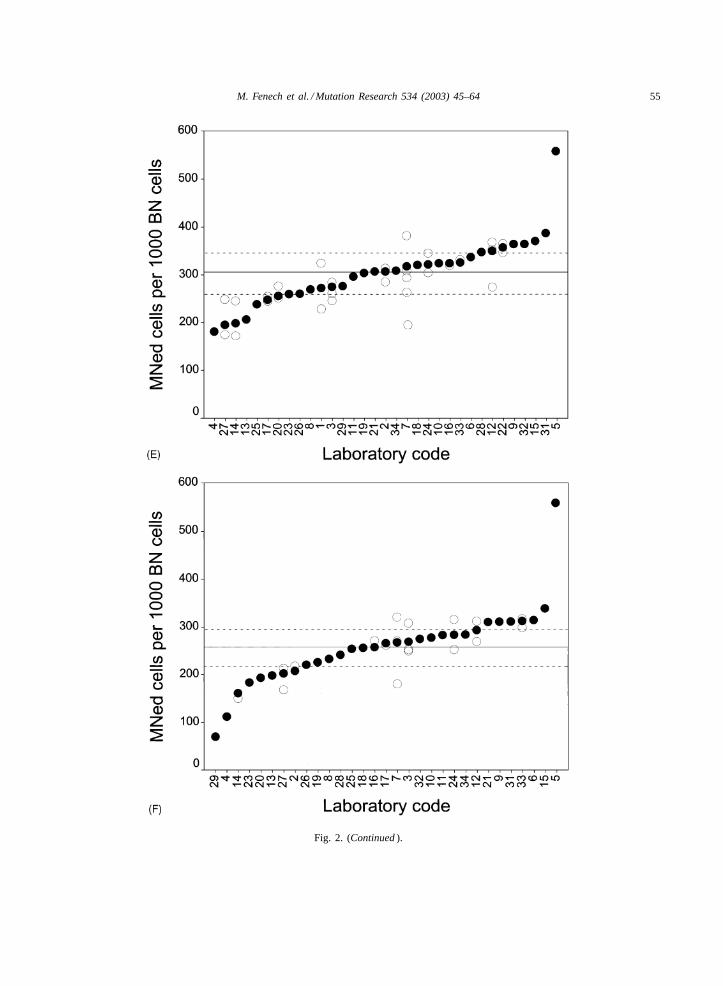
A broad picture of the results obtained from scor-ing MNed cells is given byFigs. 2A–F, which showthe frequency of this parameter in the 33 laborato-ries involved in the analysis, by level of irradiationand slide preparation method. To provide informationabout the intra-laboratory variability, results of singlescorers are reported for those laboratories with morethan one scorer. As a measure of central tendencywe chose the median, which is less affected by veryhigh values, which are not uncommon in this kind ofdata. Laboratories are ranked according to the medianvalue, which is represented by a closed black circle,with open circles representing single scorers. To pro-vide direct information about the variability of values,lines corresponding to the overall median and 25th and75th percentiles are reported in each figure.
The background values in non-irradiated cells(Fig. 2A and B), suggest that the large majority of lab-oratories are included between the lines correspond-ing to the critical percentiles. Values from the scoring
of pre-stained slides are slightly higher, not only asmedian values, but also as extreme measures, withthree laboratories reporting more than 17‰ MNedcells versus none in the set of laboratory-stainedslides. Some laboratories tend to consistently score ahigher frequency of MNed, i.e. laboratories 10, 24,31, whereas other laboratories change their ranks dra-matically according to the set of slides scored. This isthe case for laboratories 25 and 34, with scores in thelower tertile for pre-stained slides and in the mid-hightertile when lab-stained slides are scored. The resultsfrom labs 18 and 29 are remarkable; they each ob-tained MNed frequencies that were two- and four-foldhigher, respectively, in the pre-stained slides. In thislatter case, however, extreme frequencies of MNedcells (and also of MN and NPB) are concentrated inone of the spots of cells on the slide, lending supportto the hypothesis of a distribution anomaly when thecell suspension was spotted on the slides.
These inconsistencies in MNed cell frequencyscores are also observed for slides of irradiated cul-tures, with some laboratories constantly at the righttail of the distribution, e.g. #5, 15, and other labo-ratories showing great changes of rank when scoresfrom pre- and lab-stained slides are compared, e.g.#18, 24, 29, 31 (Fig. 2A–F).
The distribution of NPB scores is rather hetero-geneous, with large differences among laboratories.Some laboratories, e.g. #24, 26, showed a greater vari-ability with the presence of extreme values. Labora-tory 20 had values generally 10–20-fold higher thanthe overall median. The repeated presence of extremevalues is confirmed by the important difference be-tween mean and median and the large dichotomy ofmin–max values inTable 2.
3.2. Inter- and intra-scorer variability
Fig. 2A–Falso show the placement of each scorerin relation to their laboratory medians. Although amore analytic evaluation of inter-scorer variabilitywithin each laboratory is described later using mul-tivariable hierarchical models, these figures provideinteresting hints. Looking at the single combinationof staining method and dose of irradiation, some het-erogeneity becomes evident. A major aspect used toclassify scorer’s ability is the number of slides scoredin their lifetime. In Table 3, the ratio of the median

M. Fenech et al. / Mutation Research 534 (2003) 45–64 53
Fig. 2. (A) Laboratory MNed cell frequency scores (y-axis) for pre-stained slides from untreated cultures; (B) Laboratory MNed cellfrequency scores (y-axis) for lab-stained slides from control cultures; (C) Laboratory MNed cell frequency scores (y-axis) for pre-stainedslides from cultures exposed to 1 Gy; (D) Laboratory MNed cell frequency scores (y-axis) for lab-stained slides from cultures exposed to1 Gy; (E) Laboratory MNed cell frequency scores (y-axis) for pre-stained slides from cultures exposed to 2 Gy; (F) Laboratory MNed cellfrequency scores (y-axis) for lab-stained slides from cultures exposed to 2 Gy. The solid circles indicate the median of the results obtainedby each laboratory that is identified by the number on thex-axis. The open circles indicate the results of individual scorers in laboratoriesthat had more than one scorer completing the exercise. The solid line represents the overall median and the broken lines represent the25th and 75th percentiles.

54 M. Fenech et al. / Mutation Research 534 (2003) 45–64
Fig. 2. (Continued).
M. Fenech et al. / Mutation Research 534 (2003) 45–64 55
Fig. 2. (Continued).

56 M. Fenech et al. / Mutation Research 534 (2003) 45–64
Table 3The ratio of the median value of MNed cell frequency for 1 and2 Gy cultures vs. the control culture by number of slides scoredlifetime
Slides scoredlifetime
Scorers (slides) Median ratio
0 Gy 1 Gy 2 Gy
<51 4 (48) 1a 15.35 36.6751–500 14 (143) 1.36 16.74 38.59
>500 21 (252) 1.24 17.71 44.70
a Reference level.
value of MNed cell frequency for 1 and 2 Gy culturesversus the control culture clearly reflects the numberof slides scored previously, experienced scorers had abetter capability to discriminate the effect of irradi-ation. Those laboratories with two scorers (n = 10)showed overall inter-scorer differences below 25%,with the most homogeneous scoring in laboratories16 and 17. Laboratories with three or more scorers(n = 4) obviously produce more heterogeneity. Auseful and straightforward measure to express the in-ternal consistency of a scorer is the CV obtained fromthe discrepancy between spota and spotb scores. Thisstatistic, which is based on the ratio of the standarddeviation to the mean, simply describes the variabilityas a proportion of the mean. This value turned outto be strictly dependent on the radiation dose, withan increasing precision of the estimates with increas-ing dose of exposure.Fig. 3 shows this dependency,revealing a real difference between irradiated cells,which have a median intra-scorer CV’s for MNed of14 and 11% at 1 and 2 Gy, respectively, versus thenon-treated cells with a CV of 29%. A greater het-erogeneity for the set of untreated slides is evidentin Fig. 3, although some laboratories, e.g. laboratory#29, also had a great variability in irradiated cells.
These figures are consistent with those for MN. Incontrast the scorer CV for NPB are much higher, withmedian scorer values of 82, 26, and 23% at 0, 1, and2 Gy, respectively.
3.3. Measures of effect
In order to evaluate whether the MNed biomarkeris concordant in evaluating the effect of radiation,despite the heterogeneity found among absolute mea-sures of MNed frequency, the median MNed frequen-
cies at 2 and 1 Gy were compared with the frequenciesin the unexposed cells obtained from each laboratory.This exercise showed that irradiated cells experi-enced a higher frequency of MNed cells in pre- andlab-stained slides, in all laboratories, with a 14.3-foldhigher frequency of MNed cells in cultures irradiatedwith 1 Gy, and an increase of 37.3-fold in those irra-diated with 2 Gy. This pattern is overlapping in pre-and lab-stained slides for MNed cells and for MN.The distribution of single laboratories around thesevalues is exemplified inFig. 4. This figure refers tothe median ratio values of MNed cell frequency forcells exposed to 1 or 2 Gy (relative to the control cul-ture) based on all the slides scored (pre-stained andlab-stained) by each laboratory. All laboratories foundan increasing MNed cell frequency by dose, althoughto different extents. The effect for 1 Gy ranged from7.4- to 29.2-fold increase, and the 50% most frequentestimates were between 10.7 and 16.6, whereas ex-posing cells to 2 Gy caused a fold-increase of MNedcells ranging from 16.0 to 60.7, with the 50% mostfrequent estimates between 28.3 and 46.4.
The evaluation of NPB frequency in lab-stainedslides describes non-homogeneously the effect of ir-radiation. In this set of slides, three laboraratoriesscored more NPB in the 1 Gy slides than in the 2 Gyslides, and two laboratories scored the same numberof NPB at the two doses. This was not the case withthe pre-stained slides, where the differential effect oftwo doses was always correctly recognized. In general,however, there was a good correlation between MNedand NPB frequency in both pre- (0.63;P < 0.01) andlab-stained slides (0.57;P < 0.01). Six laboratoriesreported that radiation effects were similar for NPBand MNed cells; this suggests that, with appropriatetraining, the sensitivity and reliability of NPB scoringcan improve.
3.4. NDI
No evident differences in NDI were found betweenpre- and lab-stained slides. On the other hand, NDIwas negatively associated with the dose of irradiation(β = −0.090,P < 0.01), decreasing from a mean of1.93 in the untreated cells, to 1.86 at 1 Gy and 1.75 inthe 2 Gy set. The overall mean of this index was 1.85,with a S.D. of 0.19; values ranged between 1.39 and2.47 (seeTable 2).

M. Fenech et al. / Mutation Research 534 (2003) 45–64 57
Fig. 3. Intra-scorer coefficient of variation for spota and spotb. MNed, MN, and NPB frequency results for slides from unexposed, 1and 2 Gy cultures. The results shown as box and whisker plots represent the median, the 25th and 75th percentile, and range for data ofall scorers (N = 51).
3.5. Proportion of explained variability
One of the most important aspects in the standard-ization of an assay is the quantitative definition ofsources of variability. To provide an evaluation of thecontribution of various parameters to the general vari-ability of data, a Poisson regression model that in-cluded the main effects of all studied variables wasfitted to the whole database. A backward extraction ofvariables from this model allowed an estimation of thecontribution of each variable in terms of variability.
The results of this procedure are reported inFigs. 5and 6. The percentages reflect the independent contri-bution of each variable, but because these parametersare not orthogonal (i.e. not independent), a portion ofvariability is explained by the correlation of two ormore variables in the model. This part has been de-scribed as covariance.
From Fig. 5, it is evident that there is a very lowlevel of unexplained variance for MNed frequency, i.e.3.1%, partly due to the experimental design, whichtook the main explanatory variables into consideration,

58 M. Fenech et al. / Mutation Research 534 (2003) 45–64
Fig. 4. Open and solid circles represent the median ratio values for cells exposed to 1 and 2 Gy, respectively, vs. the control culture shownfor each laboratory, based on all the slides (pre- and lab-stained) scored. The horizontal lines represent the mean ratio values for 1 and2 Gy. The numbers on thex-axis are the laboratory code number. Note: the vertical lines between the open and closed circles are of nomathematical significance and are simply used to help distinguish results of a single laboratory.
but also to the good agreement among participatinglaboratories. The main response variable, i.e. the doseof irradiation, is responsible for almost two-thirds ofthe explained variability. This is an important observa-tion supporting the sensitivity of the test for the mon-itoring of this kind of exposure. The contribution oflaboratory to the variance is quite small, and this is notsurprising given that the individual contributions ofother variables responsible for the differences amonglaboratories, such as NDI, scorer, spot, and stainingmethod, are independently considered. The remainingvariance is due to external and unknown factors. Morethan a quarter of the variability is due to the covari-ance between variables.
A different pattern is evident for NPB, where theproportion of unexplained variance is over 20%. Thecontribution of the dose is only one-third, and the28.4% is attributable to unknown inter-laboratory fac-tors (Fig. 6). These results confirm the need of improv-ing training and scoring procedures for this endpoint.
The role of different methods used for laboratorystaining of the slides has been evaluated by sim-ply comparing the fluorescent versus non-fluorescentmethods. A 15% lower frequency of MNed cells(95% CI; 6–23%) was found in the slides stainedwith fluorescent methods. For the three laboratoriesthat chose fluorescence microscopy only 27% of thelaboratory mean scores were within the 25th and 75th

M. Fenech et al. / Mutation Research 534 (2003) 45–64 59
Fig. 5. Proportion of variance explained by variables in the model describing MNed frequency.
percentile compared to 56% for the laboratory meanscores from laboratories that chose light microscopymethods for scoring.
3.6. Measures of error
The design of this experiment has produced a typ-ical hierarchical structure of data, with each level ofaggregation nested within the following level. In eachlaboratory, scorers read slides stained by differentmethods, slides contained cells treated at differentdoses of radiation, and each slide had two cell sam-ples, each on a separate spot. At each level of clus-tering it is possible to estimate variance components,e.g. if we consider inter-laboratory variability, it ispossible to estimate how much of this variability isdue to the scorer, to slide treatment, to the irradiationdose, and to sampling error between the two spots,
and how much is due to external factors. This analysishas been performed in a subset of the whole database,i.e. in those laboratories with more than one scorer,to permit the evaluation of the variability due to thisparameter. Variance components estimates have beencalculated using random effects models, and the resultof this analysis is shown inTable 4. If we look at theMNed assay we see that all components investigated,excluding the scorer, showed a remarkable degree ofheterogeneity. The presence of this remaining uncer-tainty, despite the inclusion in the model of main po-tential predictors, means that there are other variablesresponsible for inter-laboratory differences that havenot been considered in our model. On the other hand,if we look at the variable describing the scorer wesee that this parameter is not significant. The reasonis that all variability due to the scorer is completelyexplained by differences in staining methods, dose,

60 M. Fenech et al. / Mutation Research 534 (2003) 45–64
Fig. 6. Proportion of variance explained by variables in the model describing NPB frequency.
Table 4Fixed and random coefficients of the multilevel hierarchical model for the three end-points considered
Model MNed MN NPB
Fixed partLog median ratio (S.E.)
Intercept −4.766 (0.181) −4.578 (0.199) −3.641 (0.891)Dose1 2.594 (0.044)a 2.641 (0.044)a 1.220 (0.183)a
Dose2 3.599 (0.045)a 3.721 (0.046)a 1.921 (0.195)a
NDI −0.053 (0.089) −0.093 (0.098) −0.683 (0.434)
Random partVariance component (S.E.)
Laboratory 0.023 (0.011)a 0.026 (0.014) 0.982 (0.441)a
Scorer 0.001 (0.006) 0.0001 (0.007) 0.0001 (0.0001)Stain 0.016 (0.007)a 0.019 (0.009)a 0.210 (0.117)Dose 0.012 (0.004)a 0.014 (0.004)a 0.663 (0.121)a
Spot 0.008 (0.002)a 0.014 (0.003)a 0.365 (0.047)a
Data include 13 laboratories (329 slides) with two or more scorers; S.E.: standard error.a Coefficient/S.E. ratio> 2.

M. Fenech et al. / Mutation Research 534 (2003) 45–64 61
Table 595% frequency intervals compatible with variance componentsestimated by the multilevel hierarchical model
0 Gy 1 Gy 2 Gy
MNed 5.1–12.6 68.9–169.6 176.4–434.8MN 5.3–14.4 76.8–208.6 221.6–602.1NPB 1.4–12.4 5.8–51.0 12.9–113.0
Note: the results refer to frequency per 1000 BN cells.
and spot. Once these variables are considered, scorersfrom the same laboratory provide homogeneous read-ings. This pattern is similar for all the three endpoints.
The first part ofTable 4 reports the log medianratio of fixed parameters representing the mean effectof dose and NDI. As would be expected, radiationdose is the strongest predictor of MNed frequency anddespite its inclusion in the fixed part of the modelthis variable generates further heterogeneity, as shownby the random term. The information about variancecomponents can be used to estimate the extent of theerror due to the known sources of variability.
These results can be used to estimate ranges of MNfrequency that are compatible with random variabil-ity due to major confounders. Using this approachwe found that when the variability due to laboratory,staining method, and spot, are considered, the base-line frequency of MNed cells is between 5.1 and 12.6MNed per 1000 BN cells. Similar estimates for allendpoints at different doses of irradiation are givenin Table 5.
4. Discussion
The practical use of a biomarker of DNA dam-age in population monitoring is limited by (a) itsreproducibility among laboratories when differentlaboratories attempt to compare their results obtainedfor their local populations, and (b) its reproducibilitywithin the same laboratory when a population (whichmay include the same subjects within a population)is being studied repeatedly and longitudinally over anextended time-frame (e.g. years). The identificationof factors affecting reproducibility in the CBMN as-say, and a measure of the reproducibility, is essentialfor the determination of absolute MN frequency, ac-curacy in biological dosimetry of genotoxic exposure,
and for the establishment of “normal” or “acceptable”base-line rates of chromosomal damage.
In spite of being provided slides prepared in identi-cal manner from samples from the same cultures therewas still a large extent of variation among laboratoryscores for MN frequency. It is plausible that some ofthis variation could have been due to real differencesbetween the cells in each sample. However, the factthat (a) each laboratory correctly ranked the slides ac-cording to radiation dose, and (b) those laboratoriesthat scored low or high values for one dose also did sofor the other doses, would tend to suggest that sam-pling differences are unlikely to be the main cause ofthe variability. The other possibility is that the inter-pretation of the scoring criteria provided, detailed asthey were, ultimately depends on the subjective evalu-ation of each scorer and laboratory, so that some labo-ratories may have been more cautious than others withregard to accepting a binucleated cell with a micronu-cleus. The other practical limitation of identifying andvisualising cells is the quality of the optics of the mi-croscope used; we have not measured this differencebetween laboratories, although it is a potential sourceof variation that should be considered in future stan-dardization studies.
We have observed considerable variation in theresults of different scorers even within experiencedlaboratories. Assuming that scorers within a specificlaboratory were using similar, or the same, micro-scopes it is still possible that there is variation in anindividual’s capacity to correctly identify a micronu-cleus or a nucleoplasmic bridge. Such discriminationwould depend on the filters used, the precise focus,and the visual capacity to clearly identify micronu-clear and nuclear boundaries. An important role isplayed by scorer’s experience, as demonstrated byresults inTable 4, which show that as the numberof events to be scored increased with the increasingradiation dose, the ability to discriminate betweenexposed and control cells is more evident in thosescorers with more experience. The observation of im-portant inter-scorer variability fits well with the con-clusion of Brown et al.[24] who also studied sourcesof variability in the CBMN assay using repeatedscoring of slides from one culture and comparingscores of three different scorers. The analysis of theirdata showed a consistent performance of scorers onrepeat counts and consistent, significant large differ-

62 M. Fenech et al. / Mutation Research 534 (2003) 45–64
ences in the results of different scorers. A measureof consistency of results from the same scorer is thecoefficient of variation (CV). The results for base-lineMN frequency CV for repeat counts by the samescorer values in this study (29%) are lower than thosereported by Radack et al.[25] (52%) who, however,based their estimates on repeat measures from 100BN cells instead of 1000 BN cells.
The extent of variation in the data for NPB wasmuch greater than the variation observed for MN, asis clearly shown by the data inFig. 3and comparisonof data inFigs. 5 and 6. This result was not unex-pected given that only one laboratory was experiencedin scoring this biomarker within the CBMN assay.Identification of NPB can be more difficult than iden-tifying MN because the thickness of an NPB oftencan be much smaller than the diameter of an MN. Inaddition, NPB can be difficult to identify when nucleiin a BN cell are close to each other. Nevertheless,the great majority of the laboratories (31 out of 33)correctly identified the rank of the radiation dose.
The results inTable 4 clearly show that intra-laboratory variability is almost completely ex-plained by the variables that we have included inthe experiment—staining, dose and spot—and nointer-scorer variability remains once these are con-trolled. In comparison, as regards inter-laboratoryvariability, additional laboratory-linked featuresshould be considered to fully understand this aspect.This high (and significant) degree of heterogeneityamong laboratories is mainly based on the results of alimited number of laboratories, which scored greatlydifferent frequencies of events from the majority.The use of random-effect models, which provides abetter modeling of variance over the Poisson regres-sion analysis, allowed the calculation of a range of‘reliable’ values for different endpoints and levelsof irradiation (Table 4). This estimate can be usedas a reference for all laboratories when scoring theendpoints described here.
The results of this study raise important questionswith respect to overcoming the inter-laboratory andinter-scorer variation, and indicate that even underclose to optimal conditions the calibration of scorersand laboratories remains an important requirement.This leads immediately to the important goal ofachieving a reliable procedure for calibrating scorersso that data from different scorers and laboratories
can be corrected to values that are reliably close to theabsolute/actual score. This goal could be achieved byusing a common set of slides or, more practically, aset of digitized images made available on the HUMNproject web site, together with detailed scoring in-structions. This same training module could be usedto train scorers to a standard method, thereby makingmore possible the achievement of comparable databetween laboratories. However, the use of digitizedimages does not take into account inter-laboratoryvariation in the quality of microscope optics, indi-cating that ultimately the use of a standard slide setshould also be used as a procedure for scorer cali-bration. Unraveling the effect of scoring criteria, theinfluence of microscope optics, and visual ability ofthe scorer, is a challenging scientific question in itself.
5. Conclusion
In conclusion, this inter-laboratory comparison hasproved to be a fruitful exercise. It has verified thatwith respect to visual measurement of micronucleiwe can confidently conclude that all laboratoriescorrectly classified the slides according to radiationdose, and that dose of radiation accounted for mostof the variation in the reported MNed cell frequency,while the importance of staining method was mini-mal. This study has estimated the expected CV forduplicate scores by the same scorer as being 29% forcontrol cultures and 11–14% for cultures with MNfrequencies that are an order of magnitude greaterthan that observed in control cultures. The reportingof intra-scorer CV values in the CBMN assay shouldbecome a standard requirement for all published stud-ies, and large CV values should be carefully notedwhen evaluating the quality of the data. The other im-portant product of this exercise was the developmentof a comprehensive set of scoring criteria for MN andNPB in human lymphocytes, as well as in other celltypes that can be scored in the CBMN assay, togetherwith a comprehensive set of line diagrams and pho-tomicrographs for illustration, which are described inthe accompanying paper[17]. Finally it is evident thatthe use of “calibration” or “control” slides is essentialto reduce intra- and inter-laboratory variability andto allow comparison of MN frequency data acrosslaboratories and populations.

M. Fenech et al. / Mutation Research 534 (2003) 45–64 63
Acknowledgements
The contribution of Ricardo Marcos, Alain Botta,Hubert Thierens, Kirsti Bredholt, Elena Szabova andothers who have contributed to this study with theirwork is kindly acknowledged. We are indebted to Prof.Annibale Biggeri, Florence, Italy, for his assistancewith the use of multilevel models. This work wassupported by grants funded by the Associazione Ital-iana per la Ricerca sul Cancro (AIRC) and the Eu-ropean Union 5th FP (QLRT-2000-00628). Interestedresearchers are invited to collaborate and to get intouch with any member of the steering committee ofthe HUMN project (M.F., S.B., W.P.C., N.H., M.K.V.,E.Z.). Further information can be found on the website of the project:http://www.HUMN.org
References
[1] M. Fenech, N. Holland, W.P. Chang, E. Zeiger, S.Bonassi, The HUman MicroNucleus project—an internationalcollaborative study on the use of the micronucleus techniquefor measuring DNA damage in humans, Mutat. Res. 428(1999) 271–283.
[2] S. Bonassi, M. Fenech, C. Lando, Y.-P. Lin, M. Ceppi, W.P.Chang, N. Holland, M. Kirsch-Volders, E. Zeiger, S. Ban, R.Barale, M.P. Bigatti, C. Bolognesi, C. Jia, M. Di Giorgio, L.R.Ferguson, A. Fucic, O. Garcia Lima, P. Hrelia, A.P. Krishnaja,T.-K. Lee, L. Migliore, L. Mikhalevich, E. Mirkova, P.Mosesso, W.-U. Müller, Y. Odagiri, M.R. Scarfı̀, E. Szabova,I. Vorobtsova, A. Vral, A. Zijno, The HUman MicroNucleusproject. International Data Base Comparison for resultswith the cytokinesis-block micronucleus assay in humanlymphocytes. Part I. Effect of laboratory protocol, scoringcriteria, and host factors on the frequency of micronuclei,Environ. Mol. Mutagen. 37 (2001) 31–45.
[3] M. Fenech, The in vitro micronucleus technique, Mutat. Res.455 (2000) 81–95.
[4] M. Kirsch-Volders, T. Sofuni, M. Aardema, S. Albertini, D.Eastmond, M. Fenech, M. Ishidate, E. Lorge, H. Norppa,J. Surrales, W. von der Hude, A. Wakata, Report from theIn Vitro Micronucleus Assay Working Group, Environ. Mol.Mutagen. 35 (2000) 167–172.
[5] K. Umegaki, M. Fenech, Cytokinesis-block micronucleusassay in WIL2-NS cells: a sensitive system to detectchromosomal damage induced by reactive oxygen species andactivated human neutrophils, Mutagenesis 15 (2000) 261–269.
[6] M. Fenech, C. Aitken, J. Rinaldi, Folate, Vitamin B12,homocysteine status and DNA damage in young Australianadults, Carcinogenesis 19 (1998) 1163–1171.
[7] M. Kirsch-Volders, A. Elhajouji, E. Cundari, P. VanHummelen, The in vitro micronucleus test: a multi-endpointassay to detect simultaneously mitotic delay, apoptosis,
chromosome breakage, chromosome loss and non-disjunction,Mutat. Res. 392 (1997) 19–30.
[8] W.P. Chang, B.F. Hwang, D. Wang, J.D. Wang, Cytogeneticeffect of chronic low-dose, low-dose-rate gamma-radiation inresidents of irradiated buildings, Lancet 350 (1997) 330–333.
[9] L.G. da Silva Augusto, S.R. Lieber, M.A. Ruiz, C.A.de Souza, Micronucleus monitoring to assess humanoccupational exposure to organochlorides, Environ. Mol.Mutagen. 29 (1997) 46–52.
[10] W.P. Chang, S.R. Lee, J. Tu, S.S. Hseu, Increasedmicronucleus formation in nurses with occupational nitrousoxide exposure in operating theaters, Environ. Mol. Mutagen.27 (1996) 93–97.
[11] W.A. Anwar, S.I. Salama, M.M. el Serafy, S.A. Hemida,A.S. Hafez, Chromosomal aberrations and micronucleusfrequency in nurses occupationally exposed to cytotoxicdrugs, Mutagenesis 9 (1994) 315–317.
[12] A.D. Tates, F.J. van Dam, F.A. de Zwart, F. Darroudi,A.T. Natarajan, P. Rossner, K. Peterkova, K. Peltonen, N.A.Demopoulos, G. Stephanou, D. Vlachodimitropoulos, R.J.Sram, Biological effect monitoring in industrial workers fromthe Czech Republic exposed to low levels of butadiene,Toxicology 113 (1996) 91–99.
[13] H. Norppa, S. Luomahaara, H. Heikanen, S. Roth, M. Sorsa,L. Renzi, C. Lindholm, Micronucleus assay in lymphocytes asa tool to biomonitor human exposure to aneuploidogens andclastogens, Environ. Health Perspect. 101 (Suppl 3) (1993)139–143.
[14] M. Fenech, A.A. Morley, Measurement of micronuclei inhuman lymphocytes, Mutat. Res. 148 (1985) 29–36.
[15] M. Fenech, A.A. Morley, Solutions to the kinetic problem inthe micronucleus assay, Cytobios 43 (1985) 223–246.
[16] M. Fenech, A.A. Morley, Cytokinesis−block micronucleusmethod in human lymphocytes: effect of in vivo ageing andlow−dose X−irradiation, Mutat. Res. 161 (1986) 193–198.
[17] M. Fenech, W.P. Chang, M. Kirsch-Volders, N. Holland, S.Bonassi, E. Zeiger, HUMN Project: detailed description ofthe scoring criteria for the cytokinesis-block micronucleusassay using isolated lymphocyte cultures, Mutat. Res. 534(2003) 65–75.
[18] M. Fenech, The cytokinesis-block micronucleus technique:a detailed description of the method and its application togenotoxicity studies in human populations, Mutat. Res. 285(1993) 35–44.
[19] M. Aitkin, D. Anderson, B. Francis, J. Hinde, StatisticalModelling in GLIM, Oxford Science Publications, ClaredonPress, Oxford, 1990.
[20] S. Bonassi, V. Fontana, M. Ceppi, R. Barale, A. Biggeri,Analysis of correlated data in human biomonitoring studies.The case of high SCE frequency cells (HFC), Mutat. Res.438 (1999) 13–21.
[21] H. Goldstein, Multilevel Statistical Models, Halsted, NewYork, 1995, p. 178.
[22] Generalized Linear Interactive Modeling (GLIM) System,Release 3.77, Numerical Algorithms Group, Oxford, UK,1987.
[23] J. Rasbash, W. Browne, H. Golgstein, M. Yang, I. Plewis,M. Healy, G. Woodhouse, D. Draper, I. Langford, T. Lewis,

64 M. Fenech et al. / Mutation Research 534 (2003) 45–64
MLwiN Version 2.0. Multilevel Models Project Institute ofEducation, University of London, London, 1999.
[24] J.K. Brown, A. Williams, H.R. Withers, K.T. Ow, C.Gramacho, R. Grey, C. Amies, Sources of variability in thedetermination of micronuclei in irradiated peripheral bloodlymphocytes, Mutat. Res. 389 (1997) 123–128.
[25] K.L. Radack, S.M. Pinney, G.K. Livingston, Sources ofvariability in the human lymphocyte micronucleus assay: apopulation-based study, Environ. Mol. Mutagen. 26 (1995)26–36.


![Review Open Access … · laulimalide, taxanes & epothilones, and vinca alkaloids (B) A B. The vinca binding site on microtubules[40] is different from that of other anti-tubulin](https://static.fdocuments.in/doc/165x107/5fa466c5caeba7406a2ca276/review-open-access-laulimalide-taxanes-epothilones-and-vinca-alkaloids.jpg)


