Into the detail Surveying financial statements in … the detail... Surveying financial statements...
44
1 Issue 5 June 2011 Into the detail... Surveying financial statements in annual reports – 2010 Introduction Since we did our survey on financial reporting in practice last year, we have had many discussions with preparers of financial statements on the difficulties of keeping track of the increasing volume of disclosure requirements in New Zealand equivalents to International Financial Reporting Requirements (NZ IFRS). Certainly financial statements aren’t getting any shorter with companies in our survey now presenting financial statements that are on average 42 pages long, up from 39 pages in 2009. We are not alone with these concerns. Earlier this year the International Accounting Standards Board (IASB) asked the Institute of Chartered Accountants of Scotland (ICAS) and the New Zealand Institute of Chartered Accountants (NZICA) to review IFRS in order to determine where disclosures could be reduced, with results to be provided to the IASB by the end of June 2011. We expect this will lead to further discussion and debate. We note, however, that discussion hasn’t just been about the standards themselves but also about how the requirements are applied in practice. The Financial Reporting Panel in the UK has an advisory panel looking at this topic with their publication Cutting Clutter: Combating clutter in annual reports 1 providing aids for preparers particularly in relation to cutting disclosures on immaterial items.
Transcript of Into the detail Surveying financial statements in … the detail... Surveying financial statements...

1
Issue 5June 2011
Into the detail...Surveying financial statements in annual reports – 2010
IntroductionSince we did our survey on financial reporting in practice last year, we have had many discussions with preparers of financial statements on the difficulties of keeping track of the increasing volume of disclosure requirements in New Zealand equivalents to International Financial Reporting Requirements (NZ IFRS). Certainly financial statements aren’t getting any shorter with companies in our survey now presenting financial statements that are on average 42 pages long, up from 39 pages in 2009.
We are not alone with these concerns. Earlier this year the International Accounting Standards Board (IASB) asked the Institute
of Chartered Accountants of Scotland (ICAS) and the New Zealand Institute of Chartered Accountants (NZICA) to review IFRS in order to determine where disclosures could be reduced, with results to be provided to the IASB by the end of June 2011. We expect this will lead to further discussion and debate.
We note, however, that discussion hasn’t just been about the standards themselves but also about how the requirements are applied in practice. The Financial Reporting Panel in the UK has an advisory panel looking at this topic with their publication Cutting Clutter: Combating clutter in annual reports1 providing aids for preparers particularly in relation to cutting disclosures on immaterial items.

2
The New Zealand Securities Commission has also commented on the need for preparers to consider materiality when putting together the financial statements. They held a workshop in July 2010 with preparers and auditors of financial statements to discuss some of the issues arising from their financial statement reviews and how financial reporting could be improved. Their key recommendation was for companies to review disclosures against the principle of “telling the story to users” in order to decide the level of detail to be included or excluded in the financial statements.
The purpose of this survey is to report on current reporting practices by companies complying with NZ IFRS and not where clutter can be cut, although some of our findings may provide clues to where disclosures could be reduced. Key findings for companies complying with NZ IFRS and IFRS include:
• 51% of companies have chosen to present one statement of comprehensive income. Of these, 16 companies had no items of other comprehensive income to report. The remaining 49% of companies chose to present two statements – an income statement and a statement of comprehensive income. Companies taking advantage of differential reporting
concesssions are less likely to provide two statements with only 6% electing this presentation.
• Accounting policies take up on average 14% of the financial statements. Many of these policies repeat the requirements of the accounting standards.
• The most commonly used market price sensitivity variations used is 100 basis points (1%) for interest rate exposures and 10% for foreign exchange exposures.
• 326 major sources of estimation uncertainty were disclosed by 99 companies, although only 18% of the uncertainties disclosed included the impact of reasonably possible changes in assumptions.
• The introduction of the new segment reporting standard, which requires disclosure on the same basis as internal management reporting, led to 18 companies changing their segments in 2010.
1Financial Reporting Panel Cutting Clutter: Combating clutter in annual reports (April 2011). Available at: http://www.frc.org.uk/images/uploaded/documents/Cutting%20clutter%20report%20April%2020112.pdf

Issue 5June 2011
3
Survey details:Our first publication last year in the Deloitte Financial Reporting Survey Series focused on the annual reports of 50 companies with June to September 2009 balance dates in order to provide insights leading into the June 2010 reporting period. This year we have focused on the 2010 annual reports of a sample of 100 companies complying with NZ IFRS and IFRS, with a separate sample of 30 companies taking advantage of differential reporting concessions. The sampling methodology is outlined in the Appendix. The objective of the survey is to build an understanding of how entities apply the financial reporting requirements in practice, and we will continue to follow these companies to see how financial reporting changes over time due to the changing influences of rules, recommendations, regulators and industry practice.
ContentsIntroduction
Survey results for 100 companies complying with NZ IFRS and IFRS
1. Overview of financial statements2. The financial year in perspective3. Presentation of the primary statements4. Accounting policies5. Segment reporting6. Risk management disclosures7. Estimates and judgements8. Financial instruments9. Other matters10. Impact of future standards
Survey results for 30 companies taking advantage of differential reporting concessions in NZ IFRS
11. Overview of financial statements12. Differential reporting concessions applied13. Presentation of the primary statements14. Other matters
Appendix: The survey population

4
Of our 100 companies, 78 are listed on the NZSX, nine are listed on the NZDX and the remaining 12 are other entity types (such as state owned enterprises, co-operatives and non-listed issuers) that are in the top 200 companies (by revenue) in New Zealand from the Deloitte / Management magazine article reported in December 2009.
Balance datesAs shown in Figure 1, June is the most common balance date (47%) for companies in the sample followed by March (28%) and December (11%).
Length of reportsFinancial statements (including the audit report but excluding trend statements or five year summaries) make up approximately 55% of the average length of an annual report, dropping slightly from 57% on average in 2008 and 2009. First time adoption of NZ IFRS by many companies in 2008 meant that reports were on average longer than in 2009, but this saving was short-lived with the average length of annual reports increasing past the 2008 average of 70 pages to 76 pages in 2010 as shown in Figure 2. Two of these additional pages derive from the financial statement component of the annual report which increased from 40 pages on average in 2008 to 42 pages in 2010, with a range of 10 to 90 pages shown in Figure 3. We noted five companies in the sample with short financial statements of less than 20 pages – these companies were primarily investment entities with simple balance sheets (mostly listed investments).
Survey results for 100 companies complying with NZ IFRS and IFRS
Highlights:
• Financial statements increased on average from 39 pages in 2009 to 42 pages in 2010
• The number of modified audit reports, primarily due to fundamental uncertainties regarding going concern, dropped from eight companies in 2009 to four companies in 2010
Sections 1 - 10 provide an overview of the 2010 annual reports of a random sample of 100 companies complying with New Zealand equivalents to International Financial Reporting Standards (NZ IFRS and IFRS). Information on the full survey population, from which the sample of 100 was selected, is set out in the Appendix.
1. Overview of financial statements

Issue 5June 2011
5
-
10
20
30
40
50
60
70
80
2010 2009 2008
Ave
rage
num
ber o
f pag
es
Figure 2: What is the average number of pages in an annual report?
Rest of the annual report
Financial statements
-
20
40
60
80
100
2010 2009 2008
Ave
rage
num
ber o
f pag
es
Figure 3: What is the average, maximum and minimum numberof pages in the financial statements?
Average
Maximum
Minimum
2%
28%
4%
47%
5%
3%
11%
Figure 1: What is the balance date for entities in the sample?
January, February
March
April, May
June
July
August, September
December
-
10
20
30
40
50
60
70
80
2010 2009 2008
Ave
rage
num
ber o
f pag
es
Figure 2: What is the average number of pages in an annual report?
Rest of the annual report
Financial statements
-
20
40
60
80
100
2010 2009 2008
Ave
rage
num
ber o
f pag
es
Figure 3: What is the average, maximum and minimum numberof pages in the financial statements?
Average
Maximum
Minimum
2%
28%
4%
47%
5%
3%
11%
Figure 1: What is the balance date for entities in the sample?
January, February
March
April, May
June
July
August, September
December

6
-
10
20
30
40
50
60
70
80
2010 2009 2008
Ave
rage
num
ber o
f pag
es
Figure 2: What is the average number of pages in an annual report?
Rest of the annual report
Financial statements
-
20
40
60
80
100
2010 2009 2008
Ave
rage
num
ber o
f pag
es
Figure 3: What is the average, maximum and minimum numberof pages in the financial statements?
Average
Maximum
Minimum
2%
28%
4%
47%
5%
3%
11%
Figure 1: What is the balance date for entities in the sample?
January, February
March
April, May
June
July
August, September
December

Issue 5June 2011
7
Speed of reportingListed companiesListed companies are required to make their annual report available within three months of the end of the financial year. On average listed companies reported within 59 days of the financial year end. Other than one company with a simple balance sheet (where the financial statements were approved within 15 days of balance date), the quickest listed companies manage to approve financial statements 33 days after balance date.
Unlisted companiesOnly 12 companies in the sample were not listed entities. The Companies Act 1993 requires companies to prepare an annual report within five months of balance date. Only three companies took advantage of this later deadline.
Nature of Audit ReportsIn 2010, only four companies in the sample had modified audit reports, primarily due to fundamental uncertainties due to going concern. This is an improvement on the previous year where eight companies from the same sample had modified audit reports.
Statement of complianceCompanies in our sample should provide a statement of compliance that the financial statements have been prepared in accordance with New Zealand generally accepted accounting practice (NZ GAAP), together with a description of the financial reporting standards applied by the company (which is NZ IFRS for our sample). If the company’s financial statements also comply with International Financial Reporting Standards (IFRS) an explicit and unreserved statement should also be made. The majority of companies (96%) provided the required description of compliance with NZ GAAP, NZ IFRS and IFRS. Of the other four companies:
• two made reference to NZ GAAP and IFRS but not to NZ IFRS,
• one did not make reference to IFRS, and
• one provided a statement of compliance that said “compliance with NZ IFRS ensures that the financial statements also comply with IFRS”. The Securities Commission has previously stated that this is not an unreserved statement of compliance with IFRS (as it is made in reference to NZ IFRS).

8
In our 2009 survey commentary in annual reports was largely negative with references to “dismal market conditions”, “almost unprecedented volatility” and “difficult trading conditions”. Annual report commentary in 2010 reports was less pessimistic, with many noting that while conditions “remain very challenging”, initiatives undertaken in prior years (during the recession) had prepared them well, and looking forward “2011 has the potential to be a very good year for shareholders”.
On average, companies in the survey saw a 70% improvement in profit before tax, which dropped to a 42% increase in profit after tax. This difference is not surprising as 40 companies in the sample recorded over $859 million in tax expenses due to the removal of depreciation deductions being allowed on long life buildings (noting that companies with a balance date before the budget announcement in May 2010 are not included in this figure). Much of the commentary noted that this was a “non-cash, one-off adjustment in the current year”, with only five companies outlining the impact that the change will have on their cash flow position in future years due to not being able to claim depreciation deductions against income tax. We note that some of the tax expense incurred in respect of investment properties held at fair value will be removed when companies retrospectively adopt an amendment to NZ IAS 12: Income taxes.
Figure 4 sets out the costs recorded for impairment, onerous contracts and restructuring in 2010 and 2009 financial statements for the 100 companies in our sample. In total, these costs dropped from over $1 billion in 2009 to only $510 million in 2010. Offsetting these costs was an increase in reversals of impairment with $101 million recorded in 2010 compared to $3 million in 2009.
2. The financial year in perspective
Highlights:
• 70% of companies saw an improvement in profit before tax
• The level of impairments, onerous contracts and restructuring costs declined in 2010 by half compared to the prior year
• $101 million of impairments recorded in prior years were reversed in 2010

Issue 5June 2011
9
Looking aheadDespite the above improved results, 30% of companies experienced a decline in profit before tax, and commentary from some companies suggests that 2011 will still be “very challenging”. As we noted in last year’s survey, we will continue to look forward with interest to see what happens. For example:
• Will there continue to be reversals of asset impairments (other than for goodwill and available-for-sale financial assets)?
• Will there be increased dilution in earnings per share as options come back ‘into the money’?
• Will there be more mergers and acquisitions?
• Will there be sufficient future taxable profits estimated in order to recognise deferred tax assets?
600500400300200100
Figure 4: What impairment and other related costs were incurred?
NZD Million
2009
2010
Other writeoffs/impairments
Onerous contract costs
Financial asset impairment
PP&E impairment
Inventory write offs
Goodwill and intangibles impairment
Restructuring costs

10
Total Comprehensive IncomeThe introduction of NZ IAS 1: Presentation of financial statements (revised in 2007) required entities to decide whether to present all items of income and expense (including those accounted for directly in equity) as a single statement (a ‘statement of comprehensive income’) or in two statements (a separate ‘income statement’ and a ‘statement of comprehensive income’).
49% of the sample chose to present two statements, with the remainder presenting one statement. We note that of the 17 companies in our sample with no items of other comprehensive income 16 chose the one statement format.
Presenting items of income or expense (the ‘income statement’)The level of detail provided about items of income and expense on the face of the primary statement varied greatly between companies. The number of lines from the top of the statement to the profit after tax total, ranged from six to 34 lines with an average of 17 lines, showing that most companies provide more information than the minimum six lines prescribed by NZ IAS 1.
While there is no specific requirement to show operating expenditure on the face of the income statement, NZ IAS 1 allows companies to present expenses either by function or by nature. The most common presentation (60%) was classification by nature, such as changes in inventories of finished goods, employee benefits expense, depreciation, or impairment costs. However, presentation by function (such as cost of sales or administrative activities) was used by 26% of companies. 7% of companies provided a mixed presentation and 6% did not classify their expenses on the face of the income statement, although further detail was provided in the notes.
3. Presentation of the primary statements
Highlights:
• 51% of companies presented the statement of comprehensive income as one statement with 49% showing it as two statements (an income statement and a statement of comprehensive income)
• 60% of companies present expenses according to their nature, such as employee benefits, impairment or depreciation
• The most common order of the primary statements is statement of comprehensive income (as one or two statements), statement of changes in equity, balance sheet and cash flow statement (other statement names may be used)

Issue 5June 2011
11
A New Zealand specific requirement is to disclose the fees paid to auditors as well as the nature of fees paid for non-audit services. 23 companies either did not provide detail or used phrases such as “other assurance services” instead of detailing the nature of the non-audit work undertaken.
Issue 6 of our survey series, Underlying Profit Revisited, has looked at the ways companies provide alternative profit measures. While alternative measures are sprinkled through the annual report, 59% of companies provided sub totals on the face of the income statement that are not required by NZ IAS 1. For example, earnings before interest, tax, depreciation and amortisation (EBITDA), or operating profit
before gains and losses, finance costs and tax. For more information and guidance on reporting underlying profit measures refer to Issue 6 in the Deloitte Financial Reporting Survey Series.
Presenting items of other comprehensive incomeThe most common items that companies classify as other comprehensive income are cash flow hedges followed by translations of foreign operations as shown in Figure 5 below. We identified four companies which included movements in their share based payment reserve as part of other comprehensive income instead of in the statement of changes in equity as a transaction with owners.
0 10 20 30 40 50 60 70
0 10 20 30 40 50
0 10 20 30 40 50
60 70
Changes in cash flow hedging
Gains/losses translating foreign operations
Change in property revaluations
Available-for-sale financial assets
Other
None
Figure 5: What items of other comprehensive income do companies have?
Other
Foreign currency translation reserve
Cash flow hedge reserve
Equity settled share reserve
Available-for-sale reserve
Property revaluation reserve
Figure 7: What reserves do companies have?
Figure 10: What types of externally imposed capital requirements are there?
Number of companies
Number of companies
Number of companies
Regulator/legislative requirements
No capital risk management note
Trust deed requirements
Multiple requirements
Loan agreements
No requirements disclosed

12
NZ IAS 1 allows items of other comprehensive income to be presented either gross or net of tax. If a net presentation is selected, the tax on each item of other comprehensive income should be disclosed in the notes. Options for presentation taken by companies are outlined in Figure 6.
Reporting changes in equityPreviously, companies had a choice to present either a statement of recognised income and expense or a statement of changes in equity. The latter statement is now required under NZ IAS 1. Following various amendments to NZ IAS 1, the most recent version of the standard requires the statement of changes in equity to include “for each component of equity, a reconciliation between the carrying amount at the beginning and the end of the period” with
separate presentation of changes resulting from profit or loss, other comprehensive income, and transactions with owners in their capacity as owners (although contributions, distributions and changes in ownership interests should all be shown separately). An analysis of other comprehensive income by item can be presented either in the statement or in the notes. We noted that:
• 54 companies disclosed all required items separately with profit or loss, other comprehensive income, and transactions with owners shown by reserve,
• 7 companies disclosed as above but combined reserves together into one ‘reserves’ column,
29%
24%
30%
17%
Gross presentation, one tax line
Gross presentation, tax line for each item
Net presentation
Either no items of OCI or no tax shown
Figure 6: Are items of other comprehensive income (OCI) presented gross or net of tax?
21%
10%
20%
2%9%
6%
32%
Figure 9: Who is identified as the chief operating decision maker?
Board
Chief Executive/Managing Director
Board and management
Board and Chief Executive
Management
Other
Not disclosed/not applicable
16%
19%
62%
3%Full list provided
Relevant items disclosed with note that others are not relevant
Only relevant items disclosed
Not disclosed
Figure 8: How are standards and interpretations in issue but not yet effective disclosed?

Issue 5June 2011
13
• 16 companies disclosed each reserve, but combined profit or loss with other comprehensive income to show one line as total comprehensive income, and
• 23 companies showed equity in total with movements in each component (share capital, retained earnings and reserves where applicable) disclosed in the notes to the financial statements.
Balance sheet91% of companies presented a balance sheet with current and non-current subtotals and 8% presented it in order of liquidity. The remaining company split their balance sheet into sections with the finance business shown in order of liquidity and the rest as current and non-current.
As shown in Figure 7, the most common reserve presented, other than share capital and retained earnings, was a cash flow hedge reserve (62%). NZ IAS 1 requires a description of the nature and purpose of each reserve within equity. 6% of companies did not explain the nature and purpose of their reserves and 7% only explained some of their reserves in the summary of accounting policies.
24 companies had a share based payment reserve to track the value of equity settled share based payments accruing for employees, although 52 companies outlined schemes in place in 2010. We note that the use of a separate reserve is not mandated (instead amounts could go through retained earnings or share capital) and a reserve is not required for cash settled schemes.
0 10 20 30 40 50 60 70
0 10 20 30 40 50
0 10 20 30 40 50
60 70
Changes in cash flow hedging
Gains/losses translating foreign operations
Change in property revaluations
Available-for-sale financial assets
Other
None
Figure 5: What items of other comprehensive income do companies have?
Other
Foreign currency translation reserve
Cash flow hedge reserve
Equity settled share reserve
Available-for-sale reserve
Property revaluation reserve
Figure 7: What reserves do companies have?
Figure 10: What types of externally imposed capital requirements are there?
Number of companies
Number of companies
Number of companies
Regulator/legislative requirements
No capital risk management note
Trust deed requirements
Multiple requirements
Loan agreements
No requirements disclosed

14
Three balance sheets?Three companies showed a third balance sheet in their 2010 financial statements, as required by NZ IAS 1 when “an entity applies an accounting policy retrospectively or makes a retrospective restatement of items in its financial statements, or when it reclassifies items in its financial statements”. The objective of this requirement is to enhance comparability. These companies all had changes in accounting policies, one due to the adoption of NZ IFRS 9: Financial Instruments (where the company chose to restrospectively apply the requirements of the standard). Nine companies disclosed reclassifications of items but did not provide a third balance sheet, however these reclassifications were mostly to provide additional detail in the notes (such as separating related party payables from other payables) or to gross up income and expenditure instead of showing them net with no impact on net assets.
Cash flow statementNZ IFRS requires the presentation of a cash flow statement using the direct method as a primary statement in addition to a reconciliation of cash flows using the indirect method. All companies provided a cash flow statement using the direct method. 79% showed the reconciliation in the notes to the financial statements and 21% provided the reconciliation immediately after the cash flow statement.
NZ IFRS has previously differed to the international standard in this respect, as IFRS allows companies to choose their presentation between the two formats. As part of New Zealand’s harmonisation project with Australia, a recent amendment to NZ IAS 7: Statement of Cash Flows, proposes aligning NZ IFRS with IFRS in this respect. Use of the direct method is encouraged, although if the direct method is used the new FRS 44: New Zealand Additional Disclosures, will require a reconciliation of operating cash flows to profit or loss. The amendment to NZ IAS 7 and FRS 44 both become applicable for annual reporting periods commencing on or after 1 July 2011 (and can be early adopted).
Interest paid and interest and dividends received may be classified as operating, investing or financing cash flows. Classification of interest paid and interest and dividends received was predominantly as an operating cash flow except that:
• two companies presented interest received as an investing cash flow,
• three companies presented interest received as a financing cash flow,
• eight companies presented interest paid as a financing cash flow, and
• three companies showed dividends received as investing cash flows.

Issue 5June 2011
15
We also noted that 18 companies combined certain receipts and payments to present a net cash flow such as “net loan repayments”, without providing reasons why they were set off. This has previously been a specific New Zealand disclosure requirement although will no longer be required when FRS 44 is adopted.
Order of statements and notesThe most common order to present the primary statements is to start with the statement of comprehensive income (as either one or two statements) followed by the statement of changes in equity, balance sheet and cash flow statement (or other naming conventions used as appropriate). This order was presented by 58 companies. 31 companies modified this order by swapping the balance sheet and statement of changes in equity. Only four companies showed the balance sheet first. Seven companies presented different ordering such as showing the cash flow statement as the second or third primary statement.
In regards to the order of notes, NZ IAS 1 asks for notes to be presented “in a systematic manner” which is typically an order that follows how items are presented in the primary statements. The Securities Commission considers that issuers should “prioritise notes in financial statements and emphasise key areas of judgement and disclosures that reflect how the entity is actually managed2”.
Some companies have achieved this by putting key notes such as going concern, critical estimates and judgements, segment reporting, financial risk management and capital risk management up front after the accounting policies followed by notes on items as presented in the primary statements. For example, a financial institution had the financial risk management first after the accounting policies to explain how it managed its most significant risk.
2New Zealand Securities Commission Financial Reporting Surveillance Programme – Review of Financial Reporting by Issuers Cycle 12. October 2010

16
4. Accounting policies
A summary of accounting policies and other explanatory notes is a required component of the financial statements and often takes up a significant proportion of the statements. Excluding items that are not strictly accounting policies (critical judgements and estimates, reporting standards in issue but not yet effective, basis of preparation, statement of compliance and company information) on average 14% of financial statements are accounting policies with ten companies giving more than 20% of their financial statements to explaining their accounting policies.
One of the areas the Securities Commission has suggested to cut clutter in financial statements, is to remove accounting policies for items that have no underlying economic activity (in the current or prior year). For example, we noted 26 companies that had an accounting policy for fair value hedging, yet had no evidence of such hedging in the financial statements. We also noted 10 companies which had policies for cash flow hedging or net investment hedging where there was no underlying activity.
Standards and interpretations in issue but not yet effectiveNZ IAS 8: Accounting Policies, Changes in Accounting Estimates and Errors requires disclosure of a listing of standards and interpretations in issue but not yet effective, as well as the anticipated impact on the financial statements of each of these. How this information is provided varies as shown in Figure 8 opposite.
82% of companies provided detail on the impact that standards and interpretations on issue but not yet effective would have on the company, with 11% providing some detail but not covering all items raised. A common response used is to state that the company “is still considering the possible impact of the standard”, particularly in regards to NZ IFRS 9 which was initially issued in New Zealand in November 2009. The remaining companies did not provide any information on the possible impact of the change.
Changes in accounting policies and reclassificationsAs noted above, only one company chose to early adopt NZ IFRS 9. The impact of early adoption for this company related to its investments in unlisted equities, which were classified as at fair value through other comprehensive income (FVTOCI) under the new standard. Unlike the previous available-
Highlights:
• Accounting policies make up on average 14% of the financial statements
• 82% of companies disclose the impact of all relevant standards on issue but not yet effective

Issue 5June 2011
17
for-sale category, the FVTOCI category does not require recycling of impairment to profit or loss when the fair value of the investment falls below its initial cost.
When accounting policies are changed, NZ IAS 8 requires information on the impact of the change on the current or any prior period. This disclosure is generally provided where the change affects comparative information, but is not always provided where a change in standard does not require restatement of comparatives. Arguably, even standards with prospective application, such as the revised NZ IFRS 3: Business combinations, impact current year results.
ReclassificationsIn addition to the nine companies that discussed reclassifications to comparative figures as discussed on page 14, there were 19 companies included a generic sentence in the financial statements to the effect that “certain comparatives have been restated to ensure consistency of disclosure with the current period”. Sometimes this statement was made by reference to the adoption of NZ IAS 1 which changed the presentation of items of other comprehensive income and required a statement of changes in equity, although in eight cases this link was not clearly outlined.
29%
24%
30%
17%
Gross presentation, one tax line
Gross presentation, tax line for each item
Net presentation
Either no items of OCI or no tax shown
Figure 6: Are items of other comprehensive income (OCI) presented gross or net of tax?
21%
10%
20%
2%9%
6%
32%
Figure 9: Who is identified as the chief operating decision maker?
Board
Chief Executive/Managing Director
Board and management
Board and Chief Executive
Management
Other
Not disclosed/not applicable
16%
19%
62%
3%Full list provided
Relevant items disclosed with note that others are not relevant
Only relevant items disclosed
Not disclosed
Figure 8: How are standards and interpretations in issue but not yet effective disclosed?

18
5. Segment reporting
internal management reporting used for strategic decision making. Segment reporting is based on the internal reports used by an entity’s “chief operating decision maker” so that users of financial statements can obtain a better perspective of how the business is managed.
Was there a change in segments as a result of adopting NZ IFRS 8?18 companies noted that there was a change in their segments as a result of adopting NZ IFRS 8, with 19 companies clearly stating that there was no change in segments on adopting the standard. For the remainder of the sample, the standard was either not applicable or it was not clear whether there was a change in segment reporting.
29%
24%
30%
17%
Gross presentation, one tax line
Gross presentation, tax line for each item
Net presentation
Either no items of OCI or no tax shown
Figure 6: Are items of other comprehensive income (OCI) presented gross or net of tax?
21%
10%
20%
2%9%
6%
32%
Figure 9: Who is identified as the chief operating decision maker?
Board
Chief Executive/Managing Director
Board and management
Board and Chief Executive
Management
Other
Not disclosed/not applicable
16%
19%
62%
3%Full list provided
Relevant items disclosed with note that others are not relevant
Only relevant items disclosed
Not disclosed
Figure 8: How are standards and interpretations in issue but not yet effective disclosed?
Highlights:
• 18 companies changed their operating segments on adoption of NZ IFRS 8
• Segments are most commonly shown by business type
NZ IFRS 8: Operating segments is now mandatory for entities whose debt or equity instruments are traded in a public market, as well as for entities that file, or are in the process of filing, financial statements for the purpose of issuing any class of instruments in a public market. It requires companies to provide segment information on the same basis as

Issue 5June 2011
19
Who is the chief operating decision maker?While NZ IFRS 8 does not require disclosure of who the “chief operating decision maker” is, 68% of companies provided this information as shown in Figure 9.
How many and what type of segments are reported?28 companies reported only one segment, although three of these noted that they had more segments but had applied the aggregation criteria so only had one reportable segment. The maximum number of segments provided was seven.
Segments are most commonly shown by business type (61 companies), with 15 companies giving a geographical split. 13 companies had mixed presentations and a segment note was not provided by the remaining 11 companies (as they did not have listed shares and had not elected to provide disclosure).
Location of segment reportingThe segment note can provide useful information for investors on how the company views its business, particularly if there is more than one segment. 46 companies disclosed their segment note upfront following the accounting policies, emphasising its importance. One company provided a separate statement in the middle of their
primary statements instead of as a note, and another company provided a segment note but the details of assets and liabilities by segment were disclosed on the face of the balance sheet as separate columns for the two segments identified.
Consistency of segment disclosureThere were 28 companies where the annual report did not discuss the business in the same way as the segment reporting note. In some cases this might be due to the company applying aggregation criteria to report fewer segments than it assesses internally.
Major customersNZ IFRS 8 requires companies to disclose information about their reliance on major customers if revenues from transactions with a single customer exceed 10% of a company’s revenues. Some companies made this disclosure in their credit risk note instead of the segment note, however there were 48 companies who did not disclose any major customers, possibly because there were none.

20
6. Risk management disclosures
Capital risk management disclosuresCapital risk management disclosures can provide useful information for investors on the health of a business. Informative disclosures should provide users with information on the entity’s risk profile and its ability to withstand unexpected adverse events and may also indicate whether an entity is able to pay dividends.
NZ IFRS requires the disclosure of information for users on an entity’s objectives, policies and processes for managing capital. NZ IAS 1.135 explains that this objective is met by disclosing qualitative and quantitative data with specific requirement for disclosure of what the entity manages as capital, whether there are any external capital requirements and how those requirements are managed.
In addition, we note that capital risk management disclosures provided in the financial statements should be consistent with disclosure provided in the annual report. In considering the below questions, we noted several instances where the director’s report or CEO’s report provided detailed information on capital risk management, such as gearing ratios and changes to capital risk management objectives, which was not included in the financial statements.
Does the note outline what balances are considered to be capital? Can these be reconciled to the balance sheet?73 companies outlined what items on the balance sheet were considered to be capital either through a table or commentary which could be reconciled back to the balance sheet. 23 companies did not outline what they considered to be capital and the remaining four companies did not provide a capital risk management note.
Are the key objectives and policies for capital management explained? Do these include quantified targets against which performance is measured? How often are policies reviewed?The quality of disclosure in this area varied widely. 60 companies provided some detail of their capital risk management objectives and policies. Particularly informative policy disclosure included key ratios used to evaluate
Highlights:
• 51% of companies disclosed externally imposed capital requirements
• The most commonly used market price sensitivity variation used is 100 basis points (1%) for interest rate exposures and 10% for foreign exchange exposures
Issue 5June 2011
21
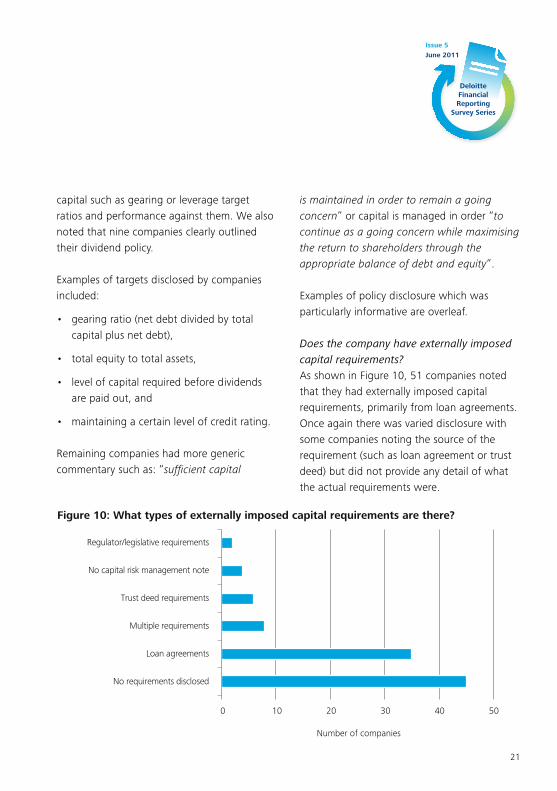
capital such as gearing or leverage target ratios and performance against them. We also noted that nine companies clearly outlined their dividend policy.
Examples of targets disclosed by companies included:
• gearing ratio (net debt divided by total capital plus net debt),
• total equity to total assets,
• level of capital required before dividends are paid out, and
• maintaining a certain level of credit rating.
Remaining companies had more generic commentary such as: “sufficient capital
is maintained in order to remain a going concern” or capital is managed in order “to continue as a going concern while maximising the return to shareholders through the appropriate balance of debt and equity”.
Examples of policy disclosure which was particularly informative are overleaf.
Does the company have externally imposed capital requirements?As shown in Figure 10, 51 companies noted that they had externally imposed capital requirements, primarily from loan agreements. Once again there was varied disclosure with some companies noting the source of the requirement (such as loan agreement or trust deed) but did not provide any detail of what the actual requirements were.
0 10 20 30 40 50 60 70
0 10 20 30 40 50
0 10 20 30 40 50
60 70
Changes in cash flow hedging
Gains/losses translating foreign operations
Change in property revaluations
Available-for-sale financial assets
Other
None
Figure 5: What items of other comprehensive income do companies have?
Other
Foreign currency translation reserve
Cash flow hedge reserve
Equity settled share reserve
Available-for-sale reserve
Property revaluation reserve
Figure 7: What reserves do companies have?
Figure 10: What types of externally imposed capital requirements are there?
Number of companies
Number of companies
Number of companies
Regulator/legislative requirements
No capital risk management note
Trust deed requirements
Multiple requirements
Loan agreements
No requirements disclosed

22
Market risk sensitivityA sensitivity analysis is required for each type of market risk that the company is exposed to. This can be presented using a value-at-risk (VaR) analysis however this is not common with only one company taking this approach. All other companies provided a sensitivity analysis primarily for interest rate and foreign exchange volatilities. Companies must determine what a reasonably possible change in exposure could be and disclose the possible impact on profit and equity. As shown in.
Extracted examples of informative capital risk management policies
“The Group has established policies in capital management, including the specific requirements that interest cover is to be maintained at a minimum of x times and that the [debt/[debt + equity]] ratio is to be maintained at a x% maximum. It is also Group policy that the dividend payout is maintained between a level of between x% and x% of surplus after tax.”
“The debt to debt plus equity ratio as at ... was x% (py: x%), which is below the Board’s target of x%. The improvement in this ratio is the result of the [asset sales, restriction of capital expenditure, stronger operating cash flows and a cross reference to changes in capital structure].”
“The Group’s policies in respect of capital management and allocation are reviewed regularly by the Board of Directors... In response to the global financial crisis, ... undertook a number of capital management initiatives during the year. These included [asset sales, equity raisings and the dividend reinvestment plan].”
Figures 11 and 12, a 100 basis point (bps) variation is most commonly used for interest rate risk sensitivity and a 10% variation is most commonly used for foreign currency sensitivity.
28% also showed the impact of the variation on items held in each currency where there was more than one currency exposure.
Sensitivity to other price risks, such as to equity prices, oil, electricity and other commodity prices was provided by 25 companies.

Issue 5June 2011
23
16%
58%
5%
4%
6%
11%50 bps or less increase/decrease
100 bps increase/decrease
More than 100 bps increase/decrease
100 - 150 bps increase only
100 bps increase, 50 bps decrease
Not disclosed/VaR
Figure 11: What interest rate sensitivity variations were used?
9%
42%
2%
33%
25%12%
3%
6%
13%
8%
8%
39%
Less than 10% increase/decrease
10% increase/decrease
More than 10% increase/decrease
Other variation
Not disclosed/VaR
Figure 12: What foreign currency sensitivity variations were used?
Figure 13: What topics do the major sources of estimation uncertainty disclosures cover?
Impairment
Fair values
Deferred tax
Revenue
Useful lives
Provisions / contingencies
Other

24
Liquidity riskNZ IFRS 7 requires disclosure of how companies manage their liquidity risk (which is how they ensure they will meet their financial obligations). 77 companies disclosed the extent of unused credit facilities that they had access to in order to manage this risk although the liquidity risk note often just referred to facilities being available with the quantum disclosed in another note (such as the borrowings note). Others noted that they had sufficient cash flows to meet obligations, or made reference to facilities but did not disclose any.
In addition to outlining how liquidity is managed, companies must provide a maturity analysis that shows the remaining contractual maturities of their financial liabilities (and financial assets for financial institutions). Seven companies did not provide a maturity analysis for their financial liabilities as required by NZ IFRS 7 even though they had non-current financial liabilities. We note that an amendment to NZ IFRS 7 was applicable for 2010 financial statements – this amendment required inclusion of financial guarantee contracts in the analysis at the maximum amount of the financial guarantee allocated to the earliest period in which the
guarantee could be called. We note that this disclosure was made by only a small number of companies yet 37 companies disclosed guarantees in their contingent liability note. It was not possible to determine if these were financial guarantees or not.
Credit riskNZ IFRS 7 requires entities to provide information about financial assets that are more likely to become impaired so that users can estimate the level of future impairment losses. As a result entities must disclose financial assets that are past due but not impaired.
We identified 27 companies that did not provide this information for their trade receivables and 11 companies which provided disclosure gross with impaired items. We also identified 10 companies that did not provide an ageing of past due but not impaired items for their other financial assets. It is not possible to determine whether lack of disclosure was because there were no past due receivables, and as other financial assets are not always clearly disclosed we were not able to determine if such disclosure would be relevant.

Issue 5June 2011
25

26
7. Estimates and judgements
Critical judgements and major sources of estimation uncertaintyIn preparing financial statements, entities have to make decisions about outcomes that are subjective or uncertain. NZ IAS 1 requires disclosure of:
• the critical judgements, other than those involving estimations, made by management in the process of applying the entity’s accounting policies. These are described as those judgements that have the most significant effect on the amounts recognised in the financial statements, and
• the major sources of estimation uncertainty (referred to as ‘estimates’) at the reporting date that have a significant risk of causing a material adjustment to the carrying amounts of assets and liabilities within the next financial year.
The purpose of these disclosure requirements is to enable stakeholders to understand the areas of the financial statements that are the most subjective, and which could have a material impact on the financial statements if different judgements or assumptions were made.
Where are critical judgements and major sources of estimation uncertainty disclosed?The most common location for disclosure of critical judgements and key sources of estimation uncertainty was in the accounting policies or basis of preparation (67%) although 29% of companies provided a separate note outlining their judgements and estimates. One company provided information throughout the financial statement notes and three did not disclose any critical judgements or major sources of estimation uncertainty.
Are critical judgements clearly distinguished from major sources of estimation uncertainty?Most companies (76%) do not clearly distinguish between critical judgements and major sources of estimation uncertainty, although it appears that only 30 companies have critical judgements. Some companies just disclosed the topic of the judgement or estimate with a cross reference to a note. For example, if the reference was “property, plant and equipment”(PP&E) it was not clear if the judgement or estimate was useful lives of assets, impairment, or capitalisation of costs. To determine if an item was a judgement or
Highlights:
• 30 critical judgements and 326 major sources of estimation uncertainty were disclosed
• 18% of the major sources of estimation uncertainty had disclosure of the impact of reasonably possible changes in assumptions

Issue 5June 2011
27
estimate, we have taken our cue from the extent of note disclosure provided although realise that this may not have been the company’s intent.
What are the critical judgements?Of the 30 critical judgements identified, the timing of revenue recognition was the most common judgement (11). Other types of judgements disclosed included:
• classification of financial instruments as debt or equity, or as held to maturity,
• management intentions for use or sale of assets affecting deferred tax calculations,
• classification of leases as operating or finance leases,
• classification of owner occupied property as investment property or PP&E,
• whether the company controls a special purpose entity, and
• hedge designation.
What are the major sources of estimation uncertainty?Estimates are assumptions made “about the future and other major sources of estimation uncertainty at the end of the reporting period, that have a significant risk of resulting in a material adjustment to the carrying amounts of assets and liabilities within the next financial year” (NZ IAS 1.125).
There were 326 major sources of estimation uncertainty disclosed by 99 companies in the sample. One company did not provide a note regarding estimates or judgements. As shown in Figure 13, the most common sources of estimation uncertainty discussed
16%
58%
5%
4%
6%
11%50 bps or less increase/decrease
100 bps increase/decrease
More than 100 bps increase/decrease
100 - 150 bps increase only
100 bps increase, 50 bps decrease
Not disclosed/VaR
Figure 11: What interest rate sensitivity variations were used?
9%
42%
2%
33%
25%12%
3%
6%
13%
8%
8%
39%
Less than 10% increase/decrease
10% increase/decrease
More than 10% increase/decrease
Other variation
Not disclosed/VaR
Figure 12: What foreign currency sensitivity variations were used?
Figure 13: What topics do the major sources of estimation uncertainty disclosures cover?
Impairment
Fair values
Deferred tax
Revenue
Useful lives
Provisions / contingencies
Other

28
were in relation to impairment and fair value measurement (mostly in relation to financial instruments, investment property and PP&E).
NZ IAS 1 notes that major sources of estimation uncertainty identified should be limited to those items that have a significant risk of causing material adjustment to carrying amounts “within the next financial year”. The purpose behind limiting the disclosure of items is to ensure that the most relevant information is not obscured by information that relates to a longer period and is therefore less specific. We identified 27 items where it did not appear that the uncertainty identified could lead to a material adjustment if a different assumption was applied. For example:
• several companies had included the valuation of derivatives as a major source of estimation uncertainty, yet the level of derivatives held at balance date was clearly not material and no explanation was provided as to why a valuation using observable market data might have a significant risk of causing a material adjustment to the carrying amount.
• one company noted that contingencies were a major source of estimation uncertainty, however no further detail was provided and the contingent liability note said that there were none.
• several companies identified uncertainties around disclosures such as how segments were determined, where any change in assumption would not affect the carrying amounts of assets and liabilities.
• the value of a deferred tax asset was included as a major source of uncertainty by two companies where one company said the asset was “small” and the other did not have an asset in the current year.
What is the extent of disclosure for major sources of estimation uncertainty?There is significant variety in reporting these areas in practice. NZ IAS 1 notes that the nature and extent of information provided will vary according to the nature of the assumption and other circumstances and provides the following examples of disclosure that should be made:
• the nature of the assumption or other estimation uncertainty,
• the sensitivity of carrying amounts to the methods, assumptions and estimates underlying their calculation, including reasons for sensitivity,
• the expected resolution of any uncertainty and the range of possible outcomes within the next financial year in respect of the carrying amounts of the assets and liabilities affected, and

Issue 5June 2011
29
• an explanation of changes made to past assumptions concerning those assets and liabilities, if the uncertainty remains unresolved.
If it is impracticable to make this disclosure, companies should disclose that “it is reasonably possible, on the basis of existing knowledge, that outcomes within the next financial year that are different from the assumption could require a material adjustment to the carrying amount of the asset or liability affected” in addition to outlining the nature and carrying amount of the asset or liability affected by the assumption.
While disclosure was generally provided of the nature of assumptions made, sensitivity information was only provided for 18% of the estimates (including commentary where disclosure was impracticable). There was no comment on sensitivity for the remaining 82% of estimates. Disclosure is most commonly provided where another standard also required sensitivity information (such as for goodwill and financial instruments), although even
where provided 33% are generic comments such as “Management considers that any reasonable change in a key assumption used in the determination of the value in use would not cause the carrying amount of goodwill to exceed its recoverable amount”, or “there is considerable headroom” in the value in use calculation. Further comments on goodwill impairment disclosures are on page 31.
We did note some particularly informative sensitivity disclosures for assumptions applied in value in use calculations as shown in examples 1 and 2 below. Example 3 provides a simpler explanation of sensitivity which may be more appropriate for some sources of estimation uncertainty.

30
Example 1: Impact of reasonably possible alternative assumptions on the key assumptions used in a value in use model
The assumptions used in the valuation were separately disclosed, followed by a table setting out the impact on the valuation within a range of reasonably possible alternative assumptions.
Assumption Low High Valuation impact
Weighted average cost of capital x% x% + $x- $x
Other assumptions...
Example 2: Combined impact of changes in discount rates and sales growth in a value in use calculation
If the discount rate of 14% and the sales growth rate of 6% (as used in the model) reduced or increased, the impact on the value in use calculation would be $x as shown:
Sales growth Discount rates
12% 13% 14% 15% 16%8% $x $x $x $x $x7% $x $x $x $x $x6% $x $x $x $x $x5% $x $x $x $x $x4% $x $x $x $x $x
Example 3: Sensitivity of useful life assumptions for useful lives of assets for depreciation purposes
Depreciation expenseA significant amount of judgement is used when determining the useful lives of the Group’s [nature of] assets for depreciation purposes. This is especially so for the Group’s longer lived assets.
Sensitivity analysis:If the estimated useful lives of the [nature of] assets was x% higher/lower, operating profit for the year would have increased/(decreased) by $x/($x) (PY $x/($x)).

Issue 5June 2011
31
Goodwill impairmentNZ IAS 36: Impairment of assets sets out the disclosure required when an entity has recorded an impairment loss or reversal (for most non-financial assets), with additional disclosure required for estimates used to measure recoverable amounts of cash-generating units (CGU) containing goodwill or intangible assets with indefinite useful lives. 57 companies held goodwill on balance sheet totalling $76 billion in 2010 representing a significant asset for many companies and disclosure is varied, particularly in regards to the assumptions used in determining value in use and resulting sensitivity of those assumptions as commented on above.
In determining the value in use of CGUs when testing for impairment of goodwill and indefinite life intangible assets, companies are required to disclose a description of the key assumptions used, management’s approach to determining the value assigned to each key assumption, the period over which cash flows have been projected, the growth rate used to extrapolate cash flow projections and the discount rate used. Three companies did not disclose the period over which cash flows have been projected, ten companies did not provide the growth rate used, and three companies did not disclose the discount rate applied. We also noted that six companies did not identify the carrying amount of goodwill allocated to each CGU. It was not possible to determine if this was because there was only one CGU.
In addition, if a reasonably possible change in a key assumption would lead to the carrying amount of a CGU (or asset) to exceed its recoverable amount then further information is required. No sensitivity information was provided by nine companies with goodwill, although this may be because any reasonably possible change would not impact the carrying amount.
Goodwill impairment disclosure is an area that has been raised by the Securities Commission as needing improved transparency.
ProvisionsThe most common type of provisions disclosed are rectification work (22 companies), such as making good leased properties at the end of the lease term and warranty obligations (21 companies). Given the challenging economic environment there were also 15 companies with onerous leases, onerous contracts and/or restructuring provisions. Of the 51 companies with provisions, only three did not provide detail of what the nature of all their provisions were. While disclosing the nature of the obligation was common, it was not common for companies to provide information on the expected timing of resulting outflows of economic benefits. The classification of provisions as either current, non-current or both does provide some indication but it is not possible to determine if there was any uncertainty around that timing.

32
Getting to grips with financial instrument disclosures can be difficult particularly with ongoing changes to the disclosure requirements of NZ IFRS 7: Financial Instruments: Disclosures. While all companies have a dedicated financial instruments note describing the company’s financial risks, many disclosures outlined in NZ IFRS 7 are spread throughout the financial statements to align with the underlying balance such as in the trade receivables or borrowings notes. Despite spreading information throughout the accounts, the financial risk management note takes up on average 15% of the financial statements, although this is higher for financial institutions.
In addition to the risk disclosures required for financial assets discussed in section 6, there are a number of other quantitative disclosures required. We comment on two areas below.
8. Financial instruments
Categories of financial instrumentsAll companies are required to disclose the categories of financial instruments held. 69% of companies provided the categories of financial instruments through discussion or the use of tables in the financial instruments note with 8% identifying the category of each financial instrument in the accounting policy for the item or in a note specific to the balance. 23% of companies did not clearly disclose the category of all their financial instruments.
Fair value hierarchyIn 2010, companies were required to adopt amendments made to NZ IFRS 7 requiring enhanced disclosure of fair value measurement. Financial instruments measured at fair value have to be grouped depending on the degree to which the fair value is observable. The fair value hierarchy represents:
• Level one – fair value is based on quoted prices in an active market for identical assets and liabilities
• Level two – fair value is derived from inputs that are observable, but are not quoted prices for the particular instrument
• Level three – fair value is primarily derived from inputs that are not based on observable market data.
Instruments in level two or three require detail on the method of valuation and assumptions used to determine fair value. Level three requires a reconciliation of the key components making up the change during in value.
Highlights:
• The financial risk management note takes up on average 15% of the financial statements
• Only 15 companies disclosed financial instruments where fair value was derived from inputs that are not based on observable market data (level three in the fair value hierarchy)

Issue 5June 2011
33
15 companies had level three instruments, although only 11 provided the reconciliation. 78 companies had level two instruments (largely derivatives such as interest rate swaps and forward foreign exchange contracts). The detail of valuation methodologies applied is largely generic given the nature of these instruments, although 17 companies provided details of the actual assumptions used in the valuation of their financial instruments such as the interest rates and discount rates applied, generally in relation to level three instruments. The Securities Commission has noted that this disclosure is required for both level two and three instruments.

34
9. Other matters
Related party transactionsIt is common practice for financial statements to contain a related party transactions note with all companies in our sample having a separately identified note. 15 companies, however, showed their key management personnel (KMP) compensation disclosures in a separate note. Three companies did not disclose any compensation to KMP. As they were investment vehicles, they instead disclosed the management fees paid. We note that the IFRS Interpretations Committee (IFRIC) has suggested that the IASB amend the definition of a related party in IAS 24: Related Party Disclosures to clarify that where an entity provides KMP services to a reporting entity, it is a related party in respect of those services and the fees paid to them by the reporting entity should be disclosed. IFRIC also recommended “that the individuals who are employees or directors of the management entity and are
acting as KMP of the reporting entity should not be identified as a related party (unless they qualify as related parties for other reasons).” (IFRIC Update, September 2010).
71% of companies made reference to transactions taking place on an ‘arms length basis’ or on ‘normal commercial terms’. NZ IAS 24: Related Party Disclosures notes that this statement should only be made if the terms can be substantiated.
Contingent liabilitiesThe most common type of contingent liability disclosed was guarantees (37 instances) followed by litigation and disputes (27) and letters of credit and performance bonds (24). Other contingencies (20) included references to contingent consideration in business combinations and the government’s emissions trading scheme among others. A value was not provided for all contingent liabilities by 19 companies.
Subsequent events78 companies discussed events that occurred subsequent to balance date. The most common area discussed was declaration of dividends (52 companies) Other events discussed included the tax rate change, debt refinancing, capital raising activities, asset purchases/sales and entry into emissions trading schemes among others.
Highlights:
• 71 companies made reference to transactions with related parties taking place on an “arms length basis”
• Guarantees are the most common contingent liability disclosed

Issue 5June 2011
35
10. Impact of future standards
From 2013 we expect that IFRS will look very different. The recent release of five new and revised standards by the IASB addressing the accounting for consolidation, joint arrangements and disclosure of interests with other entities may impact the balance sheets of companies in our sample. For example, IFRS 11: Joint arrangements has removed the option to account for joint ventures using proportionate consolidation. Four companies in our sample currently use this accounting method for their joint ventures so will need to consider the impact of changes proposed. We also note that companies with investments in structured entities (also referred to as special purpose vehicles) should consider the new guidance in IFRS 10: Consolidated financial statements, to see if there is any impact on their accounting for these vehicles and the additional disclosure requirements set out in IFRS 12: Disclosure of interests in other entities.
Projects still on the agenda that are expected to lead to significant changes to current practice include the accounting for leases, revenue, insurance and financial instruments (impairment and hedge accounting) and all these are planned to be finalised in 2011, with likely adoption in 2013 or later.
The leases and revenue standards have been the subject of significant debate, and we note the proposals of the exposure drafts are changing as debate continues. While the form
of any final standard is unclear, it seems likely that operating leases will come on balance sheet, eliminating the ‘off balance sheet’ approach currently undertaken. We expect that lessees would need to recognise a right-of-use asset and a liability for the obligation to make lease payments for all leases, and the profile of cost hitting profit or loss is likely to be accelerated in earlier years as the time value of money unwinds.
If this proposal goes ahead, it is expected to have a significant impact given the extensive use of operating leases in New Zealand. The 100 companies in our sample have $7.3 billion of operating lease commitment payables disclosed in the notes to the accounts, and $3.9 billion of operating lease commitment receivables. Recording the right-of-use asset and lease payments liability will clearly impact key ratios used by companies such as debt to equity and net asset value.
The timing for a final standard on leases (and revenue) has been deferred from June 2011 to later in the year.

36
11. Overview of financial statements
Survey results for 30 entities taking advantage of differential reporting concessions in NZ IFRS
shown in Figure 15 there hasn’t been much movement from 2009. The average length of financial statements has decreased from 28 pages since 2008. As 2008 was the first year of adopting NZ IFRS for most companies, a decline was expected as the notes explaining the move from previous standards to NZ IFRS were no longer required.
Differential reporting concessions have significantly reduced the disclosure requirements for qualifying entities, reflected in the average length of 25 pages compared to an average of 42 pages for companies that cannot take advantage of these concessions as shown on page 4.
23%
3%
57%
7% 3% 3% 4%
Figure 14: What is the balance date for entities in the sample?
February
March
April
June
September
October
December
Highlights:
• Financial statements are on average 25 pages long
• Companies report, on average, within 125 days after balance date
Sections 11-14 of the publication provides an overview of the 2010 annual reports of a random sample of 30 entities complying with New Zealand equivalents to International Financial Reporting Standards (NZ IFRS) as applicable to entities taking advantage of differential reporting concessions. Information on the full survey population, from which the sample of 30 was selected, is set out in the Appendix.
Balance datesAs shown in Figure 14, June is the most common balance date (57%) for companies in the sample followed by March (23%).
Length of reportsFinancial statements (including the audit report) are on average 25 pages long and range from 16 to 36 pages in length. As

Issue 5June 2011
37
Speed of reportingThe Companies Act 1993 requires companies to prepare an annual report within five months of balance date. On average, companies in our sample report within 125 days, with the quickest company in our sample managing to approve their financial statements 61 days after balance date.
Nature of audit reportsOnly one company had a modified audit report, modified by the inclusion of an emphasis of matter paragraph in relation to going concern uncertainty. This is an improvement on the prior year where two companies in the sample had emphasis of matter paragraphs in relation to going concern.
Statement of complianceCompanies in our sample should provide a statement of compliance that the financial statements have been prepared in accordance with New Zealand generally accepted accounting practice (NZ GAAP), together with a description of the financial reporting standards applied by the entity (which is NZ IFRS for the companies in the sample) and the fact that they qualify for differential reporting and therefore apply differential reporting concessions. All companies provided the required statement of compliance.
0
5
10
15
20
25
30
NZ IAS 12 NZ IAS 18 NZ IAS 21 NZ IAS 7 NZ IAS 41
Num
ber o
f com
pani
es
Figure 16: Diffential reporting concessions not applied
0
2
4
6
8
10
Rectification Warranties Onerous leases Restructuring
Num
ber o
f com
pani
es
Figure 17: What types of provisions do differential reporting entities have?
0
5
10
15
20
25
30
35
40
45
2010 2009 2008
Num
ber o
f pag
es
Figure 15: What is the average, maximum and minimum number of pages in the financial statements?
Average
Maximum
Minimum

38
12. Differential reporting concessions applied
The companies in our sample stated that they took advantage of all available concessions except for those shown in Figure 16. 25 companies chose not to apply the exemption from NZ IAS 12: Income Taxes, allowing use of the taxes payable method. This is not surprising as most of the companies in our sample are subsidiaries of overseas companies so would look to have the same accounting policies as their offshore parent.
The differential reporting concession in NZ IAS 21: The Effects of Changes in Foreign Exchange Rates allows qualifying companies to record transactions in a foreign currency using the settlement rate (i.e. the spot rate on the day the payable or receivable is settled) for transactions settled in the accounting period, or at the closing rate for transactions that are unsettled at the end of the reporting period. 10 companies clearly stated they were not taking advantage of this concession. Of the 20 remaining companies only two had an accounting policy for foreign currency transactions that referred to the settlement rate with the others having an accounting policy that suggests that they are not taking advantage of this concession.
0
5
10
15
20
25
30
NZ IAS 12 NZ IAS 18 NZ IAS 21 NZ IAS 7 NZ IAS 41
Num
ber o
f com
pani
es
Figure 16: Diffential reporting concessions not applied
0
2
4
6
8
10
Rectification Warranties Onerous leases Restructuring
Num
ber o
f com
pani
es
Figure 17: What types of provisions do differential reporting entities have?
0
5
10
15
20
25
30
35
40
45
2010 2009 2008
Num
ber o
f pag
es
Figure 15: What is the average, maximum and minimum number of pages in the financial statements?
Average
Maximum
Minimum
Highlights:
• The most common differential reporting concession that was not applied was in relation to deferred tax

Issue 5June 2011
39
13. Presentation of the primary statements
Statement of comprehensive incomeAs noted on page 10, entities now have the choice to present two statements (being an income statement and statement of comprehensive income) or one statement of comprehensive income. Only two companies have presented two statements (i.e. income statement and statement of comprehensive income) with the rest providing the one statement. As 12 of these companies had no items of other comprehensive income, there was no reason to provide a second statement.
70% of companies presented expenses by function, with the nature of expenses included in the notes (as required by NZ IAS 1: Presentation of Financial Statements). In relation to audit fees and other services provided by auditors, an entity is required to disclose the nature of any other services provided by the auditors. 27 companies provided this detail.
18 companies had items of other comprehensive income, primarily cash flow hedges. NZ IFRS allows items of other comprehensive income to be shown gross with a separate tax line (if NZ IAS 12 is followed) or net with tax shown in a note. Seven companies that have accounted for income tax in accordance with NZ IAS 12 did not provide this information.
Statement of changes in equity23 companies presented all items shown in equity by reserve, showing profit for the year, other comprehensive income and total comprehensive income as separate line items. Six companies disclosed all items shown in equity by reserve, but did not show total comprehensive income as its two components (profit for the year and other comprehensive income). Two of these companies did not have any items of other comprehensive income. One company did not present a statement of changes in equity.
Balance sheetReserves18 companies have reserves in addition to retained earnings with the most common reserve being the cash flow hedge reserve (13 companies). Other reserves presented were the foreign currency translation reserve and option premium on convertible notes reserve.
Highlights:
• 93% of companies chose to present one statement of comprehensive income instead of two

40
A description of the nature and purpose of each reserve is required to be disclosed by NZ IAS 1. 14 companies provided this information, two companies provided it for some, but not all, of their reserves and two did not describe the nature and purpose of their reserves.
Financial instruments by categoriesCompanies are required to disclose their financial instruments by categories, as defined in NZ IAS 39: Financial Instruments: Recognition and Measurement, in accordance with NZ IFRS 7: Financial Instruments: Disclosures. 13 companies provided a
table providing the categories of financial instruments in the notes. Four companies disclosed it as part of the accounting policies by identifying the category of each balance sheet item. 12 companies did not provide detail of the categories of their financial instruments.
ProvisionsAs shown in Figure 17, the most common type of provision disclosed is rectification work such as making good leased properties at the end of the lease term.
0
5
10
15
20
25
30
NZ IAS 12 NZ IAS 18 NZ IAS 21 NZ IAS 7 NZ IAS 41
Num
ber o
f com
pani
es
Figure 16: Diffential reporting concessions not applied
0
2
4
6
8
10
Rectification Warranties Onerous leases Restructuring
Num
ber o
f com
pani
es
Figure 17: What types of provisions do differential reporting entities have?
0
5
10
15
20
25
30
35
40
45
2010 2009 2008
Num
ber o
f pag
es
Figure 15: What is the average, maximum and minimum number of pages in the financial statements?
Average
Maximum
Minimum

Issue 5June 2011
41
Accounting policiesNZ IAS 8: Accounting Policies, Changes in Accounting Estimates and Errors requires companies to disclose the impact of standards that are adopted during the year and there is no differential reporting concession available. As the revised NZ IAS 1 became mandatory for 2010 balance dates, we expected most companies to make this disclosure, and 17 did. It is not clear if the remaining companies had adopted the revised NZ IAS 1 early in 2009.
Only one company chose to early adopt a standard that is on issue but not yet effective. This company chose to early adopt NZ IFRS 9: Financial Instruments, in order reduce volatility in its income statement. The entity’s investment in an equity instrument was previously designated as “available-for-sale” (AFS) in accordance with NZ IAS 39 which requires permanent impairments to be recycled through the income statement out of the AFS reserve. NZ IFRS 9 allows the instrument
14. Other matters
to be designated as at fair value through other comprehensive income (FVTOCI). All gains or losses (except dividend income) for the equity instrument are recognised in other comprehensive income without any subsequent reclassification to profit or loss.
RestatementsFour companies restated prior year balances, two due to accounting policy changes and two due to a material error. When applying changes in accounting policies or correcting prior period errors, companies should provide enough information including the nature of changes, and impact on financial statements in accordance with NZ IAS 8. Two companies provided the required information, one did not provide the retrospective impact of correcting the prior period error and one did not provide any disclosures in relation to correcting prior period errors.
Contingent liabilitiesThe most common type of contingent liability was financial guarantees (13 companies). Other types of contingent liability included court proceedings (five companies) and performance bonds (three companies).
Future changes to accounting standardsAs noted in section 10, there is a proposal to bring operating leases on balance sheet. This proposal will also impact companies in this sample, unless differential reporting concessions are provided. We note that the
Highlights:
• Only one company early adopted a standard on issue but not yet effective (NZ IFRS 9)
• Four companies restated prior year comparatives due to accounting policy changes and errors

42
30 companies have disclosed operating lease commitments totalling $1.85 billion which would change the appearance of the balance sheet if recorded.
Future changes to differential reporting?In September 2009, the Ministry of Economic Development put out a discussion document proposing a new framework for financial reporting. The framework proposed set tiers for financial reporting as outlined in our special alert The big overhaul – the future of financial reporting in New Zealand dated October 2009. Recent commentary from the Accounting Standards Review Board (ASRB) suggests that large for-profit companies that are not publicly accountable will fall in tier
two where the ASRB supports harmonisation with Australia of the standards to be adopted. Australia has recently implemented a Reduced Disclosure Regime (RDR) which provides certain disclosure exemptions to IFRS for companies meeting certain criteria. There are no recognition or measurement exemptions. If this approach is adopted in New Zealand, companies currently qualifying for differential reporting exemptions would no longer be able to take advantage of current measurement exemptions such as the taxes payable method (instead of recording deferred tax in accordance with NZ IAS 12). The RDR also requires disclosures that are current exemptions. For example, the RDR requires a cash flow statement as well as disclosure of critical judgements and major sources of estimation uncertainty.
A consultation paper with an accompanying document outlining potential RDR requirements is expected some time this year.

Issue 5June 2011
43
Appendix: The survey population
The survey population is made up of the financial statements of the top 200 companies (by revenue) in New Zealand from the Deloitte / Management magazine article reported in the Management Magazine issued in December 2009, and other NZSX and NZDX listed entities. Only those companies with publicly available financial statements are part of the population. In order to focus the survey some of the companies in the original population were removed:
• Public benefit entities were removed as they formed a small percentage of the population and often have unique disclosures. The survey instead focuses on for-profit entities.
• A small number of dual listed entities complying with the GAAP of another country were removed as their disclosures would not be consistent with entities reporting in accordance with NZ GAAP.
• Subsidiaries were removed, where the New Zealand group entity was represented in the population. For example there were some cases where the subsidiary was listed on the NZDX, and the group was included in the Top 200. They were excluded as they are already included in the group results.
Once the population was determined, it was segmented into two groups – those that report in accordance with New Zealand equivalents to International Financial Reporting Standards (NZ IFRS) and those that take advantage of differential reporting concessions.
A random sample of 100 entities complying with NZ IFRS formed the basis of the main survey in sections 1 to 10 which focused on the 2010 annual report of these entities with some data collected from the 2008 and 2009 annual reports for comparison.
Sections 11 to 14 consider a sample of 30 entities taking advantage of differential reporting exemptions, also focusing on their 2010 annual reports.

The Deloitte Financial Reporting Survey SeriesThis publication is the fifth in our Financial Reporting Survey Series in which we consider a series of questions regarding the financial reports of a sample of New Zealand entities.
Other issues in the series available at June 2011 include:
www.deloitte.com/nz/financialreportingsurvey
1
Underlying profi t revisited
Underlying profi t – useful or misleading?
Since the introduction of New Zealand equivalents to International Financial Reporting Standards (NZ IFRS), entities have found ways to disclose the earnings that directors believe more accurately refl ect the entity’s underlying fi nancial performance, in addition to the statutory profi t (which is net profi t after tax as determined by NZ IFRS). These measures take many different labels with some of the more common measures shown being ‘EBITDA’, ‘EBITDAF’, ‘operating profi t’, ‘normalised profi t’, ‘underlying earnings’ and in the past year earnings before the government’s tax law changes (particularly due to the removal of depreciation deductions allowed for buildings).
In 2010, the annual reports of 87 out of a sample of 100 companies (primarily derived from listed and other large New Zealand companies with publicly available fi nancial information) provided 214 alternative earnings or profi t measures. With fi nancial results being discussed in so many ways the question arises as to whether this additional information is useful or misleading.
Since we looked at this topic a year ago, there has been a lot of commentary in the press arguing that this additional information can be misleading. An article by Brian Gaynor in the New Zealand Herald expressed concern over the use of alternative measures stating “The road we are heading down, which is where
Issue 6June 2011
Deloitte refers to one or more of Deloitte Touche Tohmatsu Limited, a UK private company limited by guarantee, and its network of member firms, each of which is a legally separate and independent entity. Please see www.deloitte.com/nz/about for a detailed description of the legal structure of Deloitte Touche Tohmatsu Limited and its member firms. Deloitte provides audit, tax, consulting, and financial advisory services to public and private clients spanning multiple industries. With a globally connected network of member firms in more than 140 countries, Deloitte brings world-class capabilities and deep local expertise to help clients succeed wherever they operate. Deloitte’s approximately 170,000 professionals are committed to becoming the standard of excellence. Deloitte New Zealand brings together more than 900 specialists providing audit, tax, technology and systems, strategy and performance improvement, risk management, corporate finance, business recovery, forensic and accounting services. Our people are based in Auckland, Hamilton, Wellington, Christchurch and Dunedin, serving clients that range from New Zealand’s largest companies and public sector organisations to smaller businesses with ambition to grow. For more information about Deloitte in New Zealand, look to our website www.deloitte.co.nz. This publication contains general information only, and none of Deloitte Touche Tohmatsu Limited, any of its member firms or any of the foregoing’s affiliates (collectively the “Deloitte Network”) are, by means of this publication, rendering accounting, business, financial, investment, legal, tax, or other professional advice or services. This publication is not a substitute for such professional advice or services, nor should it be used as a basis for any decision or action that may affect your finances or your business. Before making any decision or taking any action that may affect your finances or your business, you should consult a qualified professional adviser. No entity in the Deloitte Network shall be responsible for any loss whatsoever sustained by any person who relies on this publication. © 2011 Deloitte. A member of Deloitte Touche Tohmatsu Limited

![annamalaiuniversity.ac.in · Discuss the problems in information system management in construction. ... SURVEYING - April ] ... Explain in detail about movable hair tacheometry. UNIT](https://static.fdocuments.in/doc/165x107/5b7aea127f8b9a483c8d2103/-discuss-the-problems-in-information-system-management-in-construction-surveying.jpg)