Interviews with 430 adult Americans who watched the...
21
Interviews with 430 adult Americans who watched the presidential debate conducted by telephone by ORC International on October 3, 2012. The margin of sampling error for results based on the total sample is plus or minus 4.5 percentage points. Survey respondents were first interviewed as part of a random national sample on September 28-October 2, 2012. In those interviews, respondents indicated they planned to watch tonight's debate and were willing to be re-interviewed after the debate. The sample includes 362 interviews among landline respondents and 68 interviews among cell phone respondents. Some questions were asked of each respondent both in the pre- debate questionnaire on September 28-October 2 and on tonight's questionnaire. Where applicable, results for tonight's respondents from both the pre-debate survey and the post- debate survey are reported. 33% of the respondents who participated in tonight's survey identified themselves as Republicans, 37% identified themselves as Democrats, and 29% identified themselves as Independents.
-
Upload
phamkhuong -
Category
Documents
-
view
215 -
download
0
Transcript of Interviews with 430 adult Americans who watched the...
Interviews with 430 adult Americans who watched the presidential debate conducted by telephone by ORC International on October 3, 2012. The margin of sampling error for results based on the total sample is plus or minus 4.5 percentage points.
Survey respondents were first interviewed as part of a random national sample on September 28-October 2, 2012. In those interviews, respondents indicated they planned to watch tonight's debate and were willing to be re-interviewed after the debate.
The sample includes 362 interviews among landline respondents and 68 interviews among cell phone respondents.
Some questions were asked of each respondent both in the pre-debate questionnaire on September 28-October 2 and on tonight's questionnaire. Where applicable, results for tonight's respondents from both the pre-debate survey and the post-debate survey are reported.
33% of the respondents who participated in tonight's survey identified themselves as Republicans, 37% identified themselves as Democrats, and 29% identified themselves as Independents.

1. Regardless of which candidate you happen to support, who do you think did the best job in the debate -- Barack Obama or Mitt Romney?
Oct. 32012
Obama 25%Romney 67%Neither (vol.) 3%Both (vol.) 5%No opinion *
TRENDS FROM CNN/ORC, CNN/ USA TODAY/GALLUP AND GALLUP POLLS
Obama McCainNeither(vol.)
Both(vol.)
Noopinion
OBAMA/MCCAIN 2008 2008 Oct 15 58 31 2 8 12008 Oct 7 54 30 4 11 12008 Sep 25 51 38 2 9 1
Kerry BushNeither(vol.)
Both(vol.)
Noopinion
KERRY/BUSH 2004 2004 Oct 13 52 39 1 8 *2004 Oct 8 47 45 1 7 *2004 Sep 30 53 37 1 8 1
Gore BushNeither(vol.)
Both(vol.)
Noopinion
GORE/BUSH 2000 2000 Oct 17 46 44 * 10 *2000 Oct 11 36 49 1 13 12000 Oct 3 48 41 2 8 1
Clinton DoleNo
opinionCLINTON/DOLE 1996 1996 Oct 16 59 29 121996 Oct 6 51 32 17
Clinton Bush Perot
None in particular
(vol.)No
opinionCLINTON/BUSH/PEROT 1992 1992 Oct 19 28 28 37 7 *1992 Oct 16-18 58 16 15 7 41992 Oct 11 30 16 47 5 2
Dukakis BushNeither(vol.)
No opinion
DUKAKIS/BUSH 1988 1988 Sep 27-28 38 29 31 2
Mondale ReaganNeither(vol.)
No opinion
MONDALE/REAGAN 1984 1984 Oct 21 40 43 -- 171984 Oct 7 54 35 8 3
POLL 12 -2- October 3, 2012

(QUESTIONS 2 AND 3 ROTATED)
2. Did Barack Obama do a better or worse job than you expected?
Oct. 32012
Better 21%Worse 61%Same (vol.) 16%No opinion 2%
3. Did Mitt Romney do a better or worse job than you expected?
Oct. 32012
Better 82%Worse 10%Same (vol.) 7%No opinion 1%
CNN/USA TODAY/GALLUP AND CNN/ORC INTERNATIONAL TRENDS
Better WorseSame(vol.)
Noopinion
BARACK OBAMA 2008 Sept 26 57 20 23 1JOHN MCCAIN 2008 Sept 26 60 20 18 2
Better WorseSame(vol.)
Noopinion
BILL CLINTON 1996 Oct 6 43 20 35 2BOB DOLE 1996 Oct 6 74 14 11 1
POLL 12 -3- October 3, 2012

(QUESTIONS 4 AND 5 ROTATED)
4. Do you have a favorable or unfavorable opinion of Barack Obama?
(Post Debate) (Pre-Debate)Oct. 3 Sept. 28-Oct. 22012 2012
Favorable opinion 49% 49%Unfavorable opinion 49% 50%No opinion 2% 1%
5. Do you have a favorable or unfavorable opinion of Mitt Romney?
(Post Debate) (Pre-Debate)Oct. 3 Sept. 28-Oct. 22012 2012
Favorable opinion 56% 54%Unfavorable opinion 42% 42%No opinion 2% 3%
CNN/ORC INTERNATIONAL TRENDS
Favorable(Post-Debate)
Favorable(Pre-Debate)
Unfavorable(Post-Debate)
Unfavorable(Pre-Debate)
OBAMA 2008 Oct 15 66 63 33 352008 Oct 7 64 60 34 38MCCAIN 2008 Oct 15 49 51 49 452008 Oct 7 51 51 46 46
POLL 12 -4- October 3, 2012
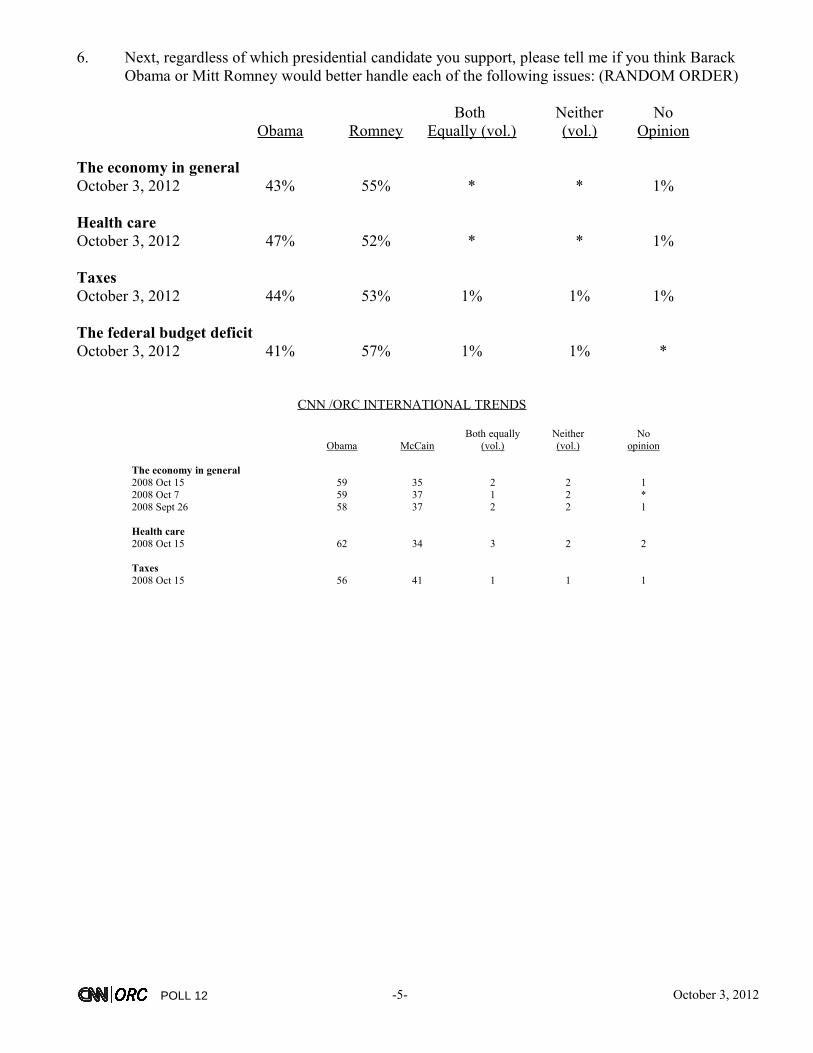
6. Next, regardless of which presidential candidate you support, please tell me if you think Barack Obama or Mitt Romney would better handle each of the following issues: (RANDOM ORDER)
Both Neither NoObama Romney Equally (vol.) (vol.) Opinion
The economy in generalOctober 3, 2012 43% 55% * * 1%
Health careOctober 3, 2012 47% 52% * * 1%
TaxesOctober 3, 2012 44% 53% 1% 1% 1%
The federal budget deficitOctober 3, 2012 41% 57% 1% 1% *
CNN /ORC INTERNATIONAL TRENDS
Obama McCainBoth equally
(vol.)Neither(vol.)
Noopinion
The economy in general2008 Oct 15 59 35 2 2 12008 Oct 7 59 37 1 2 *2008 Sept 26 58 37 2 2 1
Health care 2008 Oct 15 62 34 3 2 2
Taxes 2008 Oct 15 56 41 1 1 1
POLL 12 -5- October 3, 2012

7. Thinking about the following characteristics and qualities, please say whether you think each one better described Barack Obama or Mitt Romney during tonight’s debate. (RANDOM ORDER)
Both Neither NoObama Romney Equally (vol.) (vol.) Opinion
Agrees with your views on the size and role of the federal governmentOctober 3, 2012 44% 54% * 1% 1%
Spent more time attacking his opponentOctober 3, 2012 30% 53% 9% 6% 2%
Seemed to be the stronger leaderOctober 3, 2012 37% 58% 2% 1% 2%
Was more likeableOctober 3, 2012 45% 46% 6% 3% 1%
CNN /ORC INTERNATIONAL TRENDS
Obama McCainBoth equally
(vol.)Neither(vol.)
Noopinion
Spent more time attacking his opponent2008 Oct 15 7 80 10 2 12008 Oct 7 17 63 17 2 12008 Sept 26 23 60 15 2 1
Seemed to be the stronger leader2008 Oct 15 56 39 3 * 12008 Oct 7 54 43 2 1 *2008 Sept 26 49 43 6 1 1
Was more likable2008 Oct 15 70 22 6 1 12008 Oct 7 65 28 6 2 *2008 Sept 26 61 26 11 2 *
POLL 12 -6- October 3, 2012
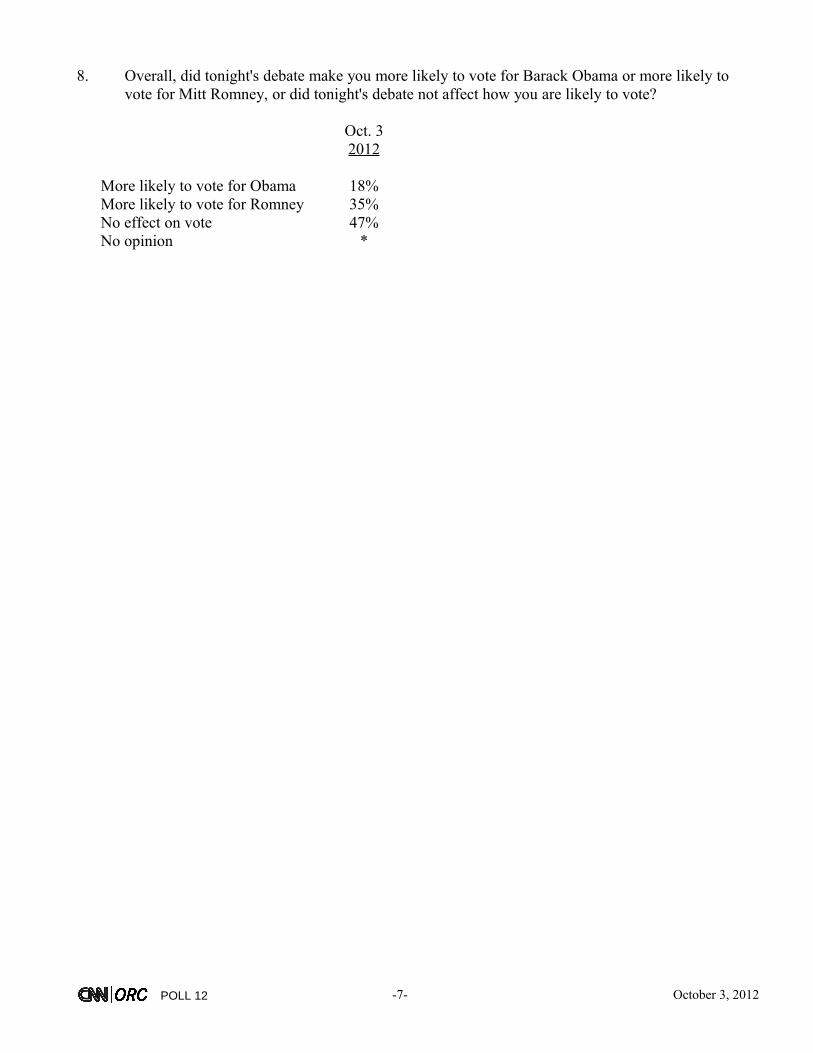
8. Overall, did tonight's debate make you more likely to vote for Barack Obama or more likely to vote for Mitt Romney, or did tonight's debate not affect how you are likely to vote?
Oct. 32012
More likely to vote for Obama 18%More likely to vote for Romney 35%No effect on vote 47%No opinion *
POLL 12 -7- October 3, 2012

CNN/ORC International Poll -- October 3, 2012
Question 101Regardless of which candidate you happen to support, who do you think did the best job inthe debate -- Barack Obama or Mitt Romney?
Base = Registered voters who watched debate
Total Men Women White Non-White ----- ----- ----- ----- ---------Obama 25% 20% 30% 20% N/ARomney 67% 74% 59% 71% N/ANeither 3% 2% 4% 3% N/ABoth 5% 4% 6% 5% N/ANo opinion * * * 1% N/ASampling Error +/-4.5 +/-6.5 +/-7.0 +/-5.0
18- 35- 50- Under 50 and Total 34 49 64 65+ 50 Older ----- ----- ----- ----- ----- ----- ------Obama 25% N/A N/A 26% 22% N/A 24%Romney 67% N/A N/A 63% 69% N/A 67%Neither 3% N/A N/A 1% 4% N/A 3%Both 5% N/A N/A 9% 4% N/A 6%No opinion * N/A N/A * 1% N/A * Sampling Error +/-4.5 +/-8.0 +/-7.0 +/-5.5
Under $50K No Attended Total $50K or more College College ----- ----- ------- ------- --------Obama 25% 37% 20% N/A 23%Romney 67% 54% 72% N/A 67%Neither 3% 2% 4% N/A 3%Both 5% 7% 4% N/A 6%No opinion * * * N/A 1%Sampling Error +/-4.5 +/-8.5 +/-6.5 +/-5.5
Demo- Indep- Repub- Lib- Mod- Conser- Total crat endent lican eral erate vative ----- ----- ------ ------ ----- ----- -------Obama 25% 51% 17% 3% N/A 34% 6%Romney 67% 35% 75% 94% N/A 55% 91%Neither 3% 4% 3% 1% N/A 3% 1%Both 5% 9% 4% 2% N/A 8% 1%No opinion * 1% 1% * N/A * 1%Sampling Error +/-4.5 +/-8.0 +/-8.5 +/-8.0 +/-8.5 +/-7.0
North Mid- Sub- Total east west South West Urban urban Rural ----- ----- ----- ----- ----- ----- ----- -----Obama 25% N/A N/A 22% N/A 34% 20% N/ARomney 67% N/A N/A 71% N/A 57% 72% N/ANeither 3% N/A N/A 3% N/A 3% 3% N/ABoth 5% N/A N/A 4% N/A 6% 5% N/ANo opinion * N/A N/A 1% N/A * 1% N/ASampling Error +/-4.5 +/-8.5 +/-8.5 +/-7.0
* percentage less than 1%
POLL 12 -8- October 3, 2012

CNN/ORC International Poll -- October 3, 2012
Question 102Did Barack Obama do a better or worse job than you expected?
Base = Registered voters who watched debate
Total Men Women White Non-White ----- ----- ----- ----- ---------Better 21% 19% 24% 19% N/AWorse 61% 65% 56% 63% N/ASame 16% 15% 17% 16% N/ANo opinion 2% 1% 3% 2% N/ASampling Error +/-4.5 +/-6.5 +/-7.0 +/-5.0
18- 35- 50- Under 50 and Total 34 49 64 65+ 50 Older ----- ----- ----- ----- ----- ----- ------Better 21% N/A N/A 21% 22% N/A 22%Worse 61% N/A N/A 63% 57% N/A 60%Same 16% N/A N/A 16% 17% N/A 16%No opinion 2% N/A N/A * 4% N/A 2%Sampling Error +/-4.5 +/-8.0 +/-7.0 +/-5.5
Under $50K No Attended Total $50K or more College College ----- ----- ------- ------- --------Better 21% 27% 18% N/A 20%Worse 61% 57% 64% N/A 61%Same 16% 14% 17% N/A 17%No opinion 2% 2% 1% N/A 2%Sampling Error +/-4.5 +/-8.5 +/-6.5 +/-5.5
Demo- Indep- Repub- Lib- Mod- Conser- Total crat endent lican eral erate vative ----- ----- ------ ------ ----- ----- -------Better 21% 32% 21% 11% N/A 30% 12%Worse 61% 44% 67% 73% N/A 49% 72%Same 16% 21% 11% 15% N/A 19% 14%No opinion 2% 3% 2% 1% N/A 2% 1%Sampling Error +/-4.5 +/-8.0 +/-8.5 +/-8.0 +/-8.5 +/-7.0
North Mid- Sub- Total east west South West Urban urban Rural ----- ----- ----- ----- ----- ----- ----- -----Better 21% N/A N/A 19% N/A 24% 18% N/AWorse 61% N/A N/A 64% N/A 61% 62% N/ASame 16% N/A N/A 15% N/A 13% 19% N/ANo opinion 2% N/A N/A 1% N/A 2% 1% N/ASampling Error +/-4.5 +/-8.5 +/-8.5 +/-7.0
* percentage less than 1%
POLL 12 -9- October 3, 2012
CNN/ORC International Poll -- October 3, 2012
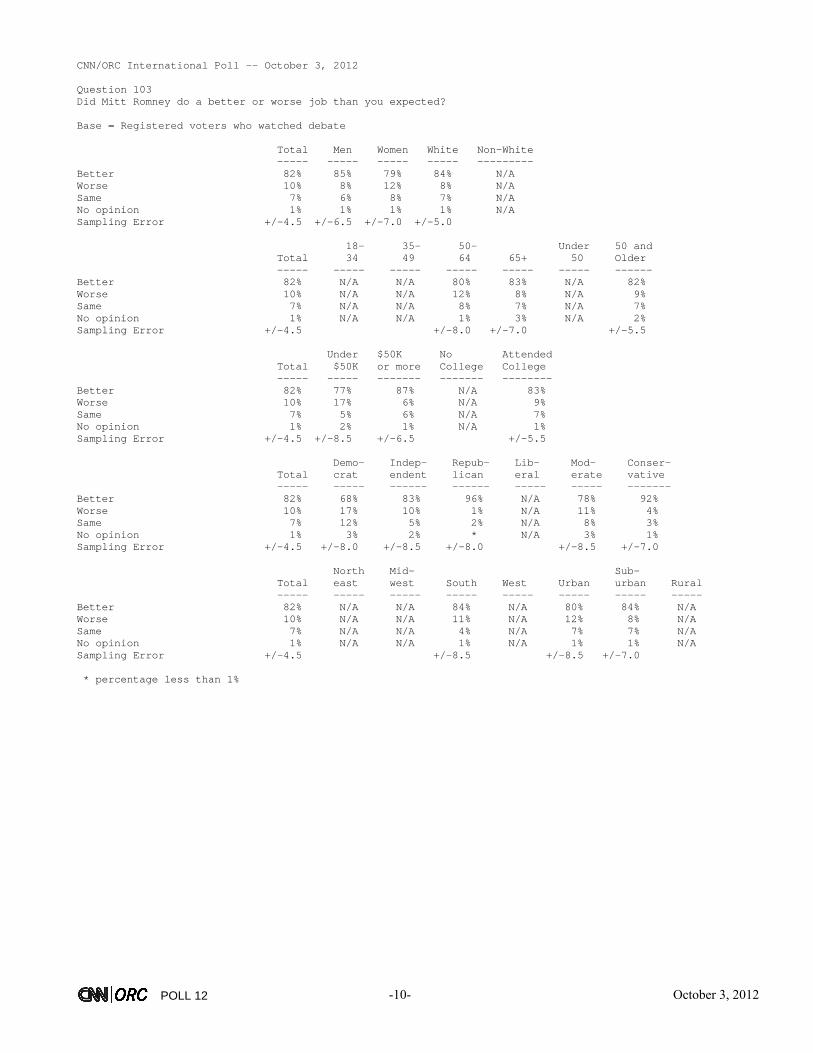
Question 103Did Mitt Romney do a better or worse job than you expected?
Base = Registered voters who watched debate
Total Men Women White Non-White ----- ----- ----- ----- ---------Better 82% 85% 79% 84% N/AWorse 10% 8% 12% 8% N/ASame 7% 6% 8% 7% N/ANo opinion 1% 1% 1% 1% N/ASampling Error +/-4.5 +/-6.5 +/-7.0 +/-5.0
18- 35- 50- Under 50 and Total 34 49 64 65+ 50 Older ----- ----- ----- ----- ----- ----- ------Better 82% N/A N/A 80% 83% N/A 82%Worse 10% N/A N/A 12% 8% N/A 9%Same 7% N/A N/A 8% 7% N/A 7%No opinion 1% N/A N/A 1% 3% N/A 2%Sampling Error +/-4.5 +/-8.0 +/-7.0 +/-5.5
Under $50K No Attended Total $50K or more College College ----- ----- ------- ------- --------Better 82% 77% 87% N/A 83%Worse 10% 17% 6% N/A 9%Same 7% 5% 6% N/A 7%No opinion 1% 2% 1% N/A 1%Sampling Error +/-4.5 +/-8.5 +/-6.5 +/-5.5
Demo- Indep- Repub- Lib- Mod- Conser- Total crat endent lican eral erate vative ----- ----- ------ ------ ----- ----- -------Better 82% 68% 83% 96% N/A 78% 92%Worse 10% 17% 10% 1% N/A 11% 4%Same 7% 12% 5% 2% N/A 8% 3%No opinion 1% 3% 2% * N/A 3% 1%Sampling Error +/-4.5 +/-8.0 +/-8.5 +/-8.0 +/-8.5 +/-7.0
North Mid- Sub- Total east west South West Urban urban Rural ----- ----- ----- ----- ----- ----- ----- -----Better 82% N/A N/A 84% N/A 80% 84% N/AWorse 10% N/A N/A 11% N/A 12% 8% N/ASame 7% N/A N/A 4% N/A 7% 7% N/ANo opinion 1% N/A N/A 1% N/A 1% 1% N/ASampling Error +/-4.5 +/-8.5 +/-8.5 +/-7.0
* percentage less than 1%
POLL 12 -10- October 3, 2012

CNN/ORC International Poll -- October 3, 2012
Question 104Do you have a favorable or unfavorable opinion of Barack Obama?
Base = Registered voters who watched debate
Total Men Women White Non-White ----- ----- ----- ----- ---------Favorable Opinion 49% 44% 54% 43% N/AUnfavorable Opinion 49% 55% 43% 55% N/AHeard of, no Opinion 2% * 3% 1% N/ARefused * * * * N/ASampling Error +/-4.5 +/-6.5 +/-7.0 +/-5.0
18- 35- 50- Under 50 and Total 34 49 64 65+ 50 Older ----- ----- ----- ----- ----- ----- ------Favorable Opinion 49% N/A N/A 53% 43% N/A 48%Unfavorable Opinion 49% N/A N/A 46% 54% N/A 50%Heard of, no Opinion 2% N/A N/A 1% 3% N/A 2%Refused * N/A N/A * 1% N/A * Sampling Error +/-4.5 +/-8.0 +/-7.0 +/-5.5
Under $50K No Attended Total $50K or more College College ----- ----- ------- ------- --------Favorable Opinion 49% 55% 47% N/A 50%Unfavorable Opinion 49% 43% 51% N/A 49%Heard of, no Opinion 2% 2% 1% N/A 1%Refused * * * N/A * Sampling Error +/-4.5 +/-8.5 +/-6.5 +/-5.5
Demo- Indep- Repub- Lib- Mod- Conser- Total crat endent lican eral erate vative ----- ----- ------ ------ ----- ----- -------Favorable Opinion 49% 92% 42% 6% N/A 70% 11%Unfavorable Opinion 49% 8% 55% 91% N/A 29% 86%Heard of, no Opinion 2% * 3% 2% N/A 1% 3%Refused * * * 1% N/A * 1%Sampling Error +/-4.5 +/-8.0 +/-8.5 +/-8.0 +/-8.5 +/-7.0
North Mid- Sub- Total east west South West Urban urban Rural ----- ----- ----- ----- ----- ----- ----- -----Favorable Opinion 49% N/A N/A 41% N/A 57% 47% N/AUnfavorable Opinion 49% N/A N/A 58% N/A 41% 51% N/AHeard of, no Opinion 2% N/A N/A 1% N/A 1% 2% N/ARefused * N/A N/A * N/A * 1% N/ASampling Error +/-4.5 +/-8.5 +/-8.5 +/-7.0
* percentage less than 1%
POLL 12 -11- October 3, 2012
CNN/ORC International Poll -- October 3, 2012
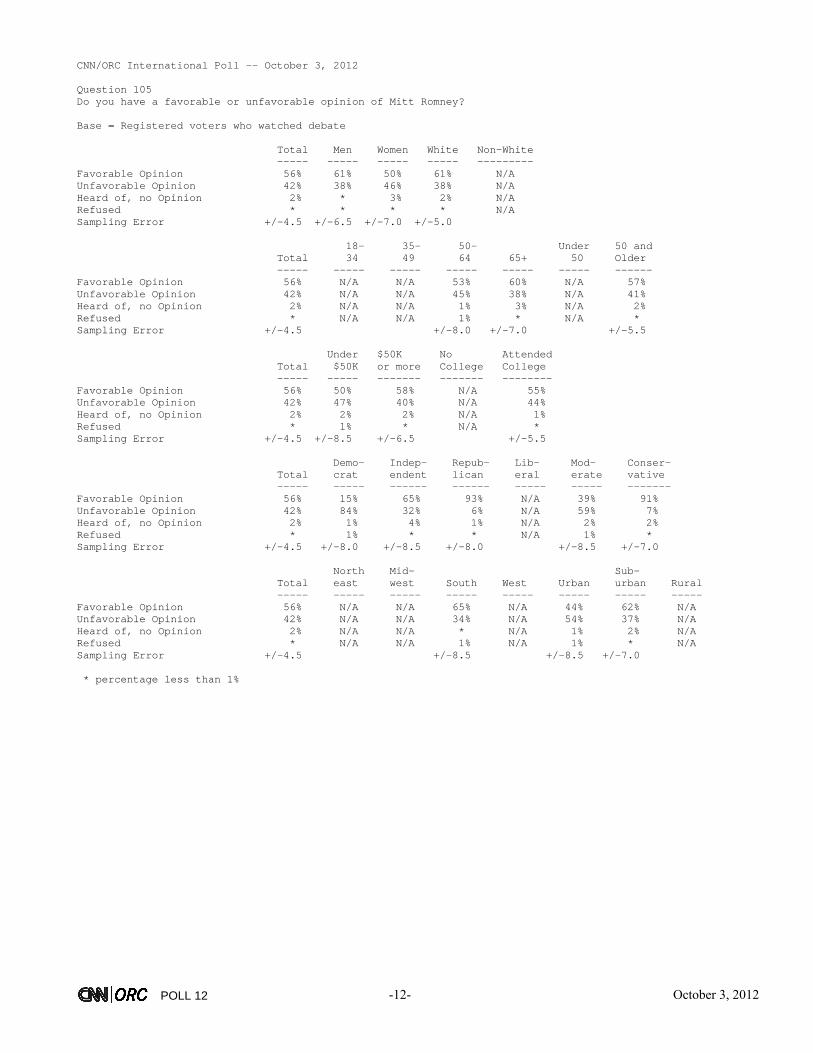
Question 105Do you have a favorable or unfavorable opinion of Mitt Romney?
Base = Registered voters who watched debate
Total Men Women White Non-White ----- ----- ----- ----- ---------Favorable Opinion 56% 61% 50% 61% N/AUnfavorable Opinion 42% 38% 46% 38% N/AHeard of, no Opinion 2% * 3% 2% N/ARefused * * * * N/ASampling Error +/-4.5 +/-6.5 +/-7.0 +/-5.0
18- 35- 50- Under 50 and Total 34 49 64 65+ 50 Older ----- ----- ----- ----- ----- ----- ------Favorable Opinion 56% N/A N/A 53% 60% N/A 57%Unfavorable Opinion 42% N/A N/A 45% 38% N/A 41%Heard of, no Opinion 2% N/A N/A 1% 3% N/A 2%Refused * N/A N/A 1% * N/A * Sampling Error +/-4.5 +/-8.0 +/-7.0 +/-5.5
Under $50K No Attended Total $50K or more College College ----- ----- ------- ------- --------Favorable Opinion 56% 50% 58% N/A 55%Unfavorable Opinion 42% 47% 40% N/A 44%Heard of, no Opinion 2% 2% 2% N/A 1%Refused * 1% * N/A * Sampling Error +/-4.5 +/-8.5 +/-6.5 +/-5.5
Demo- Indep- Repub- Lib- Mod- Conser- Total crat endent lican eral erate vative ----- ----- ------ ------ ----- ----- -------Favorable Opinion 56% 15% 65% 93% N/A 39% 91%Unfavorable Opinion 42% 84% 32% 6% N/A 59% 7%Heard of, no Opinion 2% 1% 4% 1% N/A 2% 2%Refused * 1% * * N/A 1% * Sampling Error +/-4.5 +/-8.0 +/-8.5 +/-8.0 +/-8.5 +/-7.0
North Mid- Sub- Total east west South West Urban urban Rural ----- ----- ----- ----- ----- ----- ----- -----Favorable Opinion 56% N/A N/A 65% N/A 44% 62% N/AUnfavorable Opinion 42% N/A N/A 34% N/A 54% 37% N/AHeard of, no Opinion 2% N/A N/A * N/A 1% 2% N/ARefused * N/A N/A 1% N/A 1% * N/ASampling Error +/-4.5 +/-8.5 +/-8.5 +/-7.0
* percentage less than 1%
POLL 12 -12- October 3, 2012

CNN/ORC International Poll -- October 3, 2012
Question 106ANext, regardless of which presidential candidate you support, please tell me if you think BarackObama or Mitt Romney would better handle each of the following issues:
A. The economy in general
Base = Registered voters who watched debate
Total Men Women White Non-White ----- ----- ----- ----- ---------Obama 43% 38% 49% 39% N/ARomney 55% 60% 49% 60% N/ABoth equally * 1% * * N/ANeither * * * * N/ANo opinion 1% * 1% 1% N/ASampling Error +/-4.5 +/-6.5 +/-7.0 +/-5.0
18- 35- 50- Under 50 and Total 34 49 64 65+ 50 Older ----- ----- ----- ----- ----- ----- ------Obama 43% N/A N/A 48% 39% N/A 43%Romney 55% N/A N/A 51% 58% N/A 55%Both equally * N/A N/A * 1% N/A 1%Neither * N/A N/A * 1% N/A * No opinion 1% N/A N/A 1% 2% N/A 1%Sampling Error +/-4.5 +/-8.0 +/-7.0 +/-5.5
Under $50K No Attended Total $50K or more College College ----- ----- ------- ------- --------Obama 43% 50% 41% N/A 44%Romney 55% 49% 58% N/A 54%Both equally * * * N/A 1%Neither * 1% * N/A * No opinion 1% * 1% N/A 1%Sampling Error +/-4.5 +/-8.5 +/-6.5 +/-5.5
Demo- Indep- Repub- Lib- Mod- Conser- Total crat endent lican eral erate vative ----- ----- ------ ------ ----- ----- -------Obama 43% 87% 33% 4% N/A 61% 6%Romney 55% 11% 64% 96% N/A 36% 93%Both equally * 1% 1% * N/A 1% * Neither * 1% * * N/A * 1%No opinion 1% 1% 2% * N/A 1% 1%Sampling Error +/-4.5 +/-8.0 +/-8.5 +/-8.0 +/-8.5 +/-7.0
North Mid- Sub- Total east west South West Urban urban Rural ----- ----- ----- ----- ----- ----- ----- -----Obama 43% N/A N/A 35% N/A 55% 38% N/ARomney 55% N/A N/A 64% N/A 44% 59% N/ABoth equally * N/A N/A 1% N/A * 1% N/ANeither * N/A N/A * N/A * 1% N/ANo opinion 1% N/A N/A * N/A 1% 1% N/ASampling Error +/-4.5 +/-8.5 +/-8.5 +/-7.0
* percentage less than 1%
POLL 12 -13- October 3, 2012

CNN/ORC International Poll -- October 3, 2012
Question 106BNext, regardless of which presidential candidate you support, please tell me if you think BarackObama or Mitt Romney would better handle each of the following issues:
B. Health care
Base = Registered voters who watched debate
Total Men Women White Non-White ----- ----- ----- ----- ---------Obama 47% 43% 51% 42% N/ARomney 52% 55% 48% 57% N/ABoth equally * * * * N/ANeither * * * * N/ANo opinion 1% 1% * 1% N/ASampling Error +/-4.5 +/-6.5 +/-7.0 +/-5.0
18- 35- 50- Under 50 and Total 34 49 64 65+ 50 Older ----- ----- ----- ----- ----- ----- ------Obama 47% N/A N/A 51% 42% N/A 46%Romney 52% N/A N/A 49% 55% N/A 53%Both equally * N/A N/A * 1% N/A * Neither * N/A N/A * 1% N/A * No opinion 1% N/A N/A * 2% N/A 1%Sampling Error +/-4.5 +/-8.0 +/-7.0 +/-5.5
Under $50K No Attended Total $50K or more College College ----- ----- ------- ------- --------Obama 47% 53% 45% N/A 48%Romney 52% 47% 54% N/A 51%Both equally * * * N/A * Neither * * * N/A * No opinion 1% * 1% N/A 1%Sampling Error +/-4.5 +/-8.5 +/-6.5 +/-5.5
Demo- Indep- Repub- Lib- Mod- Conser- Total crat endent lican eral erate vative ----- ----- ------ ------ ----- ----- -------Obama 47% 92% 38% 6% N/A 67% 10%Romney 52% 8% 61% 92% N/A 31% 89%Both equally * * 1% * N/A 1% * Neither * * * 1% N/A * 1%No opinion 1% * 1% 1% N/A 1% 1%Sampling Error +/-4.5 +/-8.0 +/-8.5 +/-8.0 +/-8.5 +/-7.0
North Mid- Sub- Total east west South West Urban urban Rural ----- ----- ----- ----- ----- ----- ----- -----Obama 47% N/A N/A 37% N/A 55% 44% N/ARomney 52% N/A N/A 62% N/A 44% 55% N/ABoth equally * N/A N/A * N/A * 1% N/ANeither * N/A N/A * N/A * * N/ANo opinion 1% N/A N/A 1% N/A 1% 1% N/ASampling Error +/-4.5 +/-8.5 +/-8.5 +/-7.0
* percentage less than 1%
POLL 12 -14- October 3, 2012

CNN/ORC International Poll -- October 3, 2012
Question 106CNext, regardless of which presidential candidate you support, please tell me if you think BarackObama or Mitt Romney would better handle each of the following issues:
C. Taxes
Base = Registered voters who watched debate
Total Men Women White Non-White ----- ----- ----- ----- ---------Obama 44% 40% 49% 40% N/ARomney 53% 57% 49% 58% N/ABoth equally 1% 1% * 1% N/ANeither 1% 1% * * N/ANo opinion 1% * 1% 1% N/ASampling Error +/-4.5 +/-6.5 +/-7.0 +/-5.0
18- 35- 50- Under 50 and Total 34 49 64 65+ 50 Older ----- ----- ----- ----- ----- ----- ------Obama 44% N/A N/A 49% 40% N/A 44%Romney 53% N/A N/A 48% 58% N/A 54%Both equally 1% N/A N/A * 2% N/A 1%Neither 1% N/A N/A 1% * N/A * No opinion 1% N/A N/A 2% 1% N/A 1%Sampling Error +/-4.5 +/-8.0 +/-7.0 +/-5.5
Under $50K No Attended Total $50K or more College College ----- ----- ------- ------- --------Obama 44% 50% 42% N/A 45%Romney 53% 47% 56% N/A 53%Both equally 1% 2% * N/A 1%Neither 1% * 1% N/A 1%No opinion 1% 2% * N/A 1%Sampling Error +/-4.5 +/-8.5 +/-6.5 +/-5.5
Demo- Indep- Repub- Lib- Mod- Conser- Total crat endent lican eral erate vative ----- ----- ------ ------ ----- ----- -------Obama 44% 87% 36% 5% N/A 64% 8%Romney 53% 9% 61% 95% N/A 31% 91%Both equally 1% 3% * * N/A 1% * Neither 1% * 2% * N/A 1% * No opinion 1% 2% 1% * N/A 2% 1%Sampling Error +/-4.5 +/-8.0 +/-8.5 +/-8.0 +/-8.5 +/-7.0
North Mid- Sub- Total east west South West Urban urban Rural ----- ----- ----- ----- ----- ----- ----- -----Obama 44% N/A N/A 34% N/A 51% 42% N/ARomney 53% N/A N/A 63% N/A 45% 56% N/ABoth equally 1% N/A N/A 1% N/A 1% 1% N/ANeither 1% N/A N/A 2% N/A 1% 1% N/ANo opinion 1% N/A N/A 1% N/A 2% * N/ASampling Error +/-4.5 +/-8.5 +/-8.5 +/-7.0
* percentage less than 1%
POLL 12 -15- October 3, 2012

CNN/ORC International Poll -- October 3, 2012
Question 106DNext, regardless of which presidential candidate you support, please tell me if you think BarackObama or Mitt Romney would better handle each of the following issues:
D. The federal budget deficit
Base = Registered voters who watched debate
Total Men Women White Non-White ----- ----- ----- ----- ---------Obama 41% 35% 49% 36% N/ARomney 57% 64% 49% 62% N/ABoth equally 1% * 1% 1% N/ANeither 1% 1% 2% 1% N/ANo opinion * * * * N/ASampling Error +/-4.5 +/-6.5 +/-7.0 +/-5.0
18- 35- 50- Under 50 and Total 34 49 64 65+ 50 Older ----- ----- ----- ----- ----- ----- ------Obama 41% N/A N/A 49% 37% N/A 42%Romney 57% N/A N/A 50% 60% N/A 56%Both equally 1% N/A N/A * 2% N/A 1%Neither 1% N/A N/A 1% 2% N/A 1%No opinion * N/A N/A * * N/A * Sampling Error +/-4.5 +/-8.0 +/-7.0 +/-5.5
Under $50K No Attended Total $50K or more College College ----- ----- ------- ------- --------Obama 41% 49% 37% N/A 41%Romney 57% 49% 61% N/A 56%Both equally 1% 1% 1% N/A 1%Neither 1% 2% 1% N/A 2%No opinion * * * N/A * Sampling Error +/-4.5 +/-8.5 +/-6.5 +/-5.5
Demo- Indep- Repub- Lib- Mod- Conser- Total crat endent lican eral erate vative ----- ----- ------ ------ ----- ----- -------Obama 41% 85% 29% 4% N/A 59% 7%Romney 57% 12% 68% 96% N/A 40% 91%Both equally 1% 1% 1% * N/A * 1%Neither 1% 1% 2% 1% N/A 1% 1%No opinion * * * * N/A * * Sampling Error +/-4.5 +/-8.0 +/-8.5 +/-8.0 +/-8.5 +/-7.0
North Mid- Sub- Total east west South West Urban urban Rural ----- ----- ----- ----- ----- ----- ----- -----Obama 41% N/A N/A 34% N/A 52% 37% N/ARomney 57% N/A N/A 65% N/A 46% 61% N/ABoth equally 1% N/A N/A 1% N/A * 1% N/ANeither 1% N/A N/A 1% N/A 2% 1% N/ANo opinion * N/A N/A * N/A * * N/ASampling Error +/-4.5 +/-8.5 +/-8.5 +/-7.0
* percentage less than 1%
POLL 12 -16- October 3, 2012

CNN/ORC International Poll -- October 3, 2012
Question 107AThinking about the following characteristics and qualities, please say whether you think each onebetter described Barack Obama or Mitt Romney during tonight's debate.
A. Agrees with your views on the size and role of the federal government
Base = Registered voters who watched debate
Total Men Women White Non-White ----- ----- ----- ----- ---------Obama 44% 39% 50% 40% N/ARomney 54% 59% 48% 58% N/ABoth equally * * * * N/ANeither 1% 1% * 1% N/ANo opinion 1% * 1% * N/ASampling Error +/-4.5 +/-6.5 +/-7.0 +/-5.0
18- 35- 50- Under 50 and Total 34 49 64 65+ 50 Older ----- ----- ----- ----- ----- ----- ------Obama 44% N/A N/A 50% 40% N/A 44%Romney 54% N/A N/A 49% 58% N/A 54%Both equally * N/A N/A * * N/A * Neither 1% N/A N/A 1% 1% N/A 1%No opinion 1% N/A N/A 1% 1% N/A 1%Sampling Error +/-4.5 +/-8.0 +/-7.0 +/-5.5
Under $50K No Attended Total $50K or more College College ----- ----- ------- ------- --------Obama 44% 52% 41% N/A 45%Romney 54% 47% 58% N/A 54%Both equally * * * N/A * Neither 1% 1% 1% N/A 1%No opinion 1% 1% * N/A * Sampling Error +/-4.5 +/-8.5 +/-6.5 +/-5.5
Demo- Indep- Repub- Lib- Mod- Conser- Total crat endent lican eral erate vative ----- ----- ------ ------ ----- ----- -------Obama 44% 90% 32% 4% N/A 62% 7%Romney 54% 8% 65% 95% N/A 35% 91%Both equally * * * * N/A * * Neither 1% 1% 2% 1% N/A 1% 1%No opinion 1% 1% 2% * N/A 2% 1%Sampling Error +/-4.5 +/-8.0 +/-8.5 +/-8.0 +/-8.5 +/-7.0
North Mid- Sub- Total east west South West Urban urban Rural ----- ----- ----- ----- ----- ----- ----- -----Obama 44% N/A N/A 36% N/A 52% 41% N/ARomney 54% N/A N/A 63% N/A 46% 57% N/ABoth equally * N/A N/A * N/A * * N/ANeither 1% N/A N/A * N/A * 2% N/ANo opinion 1% N/A N/A 1% N/A 1% 1% N/ASampling Error +/-4.5 +/-8.5 +/-8.5 +/-7.0
* percentage less than 1%
POLL 12 -17- October 3, 2012

CNN/ORC International Poll -- October 3, 2012
Question 107BThinking about the following characteristics and qualities, please say whether you think each onebetter described Barack Obama or Mitt Romney during tonight's debate.
B. Spent more time attacking his opponent
Base = Registered voters who watched debate
Total Men Women White Non-White ----- ----- ----- ----- ---------Obama 30% 30% 31% 33% N/ARomney 53% 54% 51% 52% N/ABoth equally 9% 8% 10% 8% N/ANeither 6% 5% 7% 6% N/ANo opinion 2% 3% * 2% N/ASampling Error +/-4.5 +/-6.5 +/-7.0 +/-5.0
18- 35- 50- Under 50 and Total 34 49 64 65+ 50 Older ----- ----- ----- ----- ----- ----- ------Obama 30% N/A N/A 31% 32% N/A 32%Romney 53% N/A N/A 55% 48% N/A 51%Both equally 9% N/A N/A 4% 13% N/A 9%Neither 6% N/A N/A 8% 6% N/A 6%No opinion 2% N/A N/A 2% 2% N/A 2%Sampling Error +/-4.5 +/-8.0 +/-7.0 +/-5.5
Under $50K No Attended Total $50K or more College College ----- ----- ------- ------- --------Obama 30% 28% 32% N/A 28%Romney 53% 57% 53% N/A 56%Both equally 9% 10% 7% N/A 6%Neither 6% 4% 7% N/A 8%No opinion 2% 2% 1% N/A 2%Sampling Error +/-4.5 +/-8.5 +/-6.5 +/-5.5
Demo- Indep- Repub- Lib- Mod- Conser- Total crat endent lican eral erate vative ----- ----- ------ ------ ----- ----- -------Obama 30% 13% 35% 46% N/A 24% 47%Romney 53% 74% 49% 33% N/A 63% 33%Both equally 9% 6% 8% 13% N/A 6% 11%Neither 6% 6% 5% 7% N/A 6% 8%No opinion 2% 1% 3% 1% N/A 1% 1%Sampling Error +/-4.5 +/-8.0 +/-8.5 +/-8.0 +/-8.5 +/-7.0
North Mid- Sub- Total east west South West Urban urban Rural ----- ----- ----- ----- ----- ----- ----- -----Obama 30% N/A N/A 32% N/A 28% 31% N/ARomney 53% N/A N/A 52% N/A 55% 54% N/ABoth equally 9% N/A N/A 9% N/A 11% 7% N/ANeither 6% N/A N/A 6% N/A 5% 6% N/ANo opinion 2% N/A N/A 1% N/A 1% 2% N/ASampling Error +/-4.5 +/-8.5 +/-8.5 +/-7.0
* percentage less than 1%
POLL 12 -18- October 3, 2012

CNN/ORC International Poll -- October 3, 2012
Question 107CThinking about the following characteristics and qualities, please say whether you think each onebetter described Barack Obama or Mitt Romney during tonight's debate.
C. Seemed to be the stronger leader
Base = Registered voters who watched debate
Total Men Women White Non-White ----- ----- ----- ----- ---------Obama 37% 33% 42% 32% N/ARomney 58% 62% 53% 62% N/ABoth equally 2% 2% 2% 2% N/ANeither 1% 2% 1% 2% N/ANo opinion 2% 2% 1% 2% N/ASampling Error +/-4.5 +/-6.5 +/-7.0 +/-5.0
18- 35- 50- Under 50 and Total 34 49 64 65+ 50 Older ----- ----- ----- ----- ----- ----- ------Obama 37% N/A N/A 47% 33% N/A 39%Romney 58% N/A N/A 51% 62% N/A 57%Both equally 2% N/A N/A 1% 2% N/A 1%Neither 1% N/A N/A 1% 2% N/A 1%No opinion 2% N/A N/A 1% 2% N/A 1%Sampling Error +/-4.5 +/-8.0 +/-7.0 +/-5.5
Under $50K No Attended Total $50K or more College College ----- ----- ------- ------- --------Obama 37% 47% 33% N/A 37%Romney 58% 50% 62% N/A 57%Both equally 2% 1% 2% N/A 3%Neither 1% 1% 1% N/A 2%No opinion 2% 2% 2% N/A 2%Sampling Error +/-4.5 +/-8.5 +/-6.5 +/-5.5
Demo- Indep- Repub- Lib- Mod- Conser- Total crat endent lican eral erate vative ----- ----- ------ ------ ----- ----- -------Obama 37% 75% 28% 4% N/A 51% 8%Romney 58% 20% 65% 94% N/A 41% 91%Both equally 2% 1% 4% 1% N/A 4% * Neither 1% 3% 1% 1% N/A 3% * No opinion 2% 1% 3% 1% N/A 1% 1%Sampling Error +/-4.5 +/-8.0 +/-8.5 +/-8.0 +/-8.5 +/-7.0
North Mid- Sub- Total east west South West Urban urban Rural ----- ----- ----- ----- ----- ----- ----- -----Obama 37% N/A N/A 33% N/A 46% 35% N/ARomney 58% N/A N/A 63% N/A 47% 62% N/ABoth equally 2% N/A N/A 2% N/A 4% 1% N/ANeither 1% N/A N/A 1% N/A 2% 1% N/ANo opinion 2% N/A N/A 1% N/A 1% 2% N/ASampling Error +/-4.5 +/-8.5 +/-8.5 +/-7.0
* percentage less than 1%
POLL 12 -19- October 3, 2012

CNN/ORC International Poll -- October 3, 2012
Question 107DThinking about the following characteristics and qualities, please say whether you think each onebetter described Barack Obama or Mitt Romney during tonight's debate.
D. Was more likeable
Base = Registered voters who watched debate
Total Men Women White Non-White ----- ----- ----- ----- ---------Obama 45% 43% 46% 41% N/ARomney 46% 47% 45% 49% N/ABoth equally 6% 7% 5% 6% N/ANeither 3% 2% 3% 3% N/ANo opinion 1% 1% * 1% N/ASampling Error +/-4.5 +/-6.5 +/-7.0 +/-5.0
18- 35- 50- Under 50 and Total 34 49 64 65+ 50 Older ----- ----- ----- ----- ----- ----- ------Obama 45% N/A N/A 51% 40% N/A 45%Romney 46% N/A N/A 44% 46% N/A 45%Both equally 6% N/A N/A 3% 9% N/A 7%Neither 3% N/A N/A 1% 3% N/A 2%No opinion 1% N/A N/A * 2% N/A 1%Sampling Error +/-4.5 +/-8.0 +/-7.0 +/-5.5
Under $50K No Attended Total $50K or more College College ----- ----- ------- ------- --------Obama 45% 53% 42% N/A 47%Romney 46% 40% 48% N/A 43%Both equally 6% 5% 5% N/A 7%Neither 3% 1% 4% N/A 3%No opinion 1% * 1% N/A 1%Sampling Error +/-4.5 +/-8.5 +/-6.5 +/-5.5
Demo- Indep- Repub- Lib- Mod- Conser- Total crat endent lican eral erate vative ----- ----- ------ ------ ----- ----- -------Obama 45% 82% 37% 11% N/A 61% 14%Romney 46% 10% 52% 80% N/A 28% 78%Both equally 6% 5% 7% 6% N/A 8% 4%Neither 3% 3% 4% 2% N/A 2% 3%No opinion 1% 1% 1% 1% N/A 1% 1%Sampling Error +/-4.5 +/-8.0 +/-8.5 +/-8.0 +/-8.5 +/-7.0
North Mid- Sub- Total east west South West Urban urban Rural ----- ----- ----- ----- ----- ----- ----- -----Obama 45% N/A N/A 40% N/A 53% 42% N/ARomney 46% N/A N/A 50% N/A 39% 47% N/ABoth equally 6% N/A N/A 5% N/A 5% 7% N/ANeither 3% N/A N/A 4% N/A 2% 3% N/ANo opinion 1% N/A N/A 2% N/A 1% 1% N/ASampling Error +/-4.5 +/-8.5 +/-8.5 +/-7.0
* percentage less than 1%
POLL 12 -20- October 3, 2012

CNN/ORC International Poll -- October 3, 2012
Question 108Overall, did tonight's debate make you more likely to vote for Barack Obama or more likely to votefor Mitt Romney, or did tonight's debate not affect how you are likely to vote?
Base = Registered voters who watched debate
Total Men Women White Non-White ----- ----- ----- ----- ---------More likely to vote for Obama 18% 13% 23% 14% N/AMore likely to vote for Romney 35% 37% 33% 38% N/ANo effect on vote 47% 50% 44% 48% N/ANo opinion * * * * N/ASampling Error +/-4.5 +/-6.5 +/-7.0 +/-5.0
18- 35- 50- Under 50 and Total 34 49 64 65+ 50 Older ----- ----- ----- ----- ----- ----- ------More likely to vote for Obama 18% N/A N/A 22% 16% N/A 19%More likely to vote for Romney 35% N/A N/A 31% 39% N/A 36%No effect on vote 47% N/A N/A 47% 44% N/A 45%No opinion * N/A N/A * 1% N/A 1%Sampling Error +/-4.5 +/-8.0 +/-7.0 +/-5.5
Under $50K No Attended Total $50K or more College College ----- ----- ------- ------- --------More likely to vote for Obama 18% 28% 13% N/A 15%More likely to vote for Romney 35% 31% 36% N/A 34%No effect on vote 47% 40% 50% N/A 50%No opinion * 1% * N/A 1%Sampling Error +/-4.5 +/-8.5 +/-6.5 +/-5.5
Demo- Indep- Repub- Lib- Mod- Conser- Total crat endent lican eral erate vative ----- ----- ------ ------ ----- ----- -------More likely to vote for Obama 18% 39% 8% 3% N/A 29% 4%More likely to vote for Romney 35% 7% 38% 63% N/A 24% 58%No effect on vote 47% 54% 53% 34% N/A 47% 38%No opinion * 1% * 1% N/A 1% * Sampling Error +/-4.5 +/-8.0 +/-8.5 +/-8.0 +/-8.5 +/-7.0
North Mid- Sub- Total east west South West Urban urban Rural ----- ----- ----- ----- ----- ----- ----- -----More likely to vote for Obama 18% N/A N/A 17% N/A 20% 15% N/AMore likely to vote for Romney 35% N/A N/A 39% N/A 25% 39% N/ANo effect on vote 47% N/A N/A 44% N/A 54% 45% N/ANo opinion * N/A N/A 1% N/A * 1% N/ASampling Error +/-4.5 +/-8.5 +/-8.5 +/-7.0
* percentage less than 1%
POLL 12 -21- October 3, 2012