
Interspecific, Spatial and Temporal Variability of Self ... has been developed by local people for...
12
Interspecific, Spatial and Temporal Variability of Self- Recruitment in Anemonefishes Hawis H. Madduppa 1 *, Janne Timm 2 , Marc Kochzius 3 1 Marine Science and Technology, Faculty of Fisheries and Marine Science, Bogor Agricultural University (IPB), Bogor, Indonesia, 2 Biotechnology and Molecular Genetics, University of Bremen, Bremen, Germany, 3 Marine Biology, Vrije Universiteit Brussel, Brussels, Belgium Abstract Polymorphic microsatellite DNA parentage analysis was used to investigate the spatio-temporal variability of self- recruitment in populations of two anemonefishes: Amphiprion ocellaris and A. perideraion. Tissue samples of A. ocellaris (n = 364) and A. perideraion (n = 105) were collected from fringing reefs around two small islands (Barrang Lompo and Samalona) in Spermonde Archipelago, Indonesia. Specimens were genotyped based on seven microsatellite loci for A. ocellaris and five microsatellite loci for A. perideraion, and parentage assignment as well as site fidelity were calculated. Both species showed high levels of self-recruitment: 65.2% of juvenile A. ocellaris in Samalona were the progeny of parents from the same island, while on Barrang Lompo 47.4% of A. ocellaris and 46.9% of A. perideraion juveniles had parents from that island. Self-recruitment of A. ocellaris in Barrang Lompo varied from 44% to 52% between the two sampling periods. The site fidelity of A. ocellaris juveniles that returned to their reef site in Barang Lompo was up to 44%, while for A. perideraion up to 19%. In Samalona, the percentage of juveniles that returned to their natal reef site ranged from 8% to 11%. Exchange of progeny between the two study islands, located 7.5 km apart, was also detected via parentage assignments. The larger Samalona adult population of A. ocellaris was identified as the parents of 21% of Barrang Lompo juveniles, while the smaller adult population on Barrang Lompo were the parents of only 4% of Samalona juveniles. High self-recruitment and recruitment to nearby island reefs have important implications for management and conservation of anemonefishes. Small MPAs, preferably on every island/reef, should ensure that a part of the population is protected to enable replenishment by the highly localised recruitment behaviour observed in these species. Citation: Madduppa HH, Timm J, Kochzius M (2014) Interspecific, Spatial and Temporal Variability of Self-Recruitment in Anemonefishes. PLoS ONE 9(2): e90648. doi:10.1371/journal.pone.0090648 Editor: Dirk Steinke, Biodiversity Insitute of Ontario - University of Guelph, Canada Received April 8, 2013; Accepted February 3, 2014; Published February 28, 2014 Copyright: ß 2014 Madduppa et al. This is an open-access article distributed under the terms of the Creative Commons Attribution License, which permits unrestricted use, distribution, and reproduction in any medium, provided the original author and source are credited. Funding: The German Federal Ministry of Education and Research (BMBF http://www.bmbf.de/en/index.php, grant no. 03F0472B) funded this study in the framework of the SPICE II project (Science for the Protection of Indonesian Coastal Marine Ecosystems). The SPICE project was conducted and permitted under the governmental agreement between the German Federal Ministry of Education and Research (BMBF) and the Indonesian Ministry for Research and Technology (RISTEK), Indonesian Institute of Sciences (LIPI), Indonesian Ministry of Maritime Affairs and Fisheries (KKP), and Indonesian Agency for the Assessment and Application of Technology (BPPT). The funders had no role in study design, data collection and analysis, decision to publish, or preparation of the manuscript. Competing Interests: The authors have declared that no competing interests exist. * E-mail: [email protected] Introduction Self-recruitment is defined as the proportion of larvae returning to and settling in their natal population, whereas population connectivity is the linking of distinct populations by individual dispersal or migration [1]. These two aspects are fundamental for the management and conservation of living marine resources [2], management of highly harvested species [3], understanding the population dynamics of marine organisms [4], and improving the design of marine reserves [5]. Sufficient self-recruitment and connectivity among populations in marine reserves are believed to prevent local extinction that might otherwise occur as a result of anthropogenic disturbances such as fishing pressure [6]. However, directly measuring the degree of self-recruitment and connectivity in populations of marine organisms is challenging due to the large number and small size of the propagules, the time spent in the dispersive pelagic larval stages and the high mortality. Although the pelagic larval duration (PLD), which varies from days to weeks in fish [7], affects dispersal capability [8], dispersal distances are also potentially influenced by oceanographic processes [9], geographic location and flow variability of ocean currents [10], as well as larval behaviour, such as vertical positioning, swimming and olfactory reef-sensing [11–14]. Genetic markers that can be used for determining parentage and relatedness offer an indirect method for measuring self- recruitment and connectivity, thus providing important informa- tion on population dynamics. These markers are also widely used for addressing wildlife management issues in a variety of organisms [15–19]. A commonly used genetic marker are microsatellites, simple repetitive sequences located throughout the eukaryote nuclear genome [20]. Because of their high variability they are useful for fine-scale ecological studies, such as parentage analysis [21]. Parentage analysis uses data from polymorphic microsatel- lites for relationship reconstruction based on the maximum likelihood method, where juveniles are assigned to the most likely parent from a data set of potential parents [22]. This method has been proven a powerful tool for investigating self-recruitment in marine fishes [23–26], identifying connectivity among fish populations [27–28], and determining whether larvae of marine organisms remain close to their origin over small scales (e.g., among groups within a population) [29]. PLOS ONE | www.plosone.org 1 February 2014 | Volume 9 | Issue 2 | e90648
Transcript of Interspecific, Spatial and Temporal Variability of Self ... has been developed by local people for...
Interspecific, Spatial and Temporal Variability of Self-Recruitment in AnemonefishesHawis H. Madduppa1*, Janne Timm2, Marc Kochzius3
1Marine Science and Technology, Faculty of Fisheries and Marine Science, Bogor Agricultural University (IPB), Bogor, Indonesia, 2 Biotechnology and Molecular Genetics,
University of Bremen, Bremen, Germany, 3Marine Biology, Vrije Universiteit Brussel, Brussels, Belgium
Abstract
Polymorphic microsatellite DNA parentage analysis was used to investigate the spatio-temporal variability of self-recruitment in populations of two anemonefishes: Amphiprion ocellaris and A. perideraion. Tissue samples of A. ocellaris(n= 364) and A. perideraion (n= 105) were collected from fringing reefs around two small islands (Barrang Lompo andSamalona) in Spermonde Archipelago, Indonesia. Specimens were genotyped based on seven microsatellite loci for A.ocellaris and five microsatellite loci for A. perideraion, and parentage assignment as well as site fidelity were calculated. Bothspecies showed high levels of self-recruitment: 65.2% of juvenile A. ocellaris in Samalona were the progeny of parents fromthe same island, while on Barrang Lompo 47.4% of A. ocellaris and 46.9% of A. perideraion juveniles had parents from thatisland. Self-recruitment of A. ocellaris in Barrang Lompo varied from 44% to 52% between the two sampling periods. The sitefidelity of A. ocellaris juveniles that returned to their reef site in Barang Lompo was up to 44%, while for A. perideraion up to19%. In Samalona, the percentage of juveniles that returned to their natal reef site ranged from 8% to 11%. Exchange ofprogeny between the two study islands, located 7.5 km apart, was also detected via parentage assignments. The largerSamalona adult population of A. ocellaris was identified as the parents of 21% of Barrang Lompo juveniles, while the smalleradult population on Barrang Lompo were the parents of only 4% of Samalona juveniles. High self-recruitment andrecruitment to nearby island reefs have important implications for management and conservation of anemonefishes. SmallMPAs, preferably on every island/reef, should ensure that a part of the population is protected to enable replenishment bythe highly localised recruitment behaviour observed in these species.
Citation: Madduppa HH, Timm J, Kochzius M (2014) Interspecific, Spatial and Temporal Variability of Self-Recruitment in Anemonefishes. PLoS ONE 9(2): e90648.doi:10.1371/journal.pone.0090648
Editor: Dirk Steinke, Biodiversity Insitute of Ontario - University of Guelph, Canada
Received April 8, 2013; Accepted February 3, 2014; Published February 28, 2014
Copyright: � 2014 Madduppa et al. This is an open-access article distributed under the terms of the Creative Commons Attribution License, which permitsunrestricted use, distribution, and reproduction in any medium, provided the original author and source are credited.
Funding: The German Federal Ministry of Education and Research (BMBF http://www.bmbf.de/en/index.php, grant no. 03F0472B) funded this study in theframework of the SPICE II project (Science for the Protection of Indonesian Coastal Marine Ecosystems). The SPICE project was conducted and permitted under thegovernmental agreement between the German Federal Ministry of Education and Research (BMBF) and the Indonesian Ministry for Research and Technology(RISTEK), Indonesian Institute of Sciences (LIPI), Indonesian Ministry of Maritime Affairs and Fisheries (KKP), and Indonesian Agency for the Assessment andApplication of Technology (BPPT). The funders had no role in study design, data collection and analysis, decision to publish, or preparation of the manuscript.
Competing Interests: The authors have declared that no competing interests exist.
* E-mail: [email protected]
Introduction
Self-recruitment is defined as the proportion of larvae returning
to and settling in their natal population, whereas population
connectivity is the linking of distinct populations by individual
dispersal or migration [1]. These two aspects are fundamental for
the management and conservation of living marine resources [2],
management of highly harvested species [3], understanding the
population dynamics of marine organisms [4], and improving the
design of marine reserves [5]. Sufficient self-recruitment and
connectivity among populations in marine reserves are believed to
prevent local extinction that might otherwise occur as a result of
anthropogenic disturbances such as fishing pressure [6]. However,
directly measuring the degree of self-recruitment and connectivity
in populations of marine organisms is challenging due to the large
number and small size of the propagules, the time spent in the
dispersive pelagic larval stages and the high mortality. Although
the pelagic larval duration (PLD), which varies from days to weeks
in fish [7], affects dispersal capability [8], dispersal distances are
also potentially influenced by oceanographic processes [9],
geographic location and flow variability of ocean currents [10],
as well as larval behaviour, such as vertical positioning, swimming
and olfactory reef-sensing [11–14].
Genetic markers that can be used for determining parentage
and relatedness offer an indirect method for measuring self-
recruitment and connectivity, thus providing important informa-
tion on population dynamics. These markers are also widely used
for addressing wildlife management issues in a variety of organisms
[15–19]. A commonly used genetic marker are microsatellites,
simple repetitive sequences located throughout the eukaryote
nuclear genome [20]. Because of their high variability they are
useful for fine-scale ecological studies, such as parentage analysis
[21]. Parentage analysis uses data from polymorphic microsatel-
lites for relationship reconstruction based on the maximum
likelihood method, where juveniles are assigned to the most likely
parent from a data set of potential parents [22]. This method has
been proven a powerful tool for investigating self-recruitment in
marine fishes [23–26], identifying connectivity among fish
populations [27–28], and determining whether larvae of marine
organisms remain close to their origin over small scales (e.g.,
among groups within a population) [29].
PLOS ONE | www.plosone.org 1 February 2014 | Volume 9 | Issue 2 | e90648
In this study microsatellites are used to study self-recruitment in
two species of anemonefish. Spatial patterns of recruitment in
anemonefishes are interesting in part due to their unusual
symbiosis with anemones, social structure and breeding biology,
but also critically important due to the high level of exploitation of
these species and their host anemones by the global ornamental
fish trade [30]. Anemonefishes have two very different phases in
their lifecycle: sedentary adults live in close association with host
anemones, while larvae are planktonic. Metamorphosing juveniles
recruit to a species-specific host anemone, usually joining a mixed-
age group of conspecifics. Within that group, the largest individual
is the reproductive female, the second largest the reproductive
male, while the remaining individuals are non-reproductive
subadults and juveniles [31] [32].
This study focuses on two species of anemonefish: Amphiprion
ocellaris and A. perideraion. With an estimated 145,000 individuals
collected from the wild during 1997–2002, A. ocellaris is the most
frequently traded marine ornamental fish in the global market
[30]. The research was conducted in Spermonde Archipelago
(Indonesia), where anemonefishes, especially A. ocellaris, are
intensely collected and overexploitation is indicated [33]. A recent
study showed limited connectivity of A. ocellaris populations across
Indonesia and among shelf areas in Spermonde Archipelago,
predicting high self-recruitment in the mid-shelf area of the
archipelago [34]. In this study polymorphic microsatellite DNA
parentage analysis was used to investigate the degree of self-
recruitment, site fidelity, and genetic relatedness of A. ocellaris and
A. perideraion populations of two small islands in Spermonde
Archipelago. Understanding the degree of self-recruitment in these
populations and their connectivity to neighbouring populations
could directly support the design and implementation of effective
Marine Protected Area (MPA) networks, as well as the sustainable
management and conservation of these species.
Materials and Methods
Study SpeciesAmphiprion ocellaris (false clown anemonefish) lives in symbiosis
with three anemone species (Heteractis magnifica, Stycodactyla gigantea,
and S. mertensii) and has a planktonic larval duration (PLD) of 8–12
days [32]. It inhabits outer reef slopes or sheltered lagoons to a
maximal depth of 15 m. Amphiprion perideraion (pink anemonefish)
can be associated with four different anemones (H. magnifica, H.
crispa, Mactodactyla doreenis, and S. gigantea; [32]) and has a somewhat
longer PLD of 18 days [7]. It typically inhabits lagoon and
seaward reefs.
Study AreasSpermonde Archipelago (South Sulawesi, Indonesia) (Fig. 1)
comprises about 150 islands [35] and is situated at the
southwestern tip of Sulawesi in the centre of marine biodiversity,
the so-called ‘‘Coral Triangle’’. This archipelago is affected by the
very strong Indonesian Throughflow (ITF) current, which
connects the Pacific Ocean with the Indian Ocean [36]. This
setting potentially enhances the dispersal of marine organisms in
Spermonde Archipelago, though interactions between oceano-
graphic processes and larval behaviour may enable larvae to stay
close to their natal population [37]. About 50,000 people live in
Spermonde Archipelago and coral reef resources form an
important part of their livelihoods. Therefore, these reefs are
under threat from a variety of anthropogenic activities, including
destructive fishing practices and land-based pollution [38]. The
present study was conducted at two small islands, Barrang Lompo
and Samalona (Fig. 1), located in the mid-shelf region of
Spermonde Archipelago. Barrang Lompo (5u02952.070S,119u19945.250E), located 13 km west of Makassar, is 19 ha in
size and inhabited by about 5,000 people. Its fringing coral reefs
have been impacted by dynamite-fishing and local sewage
pollution [39]. Samalona (5u07930.480S, 119u20936.480E), located5 km west of Makassar, is 2 ha in size, and inhabited by about 80
people. Samalona has been developed by local people for small-
scale tourism and is therefore relatively protected from destructive
fishing activities. However, Samalona9s reefs have been impacted
by anchor damage and pollution from Makassar [39]. On both
study islands, the fringing reefs extend from the shore to depths of
2–10 m, where the substrate changes to soft sediment. The outer
circumferences of the fringing reefs are 2.5 km and 1.48 km at
Barrang Lompo and Samalona, respectively.
Field Sampling MethodsIn order to completely sample the populations of A. ocellaris and
A. perideraion on Barrang Lompo and Samalona, scuba divers
systematically searched the entire area of the fringing reefs for host
anemones. To facilitate this process and provide more information
on location of the anemonefishes, the reef in Barrang Lompo was
subdivided into five sites and the reef in Samalona into four. At
each site, all host anemones were located and associated
anemonefishes identified and counted. To obtain tissue for genetic
analysis of the anemonefishes, two small aquarium nets were used
to carefully capture each individual fish and a small fin clip of the
caudal fin was collected. The length of the fish was measured and
then it was immediately released back to the host anemone. Fin-
clipped individuals could be readily identified, so resampling was
not a problem and it was possible to visually ensure that all
individuals associated with a particular anemone were sampled.
Each tissue sample was put into a separate tube and all associated
data (fish species, size, date, location, and anemone species) was
recorded immediately. Tissue samples were preserved in 96%
ethanol after the dive and stored at 4uC in the laboratory until
DNA extraction.
The sex and reproductive status of individuals within each
group on a host anemone were determined by body size. The
largest fish was assumed to be the reproductive female, the second
largest the reproductive male, and all others were assumed to be
non-breeding individuals [31] [40]. Non-breeding individuals will
be referred to as ‘‘juveniles’’ henceforth.
A total of 364 tissue samples of A. ocellaris and 105 tissue samples
of A. perideraion were collected at the two islands (Table 1). In
Barrang Lompo, 88 A. ocellaris individuals were sampled from 17
anemones in October 2008 and May 2009. In Samalona, a total of
276 individuals were sampled from 83 anemones in May 2009.
For A. perideraion, 105 individuals were sampled from 35 anemones
in Barrang Lompo in May 2009.
Ethics StatementFin-clipping is a non-destructive, minimally invasive and the
most commonly used method to obtain tissue from living fishes in
the wild (e.g. [24] [26] [28]) and in aquaculture (e.g. [41]). We
took great care to minimise harm, and ensure survival by safely
releasing the fishes back into their host anemones. Tissue sampling
of these anemonefishes was permitted within the framework of the
German-Indonesian SPICE project (Science for the Protection of
Indonesian Coastal Ecosystems), in cooperation with the Hasa-
nuddin University, Makassar, Indonesia.
Self-Recruitment in Anemonefishes
PLOS ONE | www.plosone.org 2 February 2014 | Volume 9 | Issue 2 | e90648
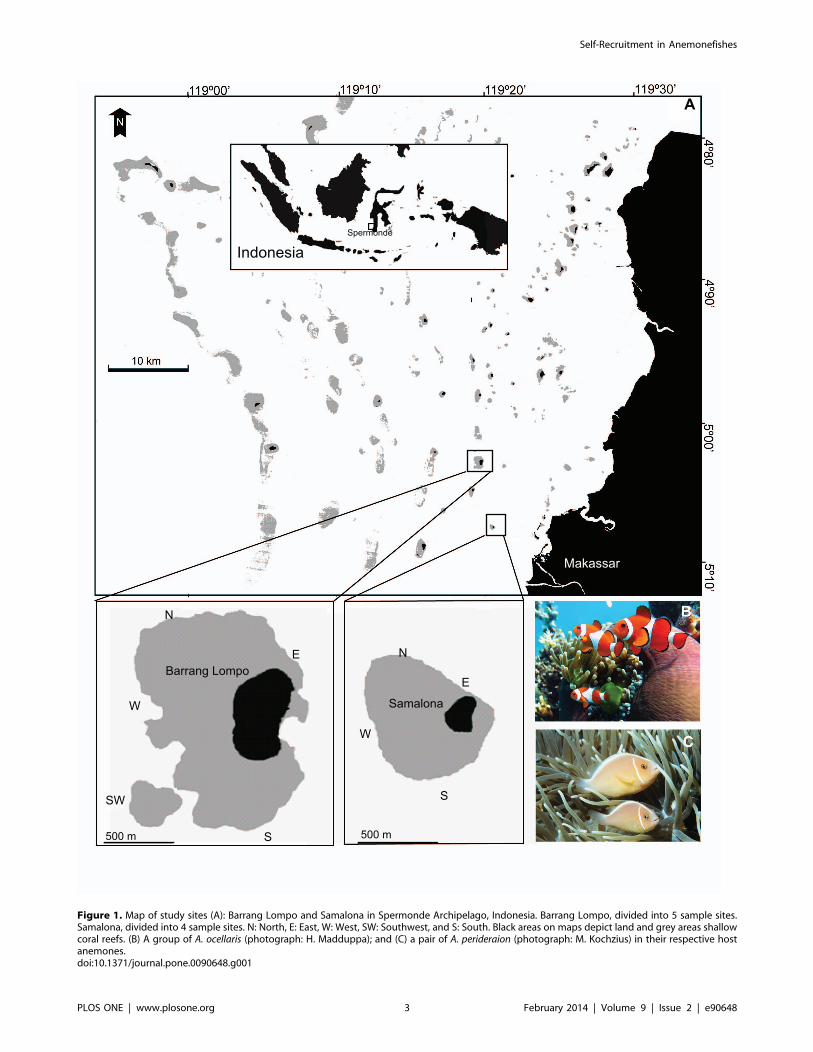
Figure 1. Map of study sites (A): Barrang Lompo and Samalona in Spermonde Archipelago, Indonesia. Barrang Lompo, divided into 5 sample sites.Samalona, divided into 4 sample sites. N: North, E: East, W: West, SW: Southwest, and S: South. Black areas on maps depict land and grey areas shallowcoral reefs. (B) A group of A. ocellaris (photograph: H. Madduppa); and (C) a pair of A. perideraion (photograph: M. Kochzius) in their respective hostanemones.doi:10.1371/journal.pone.0090648.g001
Self-Recruitment in Anemonefishes
PLOS ONE | www.plosone.org 3 February 2014 | Volume 9 | Issue 2 | e90648

DNA Extraction, Microsatellite Amplification and AlleleSizingGenomic DNA from Amphiprion ocellaris and A. perideraion was
extracted with the NucleoSpin tissue extraction kit (Macherey-
Nagel), following the manufacturer’s guidelines. All DNA extracts
were analysed by gel electrophoresis to monitor DNA quality prior
to polymerase chain reaction (PCR) amplification of microsatellite
loci. DNA extracts were stored at 220uC.
PCRs were carried out in a total volume of 25 ml, containing2.5 ml 10x PCR buffer, 3 ml 25 mM MgCl2, 1 ml 2 mM each
dNTP, 1 ml each 10 mM primer forward and reverse, 0.1 ml (5unit/ml) Taq polymerase (F100L Taq DNA), 1 ml (1–10 ng)
genomic DNA. PCRs were performed in a TProfessional
Thermocycler (Biometra) or a Mastercycler ep (Eppendorf) with
the following thermo-profile: 94uC for 2 minutes, followed by 35
cycles of 94uC for 30 seconds as the denaturing step, 50–65uC for
Table 1. Sample collection in Spermonde Archipelago, Indonesia.
Site Geographic coordinates
Length ofreef No. of Anemone* A. ocellaris A. perideraion
surveyed(m) Adults
Juveniles(2008)
Juveniles(2009)** Adults
Juveniles(2009)
Barrang Lompo
West S 05u 02.5419 E 119u 19.3559 763 3 3 7 8 6 16
Southwest S 05u 03.3249 E 119u 19.2769 293 2(1) 2 2 6 25 36
North S 05u 02.5079 E 119u 19.5719 677 8(2) 14 10 5 1 0
South S 05u 03.3179 E 119u 19.4909 395 5 7 5 10 9 6
East S 05u 03.2809 E 119u 19.8369 383 2 4 2 3 0 6
Total 30 26 32 41 64
Samalona
West S 05u 07.0109 E 119u 20.0069 220 17 34 18
North S 05u 07.0099 E 119u 20.0079 560 22 44 28
East S 05u 07.0059 E 119u 20.0099 470 30 58 53
South S 05u 07.0119 E 119u 20.0099 230 14 28 13
Total 164 112
*Parentheses: the number of anemones with a single resident anemonefish and thus excluded from the relatedness analysis.**juveniles collected in the 2009 at Barrang Lompo for A. ocellaris were limited to size a maximum of 2 cm total length.doi:10.1371/journal.pone.0090648.t001
Table 2. Polymorphic microsatellite loci used as genetic markers for Amphiprion ocellaris and A. perideraion.
Locus Repeat motifAnn.Ao
Ann.Ap Primer sequences (59-39) Dye Primer Source Reference
Cf 9 Tetranucleotide 60 – F: CTC TAT GAA GAT TTT T HEX Amphiprion percula Buston et al. 2007
R: GTA CAT GTG TTT CCTC
Cf 42 Ditetranucleotide 55 53 F: AAG CTC CGG TAA CTC AAA ACT AAT HEX A. percula Buston et al. 2007
R: GTC ATC TGA TCC ATG TTG ATG TG
Cf 29 Dinucleotide 58 – F: TTC TTT ATC CCC TTG TTT ATT TCT AA FAM A. percula Buston et al. 2007
R: AAG CCT CCT TTC CAA AAC CAC TCA
45 Dinucleotide 62 – F: TCA ACT GAA TGG AGT CCA TCT GG FAM A. polymnus Quenouille et al. 2004
R: CCG CCG CTA GCC GTG ACA TGC AA
120 Dinucleotide 62 68 F: TCG ATG ACA TAA CAC GAC GCA GT HEX A. polymnus Quenouille et al. 2004
R: GAC GGC CTC GAT CTG CAA GCT GA
AC1578 Dinucleotide 53 55 F: CAG CTC TGT GTG TGT TTA ATG C FAM A. clarkii Liu et al. 2007
R: CAC CCA GCC ACC ATA TTA AC
AC137 Dinucleotide 58 55 F: GGT TGT TTA GGC CAT GTG GT FAM A. clarkii Liu et al. 2007
R: TTG AGA CAC ACT GGC TCC T
AC915 Dinucleotide – 58 F: TTG CTT TGG TGG AAC ATT TGC HEX A. clarkii Liu et al. 2007
R: TCT GCC ATT TCC TTT GTT C
[Abbreviations: Ann. =Annealing temperature; Ao =A. ocellaris; A.p =A. perideraion; Dye = fluorescence dye].doi:10.1371/journal.pone.0090648.t002
Self-Recruitment in Anemonefishes
PLOS ONE | www.plosone.org 4 February 2014 | Volume 9 | Issue 2 | e90648

30 seconds as the annealing step (the optimal annealing
temperature varies between primers, see Table 2), 72uC for 1
minute for the polymerisation, and finally 72uC for 2 minutes.
Twenty microsatellite loci were amplified, using primers from
other Amphiprion species [29] [42] [43]. Of these, seven were
polymorphic in A. ocellaris and five in A. perideraion. These loci
(Table 2) were amplified by PCR with a labelled forward primer
containing a 59-fluorescent dye (FAM or HEX). PCR products
were diluted in pure water prior to fragment analysis. Dilution
factors were determined empirically for each locus, and ranged
from 1:5 to 1:30. For fragment analysis, 1 ml of diluted PCR
product was combined with 8.85 ml HiDiTM formamide and
0.15 ml GENESCAN LIZ-500 size standard (Applied Biosystems).
Microsatellite fragments were size fractioned using an ABI 3730
48 capillary sequencer with a capillary of 50 cm length (Applied
Biosystems). Allele sizes were determined and corrected with
PEAK SCANNER v1.0 (Applied Biosystems) and GENEMAR-
KER v1.85 (SoftGenetics GeneMarker). The program MICRO-
CHECKER was used to detect null alleles and to identify
irregularities in the data, including mistyped allele sizes,
typographic mistakes, as well as scoring errors [44].
Summary Statistics, Test of Hardy-Weinberg Equilibrium,and Linkage DisequilibriumThe total number of alleles per locus, allele frequencies,
observed and expected heterozygosities [45], and the Polymorphic
Information Content (PIC) of each locus [46] were calculated with
the program CERVUS 3.0 [47]. The levels of polymorphism at
each microsatellite locus was ranked as: (1) highly informative (PIC
.0.5), (2) reasonably informative (0.5$PIC $0.25), or (3) slightly
informative (PIC ,0.25), following Botstein et al. [46]. PIC values
are determined based on the frequency of alleles at a given locus.
Hardy-Weinberg equilibrium (HWE) exact tests and loci combi-
nations for linkage disequilibrium with the Markov chain methods
were conducted using GENEPOP on the web [48] [49]. In order
to test the null hypothesis of HWE, the probability test was
conducted and the alternative hypothesis of heterozygote defi-
ciency was tested. The null hypothesis of linkage disequilibrium for
the diploid case was tested through pairwise comparisons of loci.
For all Markov chain methods, parameters used were the default
settings for dememorisation number (1000), number of batches
(100), and iterations per batch (1000). Significance levels were
adjusted with sequential Bonferroni corrections for multiple tests
with P#0.05. The coefficient of inbreeding (FIS) was calculated
with the program FSTAT 2.9.3 [50] in order to detect non-
random mating within populations [51]. The FIS-value ranges
Table 3. Summary statistics for Amphiprion ocellaris (two populations) over seven polymorphic microsatellite loci, and A.perideraion over five polymorphic microsatellite loci.
Locus Allele (bp) k PIC FIS Ho He Prob. H1
Amphiprion ocellaris: Barrang Lompo population (n = 88)
Cf9 262–298 10 0.765 20.012 0.807 0.797 0.869 0.519
Cf29 190–234 18 0.905 20.065 0.977 0.917 0.879 0.95
Cf42 262–320 25 0.920 20.027 0.955 0.930 0.329 0.432
45 216–246 12 0.648 0.225 0.523 0.674 ,0.01 0.013
120 454–462 5 0.465 0.073 0.500 0.539 0.265 0.076
AC137 256–322 20 0.912 0.003 0.920 0.923 0.679 0.192
AC1578 250–264 8 0.755 0.082 0.727 0.792 0.117 ,0.001
mean 0.039
Amphiprion ocellaris: Samalona population (n = 276)
Cf9 262–302 11 0.772 20.019 0.815 0.800 0.861 0.469
Cf29 200–248 21 0.890 20.075 0.967 0.900 0.004 1
Cf42 258–324 30 0.925 20.004 0.935 0.931 0.705 0.597
45 216–246 14 0.551 0.013 0.572 0.580 0.081 0.323
120 450–470 9 0.523 20.004 0.594 0.592 0.91 0.599
AC137 250–328 30 0.920 0.015 0.913 0.926 0.334 0.031
AC1578 250–266 9 0.781 0.033 0.783 0.810 ,0.001 0.087
mean 20.006
Amphiprion perideraion: Barrang Lompo population (n = 105)
Cf42 258–408 57 0.969 0.023 0.952 0.975 ,0.001 ,0.001
120 456–480 11 0.787 0.052 0.771 0.813 0.759 0.316
AC137 276–336 24 0.925 0.154 0.790 0.934 0.014 ,0.001
AC915 218–230 5 0.601 0.052 0.619 0.653 0.808 0.265
AC1578 250–258 5 0.634 0.617 0.267 0.695 ,0.001 ,0.001
mean 0.179
For each locus, the data given are allele size range (bp =base pairs), number of alleles (k), polymorphic information content (PIC), the coefficient of inbreeding (FIS), theobserved (Ho) and expected (He) heterozygosity, and P values for Hardy-Weinberg exact test (Prob. = Probability test; H1 =Heterozygote deficiency).doi:10.1371/journal.pone.0090648.t003
Self-Recruitment in Anemonefishes
PLOS ONE | www.plosone.org 5 February 2014 | Volume 9 | Issue 2 | e90648
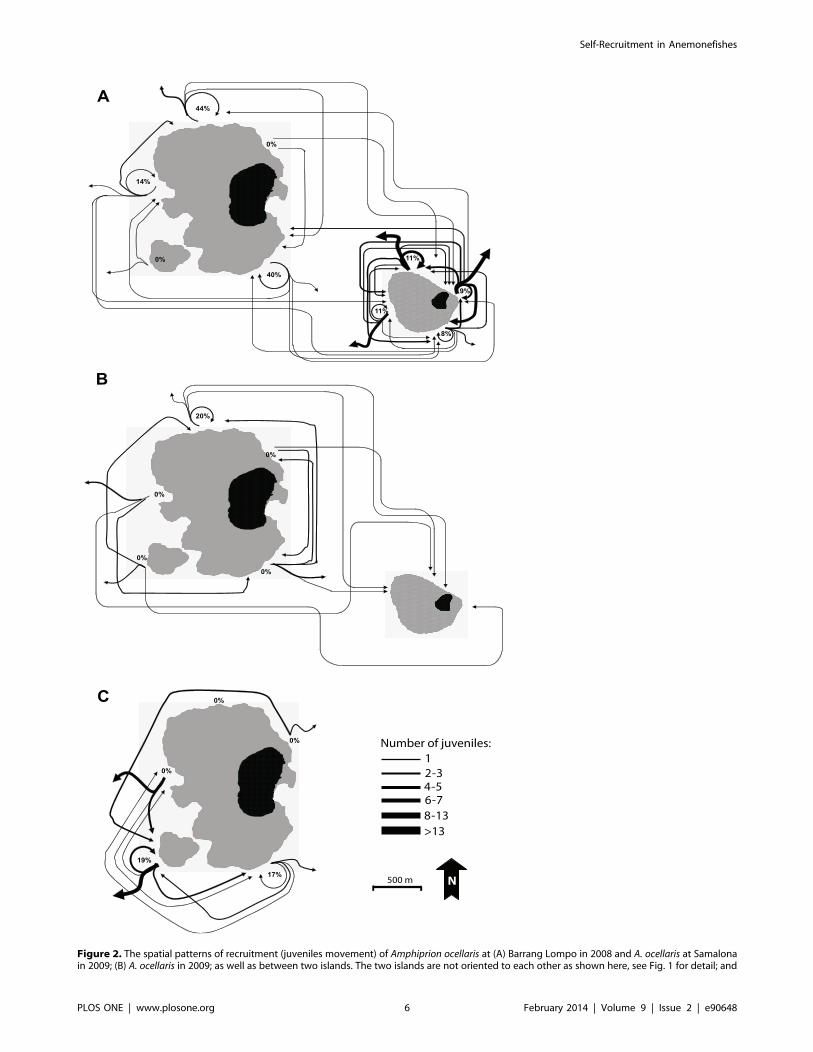
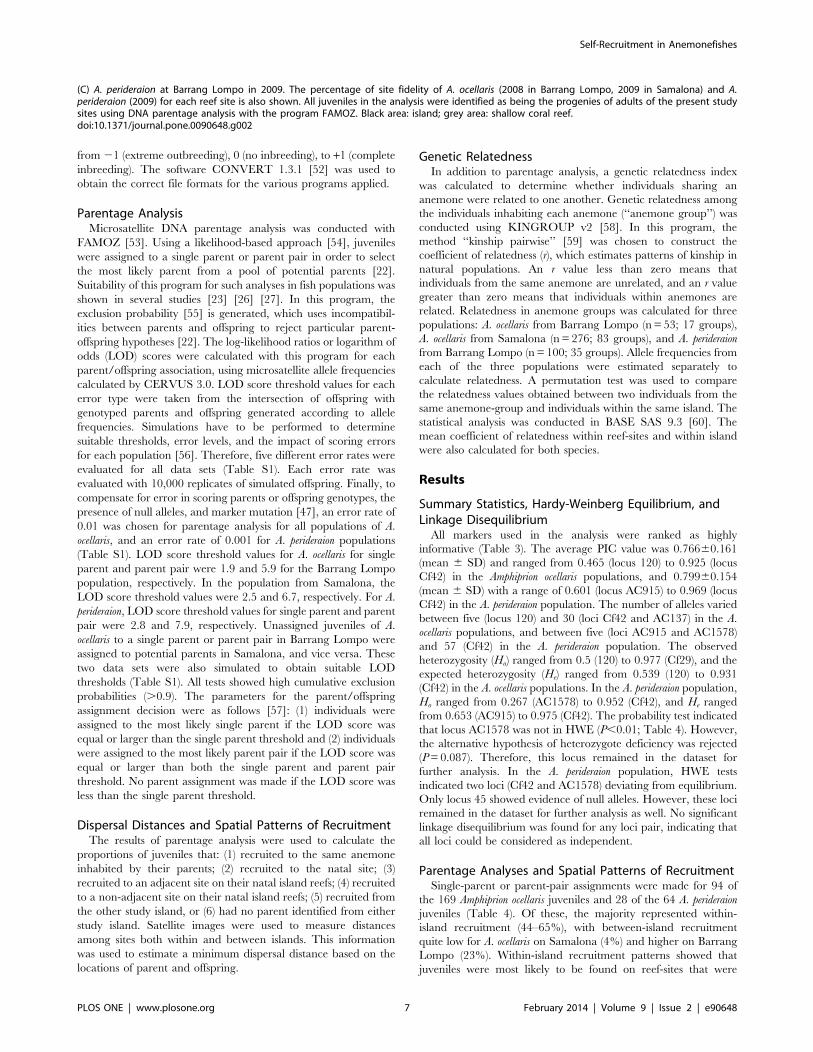
Figure 2. The spatial patterns of recruitment (juveniles movement) of Amphiprion ocellaris at (A) Barrang Lompo in 2008 and A. ocellaris at Samalonain 2009; (B) A. ocellaris in 2009; as well as between two islands. The two islands are not oriented to each other as shown here, see Fig. 1 for detail; and
Self-Recruitment in Anemonefishes
PLOS ONE | www.plosone.org 6 February 2014 | Volume 9 | Issue 2 | e90648
from 21 (extreme outbreeding), 0 (no inbreeding), to +1 (complete
inbreeding). The software CONVERT 1.3.1 [52] was used to
obtain the correct file formats for the various programs applied.
Parentage AnalysisMicrosatellite DNA parentage analysis was conducted with
FAMOZ [53]. Using a likelihood-based approach [54], juveniles
were assigned to a single parent or parent pair in order to select
the most likely parent from a pool of potential parents [22].
Suitability of this program for such analyses in fish populations was
shown in several studies [23] [26] [27]. In this program, the
exclusion probability [55] is generated, which uses incompatibil-
ities between parents and offspring to reject particular parent-
offspring hypotheses [22]. The log-likelihood ratios or logarithm of
odds (LOD) scores were calculated with this program for each
parent/offspring association, using microsatellite allele frequencies
calculated by CERVUS 3.0. LOD score threshold values for each
error type were taken from the intersection of offspring with
genotyped parents and offspring generated according to allele
frequencies. Simulations have to be performed to determine
suitable thresholds, error levels, and the impact of scoring errors
for each population [56]. Therefore, five different error rates were
evaluated for all data sets (Table S1). Each error rate was
evaluated with 10,000 replicates of simulated offspring. Finally, to
compensate for error in scoring parents or offspring genotypes, the
presence of null alleles, and marker mutation [47], an error rate of
0.01 was chosen for parentage analysis for all populations of A.
ocellaris, and an error rate of 0.001 for A. perideraion populations
(Table S1). LOD score threshold values for A. ocellaris for single
parent and parent pair were 1.9 and 5.9 for the Barrang Lompo
population, respectively. In the population from Samalona, the
LOD score threshold values were 2.5 and 6.7, respectively. For A.
perideraion, LOD score threshold values for single parent and parent
pair were 2.8 and 7.9, respectively. Unassigned juveniles of A.
ocellaris to a single parent or parent pair in Barrang Lompo were
assigned to potential parents in Samalona, and vice versa. These
two data sets were also simulated to obtain suitable LOD
thresholds (Table S1). All tests showed high cumulative exclusion
probabilities (.0.9). The parameters for the parent/offspring
assignment decision were as follows [57]: (1) individuals were
assigned to the most likely single parent if the LOD score was
equal or larger than the single parent threshold and (2) individuals
were assigned to the most likely parent pair if the LOD score was
equal or larger than both the single parent and parent pair
threshold. No parent assignment was made if the LOD score was
less than the single parent threshold.
Dispersal Distances and Spatial Patterns of RecruitmentThe results of parentage analysis were used to calculate the
proportions of juveniles that: (1) recruited to the same anemone
inhabited by their parents; (2) recruited to the natal site; (3)
recruited to an adjacent site on their natal island reefs; (4) recruited
to a non-adjacent site on their natal island reefs; (5) recruited from
the other study island, or (6) had no parent identified from either
study island. Satellite images were used to measure distances
among sites both within and between islands. This information
was used to estimate a minimum dispersal distance based on the
locations of parent and offspring.
Genetic RelatednessIn addition to parentage analysis, a genetic relatedness index
was calculated to determine whether individuals sharing an
anemone were related to one another. Genetic relatedness among
the individuals inhabiting each anemone (‘‘anemone group’’) was
conducted using KINGROUP v2 [58]. In this program, the
method ‘‘kinship pairwise’’ [59] was chosen to construct the
coefficient of relatedness (r), which estimates patterns of kinship in
natural populations. An r value less than zero means that
individuals from the same anemone are unrelated, and an r value
greater than zero means that individuals within anemones are
related. Relatedness in anemone groups was calculated for three
populations: A. ocellaris from Barrang Lompo (n= 53; 17 groups),
A. ocellaris from Samalona (n= 276; 83 groups), and A. perideraion
from Barrang Lompo (n= 100; 35 groups). Allele frequencies from
each of the three populations were estimated separately to
calculate relatedness. A permutation test was used to compare
the relatedness values obtained between two individuals from the
same anemone-group and individuals within the same island. The
statistical analysis was conducted in BASE SAS 9.3 [60]. The
mean coefficient of relatedness within reef-sites and within island
were also calculated for both species.
Results
Summary Statistics, Hardy-Weinberg Equilibrium, andLinkage DisequilibriumAll markers used in the analysis were ranked as highly
informative (Table 3). The average PIC value was 0.76660.161
(mean 6 SD) and ranged from 0.465 (locus 120) to 0.925 (locus
Cf42) in the Amphiprion ocellaris populations, and 0.79960.154
(mean 6 SD) with a range of 0.601 (locus AC915) to 0.969 (locus
Cf42) in the A. perideraion population. The number of alleles varied
between five (locus 120) and 30 (loci Cf42 and AC137) in the A.
ocellaris populations, and between five (loci AC915 and AC1578)
and 57 (Cf42) in the A. perideraion population. The observed
heterozygosity (Ho) ranged from 0.5 (120) to 0.977 (Cf29), and the
expected heterozygosity (He) ranged from 0.539 (120) to 0.931
(Cf42) in the A. ocellaris populations. In the A. perideraion population,
Ho ranged from 0.267 (AC1578) to 0.952 (Cf42), and He ranged
from 0.653 (AC915) to 0.975 (Cf42). The probability test indicated
that locus AC1578 was not in HWE (P,0.01; Table 4). However,
the alternative hypothesis of heterozygote deficiency was rejected
(P=0.087). Therefore, this locus remained in the dataset for
further analysis. In the A. perideraion population, HWE tests
indicated two loci (Cf42 and AC1578) deviating from equilibrium.
Only locus 45 showed evidence of null alleles. However, these loci
remained in the dataset for further analysis as well. No significant
linkage disequilibrium was found for any loci pair, indicating that
all loci could be considered as independent.
Parentage Analyses and Spatial Patterns of RecruitmentSingle-parent or parent-pair assignments were made for 94 of
the 169 Amphiprion ocellaris juveniles and 28 of the 64 A. perideraion
juveniles (Table 4). Of these, the majority represented within-
island recruitment (44–65%), with between-island recruitment
quite low for A. ocellaris on Samalona (4%) and higher on Barrang
Lompo (23%). Within-island recruitment patterns showed that
juveniles were most likely to be found on reef-sites that were
(C) A. perideraion at Barrang Lompo in 2009. The percentage of site fidelity of A. ocellaris (2008 in Barrang Lompo, 2009 in Samalona) and A.perideraion (2009) for each reef site is also shown. All juveniles in the analysis were identified as being the progenies of adults of the present studysites using DNA parentage analysis with the program FAMOZ. Black area: island; grey area: shallow coral reef.doi:10.1371/journal.pone.0090648.g002
Self-Recruitment in Anemonefishes
PLOS ONE | www.plosone.org 7 February 2014 | Volume 9 | Issue 2 | e90648
adjacent to their natal site and least likely to be found on non-
adjacent sites (Fig. 2).
Site FidelityJuveniles of A. ocellaris and A. perideraion were staying at their
natal site in different proportions (Fig. 2). The percentage of
juveniles of A. ocellaris that returned to their natal site in Barang
Lompo range from 0 to 44%, while A. perideraion ranged from 0 to
19%. In the Samalona, the percentage of A. ocellaris juveniles that
returned to their origin site ranged from 8% to 11%. However,
most of them settled and dispersed close to their natal site within
their island.
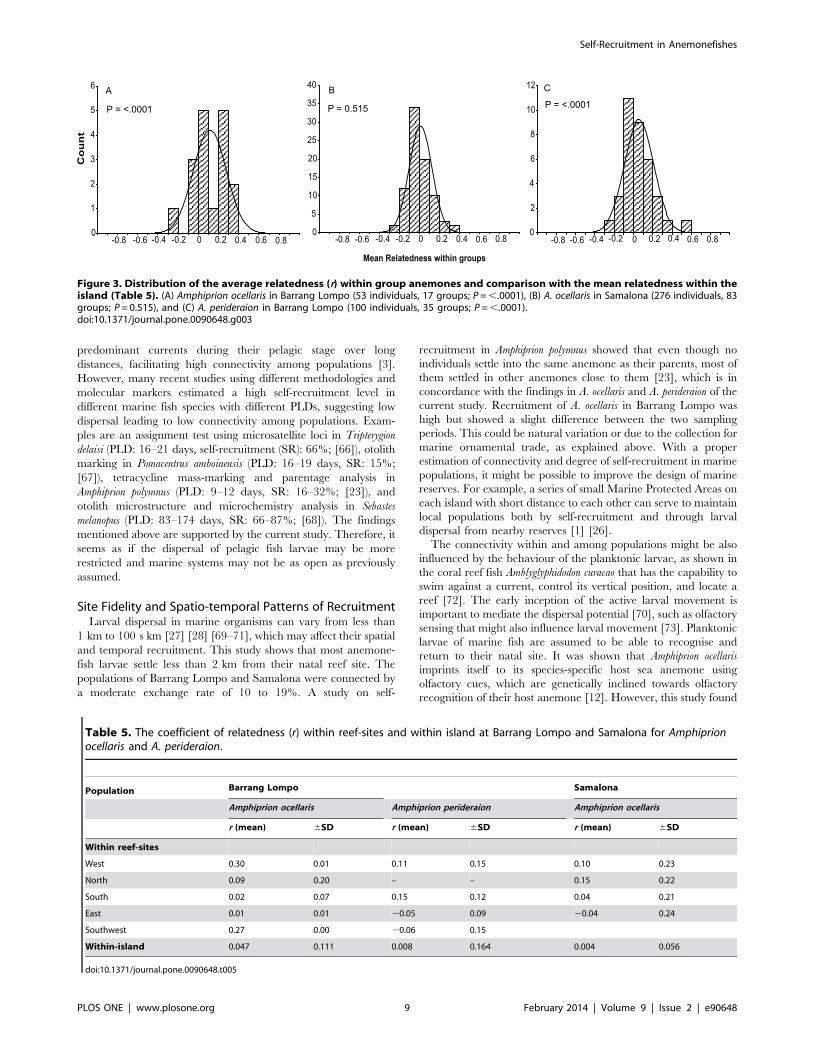
Genetic RelatednessThe mean coefficient of relatedness of Amphiprion ocellaris
individuals within anemone groups at Barrang Lompo was
0.10860.162 (mean 6 SD; n=17 groups), which was significantly
higher than the mean within-island relatedness of 0.04760.111
(SD) (P=,.0001, Fig. 3A, Table 5). Thus, at Barrang Lompo, A.
ocellaris sharing an anemone were more closely related to one
another than to other individuals on the island. In contrast, at
Samalona, the mean coefficient of relatedness of A. ocellaris
individuals within anemone groups was 0.00160.114 (mean 6
SD; n=83 groups), not significantly different than the mean of
0.00460.056 (SD) for within-island relatedness (P=0.515, Fig. 3B).
The value for within-anemone group relatedness of A. perideraion at
Barrang Lompo was 0.05160.151 (mean 6 SD; n=35 groups)
significantly higher than the mean of 0.00860.164 (SD) within-
island relatedness (P=,.0001, Fig. 3C, Table 5). Within-reef
relatedness ranged from 20.0460.24 to 0.3060.01 (mean 6 SD)
for Amphiprion ocellaris populations, while for the A. perideraion
population it ranged from 20.0660.15 to 0.1560.12 (mean 6
SD).
Discussion
Self RecruitmentThe present study revealed high self-recruitment of anemone-
fishes within reefs surrounding small islands, with 47–65% of
Amphiprion ocellaris and A. perideraion progeny staying on their natal
island. Self-recruitment of A. ocellaris (65%) at Samalona is higher
than the 42% reported from a previous study on the sibling species
A. percula [26]. The high self-recruitment in Samalona and Barrang
Lompo is in agreement with evidence of restricted gene flow
revealed in Spermonde Archipelago and across the Indo-Malay
Archipelago [34]. Restricted dispersal might be triggered by the
sheltered environment within the mid-shelf of Spermonde
Archipelago, where the study islands are located, compared to
outer shelf of the archipelago, which are strongly affected by the
Northwest Monsoon [35].
Self-recruitment rates in Barrang Lompo (Amphiprion ocellaris:
47.4%; A. perideraion: 46.9%) were lower than in Samalona (A.
ocellaris: 65.2%). Self-recruitment in Amphiprion ocellaris varied from
44% to 52% between the two sampling periods in Barrang
Lompo. One possible hypothesis is that the self-recruitment rate
on Barrang Lompo may be biased by high fishing pressure [38]
[61] [62]. Parent anemonefish could be removed by ornamental
fishermen, thus deflating the estimate of self-recruitment.
The pelagic larval duration (PLD) varies from days to weeks in
different species of coral reef fish [7] and thus may influence their
dispersal distance. Due to pelagic dispersal of eggs and larvae,
most marine species have been considered as open populations
[63], even though this is under discussion [64] [65]. In an open
marine population, fish larvae are assumed to be transported by
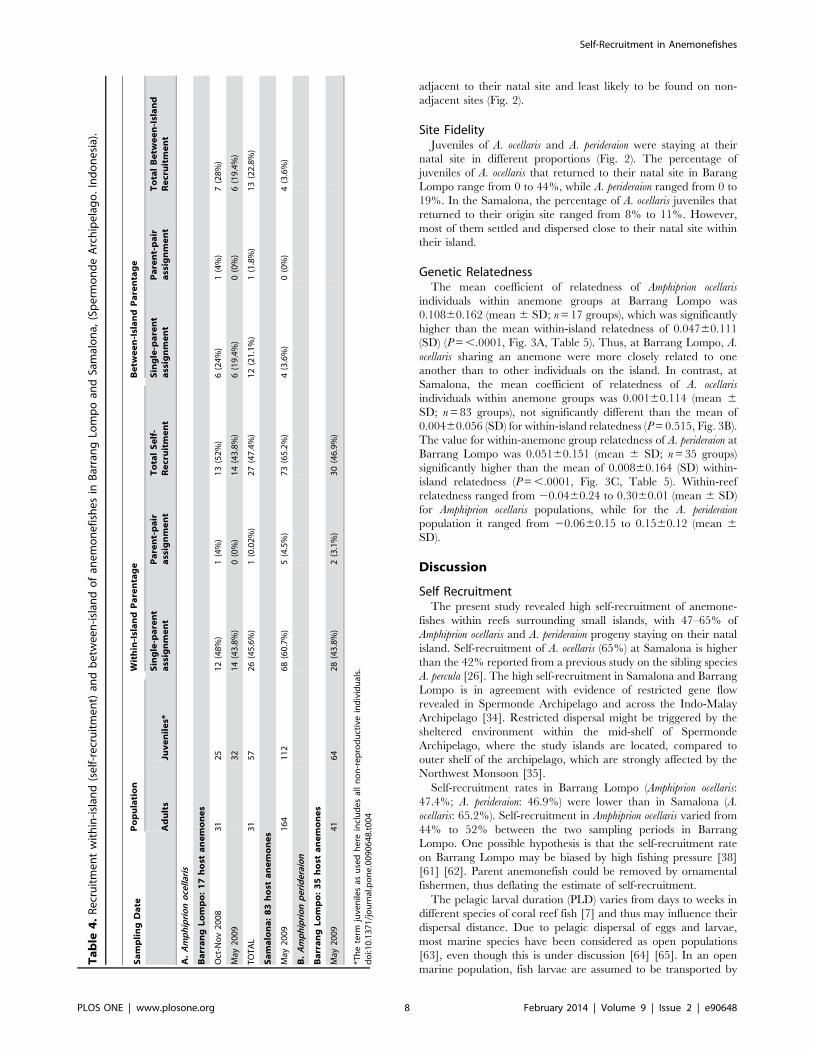
Table
4.Recruitmentwithin-islan
d(self-recruitment)an
dbetw
een-islan
dofan
emonefishesin
BarrangLo
mpoan
dSamalona,
(Sperm
ondeArchipelago.Indonesia).
SamplingDate
Population
Within-IslandParentage
Betw
een-IslandParentage
Adults
Juveniles*
Single-parent
assignment
Parent-pair
assignment
TotalSelf-
Recruitment
Single-parent
assignment
Parent-pair
assignment
TotalBetw
een-Island
Recruitment
A.Amphiprionocellaris
BarrangLompo:17host
anemones
Oct-Nov2008
31
25
12(48%)
1(4%)
13(52%)
6(24%)
1(4%)
7(28%)
May
2009
32
14(43.8%)
0(0%)
14(43.8%)
6(19.4%)
0(0%)
6(19.4%)
TOTAL
31
57
26(45.6%)
1(0.02%)
27(47.4%)
12(21.1%)
1(1.8%)
13(22.8%)
Samalona:83host
anemones
May
2009
164
112
68(60.7%)
5(4.5%)
73(65.2%)
4(3.6%)
0(0%)
4(3.6%)
B.Amphiprionperideraion
BarrangLompo:35host
anemones
May
2009
41
64
28(43.8%)
2(3.1%)
30(46.9%)
*Theterm
juvenilesas
usedhere
includesallnon-reproductiveindividuals.
doi:10.1371/journal.pone.0090648.t004
Self-Recruitment in Anemonefishes
PLOS ONE | www.plosone.org 8 February 2014 | Volume 9 | Issue 2 | e90648
predominant currents during their pelagic stage over long
distances, facilitating high connectivity among populations [3].
However, many recent studies using different methodologies and
molecular markers estimated a high self-recruitment level in
different marine fish species with different PLDs, suggesting low
dispersal leading to low connectivity among populations. Exam-
ples are an assignment test using microsatellite loci in Tripterygion
delaisi (PLD: 16–21 days, self-recruitment (SR): 66%; [66]), otolith
marking in Pomacentrus amboinensis (PLD: 16–19 days, SR: 15%;
[67]), tetracycline mass-marking and parentage analysis in
Amphiprion polymnus (PLD: 9–12 days, SR: 16–32%; [23]), and
otolith microstructure and microchemistry analysis in Sebastes
melanopus (PLD: 83–174 days, SR: 66–87%; [68]). The findings
mentioned above are supported by the current study. Therefore, it
seems as if the dispersal of pelagic fish larvae may be more
restricted and marine systems may not be as open as previously
assumed.
Site Fidelity and Spatio-temporal Patterns of RecruitmentLarval dispersal in marine organisms can vary from less than
1 km to 100 s km [27] [28] [69–71], which may affect their spatial
and temporal recruitment. This study shows that most anemone-
fish larvae settle less than 2 km from their natal reef site. The
populations of Barrang Lompo and Samalona were connected by
a moderate exchange rate of 10 to 19%. A study on self-
recruitment in Amphiprion polymnus showed that even though no
individuals settle into the same anemone as their parents, most of
them settled in other anemones close to them [23], which is in
concordance with the findings in A. ocellaris and A. perideraion of the
current study. Recruitment of A. ocellaris in Barrang Lompo was
high but showed a slight difference between the two sampling
periods. This could be natural variation or due to the collection for
marine ornamental trade, as explained above. With a proper
estimation of connectivity and degree of self-recruitment in marine
populations, it might be possible to improve the design of marine
reserves. For example, a series of small Marine Protected Areas on
each island with short distance to each other can serve to maintain
local populations both by self-recruitment and through larval
dispersal from nearby reserves [1] [26].
The connectivity within and among populations might be also
influenced by the behaviour of the planktonic larvae, as shown in
the coral reef fish Amblyglyphidodon curacao that has the capability to
swim against a current, control its vertical position, and locate a
reef [72]. The early inception of the active larval movement is
important to mediate the dispersal potential [70], such as olfactory
sensing that might also influence larval movement [73]. Planktonic
larvae of marine fish are assumed to be able to recognise and
return to their natal site. It was shown that Amphiprion ocellaris
imprints itself to its species-specific host sea anemone using
olfactory cues, which are genetically inclined towards olfactory
recognition of their host anemone [12]. However, this study found
Figure 3. Distribution of the average relatedness (r) within group anemones and comparison with the mean relatedness within theisland (Table 5). (A) Amphiprion ocellaris in Barrang Lompo (53 individuals, 17 groups; P=,.0001), (B) A. ocellaris in Samalona (276 individuals, 83groups; P= 0.515), and (C) A. perideraion in Barrang Lompo (100 individuals, 35 groups; P=,.0001).doi:10.1371/journal.pone.0090648.g003
Table 5. The coefficient of relatedness (r) within reef-sites and within island at Barrang Lompo and Samalona for Amphiprionocellaris and A. perideraion.
Population Barrang Lompo Samalona
Amphiprion ocellaris Amphiprion perideraion Amphiprion ocellaris
r (mean) 6SD r (mean) 6SD r (mean) 6SD
Within reef-sites
West 0.30 0.01 0.11 0.15 0.10 0.23
North 0.09 0.20 – – 0.15 0.22
South 0.02 0.07 0.15 0.12 0.04 0.21
East 0.01 0.01 20.05 0.09 20.04 0.24
Southwest 0.27 0.00 20.06 0.15
Within-island 0.047 0.111 0.008 0.164 0.004 0.056
doi:10.1371/journal.pone.0090648.t005
Self-Recruitment in Anemonefishes
PLOS ONE | www.plosone.org 9 February 2014 | Volume 9 | Issue 2 | e90648
that juveniles come back to their natal reef but not to their natal
anemone. In order to facilitate retention, fish larvae may use
odour recognition [74]. In addition, the connectivity within and
among populations in anemone fish is limited by their relatively
short PLD of about 8–12 days. However, exploitation of species,
leading to decreased population density and body size [33] [75]
[76], could also reduce larval abundance and reduce the dispersal
kernel and effective connectivity distances [77].
Genetic RelatednessThe average genetic relatedness in Barrang Lompo populations
showed that A. ocellaris and A. perideraion individuals within an
anemone were more closely related to one another than to other
individuals on the island, indicating that fish larvae do not disperse
far from their parents. The values of genetic relatedness are in
concordance with the coefficient of inbreeding. The current study
observed low but positive values of the inbreeding coefficient for A.
ocellaris and A. perideraion at Barrang Lompo, meaning that there is
an indication to inbreeding in these populations.
The close relationship between individuals within a site at
Barrang Lompo might be explained by several mechanisms. Many
marine fishes have the ability to recognise their relatives in order to
avoid inbreeding and competition [78]. However, due to a low
abundance of anemones as a result of removal by the ornamental
fishery [33], the pelagic larvae might not be able to avoid settling
to their natal anemone. Close relatedness between individuals in
an anemone may lead to inbreeding, which increase homozygos-
ity, causes deleterious alleles in the first generation and reduces the
adaptive capacity of species, and could lead to increased mortality
[79] [80].
In contrast, individuals inhabiting an anemone were unrelated
in A. ocellaris at Samalona. These results agree with findings in A.
percula [29] and Dascyllus aruanus [81], forming groups consisting of
unrelated individuals.
Implications for Management and ConservationAnemonefishes have been exploited for marine ornamental
fishery and traded globally for many years. Most marine
ornamental fish species are collected from the wild, with Indonesia
and the Philippines as the major exporters [30]. In order to avoid
overexploitation and to reduce the pressure on natural popula-
tions, some efforts have been made to rear ornamental fish species
[82–84]. Anemone fish such A. ocellaris have been successfully bred
in captivity [85], which is potentially a good solution to meet the
high demand. However, mariculture needs comprehensive
knowledge of the biology of the reared fish species and is
expensive [83] [86]. Therefore, it seems that mariculture would be
difficult to be implemented for many ornamental species,
especially in developing countries. In Spermonde Archipelago,
A. ocellaris is the most collected marine ornamental fish species and
this fishery has a negative impact [33]. However, there is no quota
for anemonefishes in Indonesia so far.
The two focal species (A. ocellaris and A. perideraion) have not yet
been included in the CITES list (Convention on International
Trade in Endangered Species of Wild Fauna and Flora), which
aims to prevent overexploitation by controlling international trade
[87]. Considering the high level of exploitation, a proper
management plan and conservation strategy should be imple-
mented for this species in Spermonde Archipelago [33]. Imple-
mentation of MPAs as a tool to manage fisheries and marine
biodiversity has been used to protect coral reefs from overexploi-
tation, increase fish populations, restore ecosystem health, and
prevent local extinctions [88–91]. However, determining the
optimal size and location of self-sustaining MPAs is essential for
promoting population persistence [6] [92–94].
The high amount of self-recruitment of Amphiprion ocellaris and A.
perideraion found in the current study gives valuable information for
management and conservation strategies within the region. High
levels of self-recruitment imply that the populations are more
vulnerable to local fishing activity [95]. While further studies on
other marine organisms are needed, the current study suggests that
single marine protected areas (MPAs) are not suitable as sources
for the replenishment of exploited populations. Small MPAs,
preferably at every island or reef, should ensure that a part of the
population is protected to allow for replenishment by self-
recruitment. In addition, the population size should be estimated
in order to establish appropriate catch quotas.
Supporting Information
Table S1 Error rates on parentage assignment and geneflow for different populations of parents and juveniles.Bold numbers indicate the LOD thresholds used for parentage
analysis in the program Famoz. [Abbreviations: Juvs = Juveniles;
BL=Barrang Lompo; S= Samalona; SP= single parent;
PP= parent pair].
(DOC)
Acknowledgments
We would like to thank to the institutions and individuals that have made
our study possible: German Academic Exchange Service (DAAD) for the
PhD scholarship to H. Madduppa; Centre for Tropical Marine Ecology
(Bremen, Germany) for SPICE project co-ordination; A. Nuryanto from
the Jenderal Soedirman University (Purwokerto, Indonesia) for his help
during field work, colleagues from Hasanuddin University (Makassar,
Indonesia) and Bogor Agricultural University (IPB Bogor, Indonesia) for
logistical support during field work; Bagus (IPB) for statistical advise and S.
Gerber (INRA, France) and P. Sainz-Agudelo (Universite de Perpignan,
France) for their technical assistance with the FaMoz software. We would
like to extend our gratitude to M.J. Shulman and two reviewers for their
constructive comments and suggestions on the manuscript.
Author Contributions
Conceived and designed the experiments: HM MK. Performed the
experiments: HM. Analyzed the data: HM JT MK. Contributed reagents/
materials/analysis tools: MK HM. Wrote the paper: HM.
References
1. Jones G, Almany G, Russ G, Sale P, Steneck R, et al. (2009) Larval retention
and connectivity among populations of corals and reef fishes: history, advances
and challenges. Coral Reefs 28: 3072325.
2. Fairweather PG (1991) Implications of ‘supply-side’ ecology for environmental
assessment and management. Trends Ecol Evol 6: 60263.
3. Roberts CM (1997) Connectivity and management of Caribbean coral reefs.
Science 278: 145421457.
4. Underwood AJ, Fairweather PG (1989) Supply-side ecology and benthic marine
assemblages. Trends Ecol Evol 4; 16220.
5. Almany G, Connolly S, Heath D, Hogan J, Jones G, et al. (2009) Connectivity,
biodiversity conservation and the design of marine reserve networks for coral
reefs. Coral Reefs 28: 3392351.
6. Sala E, Aburto-Oropeza O, Paredes G, Parra I, Barrera JC, et al. (2002) A
general model for designing networks of marine reserves. Science 298: 19912
1993.
7. Wellington GM, Victor BC (1989) Planktonic larval duration of one hundred
species of Pacific and Atlantic damselfishes (Pomacentridae). Mar Biol 101:
5572567.
Self-Recruitment in Anemonefishes
PLOS ONE | www.plosone.org 10 February 2014 | Volume 9 | Issue 2 | e90648
8. Lester SE, Ruttenberg BI (2005) The relationship between pelagic larvalduration and range size in tropical reef fishes: a synthetic analysis. Proc Biol Sci
272: 5852591.
9. Wilson DT, Meekan MG (2001) Environmental influences on patterns of larval
replenishment in coral reef fishes. Mar Ecol Prog Ser 222: 1972207.
10. Sponaugle S, Cowen RK, Shanks A, Morgan SG, Leis JM, et al. (2002)
Predicting self-recruitment in marine populations: Biophysical correlates and
mechanisms. Mar Pollut Bull 70: 3412375.
11. Leis JM, Sweatman HPA, Reader SE (1996) What the pelagic stages of coral reef
fishes are doing out in blue water: daytime field observations of larval
behavioural capabilities. Mar Freshw Res 47: 401–411.
12. Arvedlund M, Nielsen LE (1996) Do the anemonefish Amphiprion ocellaris (Pisces:
Pomacentridae) imprint themselves to their host sea Anemone Heteractis magnifica
(Anthozoa: Actinidae)? Ethology 102: 1972211.
13. Fisher R, Bellwood DR, Job S (2000) Development of swimming abilities in reef
fish larvae. Mar Ecol Prog Ser 202: 1632173.
14. Kingsford MJ, Leis JM, Shanks A, Lindeman KC, Morgan SG, et al. (2002)Sensory environments, larval abilities and local self-recruitment. Bull Mar Sci
70: 3092340.
15. Bruford MW, Wayne RK (1993) Microsatellites and their application topopulation genetic studies. Curr Opin Genet Dev 3: 9392943.
16. Wright JM, Bentzen P (1994) Microsatellites: genetic markers for the future. Rev
Fish Biol Fish 4: 3842388.
17. Ferguson A, Taggart JB, Prodohl PA, McMeel O, Thompson C, et al. (1995)
The application of molecular markers to the study and conservation of fish
populations, with special reference to Salmo. J Fish Biol 47: 1032126.
18. Sunnucks P (2000) Efficient genetic markers for population biology. Trends Ecol
Evol 15: 1992203.
19. Schwartz MK, Luikart G, Waples RS (2007) Genetic monitoring as a promisingtool for conservation and management. Trends Ecol Evol 22: 25233.
20. Tautz D (1989) Hypervariability of simple sequences as a general source for
polymorphic DNA markers. Nucleic Acids Res 17: 646326471.
21. Selkoe KA, Toonen RJ (2006) Microsatellites for ecologists: a practical guide to
using and evaluating microsatellite markers. Ecol Lett 9: 6152629.
22. Jones AG, Ardren WR (2003) Methods of parentage analysis in naturalpopulations. Mol Ecol 12: 251122523.
23. Jones GP, Planes S, Thorrold SR (2005) Coral reef fish larvae settle close to
home. Curr Biol 15: 131421318.
24. Almany GR, Berumen ML, Thorrold SR, Planes S, Jones GP (2007) Local
replenishment of coral reef fish populations in a marine reserve. Science 316:
7422744.
25. Daly-Engel TS, Grubbs RD, Bowen BW, Toonen RJ (2007) Frequency of
multiple paternity in an unexploited tropical population of sandbar sharks
(Carcharhinus plumbeus). Can J Fish Aquat Sci 64: 1982204.
26. Planes S, Jones GP, Thorrold SR (2009) Larval dispersal connects fishpopulations in a network of marine protected areas. Proc Natl Acad Sci U S A
106: 569325697.
27. Saenz-Agudelo P, Jones GP, Thorrold SR, Planes S (2009) Estimatingconnectivity in marine populations: an empirical evaluation of assignment tests
and parentage analysis under different gene flow scenarios. Mol Ecol 18: 17652
1776.
28. Saenz-Agudelo P, Jones GP, Thorrold SR, Planes S (2011) Connectivity
dominates larval replenishment in a coastal reef fish metapopulation. Proc Biol
Sci 278: 295422961.
29. Buston PM, Bogdanowicz SM, Wong A, Harrison RG (2007) Are clownfish
groups composed of close relatives? An analysis of microsatellite DNA variation
in Amphiprion percula. Mol Ecol 16: 367123678.
30. Wabnitz C, Taylor M, Green E, Razak T (2003) From ocean to aquarium: the
global trade in marine ornamental species. UNEP-WCMC. Cambridge, UK.
31. Fricke H, Fricke S (1977) Monogamy and sex change by aggressive dominance
in coral reef fish. Nature 266: 8302832.
32. Fautin DG, Allen GR (1994) Anemonefishes and their host sea anemones, Tetra
Press, Germany.
33. Madduppa HH (2012) Self-recruitment in anemonefish and the impact of
marine ornamental fishery in Spermonde Archipelago, Indonesia: implications
for management and conservation. PhD thesis. University of Bremen, Germany.
34. Timm J, Kochzius M (2008) Geological history and oceanography of the Indo-Malay Archipelago shape the genetic population structure in the false clown
anemonefish (Amphiprion ocellaris). Mol Ecol 17: 399924014.
35. Tomascik T, Mah A, Nontji A, Moosa M (1997) The ecology of Indonesian seas.Part II. Periplus Edition Ltd.
36. Wyrtki K (1961) Physical oceanography of Southeast Asian waters. NAGA
report. The University of California, Scripps Institution of Oceanography.LaJolla, California.
37. James MK, Armsworth PR, Mason LB, Bode L (2002) The structure of reef fish
metapopulations: modelling larval dispersal and retention patterns. Proc Biol Sci269: 207922086.
38. Edinger EN, Jompa J, Limmon GV, Widjatmoko W, Risk MJ (1998) Reef
degradation and coral biodiversity in Indonesia: effects of land-based pollution,destructive fishing practices and changes over time. Mar Pollut Bull 36: 6172
630.
39. Edinger EN, Risk MJ (2000) Reef classification by coral morphology predicts
coral reef conservation value. Biol Conserv 92: 1213.
40. Moyer JT, Nakazono A (1978) Protandrous hermaphroditism in six species ofthe anemonefish genus Amphiprion in Japan. Gyoruigaku Zasshi 25: 1012106.
41. Wang L, Shi X, Su Y, Meng Z, Lin H (2012) Loss of genetic diversity in the
cultured stocks of the Large Yellow Croaker, Larimichthys crocea, revealed by
microsatellites. Int J Mol Sci 13: 5584–5597.
42. Quenouille B, Bouchenak-Khelladi Y, Hervet C, Planes S (2004) Elevenmicrosatellite loci for the saddleback clownfish Amphiprion polymnus. Mol Ecol
Notes 4: 291–293.
43. Liu SYV, Yu HT, Dai CF (2007) Eight microsatellite loci in Clark’s
anemonefish, Amphiprion clarkii. Mol Ecol Notes 7: 1169–1171.
44. Van-Oosterhout C, Hutchinson WF, Wills DPM, Shipley P (2004) Micro-checker: software for identifying and correcting genotyping errors in microsat-
ellite data. Mol Ecol Notes 4: 5352538.
45. Nei M (1973) Analysis of gene diversity in subdivided populations. Proc Natl
Acad Sci U S A 70: 332123323.
46. Botstein D, White RL, Skolnick M, Davis RW (1980) Construction of a genetic
linkage map in man using restriction fragment length polymorphisms. Am J HumGenet 32: 3142331.
47. Marshall TC, Slate J, Kruuk LEB, Pemberton JM (1998) Statistical confidence
for likelihood-based paternity inference in natural populations. Mol Ecol 7:
6392655.
48. Raymond M, Rousset F (1995) GENEPOP (Version 1.2): Population geneticssoftware for exact tests and ecumenicism. J Hered 86: 2482249.
49. Rousset F (2008) Genepop’007: a complete re-implementation of the genepopsoftware for Windows and Linux. Mol Ecol Resour 8: 1032106.
50. Goudet J (1995) FSTAT (Version 1.2): A computer program to calculate F-
statistics. J Hered 86: 4852486.
51. Weir BS, Cockerham CC (1984) Estimating F-Statistics for the Analysis of
Population Structure. Evolution 38: 1358–1370.52. Glaubitz JC (2004) Convert: A user-friendly program to reformat diploid
genotypic data for commonly used population genetic software packages. MolEcol Notes 4: 3092310.
53. Gerber S, Chabrier P, Kremer A (2003) FAMOZ: a software for parentage
analysis using dominant, codominant and uniparentally inherited markers. Mol
Ecol Notes 3: 4792481.
54. Meagher TR (1986) Analysis of paternity within anatural population ofChamaelirium luteum. 1. Identification of most-likely maleparents. Am Nat 128:
1992215.
55. Jamieson A, Taylor SCS (1997) Comparisons of three probability formulae for
parentage exclusion. Anim Genet 28: 3972400.
56. Gerber S, Mariette S, Streiff R, Bodenes C, Kremer A (2000) Comparison ofmicrosatellites and amplified fragment length polymorphism markers for
parentage analysis. Mol Ecol 9: 103721048.
57. Meagher TR, Thompson E (1986) The relationship between single parent and
parent pair genetic likelihoods in genealogy reconstruction. Theor Popul Biol 29:872106.
58. Konovalov DA, Manning C, Henshaw MT (2004) Kingroup: a program forpedigree relationship reconstruction and kin group assignments using genetic
markers. Mol Ecol Notes 4: 7792782.
59. Goodnight KF, Queller DC (1999) Computer software for performing likelihood
tests of pedigree relationship using genetic markers. Mol Ecol 8: 123121234.
60. SAS Institute Inc (2012) Base SAS 9.3 Procedure Guide: Statistical Procedures,Second Edition, Cary, NC: SAS Institute Inc.
61. Erdmann M (1995) The ABC guide to coral reef fisheries in southwest Sulawesi,Indonesia. NAGA The ICLARM quarterly. April: 426.
62. Chozin M (2008) Illegal but common: Life of blast fishermen in the Spermonde
Archipelago, South Sulawesi, Indonesia. Ohio University. Ohio.
63. Caley MJ, Carr MH, Hixon MA, Hughes TP, Jones GP, et al. (1996)
Recruitment and the local dynamics of open marine populations. Annu RevEcol Syst 27: 4772500.
64. Cowen RK, Lwiza KMM, Sponaugle S, Paris CB, Olson DB (2000)Connectivity of marine populations: open or closed? Science 287: 8572859.
65. Mora C, Sale PF (2002) Are populations of coral reef fish open or closed? Trends
Ecol Evol 17: 4222428.
66. Carreras-Carbonell J, Macpherson E, Pascual M (2007) High self-recruitment
levels in a Mediterranean littoral fish population revealed by microsatellitemarkers. Mar Biol 151: 7192727.
67. Jones GP, Milicich MJ, Emslie MJ, Lunow C (1999) Self-recruitment in a coral
reef fish population. Nature 402: 8022804.
68. Miller JA, Shanks AL (2004) Evidence for limited larval dispersal in black
rockfish (Sebastes melanops): implications for population structure and marine-reserve design. Can J Fish Aquat Sci 61: 1723–1735.
69. Swearer SE, Shima JS, Hellberg ME, Thorrold SR, Jones GP, et al. (2002)Evidence of self-recruitment in demersal marine populations. Bull Mar Sci 70:
2512271.
70. Cowen RK, Paris CB, Srinivasan A (2006) Scaling of connectivity in marine
populations. Science 311: 5222527.
71. Salas E, Molina-Urena H, Walter R, Heath D (2010) Local and regional geneticconnectivity in a Caribbean coral reef fish. Mar Biol 157: 4372445.
72. Leis J, Wright K, Johnson R (2007) Behaviour that influences dispersal andconnectivity in the small, young larvae of a reef fish. Mar Biol 153: 1032117.
73. Gerlach G, Atema J, Kingsford MJ, Black KP, Miller-Sims V (2007) Smelling
home can prevent dispersal of reef fish larvae. Proc Natl Acad Sci U S A 104:
8582863.
Self-Recruitment in Anemonefishes
PLOS ONE | www.plosone.org 11 February 2014 | Volume 9 | Issue 2 | e90648

74. Atema J, Kingsford MJ, Gerlach G (2002) Larval reef fish could use odour for
detection, retention and orientation to reefs. Mar Ecol Prog Ser 241: 1512160.75. Polunin NVC, Roberts CM (1993) Greater biomass and value of target coral-
reef fishes in two small Caribbean marine reserves. Mar Ecol Prog Ser 100:
1672176.76. Birkeland C, Dayton PK (2005) The importance in fishery management of
leaving the big ones. Trends Ecol Evol 20: 3562358.77. Steneck RS (2006) Staying connected in a turbulent world. Science 311: 4802
481.
78. Ward AJW, Hart PJB (2003) The effects of kin and familiarity on interactionsbetween fish. Fish and Fisheries 4: 3482358.
79. Wright S (1932) The roles of mutation, inbreeding, crossbreeding and selectionin evolution. Proceedings of the 6th International Congress of Genetics, 3562
366.80. Charlesworth D, Charlesworth B (1987) Inbreeding depression and its
evolutionary consequences. Annu Rev Ecol Syst 18: 2372268.
81. Buston PM, Fauvelot C, Wong MY, Planes S (2009) Genetic relatedness ingroups of the humbug damselfish Dascyllus aruanus: small, similar-sized
individuals may be close kin. Mol Ecol 18: 470724715.82. Danilowicz BS, Brown CL (1992) Rearing methods for two damselfish species:
Dascyllus albisella (Gill) and D. aruanus (L.). Aquaculture 106: 1412149.
83. Ogawa T, Brown CL (2001) Ornamental reef fish aquaculture and collection inHawaii. Aqua Sci Conserv 3: 1512169.
84. Johnston G, Kaiser H, Hecht T, Oellermann L (2003) Effect of ration size andfeeding frequency on growth, size distribution and survival of juvenile clownfish,
Amphiprion percula. J Appl Ichthyol 19: 40243.85. Madhu K, Madhu R, Krishnan L, Sasidharan CS, Venugopal KM (2006)
Spawning and larval rearing of Amphiprion ocellaris under captive condition.
Marine Fisheries Information Service, Technical and Extension Series 188: 12
5.
86. Tucker CS (2000) Off-flavor problems in aquaculture. Reviews in Fisheries
Science 8: 45–88.
87. CITES (2013) CITES (the Convention on International Trade in Endangered
Species of Wild Fauna and Flora). Available: http://www.cites.org. Accessed
2013 Sept 24.
88. Agardy MT (1994) Advances in marine conservation: the role of marine
protected areas. Trends Ecol Evol 9: 2672270.
89. Bohnsack JA (1998) Application of marine reserves to reef fisheries management.
Austral J Ecol 23: 2982304.
90. Gonzalez A, Lawton JH, Gilbert FS, Blackburn TM, Evans-Freke I (1998)
Metapopulation dynamics, abundance, and distribution in a microecosystem.
Science 281: 204522047.
91. Botsford LW, Micheli F, Hastings A (2003) Principles for the design of marine
reserves. Ecol Appl 13: 25231.
92. Gell FR, Roberts CM (2003) Benefits beyond boundaries: the fishery effects of
marine reserves. Trends Ecol Evol 18: 4482455.
93. Palumbi SR (2004) Marine reserves and ocean neighborhoods: the spatial scale
of marine populations and their management. Annu Rev Environ Resour 29:
31268.
94. Sale PF, Cowen RK, Danilowicz BS, Jones GP, Kritzer JP, et al. (2005) Critical
science gaps impede use of no-take fishery reserves. Trends Ecol Evol 20:, 742
80.
95. Thorrold SR, Latkoczy C, Swart PK, Jones CM (2001) Natal homing in a
marine fish metapopulation. Science 291: 2972299.
Self-Recruitment in Anemonefishes
PLOS ONE | www.plosone.org 12 February 2014 | Volume 9 | Issue 2 | e90648


![Interspecific Interactions Simple Assignment 2ak6ehl[1]](https://static.fdocuments.in/doc/165x107/577cc9cb1a28aba711a4a461/interspecific-interactions-simple-assignment-2ak6ehl1.jpg)


