Interrogating the Escherichia coli cell cycle by cell dimension...
12
BIOCHEMISTRY Interrogating the Escherichia coli cell cycle by cell dimension perturbations Hai Zheng a,b , Po-Yi Ho c , Meiling Jiang a , Bin Tang d , Weirong Liu a,b , Dengjin Li a , Xuefeng Yu e , Nancy E. Kleckner f , Ariel Amir c,1 , and Chenli Liu a,b,1 a Center for Synthetic Biology Engineering Research, Shenzhen Institutes of Advanced Technology, Chinese Academy of Sciences, Shenzhen 518055, People’s Republic of China; b University of Chinese Academy of Sciences, Beijing 100049, People’s Republic of China; c School of Engineering and Applied Sciences, Harvard University, Cambridge, MA 02138; d Department of Materials Science and Engineering, Southern University of Science and Technology, Shenzhen 518055, People’s Republic of China; e Institute of Biomedicine and Biotechnology, Shenzhen Institutes of Advanced Technology, Chinese Academy of Sciences, Shenzhen 518055, People’s Republic of China; and f Department of Molecular and Cellular Biology, Harvard University, Cambridge, MA 02138 Edited by Kiyoshi Mizuuchi, National Institutes of Health, Bethesda, MD, and approved November 14, 2016 (received for review September 30, 2016) Bacteria tightly regulate and coordinate the various events in their cell cycles to duplicate themselves accurately and to control their cell sizes. Growth of Escherichia coli, in particular, follows a relation known as Schaechter’s growth law. This law says that the average cell volume scales exponentially with growth rate, with a scaling exponent equal to the time from initiation of a round of DNA replication to the cell division at which the corresponding sister chromosomes segregate. Here, we sought to test the robust- ness of the growth law to systematic perturbations in cell dimen- sions achieved by varying the expression levels of mreB and ftsZ. We found that decreasing the mreB level resulted in increased cell width, with little change in cell length, whereas decreasing the ftsZ level resulted in increased cell length. Furthermore, the time from replication termination to cell division increased with the perturbed dimension in both cases. Moreover, the growth law remained valid over a range of growth conditions and dimension perturbations. The growth law can be quantitatively interpreted as a consequence of a tight coupling of cell division to replication initiation. Thus, its robustness to perturbations in cell dimensions strongly supports models in which the timing of replication initia- tion governs that of cell division, and cell volume is the key phe- nomenological variable governing the timing of replication initia- tion. These conclusions are discussed in the context of our recently proposed “adder-per-origin” model, in which cells add a constant volume per origin between initiations and divide a constant time after initiation. cell cycle | cell growth | E. coli | DNA replication | cell dimension B acteria can regulate tightly and coordinate the various events in their cell cycles to accurately duplicate their genomes and to homeostatically regulate their cell sizes. This is a particular challenge under fast growth conditions where cells are under- going multiple concurrent rounds of DNA replication. Despite much progress, we still have an incomplete understanding of the processes that coordinate DNA replication, cell growth, and cell division. This lack of understanding is manifested, for instance, in discrepancies among various recent studies that pro- pose different models for control of cell division in the bacterium Escherichia coli. One class of models suggests that cell division is triggered by the accumulation of a constant size (e.g., volume, length, or sur- face area) between birth and division (1–3). Such models are sup- ported by experiments measuring correlations between cell size at birth and cell size at division, which showed that, when aver- aged over all cells of a given birth size vB , cell size at division vD approximately follows vD = vB + v0, [1] where the constant v0 sets the average cell size at birth. This is known as the “incremental” or “adder” model, and cells follow- ing this behavior are said to exhibit “adder correlations” (1–7). Importantly, these models postulate that cell division is governed by a phenomenological size variable, with no explicit reference to DNA replication. A second class of models for control of cell division postulates that cell division is governed by the process of DNA replica- tion, which can be described as follows. The time from a repli- cation initiation event to the cell division that segregates the corresponding sister chromosomes can be split into the C period, from initiation to termination of replication, and the D period, from termination of replication to cell division (8, 9). Both the C and D periods remain constant at ∼40 min and 20 min, respec- tively, for cells grown in various growth media supporting a range of doubling times between 20 min and 60 min (10, 11). We refer to growth rates within this range as fast. All experiments described here are carried out under such fast growth conditions. Note that C + D is ∼60 min and larger than the time between divisions at fast growth. This situation is achieved by the occur- rence of multiple ongoing rounds of replication. That is, under these conditions, a cell initiates a round of replication simulta- neously at multiple origins that ultimately give rise to the chro- mosomes of their granddaughters or even great-granddaughters (12). Extending the basic definition of the C and D periods, Cooper and Helmstetter specifically proposed that an initiation event triggers a division after a time C + D , thereby ensuring that cells divide only after the completion of a round of DNA replication (8, 10). This Cooper–Helmstetter (CH) formulation, hereafter the CH model, belongs to the second class of models for control of cell division. Significance How bacteria regulate cell division to achieve cell size home- ostasis, with concomitant coordination of DNA replication, is a fundamental question. Currently, there exist several compet- ing models for cell cycle regulation in Escherichia coli. We per- formed experiments where we systematically perturbed cell dimensions and found that average cell volume scales expo- nentially with the product of the growth rate and the time from initiation of DNA replication to the corresponding cell division. Our data support a model in which cells initiate repli- cation on average at a constant volume per origin and divide a constant time thereafter. Author contributions: C.L. designed research; H.Z., P.H., M.J., B.T., W.L., D.L., X.Y., N.E.K., A.A., and C.L. performed research; P.H., N.E.K., A.A., and C.L. analyzed data; and P.H., N.E.K., A.A., and C.L. wrote the paper. The authors declare no conflict of interest. This article is a PNAS Direct Submission. Freely available online through the PNAS open access option. 1 To whom correspondence may be addressed. Email: [email protected] or arielamir@ seas.harvard.edu . This article contains supporting information online at www.pnas.org/lookup/suppl/doi:10. 1073/pnas.1617932114/-/DCSupplemental . www.pnas.org/cgi/doi/10.1073/pnas.1617932114 PNAS Early Edition | 1 of 6
Transcript of Interrogating the Escherichia coli cell cycle by cell dimension...
BIO
CHEM
ISTR
Y
Interrogating the Escherichia coli cell cycle by celldimension perturbationsHai Zhenga,b, Po-Yi Hoc, Meiling Jianga, Bin Tangd, Weirong Liua,b, Dengjin Lia, Xuefeng Yue, Nancy E. Klecknerf,Ariel Amirc,1, and Chenli Liua,b,1
aCenter for Synthetic Biology Engineering Research, Shenzhen Institutes of Advanced Technology, Chinese Academy of Sciences, Shenzhen 518055, People’sRepublic of China; bUniversity of Chinese Academy of Sciences, Beijing 100049, People’s Republic of China; cSchool of Engineering and Applied Sciences,Harvard University, Cambridge, MA 02138; dDepartment of Materials Science and Engineering, Southern University of Science and Technology, Shenzhen518055, People’s Republic of China; eInstitute of Biomedicine and Biotechnology, Shenzhen Institutes of Advanced Technology, Chinese Academy ofSciences, Shenzhen 518055, People’s Republic of China; and fDepartment of Molecular and Cellular Biology, Harvard University, Cambridge, MA 02138
Edited by Kiyoshi Mizuuchi, National Institutes of Health, Bethesda, MD, and approved November 14, 2016 (received for review September 30, 2016)
Bacteria tightly regulate and coordinate the various events intheir cell cycles to duplicate themselves accurately and to controltheir cell sizes. Growth of Escherichia coli, in particular, follows arelation known as Schaechter’s growth law. This law says that theaverage cell volume scales exponentially with growth rate, witha scaling exponent equal to the time from initiation of a roundof DNA replication to the cell division at which the correspondingsister chromosomes segregate. Here, we sought to test the robust-ness of the growth law to systematic perturbations in cell dimen-sions achieved by varying the expression levels of mreB and ftsZ.We found that decreasing the mreB level resulted in increasedcell width, with little change in cell length, whereas decreasingthe ftsZ level resulted in increased cell length. Furthermore, thetime from replication termination to cell division increased withthe perturbed dimension in both cases. Moreover, the growth lawremained valid over a range of growth conditions and dimensionperturbations. The growth law can be quantitatively interpretedas a consequence of a tight coupling of cell division to replicationinitiation. Thus, its robustness to perturbations in cell dimensionsstrongly supports models in which the timing of replication initia-tion governs that of cell division, and cell volume is the key phe-nomenological variable governing the timing of replication initia-tion. These conclusions are discussed in the context of our recentlyproposed “adder-per-origin” model, in which cells add a constantvolume per origin between initiations and divide a constant timeafter initiation.
cell cycle | cell growth | E. coli | DNA replication | cell dimension
Bacteria can regulate tightly and coordinate the various eventsin their cell cycles to accurately duplicate their genomes and
to homeostatically regulate their cell sizes. This is a particularchallenge under fast growth conditions where cells are under-going multiple concurrent rounds of DNA replication. Despitemuch progress, we still have an incomplete understanding ofthe processes that coordinate DNA replication, cell growth,and cell division. This lack of understanding is manifested, forinstance, in discrepancies among various recent studies that pro-pose different models for control of cell division in the bacteriumEscherichia coli.
One class of models suggests that cell division is triggered bythe accumulation of a constant size (e.g., volume, length, or sur-face area) between birth and division (1–3). Such models are sup-ported by experiments measuring correlations between cell sizeat birth and cell size at division, which showed that, when aver-aged over all cells of a given birth size vB , cell size at division vDapproximately follows
vD = vB + v0, [1]
where the constant v0 sets the average cell size at birth. This isknown as the “incremental” or “adder” model, and cells follow-ing this behavior are said to exhibit “adder correlations” (1–7).Importantly, these models postulate that cell division is governed
by a phenomenological size variable, with no explicit reference toDNA replication.
A second class of models for control of cell division postulatesthat cell division is governed by the process of DNA replica-tion, which can be described as follows. The time from a repli-cation initiation event to the cell division that segregates thecorresponding sister chromosomes can be split into the C period,from initiation to termination of replication, and the D period,from termination of replication to cell division (8, 9). Both the Cand D periods remain constant at ∼40 min and 20 min, respec-tively, for cells grown in various growth media supporting a rangeof doubling times between 20 min and 60 min (10, 11). Werefer to growth rates within this range as fast. All experimentsdescribed here are carried out under such fast growth conditions.Note that C +D is ∼60 min and larger than the time betweendivisions at fast growth. This situation is achieved by the occur-rence of multiple ongoing rounds of replication. That is, underthese conditions, a cell initiates a round of replication simulta-neously at multiple origins that ultimately give rise to the chro-mosomes of their granddaughters or even great-granddaughters(12). Extending the basic definition of the C and D periods,Cooper and Helmstetter specifically proposed that an initiationevent triggers a division after a time C +D , thereby ensuringthat cells divide only after the completion of a round of DNAreplication (8, 10). This Cooper–Helmstetter (CH) formulation,hereafter the CH model, belongs to the second class of modelsfor control of cell division.
Significance
How bacteria regulate cell division to achieve cell size home-ostasis, with concomitant coordination of DNA replication, is afundamental question. Currently, there exist several compet-ing models for cell cycle regulation in Escherichia coli. We per-formed experiments where we systematically perturbed celldimensions and found that average cell volume scales expo-nentially with the product of the growth rate and the timefrom initiation of DNA replication to the corresponding celldivision. Our data support a model in which cells initiate repli-cation on average at a constant volume per origin and dividea constant time thereafter.
Author contributions: C.L. designed research; H.Z., P.H., M.J., B.T., W.L., D.L., X.Y., N.E.K.,A.A., and C.L. performed research; P.H., N.E.K., A.A., and C.L. analyzed data; and P.H.,N.E.K., A.A., and C.L. wrote the paper.
The authors declare no conflict of interest.
This article is a PNAS Direct Submission.
Freely available online through the PNAS open access option.1To whom correspondence may be addressed. Email: [email protected] or [email protected].
This article contains supporting information online at www.pnas.org/lookup/suppl/doi:10.1073/pnas.1617932114/-/DCSupplemental.
www.pnas.org/cgi/doi/10.1073/pnas.1617932114 PNAS Early Edition | 1 of 6
The CH model is supported by the phenomenon of rate main-tenance (13): After a change from one growth medium to a richerone (a shift up), cells continue to divide at the rate associatedwith the poorer medium for a period of 60 min. According to theCH model, in which division is triggered by initiation, all cellsthat have already initiated replication before a shift up will havealso already committed to their ensuing divisions, and thus therate of division will remain unchanged for a time C +D follow-ing a shift up.
The same value of 60 min also emerged in a seeminglydifferent context a decade earlier, in the seminal study ofSchaechter et al. (14). In their work, cell volumes, averaged overan exponentially growing population, were measured for culturegrowing under dozens of different growth media supporting fastgrowth. It was found that average cell volume was well describedby an exponential relation with growth rate V = ∆eλT , where Vis the average cell volume, ∆ is a constant with dimensions ofvolume, λ is the growth rate, τ = log(2)/λ is the doubling time,and T ≈ 60 min.
Donachie (15) showed that this exponential scaling of averagecell volume with growth rate can also be explained by the CHmodel if it is further assumed that cells initiate replication onaverage at a constant volume ∆I per origin of replication at ini-tiation. Because cells grow exponentially at the single-cell level(16), cells will then divide on average at a volume ∆I per origintimes a scaling factor S = 2(C+D)/τ . The average cell volumethen follows
V = ∆2(C+D)/τ = S∆, [2]
with ∆ = log(2)∆I , because the cell volume averaged over anexponentially growing population is the average cell volume atbirth times 2 log(2) (17). In Schaechter’s experiments, the Cand D periods were approximately constant, giving rise to theexponential scaling observed. However, the derivation for Eq. 2holds regardless of the values of the C and D periods, andin cases where they are not constant, average cell volume isnot expected to scale exponentially with growth rate. Eq. 2 isknown as Schaechter’s growth law, but is referred to simply asthe growth law for the rest of this paper.
Recent single-cell analyses found that cells indeed initiatereplication on average at a constant volume per origin or persome locus close to the origin (11). Although further experimentsare required, the fact that introduction of an origin onto a plas-mid does not affect cell cycle timings or cell size suggests thatthe latter possibility is correct (11, 18, 19) (SI Text, Average CellVolume at Initiation Is Constant per Some Locus Close to the Ori-gin). Below, for simplicity, we use the phrase “per origin,” whilekeeping this complexity in mind.
Clearly, the two classes of models for control of cell divisiondiffer fundamentally. In the first class, division depends only onthe accumulation of size from birth, and DNA replication playsno explicit role. In the second class, division is downstream ofthe preceding initiation of DNA replication. Importantly, also,the experiments leading to the first class of models defined cellsize differences by measuring cell length. Because for a constantgrowth environment the widths of bacterial cells are very nar-rowly distributed with a coefficient of variation (CV) less than0.05 (2), these analyses cannot distinguish whether cell size in agiven environment is set by a constant volume, surface area, orlength. This ambiguity raises the question of what is the key phe-nomenological variable governing cell cycle progression.
Here, we sought to test these models by perturbing cell dimen-sions in E. coli and assaying the effects of those perturbations onboth replication events and cell division. In our study, shape per-turbations were achieved by systematically varying expression lev-els of the protein MreB, an actin homologue involved in cell wallsynthesis, and the protein FtsZ, a tubulin homologue involved in
A
B
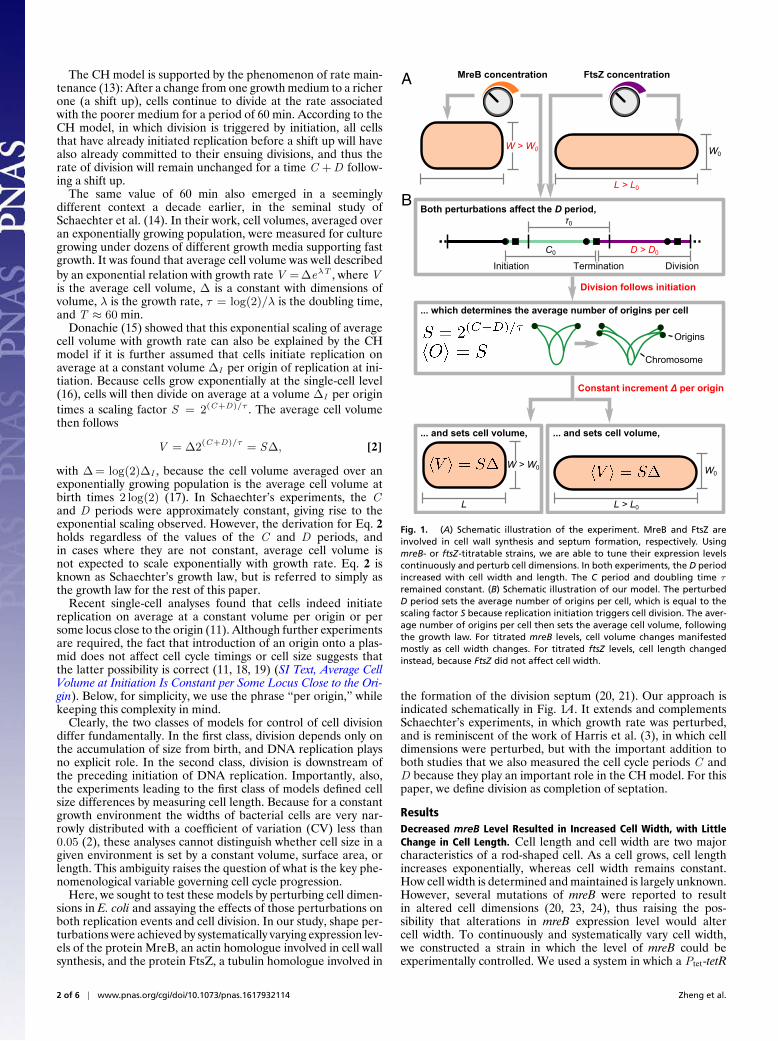
Fig. 1. (A) Schematic illustration of the experiment. MreB and FtsZ areinvolved in cell wall synthesis and septum formation, respectively. UsingmreB- or ftsZ-titratable strains, we are able to tune their expression levelscontinuously and perturb cell dimensions. In both experiments, the D periodincreased with cell width and length. The C period and doubling time τremained constant. (B) Schematic illustration of our model. The perturbedD period sets the average number of origins per cell, which is equal to thescaling factor S because replication initiation triggers cell division. The aver-age number of origins per cell then sets the average cell volume, followingthe growth law. For titrated mreB levels, cell volume changes manifestedmostly as cell width changes. For titrated ftsZ levels, cell length changedinstead, because FtsZ did not affect cell width.
the formation of the division septum (20, 21). Our approach isindicated schematically in Fig. 1A. It extends and complementsSchaechter’s experiments, in which growth rate was perturbed,and is reminiscent of the work of Harris et al. (3), in which celldimensions were perturbed, but with the important addition toboth studies that we also measured the cell cycle periods C andD because they play an important role in the CH model. For thispaper, we define division as completion of septation.
ResultsDecreased mreB Level Resulted in Increased Cell Width, with LittleChange in Cell Length. Cell length and cell width are two majorcharacteristics of a rod-shaped cell. As a cell grows, cell lengthincreases exponentially, whereas cell width remains constant.How cell width is determined and maintained is largely unknown.However, several mutations of mreB were reported to resultin altered cell dimensions (20, 23, 24), thus raising the pos-sibility that alterations in mreB expression level would altercell width. To continuously and systematically vary cell width,we constructed a strain in which the level of mreB could beexperimentally controlled. We used a system in which a Ptet-tetR
2 of 6 | www.pnas.org/cgi/doi/10.1073/pnas.1617932114 Zheng et al.
BIO
CHEM
ISTR
Y
A B
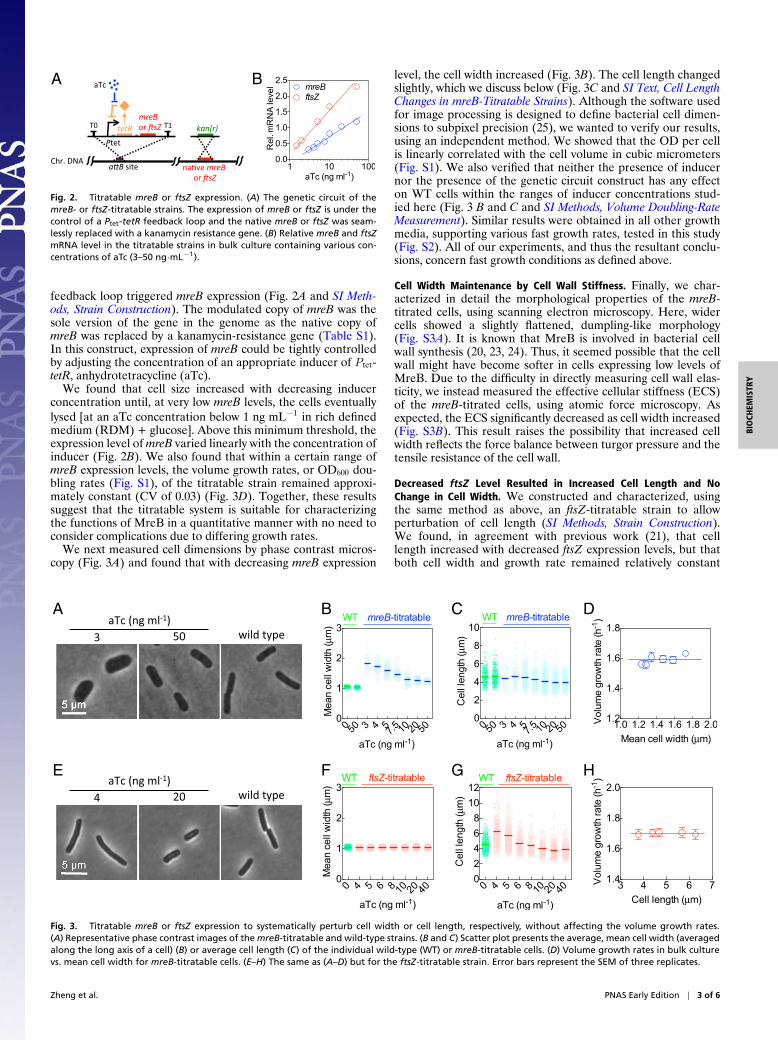
Fig. 2. Titratable mreB or ftsZ expression. (A) The genetic circuit of themreB- or ftsZ-titratable strains. The expression of mreB or ftsZ is under thecontrol of a Ptet-tetR feedback loop and the native mreB or ftsZ was seam-lessly replaced with a kanamycin resistance gene. (B) Relative mreB and ftsZmRNA level in the titratable strains in bulk culture containing various con-centrations of aTc (3–50 ng·mL−1).
feedback loop triggered mreB expression (Fig. 2A and SI Meth-ods, Strain Construction). The modulated copy of mreB was thesole version of the gene in the genome as the native copy ofmreB was replaced by a kanamycin-resistance gene (Table S1).In this construct, expression of mreB could be tightly controlledby adjusting the concentration of an appropriate inducer of Ptet-tetR, anhydrotetracycline (aTc).
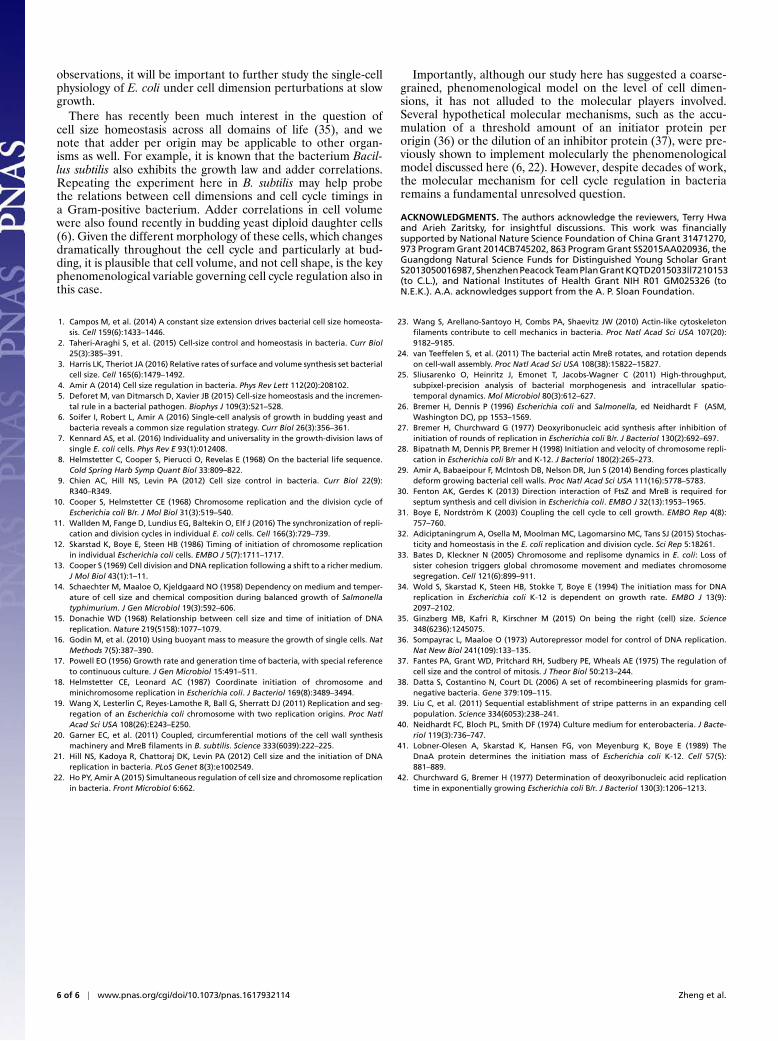
We found that cell size increased with decreasing inducerconcentration until, at very low mreB levels, the cells eventuallylysed [at an aTc concentration below 1 ng mL−1 in rich definedmedium (RDM) + glucose]. Above this minimum threshold, theexpression level of mreB varied linearly with the concentration ofinducer (Fig. 2B). We also found that within a certain range ofmreB expression levels, the volume growth rates, or OD600 dou-bling rates (Fig. S1), of the titratable strain remained approxi-mately constant (CV of 0.03) (Fig. 3D). Together, these resultssuggest that the titratable system is suitable for characterizingthe functions of MreB in a quantitative manner with no need toconsider complications due to differing growth rates.
We next measured cell dimensions by phase contrast micros-copy (Fig. 3A) and found that with decreasing mreB expression
A
E F G H
DCB
Fig. 3. Titratable mreB or ftsZ expression to systematically perturb cell width or cell length, respectively, without affecting the volume growth rates.(A) Representative phase contrast images of the mreB-titratable and wild-type strains. (B and C) Scatter plot presents the average, mean cell width (averagedalong the long axis of a cell) (B) or average cell length (C) of the individual wild-type (WT) or mreB-titratable cells. (D) Volume growth rates in bulk culturevs. mean cell width for mreB-titratable cells. (E–H) The same as (A–D) but for the ftsZ-titratable strain. Error bars represent the SEM of three replicates.
level, the cell width increased (Fig. 3B). The cell length changedslightly, which we discuss below (Fig. 3C and SI Text, Cell LengthChanges in mreB-Titratable Strains). Although the software usedfor image processing is designed to define bacterial cell dimen-sions to subpixel precision (25), we wanted to verify our results,using an independent method. We showed that the OD per cellis linearly correlated with the cell volume in cubic micrometers(Fig. S1). We also verified that neither the presence of inducernor the presence of the genetic circuit construct has any effecton WT cells within the ranges of inducer concentrations stud-ied here (Fig. 3 B and C and SI Methods, Volume Doubling-RateMeasurement). Similar results were obtained in all other growthmedia, supporting various fast growth rates, tested in this study(Fig. S2). All of our experiments, and thus the resultant conclu-sions, concern fast growth conditions as defined above.
Cell Width Maintenance by Cell Wall Stiffness. Finally, we char-acterized in detail the morphological properties of the mreB-titrated cells, using scanning electron microscopy. Here, widercells showed a slightly flattened, dumpling-like morphology(Fig. S3A). It is known that MreB is involved in bacterial cellwall synthesis (20, 23, 24). Thus, it seemed possible that the cellwall might have become softer in cells expressing low levels ofMreB. Due to the difficulty in directly measuring cell wall elas-ticity, we instead measured the effective cellular stiffness (ECS)of the mreB-titrated cells, using atomic force microscopy. Asexpected, the ECS significantly decreased as cell width increased(Fig. S3B). This result raises the possibility that increased cellwidth reflects the force balance between turgor pressure and thetensile resistance of the cell wall.
Decreased ftsZ Level Resulted in Increased Cell Length and NoChange in Cell Width. We constructed and characterized, usingthe same method as above, an ftsZ-titratable strain to allowperturbation of cell length (SI Methods, Strain Construction).We found, in agreement with previous work (21), that celllength increased with decreased ftsZ expression levels, but thatboth cell width and growth rate remained relatively constant
Zheng et al. PNAS Early Edition | 3 of 6

within the ranges of inducer concentration studied here (CVof 0.01 and 0.03, respectively, across different experiments,Fig. 3 E–H).
Correlations Between Perturbed Cell Dimensions and Cell CycleTimings. We next investigated how the mreB and ftsZ expressionlevels affect the C and D periods. For a bulk culture in steady-state exponential growth, the CH model predicts that the averagenumber of origins per cell, 〈O〉, scales exponentially with growthrate (22, 26). This is because in steady-state exponential growth,the number of cells and the total number of origins in the popu-lation must both grow exponentially at the same rate. However,because the CH model postulates that division occurs only aftera time C +D following the corresponding initiation, the totalnumber of origins will be larger than the number of cells by thescaling factor S , defined above. Therefore, 〈O〉=S . This rela-tion holds regardless of the value of C +D .
An expression for the average number of copies X of a geneper cell as a function of the location m of the gene along thechromosome (m = 0 for oriC and m = 1 for terC) can bederived similarly. Under the assumption that replication forkstravel at a constant speed, the expression is X = 2(C(1−m)+D)/τ
(26). We used this relation to extract the lengths of the C andD periods from quantitative PCR (qPCR) data of the copynumbers of different chromosome loci (including oriC, terC,and a series of different loci between them; SI Methods, Char-acterization of the C and D Periods by qPCR and Table S2).The C period was also measured independently by the meth-ods in refs. 27 and 28, which gave values consistent with thoseobtained by the qPCR method (SI Methods, Characterizationof the C and D Periods by qPCR). We also measured 〈O〉,
A B
DC
Fig. 4. Changes in the cell cycle parameters as cell dimensions are per-turbed. (A) The D period increased monotonically with cell width in mreB-titratable strains. The line is the best linear fit. (B) The C period remainedapproximately constant as cell width changed in response to titrated mreBexpression levels. The line is the mean value of C averaged over mreB expres-sion levels. (C) The D period increased monotonically with cell length in ftsZ-titratable strains. (D) The C period remained approximately constant as celllength changed in response to titrated ftsZ expression levels. The circle, tri-angle, and square indicate mreB-titratable, ftsZ-titratable, and WT strains,respectively. Different colors denote growth media: Red is RDM + glucose,and blue is RDM + glycerol. The SEMs of three replicates were smaller thanthe size of the symbols.
A B
Fig. 5. The growth law holds in the face of perturbation to cell dimen-sions. (A) The average cell volume is proportional to the scaling factorS = 2(C+D)/τ . The black line shows the growth law V = S∆ for the best-fitproportionality constant ∆ = 0.55 ± 0.04 µm3. The plus-or-minus symbolindicates the 95% confidence interval of the fit. The coefficient of deter-mination R2 of the fit is 0.81. (B) The average cell area is not proportionalto the scaling factor. The black line shows the best fit with intercept forcedto zero. The R2 of the fit is 0.40. The circle, triangle, and square indicatemreB-titratable, ftsZ-titratable, and WT strains, respectively. Different col-ors denote growth media: Red is RDM + glucose, and blue is RDM + glycerol.The SEMs of three replicates were smaller than the size of the symbols.
using replication run-out experiments (SI Methods, Cellular oriCCharacterization).
These analyses revealed that, over the analyzed ranges in thelevels of both mreB and ftsZ expression, the C period remainedunchanged (CV of 0.09 and 0.05 for mreB- and ftsZ-titratablestrains, respectively), whereas the D period increased withincreasing cell width or length, respectively (Fig. 4). Note thatthe relation between the D period and cell length predicted byour model below is not linear, but appears approximately lineargiven the particular values of the relevant parameters under theconditions of these experiments.
The Growth Law Holds in the Face of Perturbations to Cell Dimensions.We find that the growth law, Eq. 2, holds in our experiments,both across a range of growth media (Fig. 4) and across the twotitratable perturbations that drastically affected cell width andcell length (Fig. 5A). The best-fit proportionality constant is ∆ =0.55± 0.04 µm3. The plus-or-minus symbol indicates the 95%confidence interval of the fit. From the derivation of the growthlaw in the Introduction, we find the average cell size per origin atinitiation to be ∆I = 0.79 ± 0.06 µm3. In contrast, the averagecell area, cell length, and cell width are not proportional to thescaling factor S (Fig. 5B and Fig. S4).
We further tested the validity of a constant ∆ by fixing ∆ to0.55 µm3 and calculating the ratio of log2(V /∆) and τ−1, whichis equal to C +D according to Eq. 2 (Fig. 6A). We found that thevalues of C +D obtained in this way agree well with independentmeasurements in both the titratable and the WT strains (Fig. 6B).
DiscussionHere, we perturbed cell dimensions and then observed the ef-fects of these perturbations on the cell cycle to interrogate themechanism of cell cycle regulation in E. coli. The most importantfinding of this work is that the growth law, that average cell vol-ume is proportional to the scaling factor S = 2(C+D)/τ , remainedvalid across large perturbations in cell dimensions. As discussedin the Introduction, the growth law can be quantitatively derivedunder two assumptions: (i) the CH model, that replication ini-tiation triggers cell division after a constant time C +D , and(ii) that the average cell volume at initiation of DNA replica-tion is proportional to the number of origins at initiation. Therobustness of the growth law documented above suggests thatboth assumptions hold in face of the perturbations studied here.
4 of 6 | www.pnas.org/cgi/doi/10.1073/pnas.1617932114 Zheng et al.

BIO
CHEM
ISTR
Y
A B
Fig. 6. The average cell volume per origin at initiation is constant in theface of perturbations in cell dimensions. (A) Colored lines connect log2(∆)to symbols in boldface type as examples. The respective slopes of the linesare computed as the ratio of log2(V/∆) over 1/τ and shown as numbers(minutes). (B) Measured C+D values are plotted against the ratios calculatedin A. The circle, triangle, and square indicate mreB-titratable, ftsZ-titratable,and WT strains, respectively. Different colors denote growth media: Red isRDM + glucose, and blue is RDM + glycerol. The SEMs of three replicateswere smaller than the size of the symbols.
Correspondingly, given the first assumption, the presentedresults support the second class of models for control of celldivision (Introduction), in which the timing of initiation governsthat of division, and oppose the first class of models in which thetiming of division is governed by the accumulation of cell size withno explicit reference to DNA replication. The presented findingsdo not rule out models in which, opposite to the CH model, divi-sion triggers initiation. However, these models are heavily chal-lenged by the finding that C +D is essentially constant (CV of∼0.1) on the single-cell level at fast growth (11). To be consistentwith this finding, these models must somehow coordinate the trig-gered initiation event with the division event in the next genera-tion. Further studies will be required to investigate this possibility.
Our findings also provide information about the questionof what key phenomenological variable governs cell cycle pro-gression. We find that only cell volume, and not surface area,length, or width, is proportional to the scaling factor S (Fig. 5and Fig. S4). Together with the second assumption (above),the robustness of the growth law then supports the hypothesisthat volume per origin, rather than other geometric features, isthe key phenomenological variable that is invariant at initiation.Hence, cell volume governs the timing of initiation and, by theCH model, the timing of division.
Figs. 5 and 6 also show that the proportionality constant ∆,which links average cell volume to the scaling factor S in thegrowth law (Eq. 2), remained constant across the perturbationsstudied here. In the derivation of the growth law, ∆ is propor-tional to ∆I or the average volume per origin required for ini-tiation. The constancy of ∆ therefore suggests that none of theperturbations studied (MreB, FtsZ, and various growth media)affected the molecular mechanism underlying the regulationof initiation. Despite drastic changes in cell shape, the titrat-able strains still initiated replication on average at a constant0.79±0.06 µm3 per origin just as in WT. This value for the aver-age cell volume per origin at initiation is similar to the recentlyreported value of 0.9−1.0 µm3 (11).
Although the present study examined altered genetic condi-tions that result in altered cell length and cell width, our analysisimplies that these changes in cell length and cell width did notaffect cell volume directly. Rather—because neither genetic per-turbation affected growth rate, the C period, or ∆—changes inthe D period alone were responsible for the observed changesin cell volume, which in turn are manifested as changes in celllength and cell width.
Fig. 1B illustrates schematically how the two genetic per-turbations might exert their effects. In one case, reduced ftsZ
expression increases the D period. Because FtsZ is a direct medi-ator of septum formation, this effect could result directly from aprolongation of the septation process. The increased D perioddictates an increased average cell volume, which, in this situa-tion, happens to manifest as an increase in length alone, withno change in width. This asymmetric change in length, vs. width,matches the fact that cell width is maintained normally evenin filamentous cells where septation is completely eliminated(21, 29).
Reduced mreB expression also increases the D period. In onepossibility, MreB would have two direct roles: both in septationvia local effects at the division site (30) and in determining cellwidth. Here, at reduced MreB levels, delayed septation wouldincrease the D period. Due to the second role of MreB, the cor-responding increase in cell volume in this case is implementedmostly by the increase in cell width. Alternatively, MreB mightplay only the role of determining cell width. In this scenario, theincreased cell width then results in a prolonged septation pro-cess and thus a longer D period. In both scenarios, however,given experimentally determined values for the D period and cellwidth, the cell volume predicted by the growth law also dictatessmall changes in cell length. The magnitudes of these predictedchanges are just at the level of detection of the current study butare consistent with observed values (Fig. S5).
In general, the growth law specifies cell volume without refer-ence to the aspect ratio of the rod-shape morphology. As a result,a given change in cell volume due to a change in the parametersof the growth law can be manifested as diverse combinations ofchanges in cell length and cell width.
Our analysis has shown that, in analyzing size-related measure-ments, the growth law and its underlying tenets imply that anyperturbations to the C or D periods or growth rate will affectcell volume—even if the perturbations are not affecting the coremechanism of size regulation that determines the value of theinvariant average cell volume per origin at initiation. Thus, withrespect to determining cell size, an important distinction can bemade between “primary” and “secondary” regulators, as high-lighted in ref. 31. In the context of the above analysis, MreBand FtsZ appear to be secondary regulators in E. coli because∆ remained constant across titrated mreB and ftsZ levels.
All of the considerations above build on the classical worksof Schaechter et al. (14), Cooper–Helmstetter (8, 10), andDonachie (15), which consider population average behaviors.Donachie further proposed a single-cell interpretation of hisidea in which initiation occurs in a cell when the cell reaches aconstant volume per origin (15). However, the proposal is notcompatible with experimental single-cell measurements showingadder correlations between cell sizes at births and at divisions(Introduction) because it predicts no such correlations underconditions where growth rate is essentially constant (2, 16, 22).
As a resolution to this conflict, some of us have recently pro-posed a phenomenological adder-per-origin model in which aconstant volume is added between two rounds of initiations,rather than between two rounds of divisions (4, 22). We haveshown that this adder-per-origin model leads both to adder cor-relations and to a constant average cell volume per origin at initi-ation. Furthermore, adder per origin can also explain rate main-tenance and the growth law.
We conclude by discussing several unsolved questions. First,we have ignored single-cell fluctuations in the C and D periodsin our discussion, but recent works show that they are importantto understanding single-cell correlations (22, 32). We have alsonot discussed E. coli in slow growth conditions, but several worksraise the possibility that E. coli might behave qualitatively differ-ently there. For instance, previous works suggested that averagecell volume per origin at initiation is not constant in such condi-tions (33, 34). Recent works also suggested that at slow growth,E. coli does not show adder correlations (11). In light of these
Zheng et al. PNAS Early Edition | 5 of 6
observations, it will be important to further study the single-cellphysiology of E. coli under cell dimension perturbations at slowgrowth.
There has recently been much interest in the question ofcell size homeostasis across all domains of life (35), and wenote that adder per origin may be applicable to other organ-isms as well. For example, it is known that the bacterium Bacil-lus subtilis also exhibits the growth law and adder correlations.Repeating the experiment here in B. subtilis may help probethe relations between cell dimensions and cell cycle timings ina Gram-positive bacterium. Adder correlations in cell volumewere also found recently in budding yeast diploid daughter cells(6). Given the different morphology of these cells, which changesdramatically throughout the cell cycle and particularly at bud-ding, it is plausible that cell volume, and not cell shape, is the keyphenomenological variable governing cell cycle regulation also inthis case.
Importantly, although our study here has suggested a coarse-grained, phenomenological model on the level of cell dimen-sions, it has not alluded to the molecular players involved.Several hypothetical molecular mechanisms, such as the accu-mulation of a threshold amount of an initiator protein perorigin (36) or the dilution of an inhibitor protein (37), were pre-viously shown to implement molecularly the phenomenologicalmodel discussed here (6, 22). However, despite decades of work,the molecular mechanism for cell cycle regulation in bacteriaremains a fundamental unresolved question.
ACKNOWLEDGMENTS. The authors acknowledge the reviewers, Terry Hwaand Arieh Zaritsky, for insightful discussions. This work was financiallysupported by National Nature Science Foundation of China Grant 31471270,973 Program Grant 2014CB745202, 863 Program Grant SS2015AA020936, theGuangdong Natural Science Funds for Distinguished Young Scholar GrantS2013050016987,ShenzhenPeacockTeamPlanGrantKQTD2015033ll7210153(to C.L.), and National Institutes of Health Grant NIH R01 GM025326 (toN.E.K.). A.A. acknowledges support from the A. P. Sloan Foundation.
1. Campos M, et al. (2014) A constant size extension drives bacterial cell size homeosta-sis. Cell 159(6):1433–1446.
2. Taheri-Araghi S, et al. (2015) Cell-size control and homeostasis in bacteria. Curr Biol25(3):385–391.
3. Harris LK, Theriot JA (2016) Relative rates of surface and volume synthesis set bacterialcell size. Cell 165(6):1479–1492.
4. Amir A (2014) Cell size regulation in bacteria. Phys Rev Lett 112(20):208102.5. Deforet M, van Ditmarsch D, Xavier JB (2015) Cell-size homeostasis and the incremen-
tal rule in a bacterial pathogen. Biophys J 109(3):521–528.6. Soifer I, Robert L, Amir A (2016) Single-cell analysis of growth in budding yeast and
bacteria reveals a common size regulation strategy. Curr Biol 26(3):356–361.7. Kennard AS, et al. (2016) Individuality and universality in the growth-division laws of
single E. coli cells. Phys Rev E 93(1):012408.8. Helmstetter C, Cooper S, Pierucci O, Revelas E (1968) On the bacterial life sequence.
Cold Spring Harb Symp Quant Biol 33:809–822.9. Chien AC, Hill NS, Levin PA (2012) Cell size control in bacteria. Curr Biol 22(9):
R340–R349.10. Cooper S, Helmstetter CE (1968) Chromosome replication and the division cycle of
Escherichia coli B/r. J Mol Biol 31(3):519–540.11. Wallden M, Fange D, Lundius EG, Baltekin O, Elf J (2016) The synchronization of repli-
cation and division cycles in individual E. coli cells. Cell 166(3):729–739.12. Skarstad K, Boye E, Steen HB (1986) Timing of initiation of chromosome replication
in individual Escherichia coli cells. EMBO J 5(7):1711–1717.13. Cooper S (1969) Cell division and DNA replication following a shift to a richer medium.
J Mol Biol 43(1):1–11.14. Schaechter M, Maaloe O, Kjeldgaard NO (1958) Dependency on medium and temper-
ature of cell size and chemical composition during balanced growth of Salmonellatyphimurium. J Gen Microbiol 19(3):592–606.
15. Donachie WD (1968) Relationship between cell size and time of initiation of DNAreplication. Nature 219(5158):1077–1079.
16. Godin M, et al. (2010) Using buoyant mass to measure the growth of single cells. NatMethods 7(5):387–390.
17. Powell EO (1956) Growth rate and generation time of bacteria, with special referenceto continuous culture. J Gen Microbiol 15:491–511.
18. Helmstetter CE, Leonard AC (1987) Coordinate initiation of chromosome andminichromosome replication in Escherichia coli. J Bacteriol 169(8):3489–3494.
19. Wang X, Lesterlin C, Reyes-Lamothe R, Ball G, Sherratt DJ (2011) Replication and seg-regation of an Escherichia coli chromosome with two replication origins. Proc NatlAcad Sci USA 108(26):E243–E250.
20. Garner EC, et al. (2011) Coupled, circumferential motions of the cell wall synthesismachinery and MreB filaments in B. subtilis. Science 333(6039):222–225.
21. Hill NS, Kadoya R, Chattoraj DK, Levin PA (2012) Cell size and the initiation of DNAreplication in bacteria. PLoS Genet 8(3):e1002549.
22. Ho PY, Amir A (2015) Simultaneous regulation of cell size and chromosome replicationin bacteria. Front Microbiol 6:662.
23. Wang S, Arellano-Santoyo H, Combs PA, Shaevitz JW (2010) Actin-like cytoskeletonfilaments contribute to cell mechanics in bacteria. Proc Natl Acad Sci USA 107(20):9182–9185.
24. van Teeffelen S, et al. (2011) The bacterial actin MreB rotates, and rotation dependson cell-wall assembly. Proc Natl Acad Sci USA 108(38):15822–15827.
25. Sliusarenko O, Heinritz J, Emonet T, Jacobs-Wagner C (2011) High-throughput,subpixel-precision analysis of bacterial morphogenesis and intracellular spatio-temporal dynamics. Mol Microbiol 80(3):612–627.
26. Bremer H, Dennis P (1996) Escherichia coli and Salmonella, ed Neidhardt F (ASM,Washington DC), pp 1553–1569.
27. Bremer H, Churchward G (1977) Deoxyribonucleic acid synthesis after inhibition ofinitiation of rounds of replication in Escherichia coli B/r. J Bacteriol 130(2):692–697.
28. Bipatnath M, Dennis PP, Bremer H (1998) Initiation and velocity of chromosome repli-cation in Escherichia coli B/r and K-12. J Bacteriol 180(2):265–273.
29. Amir A, Babaeipour F, McIntosh DB, Nelson DR, Jun S (2014) Bending forces plasticallydeform growing bacterial cell walls. Proc Natl Acad Sci USA 111(16):5778–5783.
30. Fenton AK, Gerdes K (2013) Direction interaction of FtsZ and MreB is required forseptum synthesis and cell division in Escherichia coli. EMBO J 32(13):1953–1965.
31. Boye E, Nordstrom K (2003) Coupling the cell cycle to cell growth. EMBO Rep 4(8):757–760.
32. Adiciptaningrum A, Osella M, Moolman MC, Lagomarsino MC, Tans SJ (2015) Stochas-ticity and homeostasis in the E. coli replication and division cycle. Sci Rep 5:18261.
33. Bates D, Kleckner N (2005) Chromosome and replisome dynamics in E. coli: Loss ofsister cohesion triggers global chromosome movement and mediates chromosomesegregation. Cell 121(6):899–911.
34. Wold S, Skarstad K, Steen HB, Stokke T, Boye E (1994) The initiation mass for DNAreplication in Escherichia coli K-12 is dependent on growth rate. EMBO J 13(9):2097–2102.
35. Ginzberg MB, Kafri R, Kirschner M (2015) On being the right (cell) size. Science348(6236):1245075.
36. Sompayrac L, Maaloe O (1973) Autorepressor model for control of DNA replication.Nat New Biol 241(109):133–135.
37. Fantes PA, Grant WD, Pritchard RH, Sudbery PE, Wheals AE (1975) The regulation ofcell size and the control of mitosis. J Theor Biol 50:213–244.
38. Datta S, Costantino N, Court DL (2006) A set of recombineering plasmids for gram-negative bacteria. Gene 379:109–115.
39. Liu C, et al. (2011) Sequential establishment of stripe patterns in an expanding cellpopulation. Science 334(6053):238–241.
40. Neidhardt FC, Bloch PL, Smith DF (1974) Culture medium for enterobacteria. J Bacte-riol 119(3):736–747.
41. Lobner-Olesen A, Skarstad K, Hansen FG, von Meyenburg K, Boye E (1989) TheDnaA protein determines the initiation mass of Escherichia coli K-12. Cell 57(5):881–889.
42. Churchward G, Bremer H (1977) Determination of deoxyribonucleic acid replicationtime in exponentially growing Escherichia coli B/r. J Bacteriol 130(3):1206–1213.
6 of 6 | www.pnas.org/cgi/doi/10.1073/pnas.1617932114 Zheng et al.

Supporting InformationZheng et al. 10.1073/pnas.1617932114SI TextAverage Cell Volume at Initiation Is Constant per Some Locus Closeto the Origin. As discussed in the Introduction, the growth lawfollows from (i) the CH model and (ii) the constancy of averagecell volume ∆I per origin at initiation. The second assumptionsays that the average volume at initiation is VI = O∆I , whereO = 2b
C+Dτc is the number of origins in a cell at the time of
initiation (e.g., 1 at slow growth and higher powers of 2 at fastgrowth) (26). The floor operator bxc finds the greatest integerless than or equal to x . The first assumption then specifies a divi-sion at total cell volume (summed over all offspring of the mothercell corresponding to this initiation) VD = VIS . Immediatelyafter the specified round of division, there will have been a totalof log2
(O)
+ 1 rounds of divisions since the original initiation.Hence, the average cell volume at birth is VB = ∆IS/2. Then interms of the cell volume averaged over an exponentially growingpopulation, V = log (2) ∆IS .
A similar reasoning follows if the second assumption is mod-ified from “per origin” to “per some locus” a distance m awayfrom the origin (m = 0 is the origin, and m = 1 is the terminus).In this case, the modified second assumption gives VI = X∆I ,
where X = 2bC(1−m)+D
τc is the number of the locus in a cell
immediately following initiation. Following the same reasoning,we find that the growth law becomes V = log (2) (X /O)∆IS .However, this expression cannot in general explain the constancyof ∆ across our experiments because the quantity X /O explicitlydepends on the growth rate. The supposed locus must thereforebe close enough to the origin such that X /O remains approxi-mately constant at fast growth.
Cell Length Changes in mreB-Titratable Strains. Under the assump-tion that mreB expression level specifies both cell width andthe D period, average cell volume is determined by the growthlaw, V = ∆S , with ∆, the C period, and τ all relatively con-stant across mreB expression levels. The cell volume of a rod-shaped bacterium can be approximated as the volume of a cylin-der with hemispherical caps, V ≈ π
4W 2 (L−W ) + 1
6πW 3. The
growth law therefore specifies cell length to be L ≈ 4π
(∆S +
πW 3/12)/W 2. The cell lengths calculated in this way com-pare favorably to those measured via phase contrast microscopy(Fig. S4). Importantly, although the variations in cell length aresmall, they are consistent with the predictions by the growth law.
SI MethodsStrain Construction. All strains used in this study are derived fromthe E. coli K12 AMB1655 strain, which was kindly provided byAntoine Danchin of AMAbiotics, Evry, France. Strains and plas-mids used in this study are listed in Table S1. Oligonucleotidesused are listed in Table S2.
To construct the mreB-titratable strain, the DNA cassette ofthe Ptet-tetR-mreB feedback loop was amplified and inserted intothe chromosomal attB site by recombineering with the aid ofpSIM5 (38). Subsequently, the coding sequence (CDS) of mreBat its native locus was replaced with a kanamycin-resistancegene (aph). Briefly, an ampicillin-resistant gene (bla) with a ter-minator at each end (T0-Amp-T1) was synthesized (BGI) andcloned into the linearized pMD19, obtaining plasmid pMD19-T0-Amp-T1. The Ptet-tetR feedback loop was amplified from CL2(39) by PCR and inserted into pMD19-T0-Amp-T1, which wasdigested with BamHI and XhoI, generating plasmid pMD19-T0-Amp-T1-Ptet-tetR. The mreB was amplified from the genomic
DNA of strain AMB1655 with primers P114 and P115. The frag-ment was inserted into pMD19-T0-Amp-T1-Ptet-tetR digestedwith SacI and BamHI, resulting in pMD19-T0-Amp-T1-Ptet-tetR-mreB, from which the T0-Amp-T1-Ptet-tetR-mreB cassette wasPCR amplified with primers PR29 and PR30 (Table S2), eachcomposed of a 50-bp sequence at the 5’ end homologous tothe attB locus region. The PCR products were treated withDpnI (NEB), gel purified using a QIAquick Gel Extraction Kit(Qiagen), and then electroporated into AMB1655 cells con-taining pSIM5 that encodes λRed proteins. Ampicillin-resistantcolonies were verified by using colony PCR with primers P85 andP145, followed by direct sequencing. After that, the CDS of thekanamycin resistance gene (aph) was amplified from plkml withprimers PR31 and PR32. The mreB gene at the native locus wasseamlessly replaced with the aph gene by using the same recom-bineering protocol. The final mutant was designated as ZH1.To prevent the cell lysis caused by the lack of the mreB expres-sion, 50 ng·mL−1 inducer aTc (Clontech) was applied throughoutthe recombineering experiment and the following cultures unlessotherwise stated.
The ftsZ-titratable strain was constructed by using the sameprotocol. Briefly, the coding sequence of ftsZ was amplified fromthe genomic DNA of strain AMB1655 and inserted into pMD19-T0-Amp-T1-Ptet-tetR to generate pMD19-T0-Amp-T1-Ptet-tetR-ftsZ. Then the T0-Amp-T1-Ptet-tetR-ftsZ cassette was PCR ampli-fied with primers PR29 and PR30 and inserted into the attB siteby recombineering. Subsequently, the ftsZ gene at its native sitewas replaced by aph gene. The final mutant was designated asZH16.
To construct a reference strain, the T0-Amp-T1-Ptet-tetR cassette was PCR amplified from pMD19-T0-Amp-T1-Ptet-tetR with primers PR29 and PR30; the cassettewas inserted into the chromosomal attB site using thesame recombineering protocol, resulting in strain ZH2.To construct an immobilized mreB-titratable strain for theatomic force microscope (AFM) characterization, the motAwas seamlessly removed from the chromosome of strainZH1, designated as ZH21. All mutants were confirmed bysequencing.
Culture Medium and Cell Growth. Unless otherwise stated, thecells were cultured in Luria–Bertani medium (LB). Plasmidswere maintained with 100 µg·mL−1 ampicillin, 25 µg·mL−1
kanamycin, or 25 µg·mL−1 chloramphenicol. For RDM (40), glu-cose or glycerol was added at 0.4% (wt/vol) as the carbon source.For M9 medium (openwetware.org), 0.4% (wt/vol) glucose orglycerol and 0.2% (wt/vol) casamino acid (CAA) were added.Unless otherwise stated, all other reagents were from Sigma.All experiments were carried out at 37 ◦C. Cells were grown asdescribed previously (39).
Volume Doubling-Rate Measurement. As shown in Fig. S1, theOD600 per cell is linearly correlated with the cell volume, so werefereed the OD600 doubling rate as the volume doubling rate.During the experimental culture, the OD600 of the culture wasmeasured every 10 min (20 min for M9-based media). The dou-bling time (τ, in minutes) was calculated by fitting the data to anexponential growth curve.
Cell Imaging and Cell Size Parameters Measurement. Cells wereimaged by using a Nikon Ti-E microscope equipped with a 100×phase-contrast objective (N.A. = 1.45) and an Andor Zyla 4.2s
Zheng et al. www.pnas.org/cgi/content/short/1617932114 1 of 6
CMOS camera. A 1% agarose pad with 0.9% NaCl was usedto immobilize the cells. After cell immobilization, images wereacquired within 5 min at room temperature (RT).
A customized MATLAB (MathWorks)-based image-processingpackage, MicrobeTracker (25), was used to contour the cells andcalculate the cell size parameters, including the mean cell width,maximal cell width, cell length, cell area, and cell volume accord-ing to the phase-contrast microscopic photographs. One pixel onthe picture equals 0.065 µm, which was validated by a graticule.
OD per Cell Measurement. To characterize the OD per cell,after the OD measurement, 200 µL of the cell suspension wasimmediately diluted 10 times with precooled cell count buffer(0.9% NaCl with 0.12% formaldehyde) and kept in an ice-waterbath until cell count.
Bacterial cell counting was performed with a flow cytome-ter (Beckman; Cyto-FLEX). Samples were diluted as necessarywith the straining buffer (cell count buffer supplemented with1 mg·mL−1 DAPI) before the flow cytometer analysis. The flowrate and running time were 60 µL·min−1 and 100 s, respectively.The DAPI-stained particles were deemed the bacterial cells. TheOD600 per cell was then calculated by dividing the value of OD600by the corresponding cell number.
Quantitative Real-Time RT-PCR. One milliliter of the experimentalculture (OD600 ∼ 0.3) was immediately mixed with RNA Bacte-ria Protect Reagent (Qiagen). Total bacterial RNA was extractedusing the RNeasy mini kit (Qiagen) according to the manufac-turer’s protocol. The RNA yield and purity were estimated usinga NanoDrop 2000c spectrophotometer (Thermo Scientific). Theabsence of the genomic DNA contamination was confirmed byPCR. About 600 ng RNA was reverse transcribed, using a Prime-Script RT reagent kit with gDNA Eraser (Takara) accordingto the manufacturer’s protocol. Reactions without reverse tran-scriptase were conducted as controls for the following qPCRreactions. The cDNA samples were further diluted 1:25 withPCR grade water and stored at −20 ◦C until use. SYBR Pre-mix Ex Taq (Tli RNaseH plus) (Takara) was used for qPCRamplification of the amplified cDNA. Each reaction consisted of5 µL diluted cDNA sample, 200 nM forward and reverse qPCRprimers, 10 µL SYBR Premix Ex Taq, and up to 20 µL withPCR grade water. Each reaction was performed in triplicate. TheqPCR reactions were performed using a LightCycler 480 System(Roche) with the following program: 30 s at 95 ◦C and 40 cyclesof denaturation (5 s at 95 ◦C), annealing, and elongation (30 sat 60 ◦C). Data were acquired at the end of the elongation step.A melting curve was run at the end of the 40 cycles to test forthe presence of a unique PCR. To calculate the PCR efficiency,standard curves were made for each gene of target by using seri-ally diluted cDNA samples as the templates. The 16S rRNA wasused as the reference gene to normalize the expression level.For each RNA preparation, at least three independent real-timePCR measurements were performed.
Effective Stiffness Measurement. The immobilized mreB-titratedcells were used for the effective stiffness measurement. Cellswere harvested at OD600 ∼ 0.3, centrifuged, and washed fortwice with PBS. To immobilize the cells for AFM measurement,the Petri dish was precoated with poly-L-lysine (PLL) (Sigma).The cell suspension was added into the precoated Petri dishand kept at RT for 30 min to immobilize the cells, and thenthe suspension was removed by careful pipetting. The Petri dishwas washed twice with PBS to remove the unbound cells. PBS
was then added into the Petri dish for AFM measurements inliquid. AFM measurements were conducted by using Nanowiz-ard II (JPK Instrument). The force–distance and force–timecurves were acquired by using a commercial AFM tip with aspring constant ∼0.03 N·m−1 (MLCT, Tip D; Bruker). Thespring constant of the specific tip was determined by thermonoisemethods. Three locations along the vertical axis of a single bac-terial cell were selected for data acquisition. The data wereprocessed on the manufacturer’s software; the data were usedto fit with the Hertz model to calculate the effective stiffness ofthe cells.
Scanning Electron Microscopy. Cells were collected by centrifuga-tion, washed three times with precooled PBS buffer, and thentreated with precooled 2% (wt/vol) glutaraldehyde and kept at4 ◦C for 2 h to fix the cells. Fixed cells were collected by centrifu-gation, washed three times with precooled PBS buffer, and thentreated with a gradient ethanol for dehydration. Dehydrated cellswere resuspended with tertiary butyl alcohol and kept at RT for30 min; this step was repeated two more times to allow fullyreplacing the ethanol. A drop of the cell suspension was spreadon foil paper and kept at RT to air dry. The samples were thenanalyzed on a Nova NanoSEM 450 at 5,000×magnification.
Cellular oriC Characterization. The cellular oriC number was char-acterized by run-out experiments (41). Briefly, exponentiallygrowing cells (OD600 ∼ 0.2) were treated with 300 µg·mL−1
rifampicin and 30 µg·mL−1 cephalexin for three to four gener-ations. The cells were harvested by centrifugation, washed twicewith TE buffer (20 mM Tris·HCl, PH 8.0, 130 mM NaCl, 1 mMEDTA), and fixed in 70% (vol/vol) ethanol at 4 ◦C overnight.Fixed cells were washed twice with Tris-buffered saline (TBS)(20 mM Tris·HCl, pH 8.0, 130 mM NaCl) and resuspendedand diluted as necessary with the staining buffer (TBS with 10ng·mL−1 DAPI).
Flow cytometry analysis was performed using a Cyto-FLEX(Beckman) equipped with a 405-nm laser, and the intensity ofDAPI signaling was gathered at FL-3 (PB450 channel). The aver-aged cellular oriC number was calculated based on the distribu-tion of the DAPI signaling of the run-out sample.
Characterization of the C and D Periods by qPCR. To characterizethe C and D periods with a higher accuracy, instead of charac-terizing the ratio of oriC/terC (21), we quantified the copy num-ber of the 16 different genetic loci (Nm) and fitted the logNm
2 ∗ τwith m’ (defined as the reference, e.g., the oriC locus equals 0and terC locus equals 1) as a straight line, with the slope of theline equaling C and the intercept of the y axis equaling C + D.Briefly, the cells were harvested at OD600 ∼ 0.2, and the cellularDNA was extracted by using the genomic DNA purification kit(Tiangen) according to the manufacturer’s protocol. The rela-tive abundances of different chromosome loci were quantified byqPCR, using hydrolysis probes methods (primer sequences areavailable in Table S2).
To confirm the C period measured by qPCR, a DNA incre-ment method was applied as described in ref. 42. Chlorampheni-col (200 µg·mL−1) was used to inhibit initiation of new roundsof replication, cells were collected by filtration, and the DNAamount was measured by using the diphenylamine colorimetricmethod. The measured DNA amount after inhibiting the repli-cation initiation was analyzed as described in ref. 28 to get the Cperiod.
Zheng et al. www.pnas.org/cgi/content/short/1617932114 2 of 6
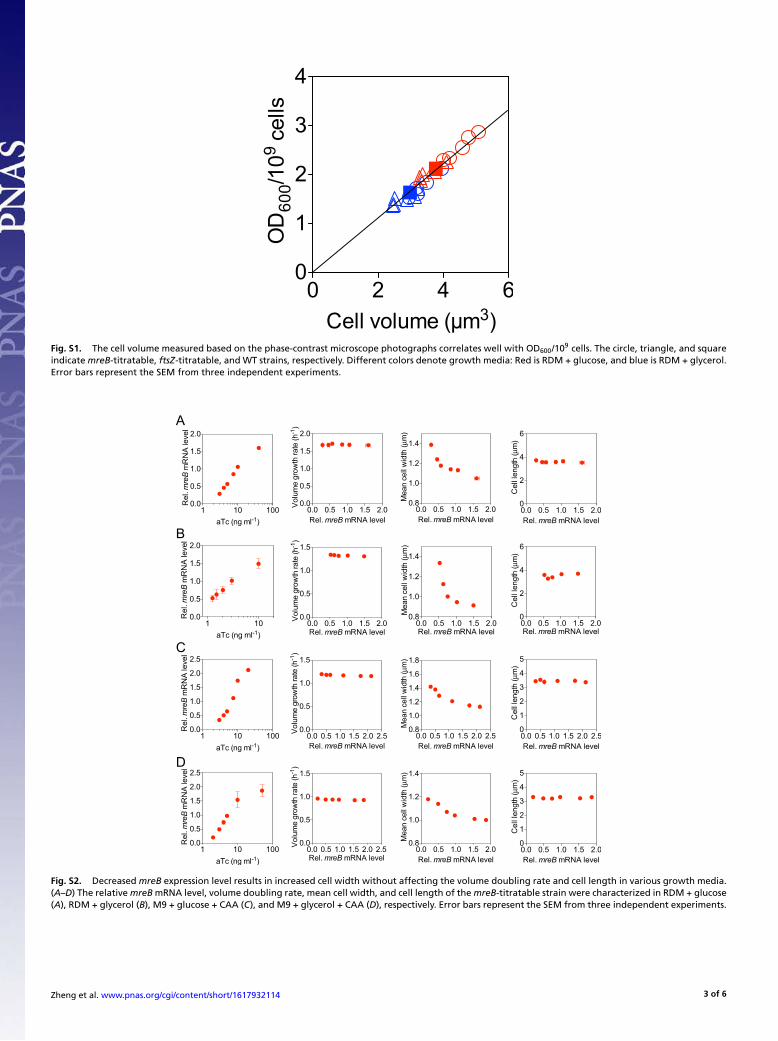
Fig. S1. The cell volume measured based on the phase-contrast microscope photographs correlates well with OD600/109 cells. The circle, triangle, and squareindicate mreB-titratable, ftsZ-titratable, and WT strains, respectively. Different colors denote growth media: Red is RDM + glucose, and blue is RDM + glycerol.Error bars represent the SEM from three independent experiments.
Fig. S2. Decreased mreB expression level results in increased cell width without affecting the volume doubling rate and cell length in various growth media.(A–D) The relative mreB mRNA level, volume doubling rate, mean cell width, and cell length of the mreB-titratable strain were characterized in RDM + glucose(A), RDM + glycerol (B), M9 + glucose + CAA (C), and M9 + glycerol + CAA (D), respectively. Error bars represent the SEM from three independent experiments.
Zheng et al. www.pnas.org/cgi/content/short/1617932114 3 of 6

Fig. S3. The cell width is maintained by the cell wall stiffness. (A) Representative SEM photographs of the mreB-titratable and WT strains. (B) The cell widthis negatively related with the effective cellular stiffness. Error bars represent the SEM from three independent experiments.
Fig. S4. The growth law does not apply for cell length or cell width. The average cell length (A) and average cell width (B) were not proportional to thescaling factor. The black line shows the best fit with intercept forced to zero. The coefficients of determination of the fits are −0.62 and −1.09, respectively.A negative coefficient of determination implies that the mean is a better predictor than the fit. The circle, triangle, and square indicate mreB-titratable,ftsZ-titratable, and WT strains, respectively. Different colors denote growth media: Red is RDM + glucose, and blue is RDM + glycerol. The SEMs of threereplicates were smaller than the size of the symbols.
Fig. S5. Cell length changes in mreB-titratable strains are small but consistent with the predictions by the growth law. Circles plot the same data as Fig. 4Cfor mreB-titratable strains. Different colors denote growth media: Red is RDM + glucose, and blue is RDM + glycerol. Black symbols plot predictions of thegrowth law given cell width and the D period. Error bars represent 10% propagated errors estimated from uncertainties in cell width, the C and D periods,the doubling time τ , and the proportionality constant ∆.
Zheng et al. www.pnas.org/cgi/content/short/1617932114 4 of 6
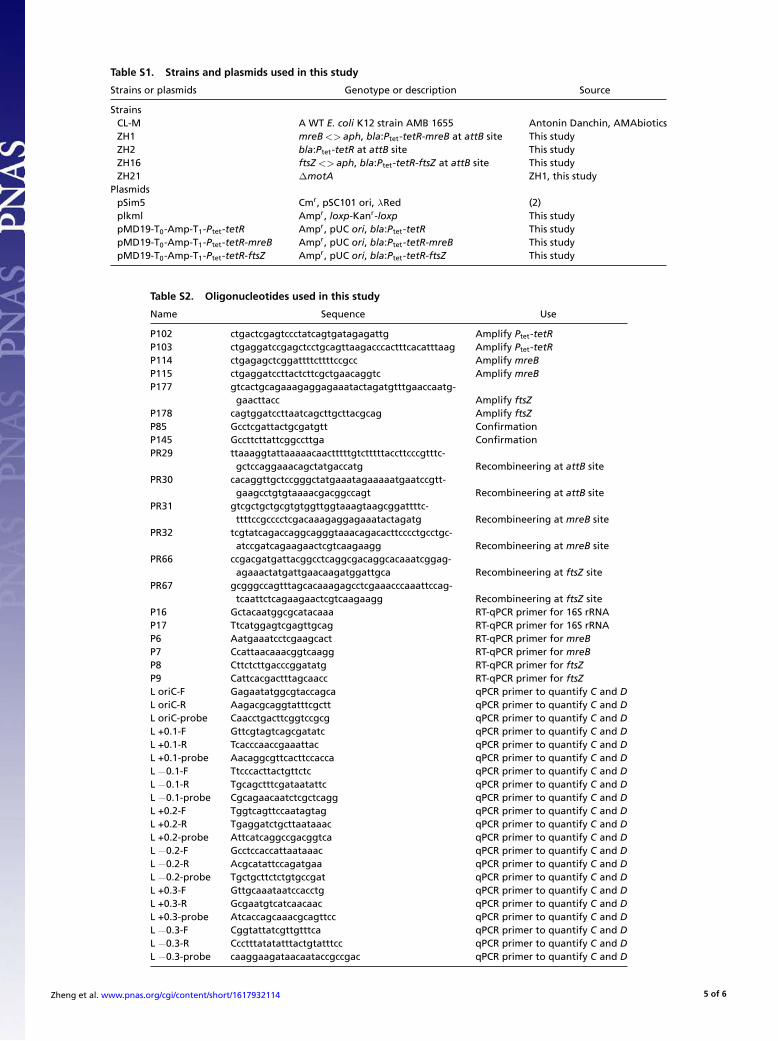
Table S1. Strains and plasmids used in this study
Strains or plasmids Genotype or description Source
StrainsCL-M A WT E. coli K12 strain AMB 1655 Antonin Danchin, AMAbioticsZH1 mreB<> aph, bla:Ptet-tetR-mreB at attB site This studyZH2 bla:Ptet-tetR at attB site This studyZH16 ftsZ<> aph, bla:Ptet-tetR-ftsZ at attB site This studyZH21 ∆motA ZH1, this study
PlasmidspSim5 Cmr, pSC101 ori, λRed (2)plkml Ampr, loxp-Kanr-loxp This studypMD19-T0-Amp-T1-Ptet-tetR Ampr, pUC ori, bla:Ptet-tetR This studypMD19-T0-Amp-T1-Ptet-tetR-mreB Ampr, pUC ori, bla:Ptet-tetR-mreB This studypMD19-T0-Amp-T1-Ptet-tetR-ftsZ Ampr, pUC ori, bla:Ptet-tetR-ftsZ This study
Table S2. Oligonucleotides used in this study
Name Sequence Use
P102 ctgactcgagtccctatcagtgatagagattg Amplify Ptet-tetRP103 ctgaggatccgagctcctgcagttaagacccactttcacatttaag Amplify Ptet-tetRP114 ctgagagctcggattttcttttccgcc Amplify mreBP115 ctgaggatccttactcttcgctgaacaggtc Amplify mreBP177 gtcactgcagaaagaggagaaatactagatgtttgaaccaatg-
gaacttacc Amplify ftsZP178 cagtggatccttaatcagcttgcttacgcag Amplify ftsZP85 Gcctcgattactgcgatgtt ConfirmationP145 Gccttcttattcggccttga ConfirmationPR29 ttaaaggtattaaaaacaactttttgtctttttaccttcccgtttc-
gctccaggaaacagctatgaccatg Recombineering at attB sitePR30 cacaggttgctccgggctatgaaatagaaaaatgaatccgtt-
gaagcctgtgtaaaacgacggccagt Recombineering at attB sitePR31 gtcgctgctgcgtgtggttggtaaagtaagcggattttc-
ttttccgcccctcgacaaagaggagaaatactagatg Recombineering at mreB sitePR32 tcgtatcagaccaggcagggtaaacagacacttcccctgcctgc-
atccgatcagaagaactcgtcaagaagg Recombineering at mreB sitePR66 ccgacgatgattacggcctcaggcgacaggcacaaatcggag-
agaaactatgattgaacaagatggattgca Recombineering at ftsZ sitePR67 gcgggccagtttagcacaaagagcctcgaaacccaaattccag-
tcaattctcagaagaactcgtcaagaagg Recombineering at ftsZ siteP16 Gctacaatggcgcatacaaa RT-qPCR primer for 16S rRNAP17 Ttcatggagtcgagttgcag RT-qPCR primer for 16S rRNAP6 Aatgaaatcctcgaagcact RT-qPCR primer for mreBP7 Ccattaacaaacggtcaagg RT-qPCR primer for mreBP8 Cttctcttgacccggatatg RT-qPCR primer for ftsZP9 Cattcacgactttagcaacc RT-qPCR primer for ftsZL oriC-F Gagaatatggcgtaccagca qPCR primer to quantify C and DL oriC-R Aagacgcaggtatttcgctt qPCR primer to quantify C and DL oriC-probe Caacctgacttcggtccgcg qPCR primer to quantify C and DL +0.1-F Gttcgtagtcagcgatatc qPCR primer to quantify C and DL +0.1-R Tcacccaaccgaaattac qPCR primer to quantify C and DL +0.1-probe Aacaggcgttcacttccacca qPCR primer to quantify C and DL −0.1-F Ttcccacttactgttctc qPCR primer to quantify C and DL −0.1-R Tgcagctttcgataatattc qPCR primer to quantify C and DL −0.1-probe Cgcagaacaatctcgctcagg qPCR primer to quantify C and DL +0.2-F Tggtcagttccaatagtag qPCR primer to quantify C and DL +0.2-R Tgaggatctgcttaataaac qPCR primer to quantify C and DL +0.2-probe Attcatcaggccgacggtca qPCR primer to quantify C and DL −0.2-F Gcctccaccattaataaac qPCR primer to quantify C and DL −0.2-R Acgcatattccagatgaa qPCR primer to quantify C and DL −0.2-probe Tgctgcttctctgtgccgat qPCR primer to quantify C and DL +0.3-F Gttgcaaataatccacctg qPCR primer to quantify C and DL +0.3-R Gcgaatgtcatcaacaac qPCR primer to quantify C and DL +0.3-probe Atcaccagcaaacgcagttcc qPCR primer to quantify C and DL −0.3-F Cggtattatcgttgtttca qPCR primer to quantify C and DL −0.3-R Ccctttatatatttactgtatttcc qPCR primer to quantify C and DL −0.3-probe caaggaagataacaataccgccgac qPCR primer to quantify C and D
Zheng et al. www.pnas.org/cgi/content/short/1617932114 5 of 6
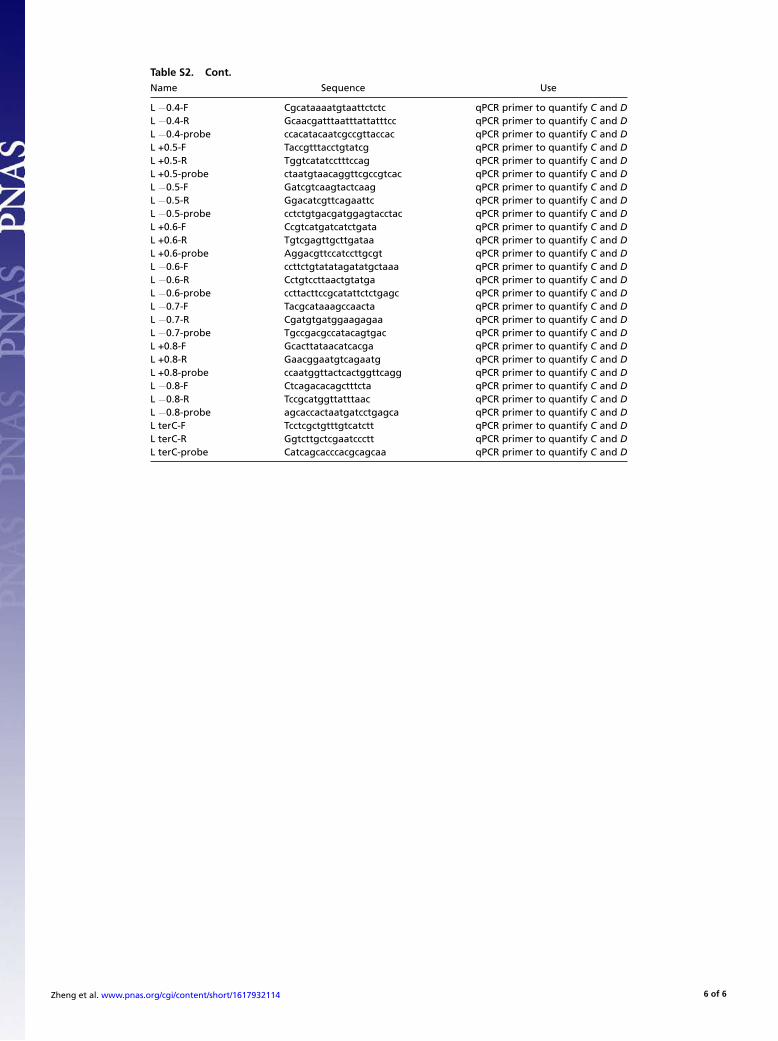
Table S2. Cont.Name Sequence Use
L −0.4-F Cgcataaaatgtaattctctc qPCR primer to quantify C and DL −0.4-R Gcaacgatttaatttattatttcc qPCR primer to quantify C and DL −0.4-probe ccacatacaatcgccgttaccac qPCR primer to quantify C and DL +0.5-F Taccgtttacctgtatcg qPCR primer to quantify C and DL +0.5-R Tggtcatatcctttccag qPCR primer to quantify C and DL +0.5-probe ctaatgtaacaggttcgccgtcac qPCR primer to quantify C and DL −0.5-F Gatcgtcaagtactcaag qPCR primer to quantify C and DL −0.5-R Ggacatcgttcagaattc qPCR primer to quantify C and DL −0.5-probe cctctgtgacgatggagtacctac qPCR primer to quantify C and DL +0.6-F Ccgtcatgatcatctgata qPCR primer to quantify C and DL +0.6-R Tgtcgagttgcttgataa qPCR primer to quantify C and DL +0.6-probe Aggacgttccatccttgcgt qPCR primer to quantify C and DL −0.6-F ccttctgtatatagatatgctaaa qPCR primer to quantify C and DL −0.6-R Cctgtccttaactgtatga qPCR primer to quantify C and DL −0.6-probe ccttacttccgcatattctctgagc qPCR primer to quantify C and DL −0.7-F Tacgcataaagccaacta qPCR primer to quantify C and DL −0.7-R Cgatgtgatggaagagaa qPCR primer to quantify C and DL −0.7-probe Tgccgacgccatacagtgac qPCR primer to quantify C and DL +0.8-F Gcacttataacatcacga qPCR primer to quantify C and DL +0.8-R Gaacggaatgtcagaatg qPCR primer to quantify C and DL +0.8-probe ccaatggttactcactggttcagg qPCR primer to quantify C and DL −0.8-F Ctcagacacagctttcta qPCR primer to quantify C and DL −0.8-R Tccgcatggttatttaac qPCR primer to quantify C and DL −0.8-probe agcaccactaatgatcctgagca qPCR primer to quantify C and DL terC-F Tcctcgctgtttgtcatctt qPCR primer to quantify C and DL terC-R Ggtcttgctcgaatccctt qPCR primer to quantify C and DL terC-probe Catcagcacccacgcagcaa qPCR primer to quantify C and D
Zheng et al. www.pnas.org/cgi/content/short/1617932114 6 of 6