Interpretive Guide to the North Carolina Winscan Score · PDF fileRose Hill KEVIN D. HOWELL...
17
Interpretive Guide to the WinScan Score Reports for the North Carolina End-of-Course Assessments 2014–15 North Carolina Department of Public Instruction
Transcript of Interpretive Guide to the North Carolina Winscan Score · PDF fileRose Hill KEVIN D. HOWELL...
Interpretive Guide to the
WinScan Score Reports for the North Carolina
End-of-Course Assessments
2014–15
North Carolina Department of Public Instruction
STATE BOARD OF EDUCATION SBE VISION: Every public school student will graduate ready for post-secondary education and
work, prepared to be a globally engaged and productive citizen.
SBE MISSION: The State Board of Education has the constitutional authority to lead and uphold
the system of public education in North Carolina.
WILLIAM COBEY
Chair :: Chapel Hill
A.L. COLLINS
Vice Chair :: Kernersville
DAN FOREST
Lieutenant Governor :: Raleigh
JANET COWELL
State Treasurer :: Raleigh
JUNE ST. CLAIR ATKINSON
Secretary to the Board :: Raleigh
BECKY TAYLOR
Greenville
REGINALD KENAN
Rose Hill
KEVIN D. HOWELL
Raleigh
GREG ALCORN
Salisbury
OLIVIA OXENDINE
Lumberton
WAYNE MCDEVITT
Asheville
ERIC DAVIS
Charlotte
PATRICIA N.
WILLOUGHBY
Raleigh
NC DEPARTMENT OF PUBLIC INSTRUCTION June St. Clair Atkinson, Ed.D., State Superintendent 301 N. Wilmington Street :: Raleigh, North Carolina 27601-2825 In compliance with federal law, the NC Department of Public Instruction administers all state-operated educational
programs, employment activities and admissions without discrimination because of race, religion, national or ethnic
origin, color, age, military service, disability, or gender, except where exemption is appropriate and allowed by law.
Inquiries or complaints regarding discrimination issues should be directed to:
Dr. Rebecca Garland, Deputy State Superintendent 6368 Mail Service Center, Raleigh, NC 27699-6368 :: Telephone: (919) 807-3200 :: Fax: (919) 807-3388
Visit us on the Web :: www.ncpublicschools.org

NC Department of Public Instruction | Accountability Services Division i
Contents
List of Figures ..................................................................................................................... ii
Introduction ......................................................................................................................... 1
How to Use This Guide....................................................................................................... 1
The WinScan Reports ......................................................................................................... 1
North Carolina End-of-Course Assessments ...................................................................... 2
Key Features of the EOC Subject Area Assessments ......................................................... 2
Individual Student Reports ................................................................................................. 4
Class Roster Reports ........................................................................................................... 5
Score Frequency Reports .................................................................................................... 6
Achievement Level Frequency Reports .............................................................................. 7
Goal Summary Reports ....................................................................................................... 8
Index of Terms by Label Number ....................................................................................... 9
NC Department of Public Instruction | Accountability Services Division ii
List of Figures
Figure 1. Sample ISR for the End-of-Course Assessment. ................................................. 4
Figure 2. Sample Class Roster for End-of-Course Assessments. ....................................... 5
Figure 3. Sample Score Frequency Report for NC EOC Assessments. .............................. 6
Figure 4. Sample Achievement Level Frequency Report for a Sample EOC Assessment. 8
Figure 5. Sample EOC Goal Summary Report. .................................................................. 9
NC Department of Public Instruction | Accountability Services Division 1
Introduction WinScan is a software application provided by the North Carolina Department of Public
Instruction (NCDPI). This software permits administrators at the district level to produce
a variety of score reports on demand, including Individual Student Reports (ISRs),
Achievement Level Frequency Reports, Class Roster Reports, Score Frequency Reports,
and Goal Summary Reports. The Interpretive Guide to the WinScan Score Reports for NC
EOC Assessments is intended to help educators understand these reports and to inform
decision making at the student, classroom, school, and district levels. This guide will also
help administrators and educators explain assessment results to parents and the general
public.
For each assessment, the NCDPI also produces an interpretive guide that is designed
specifically for parents to understand ISRs. This document, entitled Understanding the
Individual Student Report (UISR) is available online for every End-Of-Course (EOC),
End-of-Grade (EOG), and alternate assessment (see
http://www.ncpublicschools.org/accountability/policies/uisrs). The ISR is designed for
parents and teachers; whereas, the interpretive guides are designed for teachers and
administrators at the school, district, and state levels. Together, these documents provide
guidance in interpreting the many reports that are generated by the WinScan software
application.
How to Use This Guide This guide has been designed to give users quick access to the information needed when
interpreting a specific WinScan report. The table of contents and the table of figures can
be used to identify a sample report for any type of WinScan report. Users can learn about
all of the key features of the sample report by simply matching label numbers in the
sample reports to the label numbers in the Index of Terms by Label Number.
The WinScan Reports Each WinScan report has a standard template. Except for the ISRs, the standard templates
can be modified through user-defined options. When the standard report templates are
combined with different options, assessments, and data filters, over three hundred (300)
unique reports can be produced. This guide focuses on the most commonly used reports
for EOC assessments. Table 1 shows a list of the reports described in subsequent pages
and the audiences for which these reports are intended. The ISRs are designed for
students, teachers, students’ parents, and school administrators. Class Rosters are
designed for teachers and school administrators. Score Frequency Reports, Achievement
Level Frequency Reports, and Goal Summary Reports are designed for teachers, school
administrators, district administrators, and state administrators.
NC Department of Public Instruction | Accountability Services Division 2
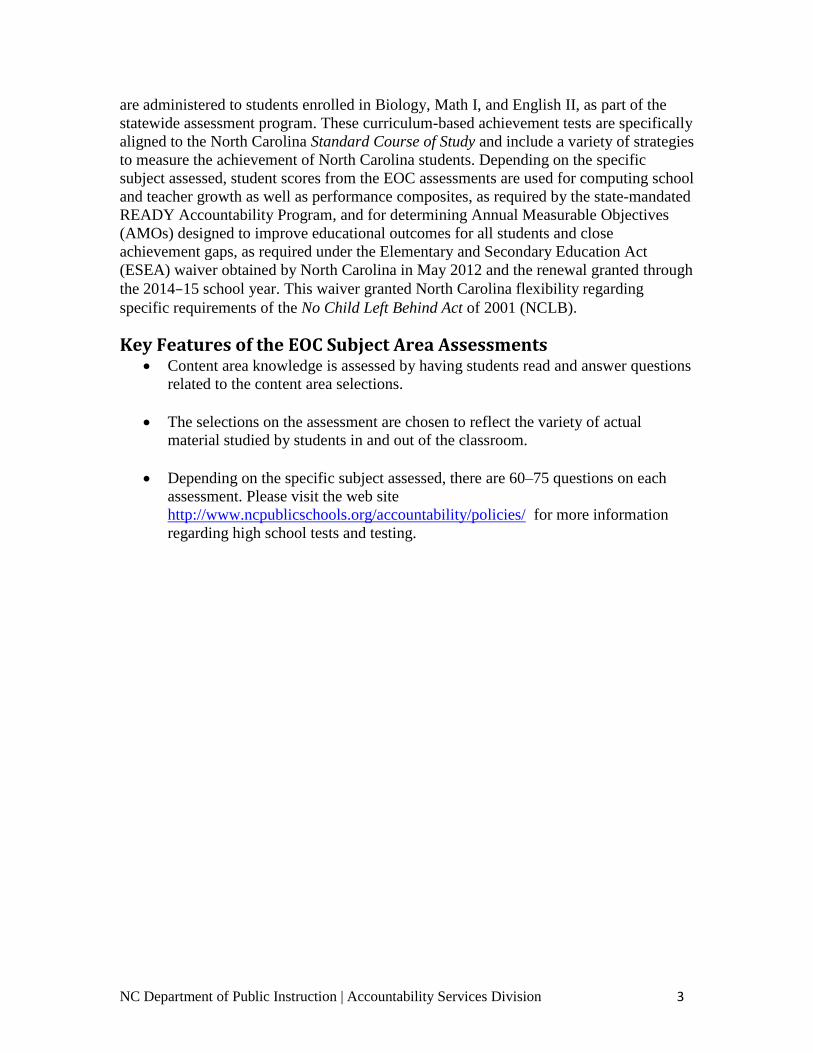
Table 1. WinScan Reports and Intended Audience
Audience
Administrators
Report Parent Teacher School District State
Individual Student Report
Class Roster Reports
Score and Achievement Level Frequency Reports
Goal Summary Reports
The WinScan reporting system can aggregate data at various levels, including class,
school, district, and state levels. Table 2 presents the reporting levels of each group-level
WinScan report.
Table 2. Reporting Levels for Group-Level WinScan Reports
Reporting Level
Report Class School District State
Class Roster Reports
Score and Achievement Level Frequency Reports
Goal Summary Reports
The WinScan reporting system can also summarize scores across various subgroups
including gender (male and female) and ethnicity (American Indian, Asian, Black,
Hispanic, Two or More Races, and White). Table 3 presents the standard reporting
groups available for each group-level WinScan report. When multiple subgroups are
selected, reports are produced for every combination of the chosen subgroups.
Table 3. Standard Reporting Groups for Group-Level WinScan Reports
Groups
Report All Gender Ethnicity
Gender &
Ethnicity
Class Roster Reports
Score and Achievement Level Frequency Reports
Goal Summary Reports
Note: Ethnicity includes the following: American Indian, Asian, Black, Hispanic, Two or More Races, and
White.
As can be seen from Tables 2 and 3, users have many options when producing WinScan
reports, including many subject areas, four (4) possible reporting levels, and four (4)
grouping variables to choose from, resulting in over three hundred (300) potential
individual reports.
North Carolina End-of-Course Assessments During the final then (10) days of a course, students take a state-required NC EOC
assessment for the identified classes in which students were enrolled. EOC assessments
NC Department of Public Instruction | Accountability Services Division 3
are administered to students enrolled in Biology, Math I, and English II, as part of the
statewide assessment program. These curriculum-based achievement tests are specifically
aligned to the North Carolina Standard Course of Study and include a variety of strategies
to measure the achievement of North Carolina students. Depending on the specific
subject assessed, student scores from the EOC assessments are used for computing school
and teacher growth as well as performance composites, as required by the state-mandated
READY Accountability Program, and for determining Annual Measurable Objectives
(AMOs) designed to improve educational outcomes for all students and close
achievement gaps, as required under the Elementary and Secondary Education Act
(ESEA) waiver obtained by North Carolina in May 2012 and the renewal granted through
the 2014–15 school year. This waiver granted North Carolina flexibility regarding
specific requirements of the No Child Left Behind Act of 2001 (NCLB).
Key Features of the EOC Subject Area Assessments Content area knowledge is assessed by having students read and answer questions
related to the content area selections.
The selections on the assessment are chosen to reflect the variety of actual
material studied by students in and out of the classroom.
Depending on the specific subject assessed, there are 60–75 questions on each
assessment. Please visit the web site
http://www.ncpublicschools.org/accountability/policies/ for more information
regarding high school tests and testing.
NC Department of Public Instruction | Accountability Services Division 4
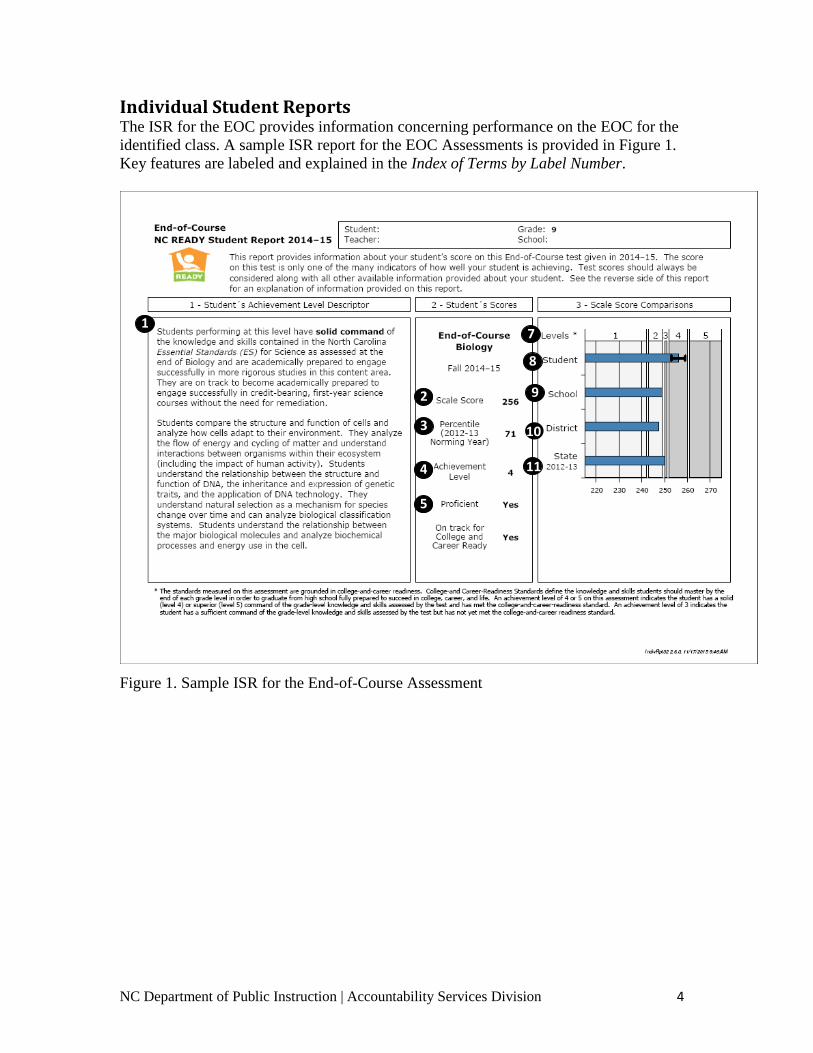
Individual Student Reports The ISR for the EOC provides information concerning performance on the EOC for the
identified class. A sample ISR report for the EOC Assessments is provided in Figure 1.
Key features are labeled and explained in the Index of Terms by Label Number.
Figure 1. Sample ISR for the End-of-Course Assessment
1
2
8
9
3
4
7
10
5
11
NC Department of Public Instruction | Accountability Services Division 5
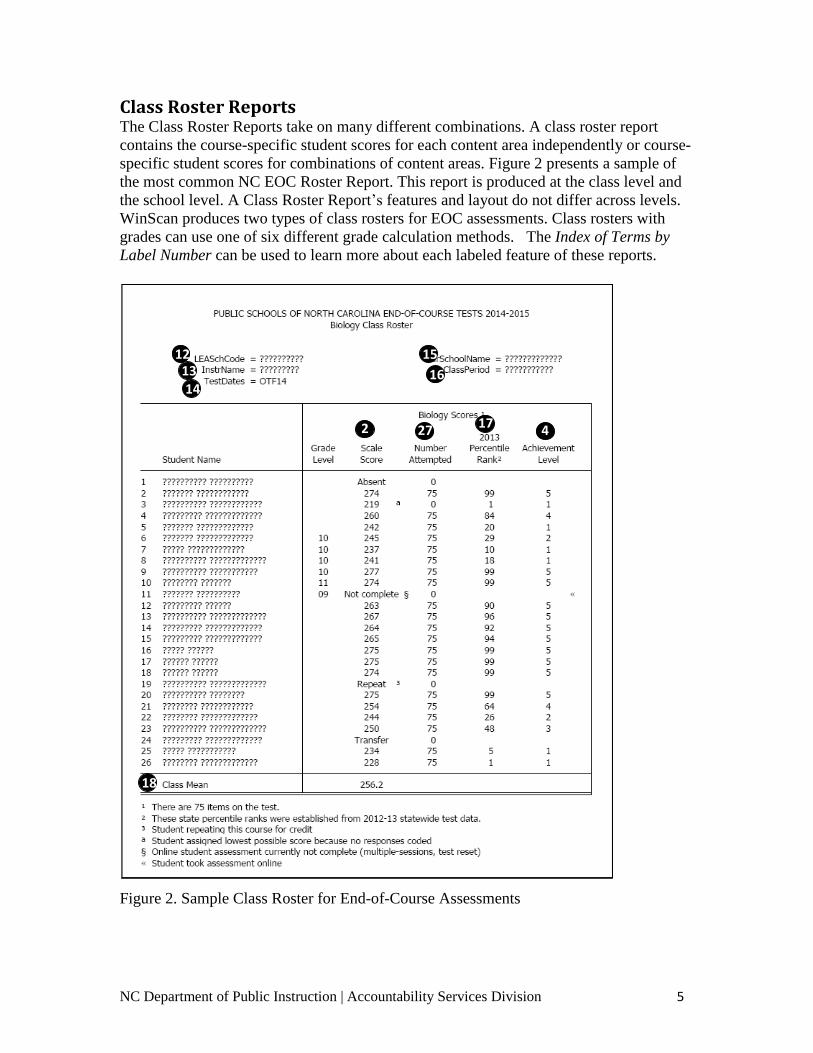
Class Roster Reports The Class Roster Reports take on many different combinations. A class roster report
contains the course-specific student scores for each content area independently or course-
specific student scores for combinations of content areas. Figure 2 presents a sample of
the most common NC EOC Roster Report. This report is produced at the class level and
the school level. A Class Roster Report’s features and layout do not differ across levels.
WinScan produces two types of class rosters for EOC assessments. Class rosters with
grades can use one of six different grade calculation methods. The Index of Terms by
Label Number can be used to learn more about each labeled feature of these reports.
Figure 2. Sample Class Roster for End-of-Course Assessments
17
15
13
16
14
12
2
4
27
18
NC Department of Public Instruction | Accountability Services Division 6
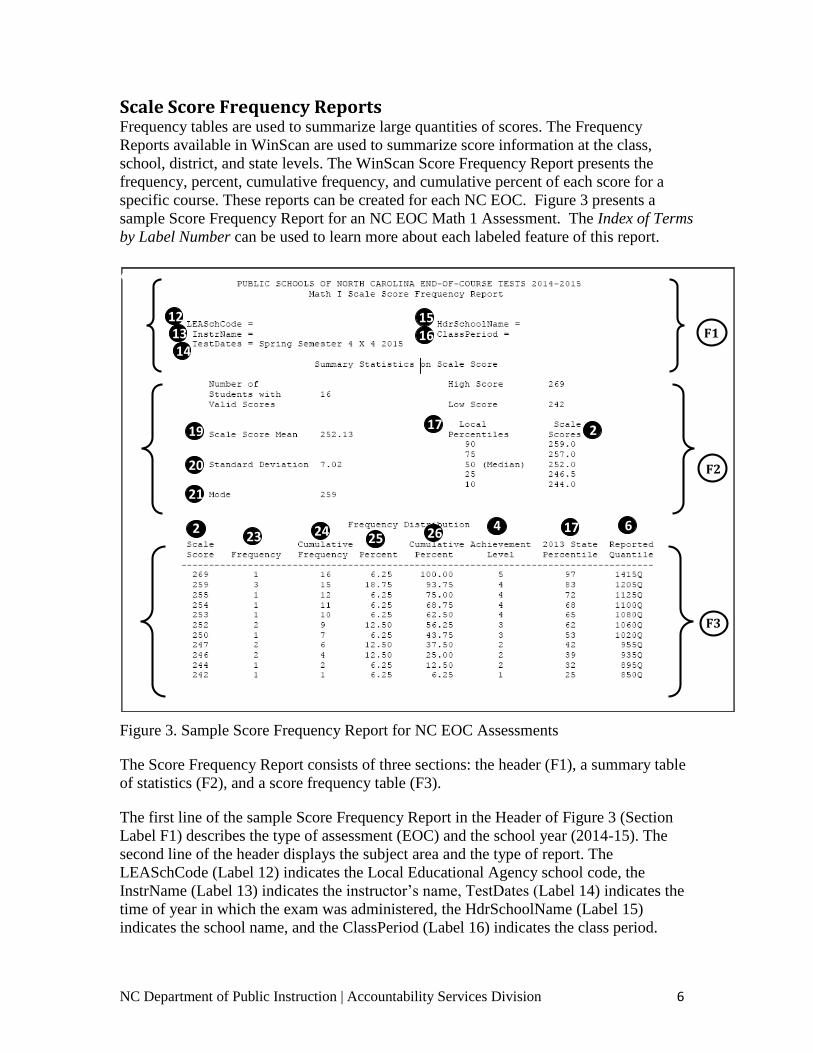
Scale Score Frequency Reports Frequency tables are used to summarize large quantities of scores. The Frequency
Reports available in WinScan are used to summarize score information at the class,
school, district, and state levels. The WinScan Score Frequency Report presents the
frequency, percent, cumulative frequency, and cumulative percent of each score for a
specific course. These reports can be created for each NC EOC. Figure 3 presents a
sample Score Frequency Report for an NC EOC Math 1 Assessment. The Index of Terms
by Label Number can be used to learn more about each labeled feature of this report.
Figure 3. Sample Score Frequency Report for NC EOC Assessments
The Score Frequency Report consists of three sections: the header (F1), a summary table
of statistics (F2), and a score frequency table (F3).
The first line of the sample Score Frequency Report in the Header of Figure 3 (Section
Label F1) describes the type of assessment (EOC) and the school year (2014-15). The
second line of the header displays the subject area and the type of report. The
LEASchCode (Label 12) indicates the Local Educational Agency school code, the
InstrName (Label 13) indicates the instructor’s name, TestDates (Label 14) indicates the
time of year in which the exam was administered, the HdrSchoolName (Label 15)
indicates the school name, and the ClassPeriod (Label 16) indicates the class period.
265
23 245
25
15
17
13
14
16
12
19
20
21
17
2
2
4
6
F1
F2
F3
NC Department of Public Instruction | Accountability Services Division 7
Figure 3 includes the summary table (section label F2) of a sample Score Frequency
Report for the Math I EOC assessment. The top row of the summary table indicates that
16 students in this report had valid scores. The highest score was 269 and the lowest
score was 242. The arithmetic mean score was 252.13 (Label 18), the standard deviation
was 7.02 (Label 20), and the mode was 259 (Label 21). The percentile scores are listed at
the far right of the table (Label 17). The scale scores are listed for the 10th, 25th, 50th, 75th,
and 90th percentiles (Label 19). In this sample, a scale score of 257 corresponds to a
percentile of 75. This means that 75 percent of the 16 students earned a score of 257 or
less.
The frequency table of the Score Frequency Report for the Math I EOC assessment is
presented in Figure 3 (section label F3). The Scale Score column (Label 2) presents every
score earned by the 16 students. The Frequency column (Label 23) presents the number
of students that earned each scale score. For example, one examinee earned a scale score
of 242. A “Missing” label would indicate that an examinee did not receive a score. The
Cumulative Frequency column (Label 24) presents the total number of students that
earned up to and including a given scale score. This column shows 6 students earned up
to and including a scale score of 247. The Percent column (Label 25) presents the percent
of students that earned a given scale score (number of students that earned the score
divided by total number of observations). This column shows that 6.25 percent of the
students earned a score of 253. The Cumulative Percent column (Label 25) displays the
percent of students that earned up to and including a given scale score. This column
shows 18.75 percent of the students earned up to and including a scale score of 259. The
Achievement Level column (Label 4) displays the achievement level associated with
each scale score. In this example, a scale score of 253 corresponds to an achievement
level of 4.
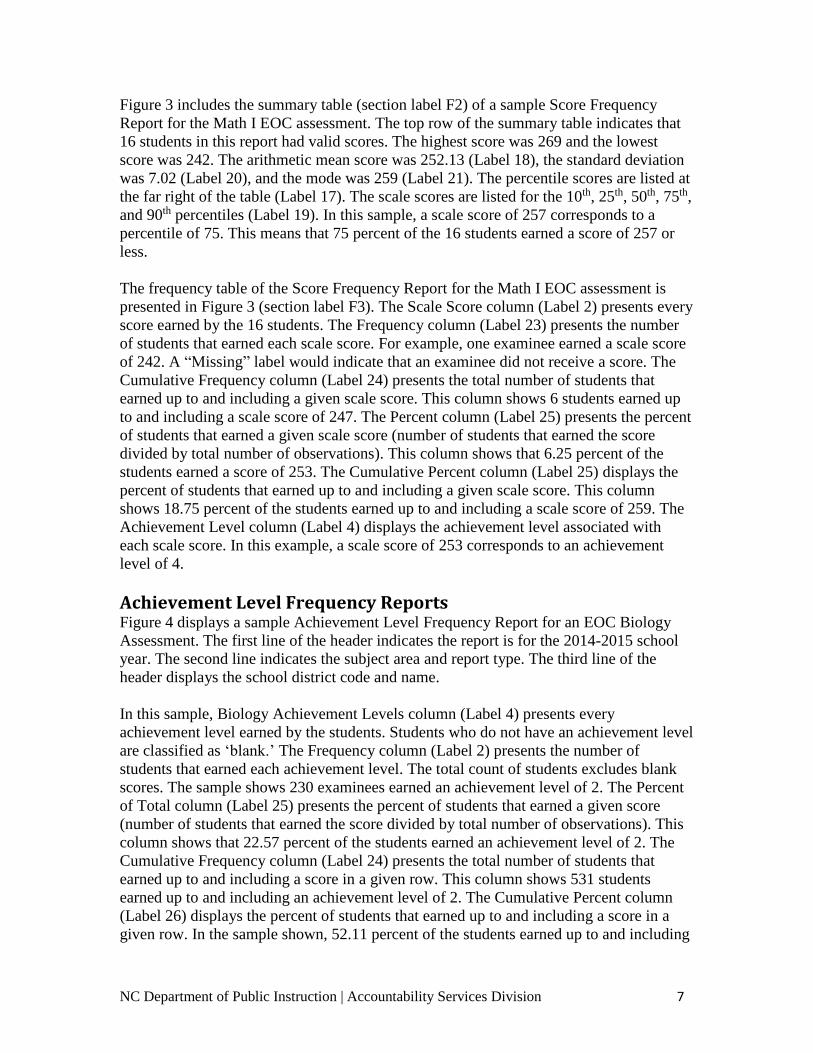
Achievement Level Frequency Reports Figure 4 displays a sample Achievement Level Frequency Report for an EOC Biology
Assessment. The first line of the header indicates the report is for the 2014-2015 school
year. The second line indicates the subject area and report type. The third line of the
header displays the school district code and name.
In this sample, Biology Achievement Levels column (Label 4) presents every
achievement level earned by the students. Students who do not have an achievement level
are classified as ‘blank.’ The Frequency column (Label 2) presents the number of
students that earned each achievement level. The total count of students excludes blank
scores. The sample shows 230 examinees earned an achievement level of 2. The Percent
of Total column (Label 25) presents the percent of students that earned a given score
(number of students that earned the score divided by total number of observations). This
column shows that 22.57 percent of the students earned an achievement level of 2. The
Cumulative Frequency column (Label 24) presents the total number of students that
earned up to and including a score in a given row. This column shows 531 students
earned up to and including an achievement level of 2. The Cumulative Percent column
(Label 26) displays the percent of students that earned up to and including a score in a
given row. In the sample shown, 52.11 percent of the students earned up to and including
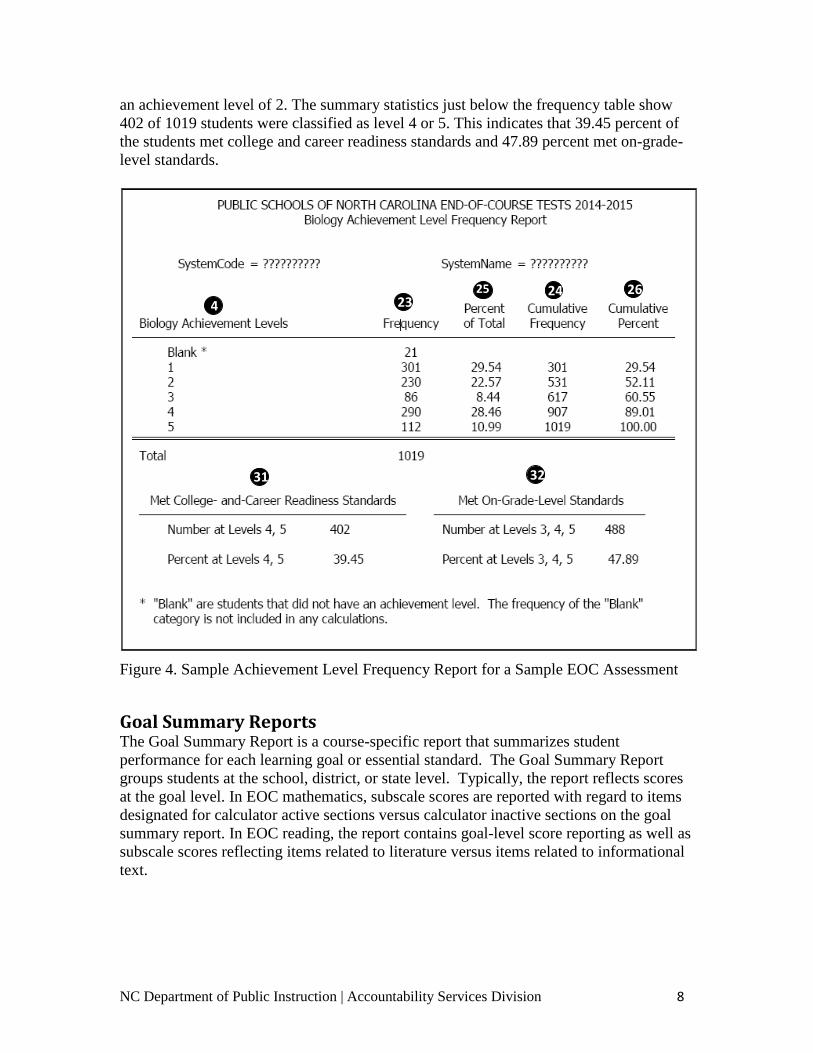
NC Department of Public Instruction | Accountability Services Division 8
an achievement level of 2. The summary statistics just below the frequency table show
402 of 1019 students were classified as level 4 or 5. This indicates that 39.45 percent of
the students met college and career readiness standards and 47.89 percent met on-grade-
level standards.
Figure 4. Sample Achievement Level Frequency Report for a Sample EOC Assessment
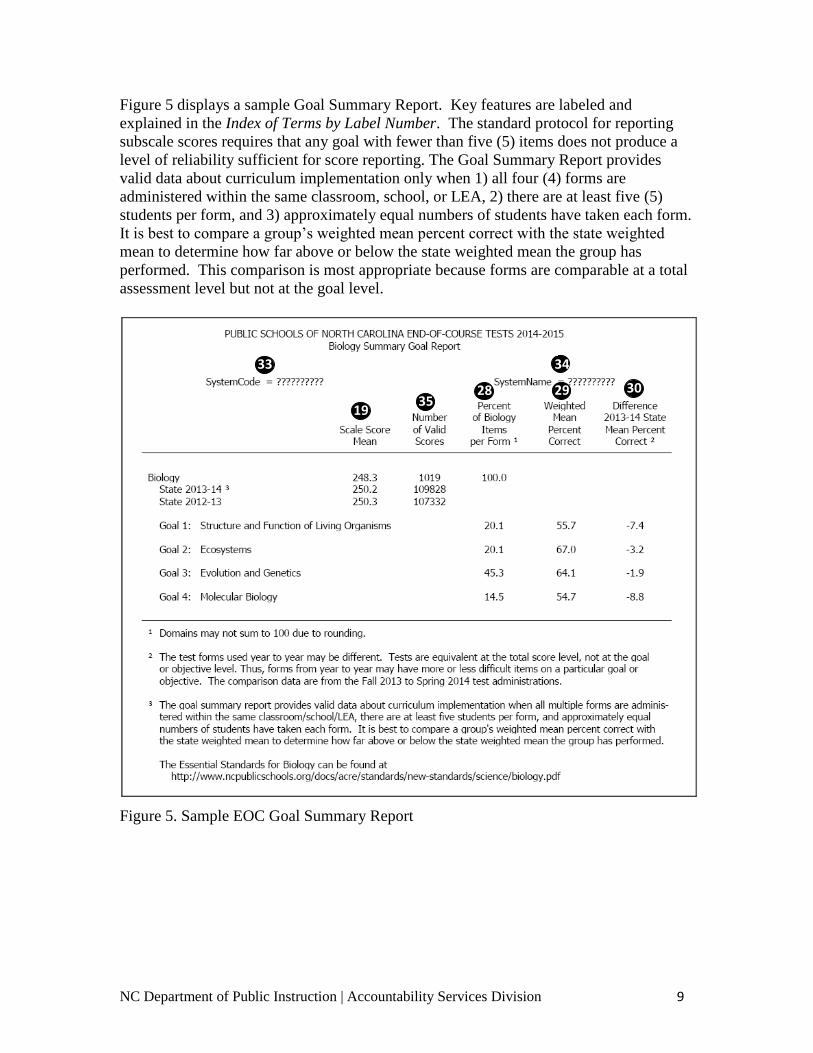
Goal Summary Reports The Goal Summary Report is a course-specific report that summarizes student
performance for each learning goal or essential standard. The Goal Summary Report
groups students at the school, district, or state level. Typically, the report reflects scores
at the goal level. In EOC mathematics, subscale scores are reported with regard to items
designated for calculator active sections versus calculator inactive sections on the goal
summary report. In EOC reading, the report contains goal-level score reporting as well as
subscale scores reflecting items related to literature versus items related to informational
text.
32
31
4
23 265
245
25
NC Department of Public Instruction | Accountability Services Division 9
Figure 5 displays a sample Goal Summary Report. Key features are labeled and
explained in the Index of Terms by Label Number. The standard protocol for reporting
subscale scores requires that any goal with fewer than five (5) items does not produce a
level of reliability sufficient for score reporting. The Goal Summary Report provides
valid data about curriculum implementation only when 1) all four (4) forms are
administered within the same classroom, school, or LEA, 2) there are at least five (5)
students per form, and 3) approximately equal numbers of students have taken each form.
It is best to compare a group’s weighted mean percent correct with the state weighted
mean to determine how far above or below the state weighted mean the group has
performed. This comparison is most appropriate because forms are comparable at a total
assessment level but not at the goal level.
Figure 5. Sample EOC Goal Summary Report
34
33
19
35 28
29
30
NC Department of Public Instruction | Accountability Services Division 10
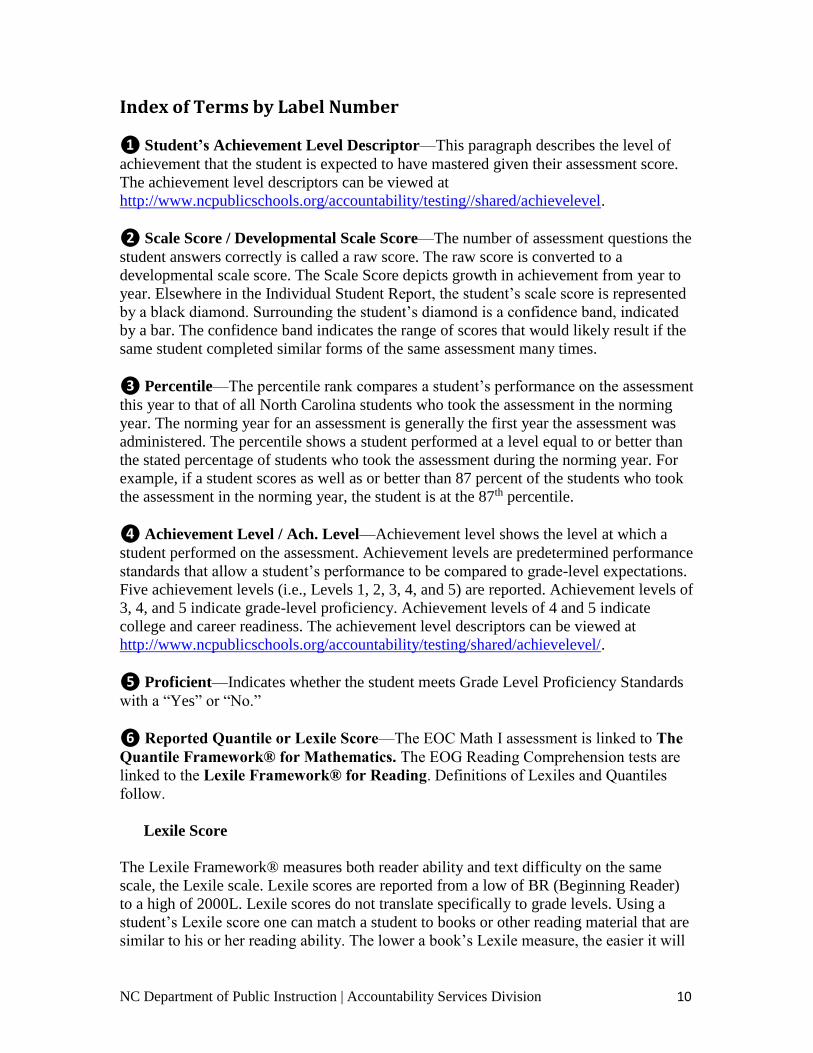
Index of Terms by Label Number
❶ Student’s Achievement Level Descriptor—This paragraph describes the level of
achievement that the student is expected to have mastered given their assessment score.
The achievement level descriptors can be viewed at
http://www.ncpublicschools.org/accountability/testing//shared/achievelevel.
❷ Scale Score / Developmental Scale Score—The number of assessment questions the
student answers correctly is called a raw score. The raw score is converted to a
developmental scale score. The Scale Score depicts growth in achievement from year to
year. Elsewhere in the Individual Student Report, the student’s scale score is represented
by a black diamond. Surrounding the student’s diamond is a confidence band, indicated
by a bar. The confidence band indicates the range of scores that would likely result if the
same student completed similar forms of the same assessment many times.
❸ Percentile—The percentile rank compares a student’s performance on the assessment
this year to that of all North Carolina students who took the assessment in the norming
year. The norming year for an assessment is generally the first year the assessment was
administered. The percentile shows a student performed at a level equal to or better than
the stated percentage of students who took the assessment during the norming year. For
example, if a student scores as well as or better than 87 percent of the students who took
the assessment in the norming year, the student is at the 87th percentile.
❹ Achievement Level / Ach. Level—Achievement level shows the level at which a
student performed on the assessment. Achievement levels are predetermined performance
standards that allow a student’s performance to be compared to grade-level expectations.
Five achievement levels (i.e., Levels 1, 2, 3, 4, and 5) are reported. Achievement levels of
3, 4, and 5 indicate grade-level proficiency. Achievement levels of 4 and 5 indicate
college and career readiness. The achievement level descriptors can be viewed at
http://www.ncpublicschools.org/accountability/testing/shared/achievelevel/.
❺ Proficient—Indicates whether the student meets Grade Level Proficiency Standards
with a “Yes” or “No.”
❻ Reported Quantile or Lexile Score—The EOC Math I assessment is linked to The
Quantile Framework® for Mathematics. The EOG Reading Comprehension tests are
linked to the Lexile Framework® for Reading. Definitions of Lexiles and Quantiles
follow.
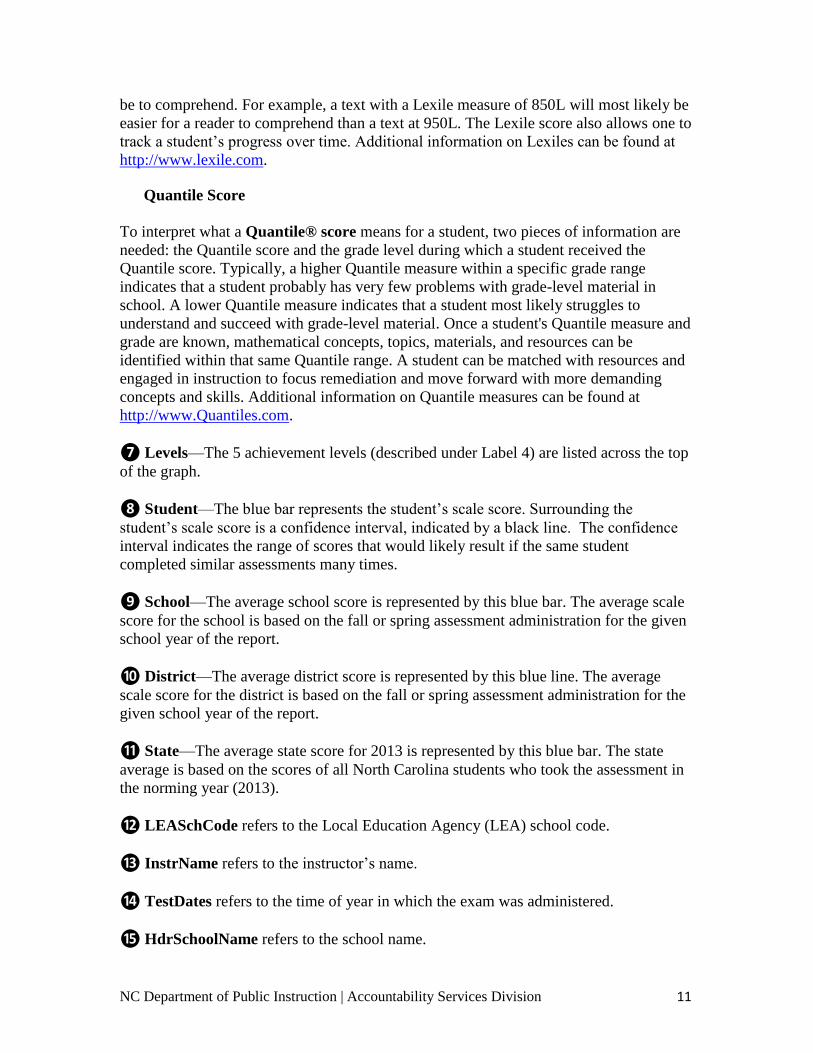
Lexile Score
The Lexile Framework® measures both reader ability and text difficulty on the same
scale, the Lexile scale. Lexile scores are reported from a low of BR (Beginning Reader)
to a high of 2000L. Lexile scores do not translate specifically to grade levels. Using a
student’s Lexile score one can match a student to books or other reading material that are
similar to his or her reading ability. The lower a book’s Lexile measure, the easier it will
NC Department of Public Instruction | Accountability Services Division 11
be to comprehend. For example, a text with a Lexile measure of 850L will most likely be
easier for a reader to comprehend than a text at 950L. The Lexile score also allows one to
track a student’s progress over time. Additional information on Lexiles can be found at
http://www.lexile.com.
Quantile Score
To interpret what a Quantile® score means for a student, two pieces of information are
needed: the Quantile score and the grade level during which a student received the
Quantile score. Typically, a higher Quantile measure within a specific grade range
indicates that a student probably has very few problems with grade-level material in
school. A lower Quantile measure indicates that a student most likely struggles to
understand and succeed with grade-level material. Once a student's Quantile measure and
grade are known, mathematical concepts, topics, materials, and resources can be
identified within that same Quantile range. A student can be matched with resources and
engaged in instruction to focus remediation and move forward with more demanding
concepts and skills. Additional information on Quantile measures can be found at
http://www.Quantiles.com.
❼ Levels—The 5 achievement levels (described under Label 4) are listed across the top
of the graph.
❽ Student—The blue bar represents the student’s scale score. Surrounding the
student’s scale score is a confidence interval, indicated by a black line. The confidence
interval indicates the range of scores that would likely result if the same student
completed similar assessments many times.
❾ School—The average school score is represented by this blue bar. The average scale
score for the school is based on the fall or spring assessment administration for the given
school year of the report.
❿ District—The average district score is represented by this blue line. The average
scale score for the district is based on the fall or spring assessment administration for the
given school year of the report.
⓫ State—The average state score for 2013 is represented by this blue bar. The state
average is based on the scores of all North Carolina students who took the assessment in
the norming year (2013).
⓬ LEASchCode refers to the Local Education Agency (LEA) school code.
⓭ InstrName refers to the instructor’s name.
⓮ TestDates refers to the time of year in which the exam was administered.
⓯ HdrSchoolName refers to the school name.

NC Department of Public Instruction | Accountability Services Division 12
⓰ ClassPeriod refers to the class period.
⓱ 2013 State or Local Pctl (Percentile) refers to either the ELA/reading and
mathematics percentiles that were established from 2013 statewide or the LEA-wide
assessment data.
⓲ Class Mean—The class mean is the average of the class scores. The mean is the sum
of all scores in the roster divided by the number of scores in the roster.
⓳ Scale Score Mean—The group mean is the average of a group of scores. The mean is
the sum of all scores in the roster divided by the number of scores in the roster.
⓴ Standard Deviation—The standard deviation indicates the degree of variation of
scores among a group of students. The larger the standard deviation, the greater the
variation there is in scores. The standard deviation is the square root of the variance of
the scores.
Mode—the group mode is the most common score or scores of the group.
Percentile—The percentile describes the percent of all values of the scale score that
are equal to or less than the scale score. The median is the midpoint of the scale score
distribution and corresponds to the 50th percentile.
Frequency—The Frequency column presents the number of students that earned
each score.
Cumulative Frequency—The value in the cumulative frequency column in a
frequency table is the total number of students that earned all scores up to and including
the score in the same row.
Percent—The Percent of Total column presents the percent of students that earned a
given score (number of students that earned the score divided by the total number of
observations).
Cumulative Percent—The value in the Cumulative Percent column in frequency
tables is the percent of students that earned all scores/achievement level up to and
including the score/achievement level in the same row.
Number Attempted refers to the number of questions answered by the student.
Percent of the Read/Math/Biology Items per Form – The percent of the items per
form is the percent of items that align with each content goal.
Weighted Mean Percent Correct –A weighted mean is used to calculate the mean
scores from different forms. If the count of students differs across forms, a weighted
22
26
21
23
25
29
27
28
24
NC Department of Public Instruction | Accountability Services Division 13
mean adjusts for the different counts across the forms. For instance, if twice as many
students took one form as compared to another, this form would receive twice the weight
in calculating the mean. Usually about the same numbers of students take each form, so
in practice, the weighted mean is very similar to an unweighted mean.
Difference 2013 State Mean Percent Correct – This difference displays
performance relative to the 2013 state mean percent correct. Negative values indicate a
score performance below the state mean percent correct, while positive values indicate
performance above the state mean.
Met College and Career Readiness Standards – The number of students who have
met the College and Career Readiness Standards (Levels 4 and 5).
Met On-Grade-Level Standards – The number of students who have met On-
Grade-Level Standards (levels 3, 4 and 5).
SystemCode refers to the Local Education Agency (LEA) school code.
SystemName refers to the Local Education Agency (LEA) or District Name.
Number of Valid Scores refers to the number of valid scores and is used as the
denominator in calculating the mean.
30
31
32
33
34
35