Interpretive Guide for ACT Aspire Summative Reports Aspire Scale Scores 3 ACT Aspire Benchmarks 3...
45
Interpretive Guide for ACT Aspire ® Summative Reports SPRING 2017 TESTING
Transcript of Interpretive Guide for ACT Aspire Summative Reports Aspire Scale Scores 3 ACT Aspire Benchmarks 3...
Interpretive Guide for ACT Aspire® Summative Reports
SPRING 2017 TESTING

© 2017 by ACT, inc. All rights reserved. ACT National Career Readiness Certifi cate™ is a trademark, and ACT®, ACT Aspire®, ACT Explore®, ACT Plan®, ACT National Curriculum Survey®, and ACT NCRC® are registered trademarks of ACT, inc.
Note: This guide is the copyrighted property of ACT, inc., and may not be copied or otherwise reproduced without the prior written express permission of ACT, inc. if you are not the authorized and intended user of these materials, contact ACT Aspire Customer Service immediately at 1.888.802.7502.
5202
Contact InformationFor assistance, fi rst contact your ACT Aspire test coordinator. Otherwise, call ACT Aspire Customer Service at 1.888.802.7502, 6:00 a.m.–7:30 p.m., central time, Monday through Friday.
visit actaspire.pearson.com for links to the following sites:
• ACT Aspire Portal administrator/teacher sign in
• ACT Aspire System Check for TestNav 8
• ACT Aspire Student Sandbox and Exemplar Test Question Booklets
• Avocet (a collection of manuals, guides, and help sheets)
• ACT Aspire Training Management Site (TMS)
• Many more helpful resources
i
ContentsList of Tables ii
List of Figures ii
List of Abbreviations ii
Introduction 1
Overview of the ACT Aspire Program 2ACT Aspire Scale Scores 3ACT Aspire Benchmarks 3ACT Readiness Levels 4ACT Readiness Benchmark for ELA and STEM 5ACT Aspire Reporting Categories 6The ACT College and Career Readiness Standards 8ACT Aspire Test Forms 8ACT Aspire National Norms 8ACT Aspire Growth Models 10ACT Aspire Reporting Packages 11Off-Grade Testing 12Testing with Accommodations 12
Understanding Your Student Report Package 13Student Planning Guide 13Student Information 13Current Progress Report 13Skill Proficiency Report 18Invalid or Non-Scorable Results 18One Page ISR 20
Understanding Educator/Group Reports 21Subject Proficiency by Student Report 21Current Progress Report 22Supplemental Scores Report 23
Proficiency Summary Report 24Skill Proficiency Report 25Skill Proficiency by Group Report 25New Class Roster 26
Understanding ACT Aspire School Reports 27Current Progress Report 27Supplemental Scores Report 28Subject Proficiency by Grade Level Report 30Subject Proficiency by Student Report 30Subject Proficiency by Demographic Report 30Skill Proficiency by Subject Report 30Skill Proficiency by Demographic Report 30
Understanding ACT Aspire District and State Report Packages 31
Glossary 32
Appendix A: Subject Assessments and Reporting Categories 33Reading 33English 33Writing 34Science 34Mathematics 35

ii
AbbreviationsAbbreviation Definition
ACT CCRS ACT College and Career Readiness Standards
ACT NCRC ACT National Career Readiness Certificate
DOK Depth of Knowledge
EHS Early High School
ELA English Language Arts—in ACT Aspire reports, a combined score for English, reading, and writing tests.
ISR Individual Student Report
SEM Standard Error of Measurement
SGP Student Growth Percentile
SPF Student Performance File
STEM Science, Technology, Engineering, Mathematics—in ACT Aspire reports, a combined score for science and mathematics tests.
TablesTable 1. ACT Readiness Benchmarks 3Table 2. Score Ranges for ACT Readiness Levels 5Table 3. ACT Readiness Benchmarks in ELA and STEM, Grades 3–10 6Table 4. ACT Aspire Reporting Categories 7Table 5. ACT Aspire National Score Averages for Spring 2017 Reporting 9Table 6. National Percentage of Students Meeting or Exceeding ACT Readiness Benchmarks for Spring 2017 Reporting 9Table 7. Summary of Student Reporting Features 16Table 8. Aggregate Reporting Features 29
FiguresFigure 1. ACT Aspire Current Progress Report (Grade 3) 14Figure 2. ACT Aspire Current Progress Report (Grade 10) 15Figure 3. Student report notifications of invalid/non-scorable results 18Figure 4. ACT Aspire Skill Proficiency Report 19Figure 5. One Page ISR 20Figure 6. Educator/group report notifications of non-scorable results 22Figure 8. Proficiency Summary Report section of the educator/group reports 24
List of TablesList of FiguresList of Abbreviations

1
IntroductionThis guide aims to help you understand and effectively use the ACT Aspire® score reports available to students, educators, schools, districts, and states. Please keep the following cautions in mind:
• The validity of conclusions about student groups depends, in part, on the accuracy of data provided about students at the time of testing (gender, race/ethnicity background, and other personal information).
• Numerous social, economic, and instructional factors are known to contribute to educational achievement. Relatively few of these factors are represented in these reports. Conclusions based on student achievement about educational programs or policies at your school should be supported by information from additional sources.
• In making decisions or drawing conclusions based on differences among groups of students, caution must be employed when the number of students in any group is small. ACT Aspire also urges caution when interpreting summary results for groups with fewer than 25 students because of the instability associated with data from small samples. For example, one very low or very high score may overly influence the average scores of 10 students but will have much less effect when included in a group of 100 students. In addition, care should be taken with any information from small groups in which group members can be easily recognized and confidentiality is likely to be difficult to maintain.
• When sharing ACT Aspire results with others, it’s important to identify the population represented by the educator/group or school report. For example, conclusions regarding your entire class are appropriate only if all or nearly all of your students participated in the program or if you have determined that those who took the test are representative of the class as a whole.
• Scores are estimates of student knowledge and achievement. The student’s actual achievement could be slightly higher or lower than the reported scores. For more information about measurement error, see ACT Aspire Summative Technical Manual on Avocet.

2
Overview of the ACT Aspire ProgramACT Aspire is a vertically scaled modular suite of achievement tests that measures student growth in a longitudinal assessment system. By charting a student’s growth from the elementary grades through early high school, ACT Aspire expands the assessment of skills in the same five academic areas as the ACT® test: English, mathematics, reading, science, and writing.
ACT Aspire measures students’ progress toward college and career readiness. The scale scores are linked to college and career data through scores on the ACT and the ACT National Career Readiness Certificate™ (ACT NCRC®) program. Empirically based ACT Readiness Benchmarks provide information about whether students are on target for readiness at the appropriate grade/subject levels. To enhance score interpretation, reporting categories (also called skills) for ACT Aspire use the same terminology as the ACT College and Career Readiness Standards (ACT CCRS) and other standards that target college and career readiness.
The goal of assessment is to collect relevant evidence from the student as authentically as possible while sampling enough of the construct to support inferences based on the student’s test scores. ACT Aspire uses several item types to achieve this goal. Selected-response (multiple-choice) items offer an efficient, reliable way to sample a wide range of content skills and understandings. Constructed-response tasks require students to explain, justify, critique, create, propose, produce, design, or otherwise demonstrate knowledge and understanding by generating a response. When appropriate, context is provided to reinforce students’ practical applications of concepts, theories, principles, and processes. Technology-enhanced items and tasks use online interfaces to ask questions and pose scenarios that are not possible in traditional paper tests. They also present conventional items in fresh, innovative ways that motivate students. Technology-enhanced items may require students to generate their responses, or they may present students with a wider and more complex set of answer options. The multiple item types on ACT Aspire assessments yield the evidence needed to support inferences about student achievement.

3
OvERviEw OF ThE ACT ASPiRE PROGRAM
ACT Aspire Scale ScoresFor each ACT Aspire test, the number of points earned are counted to obtain a raw score which is then converted to a three-digit scale score. The scale scores for each subject are measured against the ACT Readiness Benchmarks to identify whether students are on target to meet the ACT College Readiness Benchmarks by the time they take the ACT in grade 11. Four Readiness Levels are used for each subject to further identify how student performance relates to the Benchmarks: Exceeding, Ready, Close, and In Need of Support.
In addition, for students who take the English, reading, and writing tests, these scores are combined into a three-digit English Language Arts (ELA) score. Scores on the mathematics and science tests are combined into a three-digit Science, Technology, Engineering, and Mathematics (STEM) score. Based on a subset of items in the reading test, the Progress with Text Complexity indicator also identifies whether students are making sufficient progress toward reading the complex texts they will encounter as they further their education and work toward college and career.
For upper-grade students, ACT Aspire provides two additional indicators that are useful for students planning for college or a career. For grades 8 through early high school, there is a three-digit Composite score if a student takes the English, mathematics, reading, and science tests. This Composite score is linked to the ACT NCRC program in order to provide a Progress toward Career Readiness indicator for students in grades 8–10.
Finally, for Early High School (Grades 9–10) tests, ACT Aspire offers predicted subject test and Composite score ranges on the ACT. This allows ninth and tenth graders to determine if they are on target for college readiness as they prepare to take the ACT and plan for college.
ACT Aspire BenchmarksCollege and career readiness is the cornerstone for the ACT Aspire system. Table 1 provides the ACT Readiness Benchmarks for all grades and subjects. These benchmarks are aligned with the existing ACT College Readiness Benchmarks. Students at or above the benchmark are on target for college readiness when they take the ACT test in grade 11. For additional information on how the benchmarks were established, see ACT Aspire Summative Technical Manual.
Table 1. ACT Readiness Benchmarks
Tested grade English Mathematics Reading Science Writing
3 413 413 415 418 428
4 417 416 417 420 428
5 419 418 420 422 428
6 420 420 421 423 428
7 421 422 423 425 428
8 422 425 424 427 428
9 426 428 425 430 428
10 428 432 428 432 428

4
OvERviEw OF ThE ACT ASPiRE PROGRAM
Unlike other subjects, the benchmark for the writing test is constant across grade levels. The writing test scores are rubric driven and based on four domains, with each domain scored on a 1–5 scale in grades 3–5 or 1–6 scale in grades 6–10. The rubrics get more difficult as grade increases. The benchmark was set as the scale score corresponding to two 4s and two 3s on the four domains for the online base forms. However, this relationship may not hold for other forms after statistical process is used to adjust for form difference.
Note for Fall Testers: The ACT Readiness Benchmarks were obtained using spring performance, so scores for students who test in the fall are compared to a spring benchmark. Therefore, performance relative to the benchmark is an indication of what a student still needs to learn in order to be “ready” by the end of the year.
ACT Readiness LevelsOther than the benchmark score for each subject and grade, additional cut scores are created around the benchmark and can be used to classify students into four performance levels:
• Exceeding
• Ready
• Close
• In Need of Support
Students in the Ready category have met the ACT Readiness Benchmark and are on target for 50% or higher likelihood of college course success by grade 11; students in the Exceeding category scored substantially above the benchmark and have a much higher chance to be college and career ready; students in the Close category scored below but near the ACT Readiness Benchmark, considering the measurement error; and students in the In Need of Support category performed substantially below the ACT Readiness Benchmark. ACT Aspire standard score reports will classify students into the four levels given above. Table 2 provides the score ranges for the four ACT Readiness Levels for all grades and subjects. For additional information on how the ACT Readiness Levels were established, see ACT Aspire Summative Technical Manual.

5
OvERviEw OF ThE ACT ASPiRE PROGRAM
Table 2. Score Ranges for ACT Readiness Levels
SubjectACT Readiness Level
Grade Level Scale Score Ranges
3 4 5 6 7 8 9 10
English
Exceeding 418–435 423–438 426–442 427–448 429–450 429–452 433–456 435–456
Ready 413–417 417–422 419–425 420–426 421–428 422–428 426–432 428–434
Close 408–412 411–416 412–418 413–419 413–420 415–421 419–425 421–427
in Need of Support 400–407 400–410 400–411 400–412 400–412 400–414 400–418 400–420
Mathematics
Exceeding 417–434 421–440 424–446 426–451 428–453 431–456 434–460 438–460
Ready 413–416 416–420 418–423 420–425 422–427 425–430 428–433 432–437
Close 409–412 411–415 412–417 414–419 416–421 419–424 422–427 426–431
in Need of Support 400–408 400–410 400–411 400–413 400–415 400–418 400–421 400–425
Reading
Exceeding 419–429 422–431 425–434 426–436 429–438 430–440 431–442 434–442
Ready 415–418 417–421 420–424 421–425 423–428 424–429 425–430 428–433
Close 411–414 412–416 415–419 416–420 417–422 418–423 419–424 422–427
in Need of Support 400–410 400–411 400–414 400–415 400–416 400–417 400–418 400–421
Science
Exceeding 422–433 425–436 427–438 428–440 430–443 432–446 436–449 438–449
Ready 418–421 420–424 422–426 423–427 425–429 427–431 430–435 432–437
Close 414–417 415–419 417–421 418–422 420–424 422–426 424–429 426–431
in Need of Support 400–413 400–414 400–416 400–417 400–419 400–421 400–423 400–425
Writing
Exceeding 436–440 436–440 436–440 436–448 436–448 436–448 436–448 436–448
Ready 428–435 428–435 428–435 428–435 428–435 428–435 428–435 428–435
Close 420–427 420–427 420–427 420–427 420–427 420–427 420–427 420–427
in Need of Support 408–419 408–419 408–419 408–419 408–419 408–419 408–419 408–419
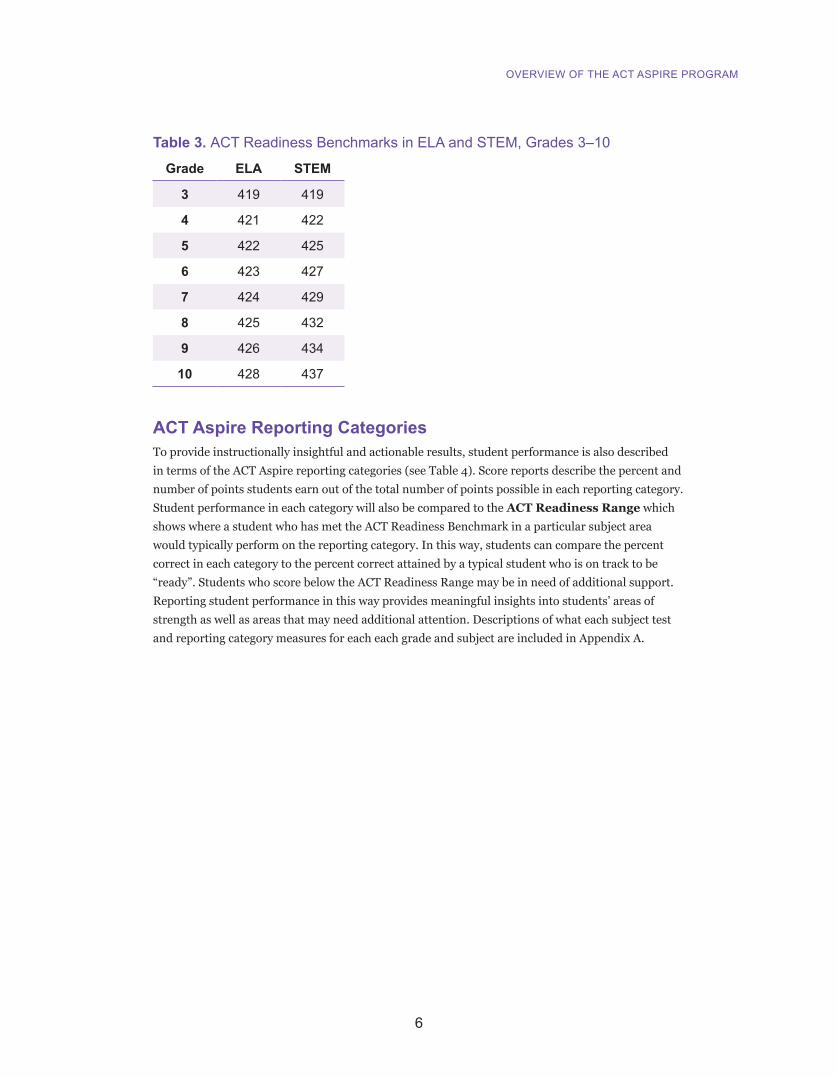
ACT Readiness Benchmark for ELA and STEM ACT Readiness Benchmarks for ELA are computed as the average of English, reading, and writing benchmarks. ACT Readiness Benchmarks for STEM are derived based on empirical data and aligned with the ACT College Readiness Benchmark on the ACT test. Table 3 lists the ACT Readiness Benchmarks for ELA and STEM across grade levels.
6
OvERviEw OF ThE ACT ASPiRE PROGRAM
Table 3. ACT Readiness Benchmarks in ELA and STEM, Grades 3–10
Grade ELA STEM
3 419 419
4 421 422
5 422 425
6 423 427
7 424 429
8 425 432
9 426 434
10 428 437
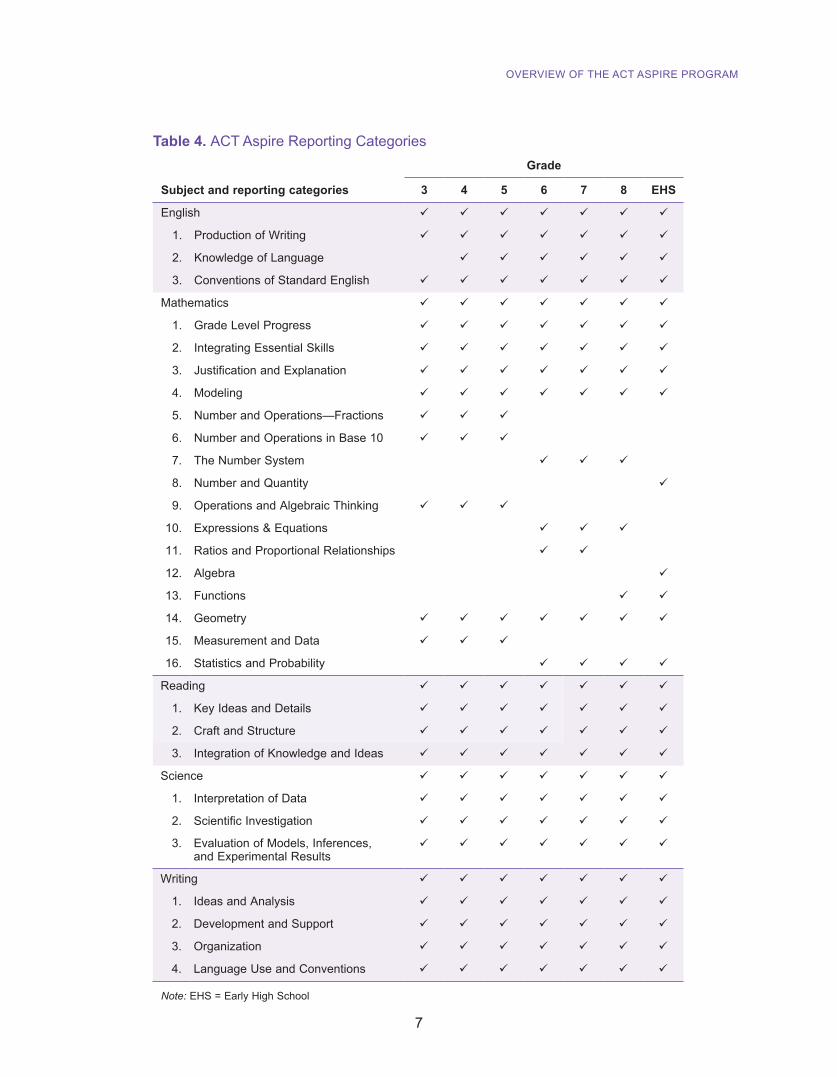
ACT Aspire Reporting CategoriesTo provide instructionally insightful and actionable results, student performance is also described in terms of the ACT Aspire reporting categories (see Table 4). Score reports describe the percent and number of points students earn out of the total number of points possible in each reporting category. Student performance in each category will also be compared to the ACT Readiness Range which shows where a student who has met the ACT Readiness Benchmark in a particular subject area would typically perform on the reporting category. In this way, students can compare the percent correct in each category to the percent correct attained by a typical student who is on track to be “ready”. Students who score below the ACT Readiness Range may be in need of additional support. Reporting student performance in this way provides meaningful insights into students’ areas of strength as well as areas that may need additional attention. Descriptions of what each subject test and reporting category measures for each each grade and subject are included in Appendix A.
7
OvERviEw OF ThE ACT ASPiRE PROGRAM
Table 4. ACT Aspire Reporting CategoriesGrade
Subject and reporting categories 3 4 5 6 7 8 EHS
English ü ü ü ü ü ü ü
1. Production of writing ü ü ü ü ü ü ü
2. Knowledge of Language ü ü ü ü ü ü
3. Conventions of Standard English ü ü ü ü ü ü ü
Mathematics ü ü ü ü ü ü ü
1. Grade Level Progress ü ü ü ü ü ü ü
2. integrating Essential Skills ü ü ü ü ü ü ü
3. Justification and Explanation ü ü ü ü ü ü ü
4. Modeling ü ü ü ü ü ü ü
5. Number and Operations—Fractions ü ü ü
6. Number and Operations in Base 10 ü ü ü
7. The Number System ü ü ü
8. Number and Quantity ü
9. Operations and Algebraic Thinking ü ü ü
10. Expressions & Equations ü ü ü
11. Ratios and Proportional Relationships ü ü
12. Algebra ü
13. Functions ü ü
14. Geometry ü ü ü ü ü ü ü
15. Measurement and Data ü ü ü
16. Statistics and Probability ü ü ü ü
Reading ü ü ü ü ü ü ü
1. Key ideas and Details ü ü ü ü ü ü ü
2. Craft and Structure ü ü ü ü ü ü ü
3. integration of Knowledge and ideas ü ü ü ü ü ü ü
Science ü ü ü ü ü ü ü
1. interpretation of Data ü ü ü ü ü ü ü
2. Scientific investigation ü ü ü ü ü ü ü
3. Evaluation of Models, inferences, and Experimental Results
ü ü ü ü ü ü ü
writing ü ü ü ü ü ü ü
1. Ideas and Analysis ü ü ü ü ü ü ü
2. Development and Support ü ü ü ü ü ü ü
3. Organization ü ü ü ü ü ü ü
4. Language Use and Conventions ü ü ü ü ü ü ü
Note: EHS = Early High School
8
OvERviEw OF ThE ACT ASPiRE PROGRAM
The ACT College and Career Readiness StandardsThe ACT College and Career Readiness Standards (ACT CCRS, currently available for grades 8 and above) are based on research evidence associated with college and career readiness. Content and measurement experts developed statements that capture what students know and are able to do with respect to relevant skills and knowledge associated with college and career readiness (as identified through research that includes the ACT National Curriculum Survey®) at specific score bands on the English, mathematics, reading, science, and writing tests on the ACT. Paired with the ACT College Readiness Benchmarks, students gain insight into what they need to know and should be able to do to succeed in college and career.
Preliminary frameworks for grades 3–7 have been developed based on decades of ACT data and research on college and career readiness. These frameworks contain the necessary knowledge and skills that indicate students are on track for readiness in English, mathematics, reading, and science in grades 3–7. Across all subjects, ACT Aspire is consistent with many states’ standards focused on college and career readiness for grades 3–7, and the assessments are designed to evolve as the impact of current and future curricular trends are empirically tied to college and career readiness.
ACT Aspire Test FormsMultiple ACT Aspire test forms are administered each year. Despite being constructed to follow the same content and statistical specifications, test forms may differ slightly in difficulty. Equating—the process of making statistical adjustments to maintain score interchangeability across test forms—is used to control for these differences so that scale scores represent the same level of achievement regardless of form.
ACT Aspire National NormsLike the ACT, ACT Aspire will report three-year rolling norms. The norm data have been statistically weighted to more closely match a national distribution in terms of selected student demographics and achievements. As data on ACT Aspire continues to accumulate, norms will continue to be updated..
The following national metrics are included in ACT Aspire Summative reporting:
• National Averages
• National Percentile Ranks
• Percentage of students who performed at or above the Ready level
9
OvERviEw OF ThE ACT ASPiRE PROGRAM
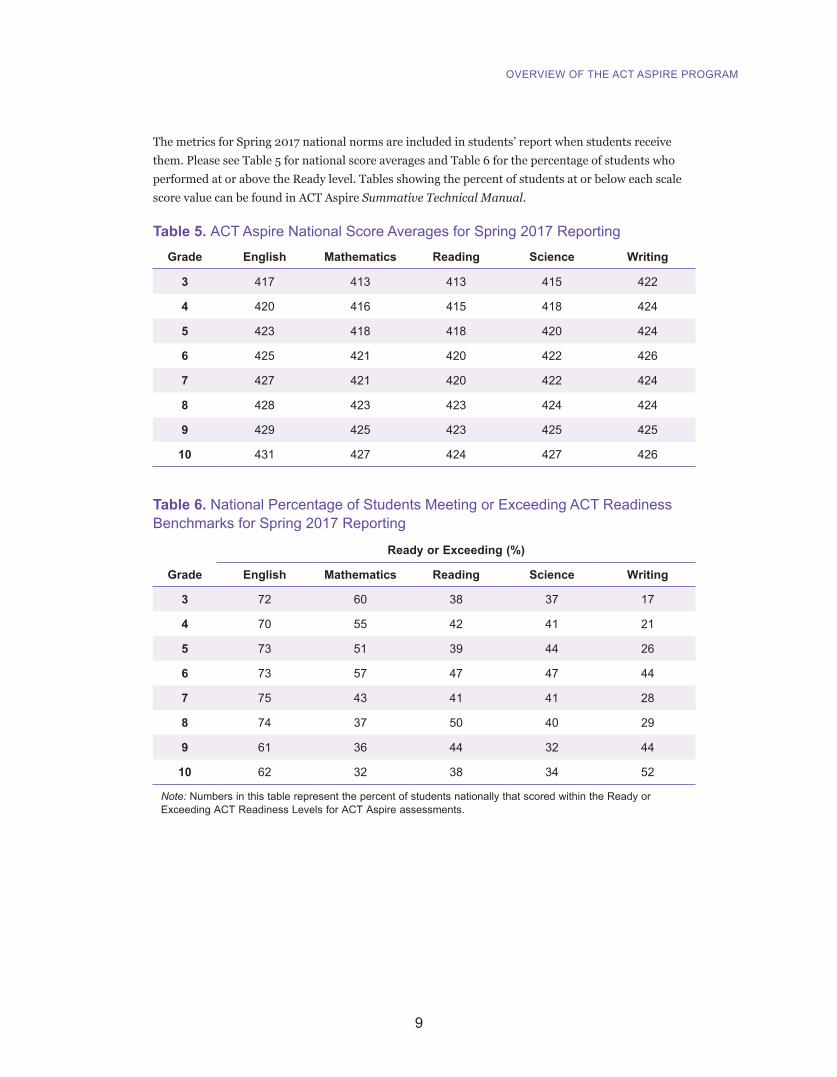
The metrics for Spring 2017 national norms are included in students’ report when students receive them. Please see Table 5 for national score averages and Table 6 for the percentage of students who performed at or above the Ready level. Tables showing the percent of students at or below each scale score value can be found in ACT Aspire Summative Technical Manual.
Table 5. ACT Aspire National Score Averages for Spring 2017 ReportingGrade English Mathematics Reading Science Writing
3 417 413 413 415 422
4 420 416 415 418 424
5 423 418 418 420 424
6 425 421 420 422 426
7 427 421 420 422 424
8 428 423 423 424 424
9 429 425 423 425 425
10 431 427 424 427 426
Table 6. National Percentage of Students Meeting or Exceeding ACT Readiness Benchmarks for Spring 2017 Reporting
Grade
Ready or Exceeding (%)
English Mathematics Reading Science Writing
3 72 60 38 37 17
4 70 55 42 41 21
5 73 51 39 44 26
6 73 57 47 47 44
7 75 43 41 41 28
8 74 37 50 40 29
9 61 36 44 32 44
10 62 32 38 34 52
Note: Numbers in this table represent the percent of students nationally that scored within the Ready or Exceeding ACT Readiness Levels for ACT Aspire assessments.
10
OvERviEw OF ThE ACT ASPiRE PROGRAM
ACT Aspire Growth ModelsA number of growth reporting features that allow educators to understand how students are performing and growing over time are available in ACT Aspire. These features provide valuable insight into students’ current and predicted achievements.
• Longitudinal reporting. ACT Aspire provides longitudinal reporting for each subject area from grade 3 through grade 10. Scores are plotted over time and viewed alongside grade-level-specific ACT Readiness Benchmarks indicating whether students are on target to meet the ACT College Readiness Benchmarks when they take the ACT test in grade 11.
• Student growth percentiles. ACT Aspire provides student growth percentiles (SGPs) that describe how a student performed compared to students with the same prior-year score history. The SGPs range from 1 to 100 and growth is categorized as low (SGP < 25), average (25 ≤ SGP ≤ 75), or high (SGP > 75). SGPs will be included in the student performance file and in educator/group reports. For students who take the ACT in grade 11 after having taken ACT Aspire in grade 10, resources for calculating SGPs are provided online at www.act.org/content/act/en/research/act-growth-modeling-resources.html. The SGPs are developed using quantile regression methods. The reference groups for calculating the SGPs include the nationally-tested population. SGPs will measure growth over one-year time intervals (e.g., spring grade 5 to spring grade 6 or fall grade 8 to fall grade 9). Like other measures of student growth, SGPs are subject to measurement error. Users should not rely solely on SGPs when assessing how much a student has learned in a subject.
• Predicted paths. Predicted score paths will be highlighted on student current progress charts, providing predicted score ranges for the next two years (or next year for writing test). It is expected that about 50% of students will score within their one-year predicted path, and about 75% will score within their two-year path. For grade 9, ACT Aspire will report predicted grade 10 ACT Aspire score ranges as well as predicted subject test and Composite score ranges for the ACT. For grade 10, ACT Aspire will report predicted subject test and Composite score ranges for the ACT. Predicted score paths can be used:
~ To determine if students are likely to meet ACT Readiness Benchmarks over the next two years (or next year for writing)
~ To identify students who are unlikely to meet a future-year standard and thus are candidates for extra academic support
~ To predict score ranges on the ACT (for grades 9 and 10)
• Aggregate growth statistics. Predicted score paths will be highlighted on aggregate current progress charts, providing a predicted mean score for the next year. The percentage of students in each SGP category (low, average, or high) is also highlighted on educator/group reports. It is also possible to calculate other summary growth measures, such as the mean or median SGP, using data in the student performance file.
11
OvERviEw OF ThE ACT ASPiRE PROGRAM
ACT Aspire Reporting Packages
Score ReportsACT Aspire offers different levels of score reports tailored to the needs of individual students, teachers, and school administrators. Each score report contains information about individual student and aggregate performance on various subject-centered skills that reflect the students’ readiness for future success.
ACT Aspire reports display information cleanly and directly, with both numerical and graphical representations supported by descriptive text. The following list summarizes the report packages that ACT Aspire provides. Instructions for how to access reports within the ACT Aspire Portal are posted to the Avocet website.
Student Report Package/ Individual Score Report (ISR)The following score reports are available for students and parents:
• Current Progress
• Skill Proficiency
• One Page ISR
Educator/Group Report PackageThe following score reports are available for educators:
• Current Progress
• Supplemental Scores
• One Page and Multi Page ISR
• Proficiency Summary
• Subject Proficiency by Student
• Skill Proficiency
• Skill Proficiency by Group
• New Class Roster
School Report PackageThe following score reports are available for schools:
• Current Progress
• Supplemental Scores
• One Page and Multi Page ISR
• Subject Proficiency by Demographic
• Subject Proficiency by Student
• Subject Proficiency by Grade Level
• Skill Proficiency by Subject
• Skill Proficiency by Demographic
District and State Report PackageThe following score reports are available for districts and states:
• Current Progress
• Supplemental Scores
• Subject Proficiency by Grade Level
• Subject Proficiency by Demographic
• Skill Proficiency by Demographic
• Subject Proficiency by School (for districts only)
• Skill Proficiency by School (for districts only)
• Subject Proficiency by District (for states only)
• Skill Proficiency by District (for states only)
Student Performance File (SPF)Files are available for download within the ACT Aspire Portal in a comma-separated text format. This service provides detailed ACT Aspire data on every student tested in your school, district, or state. The SPF layout showing the different fields and data contained in the SPF file is posted to the Avocet website.
Report DeliveryScore reports are available as downloadable PDFs or in online dynamic formats within the ACT Aspire Portal. Online dynamic reports provide the ability to select or deselect students or groups and generate new views of the results.

12
OvERviEw OF ThE ACT ASPiRE PROGRAM
Off-Grade TestingACT Aspire score reports also take into account students who may be testing “off grade” (such as a fifth grader testing at the fourth-grade level). An instance of off-grade testing will be noted on the Current Progress Report in the heading. The student’s score point will be listed above the grade in which the student tested. There will also be a heading note on the Supplemental Scores Report indicating a test was taken that did not match the student’s enrolled grade. Off-grade scores are always included on a separate ISR from on-grade scores. If, year-to-year, students consistently tested off grade, you’d see the connected longitudinal line on one current progress chart. Similarly, if students tested both on and off grade over a period of years, you’d see two different Current Progress Reports, one with on-grade and another with off-grade results.
Scores from off-grade testing are reported on the ACT Aspire scale just like any ACT Aspire score. However, when interpreting off-grade scores, one should keep in mind that the grade level indicated on a test form only contains content targeted at that grade, and the appropriateness of a test form for a student at a different grade level should be justified. In addition, the score range associated with the test at a particular grade level is linked to the ACT Aspire scale and only covers a particular range of the scale. Students who test off grade are included in aggregate scores and reports for the grade level tested. A group can be created within the ACT Aspire Portal that includes off-grade students, and these students can then be excluded from aggregate scores in the online dynamic reports.
Testing with Accommodations Students who used any accessibility features or accommodations are included in the educator/group and school, district, and state reports. As with students who tested off grade, students who tested with accommodations can be grouped together in the ACT Aspire Portal and excluded from online dynamic reports. An indication of which students tested with accommodations is included in the student performance file. A Personal Needs Profile report can also be downloaded and printed from the ACT Aspire Portal.

13
Understanding Your Student Report PackageStudent score reports are primarily intended to facilitate a conversation between a parent, student, and educator around the student’s academic achievement. Students and parents may receive the following reports:
• Current Progress
• Skill Proficiency
• One Page ISR
Student Planning GuideAlong with their score reports, each student who participates in ACT Aspire will have online access to Understanding Your ACT Aspire Results, which provides interpretive information about the test results and suggestions for improving academic skills and making plans for further education and career training.
Student InformationThe student information section shows the student’s name, grade, school district, date of birth, and student ID number. The grade listed is the grade in which the student was enrolled at the time of testing.
Current Progress ReportHow is this student progressing toward unlocking his or her potential and preparing for college and a career?
The Current Progress Report (see Figure 1) includes the student’s current and predicted subject performance, ACT Readiness Benchmarks, ACT Readiness Levels, national averages, ELA and STEM scores, Progress with Text Complexity indicator, Progress toward Career Readiness indicator, national percentile ranks and scale score ranges. The longitudinal progress graph shows the student’s three-digit score in relation to the ACT Readiness Benchmark for each subject and in relation to the four ACT Readiness Levels—Exceeding, Ready, Close, and In Need of Support.

14
UNDERSTANDiNG YOUR STUDENT REPORT PACKAGE
All measurements, including test scores, contain uncertainty. Scores under the readiness level and shown in the graph on this report indicate how well a student performed on the actual test day. The Scale Score Range in the lower right corner of the report shows the scores a student would likely obtain if he or she took the test again without additional coursework.
Figure 1. ACT Aspire Current Progress Report (Grade 3)
A predicted path for each subject is also shown. The orange cone on the Grade 3 report in Figure 1 shows a two-year projection of where scores may fall based upon expected growth rates. Sometimes the predicted path can be negatively sloped, although a test score may be high. A student’s test score is an estimate of the student’s true achievement level, and students who scored very high are more likely than others to have scored above their true achievement level. When these students test again, they tend to score closer to the average. For this same reason, it is not uncommon for students who score very low one year to score much higher the next year. The ACT Aspire predicted paths reflect
predicted path
longitudinal progress graph
page number
report title and subtitlereport type and date(s) assessed
student information
report term defi nitions scale score range
15
UNDERSTANDiNG YOUR STUDENT REPORT PACKAGE
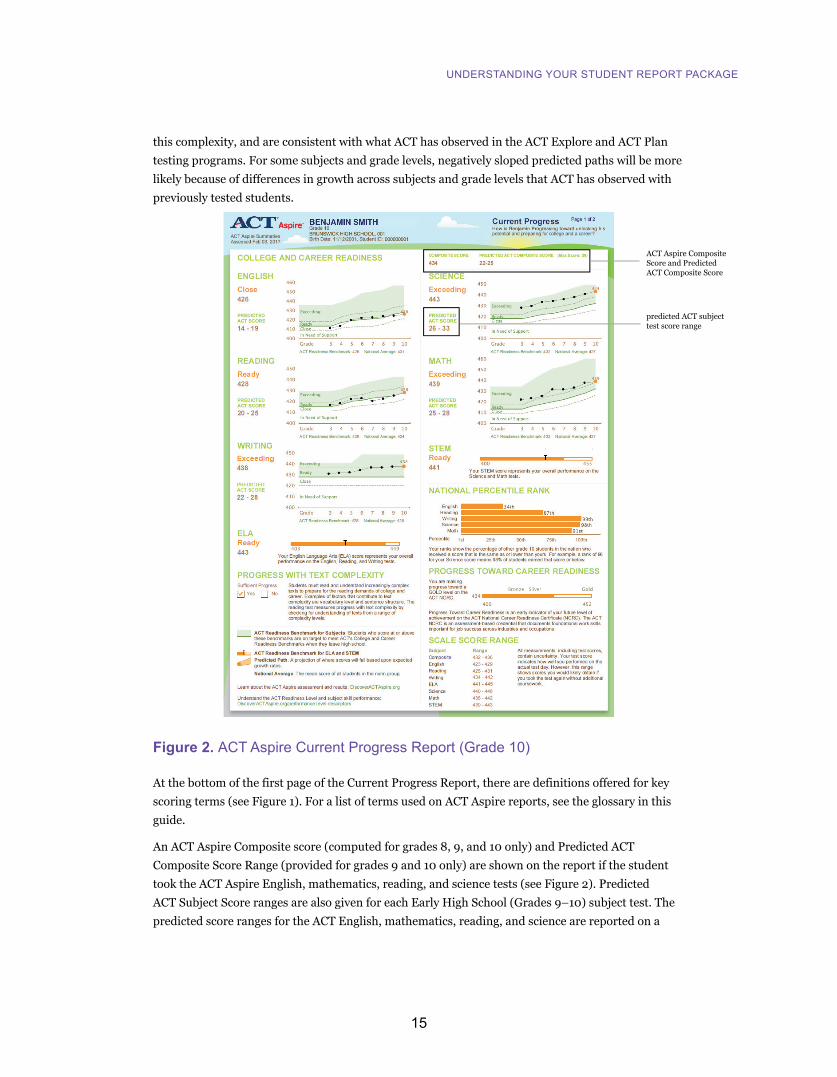
this complexity, and are consistent with what ACT has observed in the ACT Explore and ACT Plan testing programs. For some subjects and grade levels, negatively sloped predicted paths will be more likely because of differences in growth across subjects and grade levels that ACT has observed with previously tested students.
Figure 2. ACT Aspire Current Progress Report (Grade 10)
At the bottom of the first page of the Current Progress Report, there are definitions offered for key scoring terms (see Figure 1). For a list of terms used on ACT Aspire reports, see the glossary in this guide.
An ACT Aspire Composite score (computed for grades 8, 9, and 10 only) and Predicted ACT Composite Score Range (provided for grades 9 and 10 only) are shown on the report if the student took the ACT Aspire English, mathematics, reading, and science tests (see Figure 2). Predicted ACT Subject Score ranges are also given for each Early High School (Grades 9–10) subject test. The predicted score ranges for the ACT English, mathematics, reading, and science are reported on a
predicted ACT subject test score range
ACT Aspire Composite Score and Predicted ACT Composite Score

16
UNDERSTANDiNG YOUR STUDENT REPORT PACKAGE
1–36 scale, while the predicted score range for the ACT writing test is reported on a 2–12 scale.
ACT Aspire also reports the student’s national percentile ranks, ELA score, Progress with Text Complexity indicator, STEM score, and Progress toward Career Readiness indicator. These additional measures of student performance are only available if specific subjects and grade level tests are assessed. See Table 7 for the subject and grade requirements for each of the supplemental scores.
Table 7. Summary of Student Reporting FeaturesSubject test
Feature
English, Mathematics,
Reading, Science, Writing
English, Mathematics,
Reading, Science
English, Reading, Writing,
Mathematics
Mathematics and
Science
Mathematics and
Reading
Any 1 of the 5 subjects
Subject scores ü ü ü ü ü ü
Percentage of Points Awarded in Subject Skills
ü ü ü ü ü ü
improvement Ideas ü ü ü ü ü ü
Composite scorea ü ü
National Percentile Rank
ü ü ü ü ü ü
Progress with Text Complexity
üb üb üb üb üb
ELA score ü ü
STEM score ü ü ü
Progress toward Career Readiness indicatora
ü ü
Predicted Pathc ü ü ü ü ü ü
Predicted ACT Subject Score Ranged
ü ü ü ü ü ü
Predicted ACT Composite Score Ranged
ü ü
a Grades 8–10 onlyb Reading onlyc Grades 3–8 writing: one-year prediction; Grade 3–8 subjects other than writing: two-year prediction; grade 9: one-year predictiond Early high School (Grades 9–10) only

17
UNDERSTANDiNG YOUR STUDENT REPORT PACKAGE
• National Percentile Rank. Student national percentile ranks are given for each subject tested. A national percentile rank shows the percentage of other students in the nation who received a score equal to or lower than the student’s displayed score for the grade and subject tested. For example, a student scoring in the 93rd percentile implies that 93% of students included in the norm group scored at or below this student’s score. Percentile ranks have a maximum value of 100, with higher values indicating better performance. When interpreting percentile ranks, keep in mind the norm group against which the student is being compared.
• English Language Arts (ELA). For students who take the English, reading, and writing assessments, an ELA score is calculated by taking the average of the three scale scores achieved in those subjects. The ELA score represents the overall performance on these assessments relative to the ACT Readiness Range. A student score that falls below the range is indicated as “Below Readiness.” A student score that falls within the ACT Readiness Range is indicated as “Ready.”
• Progress with Text Complexity. A Progress with Text Complexity indicator is shown for students who take the reading test. This is an indication of how well students are able to demonstrate understanding of the central meanings and purposes of increasingly complex texts. Questions that contribute to the score require connecting information across a whole text, or substantial sections of text, to demonstrate an understanding of key information—a skill sometimes referred to as “global comprehension.” Such questions include:
~ What is the main idea?
~ For what purpose did the author write this text?
~ What caused the main character’s actions?
~ How is the information structured in this text? (e.g., chronologically, by concept)
Student performance on the Progress with Text Complexity measure is compared to a readiness range empirically derived from the performance of students who meet the ACT Readiness Benchmarks in Reading. Students who perform within the readiness range will receive an indication that they are making sufficient progress toward reading the complex texts they will encounter in college and career. Students who perform below the readiness range receive recommendations for improvement, or “insights,” such as to practice reading increasingly complex texts from a variety of genres, checking for understanding, and using problem-solving strategies with challenging texts. Students who perform better on the overall reading test than they do on the Progress with Text Complexity measure have demonstrated relative strengths in analyzing words and sentences as well as evaluating particular techniques used by authors. They have demonstrated lower ability with tasks that require an understanding of the overall meaning, or the big picture, expressed in a text. Students fitting this profile might benefit from practicing skills that help build accurate mental representations of whole texts, such as pausing to reflect on key ideas during reading and summarizing afterward.
• Science, Technology, Engineering, and Mathematics (STEM). For students who take the science and mathematics assessments, a STEM score is calculated by taking the average of the two scale scores achieved in those subjects. The STEM score represents the overall performance in these subjects relative to the ACT Readiness Range, which is aligned to the ACT College Readiness Benchmark on the ACT test. A student score that falls below the range is indicated as “Below Readiness.” A student score that falls within the ACT Readiness Range is indicated as “Ready.”

18
UNDERSTANDiNG YOUR STUDENT REPORT PACKAGE
• Progress toward Career Readiness. Students who receive scale scores on English, mathematics, reading, and science tests taken in grades 8, 9, or 10 are given a Progress toward Career Readiness indicator. The Progress toward Career Readiness indicator links the student’s ACT Aspire Composite score (given on the report) with predicted performance toward an ACT NCRC. The report indicates visually whether a student is making progress toward a Bronze, Silver, or Gold level ACT NCRC. If the student is not making progress toward any of these levels, the report indicates that improvement is needed. Because the measure is linked to the ACT Aspire Composite score, the best way to improve is to work on the lowest performing subjects and thereby increase the Composite score.
Skill Proficiency ReportReporting category performance is given as the number of points earned out of the total points possible and as the percentage of points earned. Reporting category performance is illustrated in terms of falling within or below the ACT Readiness Range. The ACT Readiness Range shows where a student who has met the ACT Readiness Benchmark on this assessment would typically perform in the reporting category.
For the reporting category in which the student scored lowest, a simple improvement idea is given. If the student scored within the ACT Readiness Range for their lowest performing skill, an enrichment idea is given for that skill.
Invalid or Non-Scorable ResultsIf a room supervisor observes a student engaging in any prohibited behaviors during testing, the student’s test must be invalidated. When a test is invalidated, the score for that test will not be reported on the student’s Current Progress Report. Instead, for each subject test that was invalidated, a message will be displayed indicating that a score was not earned. See Figure 3 for an example of this message. A list of prohibited behaviors that may prompt invalidation can be found in the ACT Aspire Test Coordinator Manual. Instructions for invalidating a test may be found in the ACT Aspire Portal User’s Guide.
Because of the open-ended nature of the writing test, there are circumstances under which a student’s test may not be scorable. If the student response is in a language other than English, off-topic, illegible, or blank, a message will appear on the Current Progress Report indicating that the writing test was non-scorable. Examples of these messages can be seen in Figure 3.
A score was not earned on the following subject tests:• English: Invalid• Mathematics: Invalid• Writing: Blank
Please contact your school if you have questions..
Figure 3. Student report notifications of invalid/non-scorable results

19
UNDERSTANDiNG YOUR STUDENT REPORT PACKAGE
Figure 4. ACT Aspire Skill Profi ciency Report
skill performance
improvement ideas

20
UNDERSTANDiNG YOUR STUDENT REPORT PACKAGE
One Page ISRThe One Page ISR on Figure 5 provides students, parents, and educators with a summary of student performance in a simplified format that lends itself to “at-a-glance”-level interpretation and easy printing. The One Page ISR includes scale scores of subject tests, readiness level, national percentile rank, and predicted ACT score (for 9th and 10th grade students). An English Language Arts score, STEM score, Progress with Text Complexity indicator, and Progress Toward Career Readiness indicator (for grades 8–10) is also included.
Figure 5. One Page iSR

21
Understanding Educator/Group ReportsThese reports are available to classroom educators:
• One Page ISR and Multi Page ISR
• Subject Proficiency by Student
• Current Progress
• Supplemental Scores
• Proficiency Summary
• Skill Proficiency
• Skill Proficiency by Group
• New Class Roster
Subject Proficiency by Student ReportHow can students be grouped by subject to inform teaching?
The Subject Proficiency by Student Report provides educators with a summary view of their classroom’s performance in all assessed subjects, helps them understand each student’s overall performance versus ACT Readiness Benchmarks, and identifies which students are struggling (falling below the benchmark in the Close or In Need of Support readiness levels) in multiple subjects as well as those who are excelling (meeting or exceeding the benchmark in the Ready or Exceeding levels) in multiple subjects.
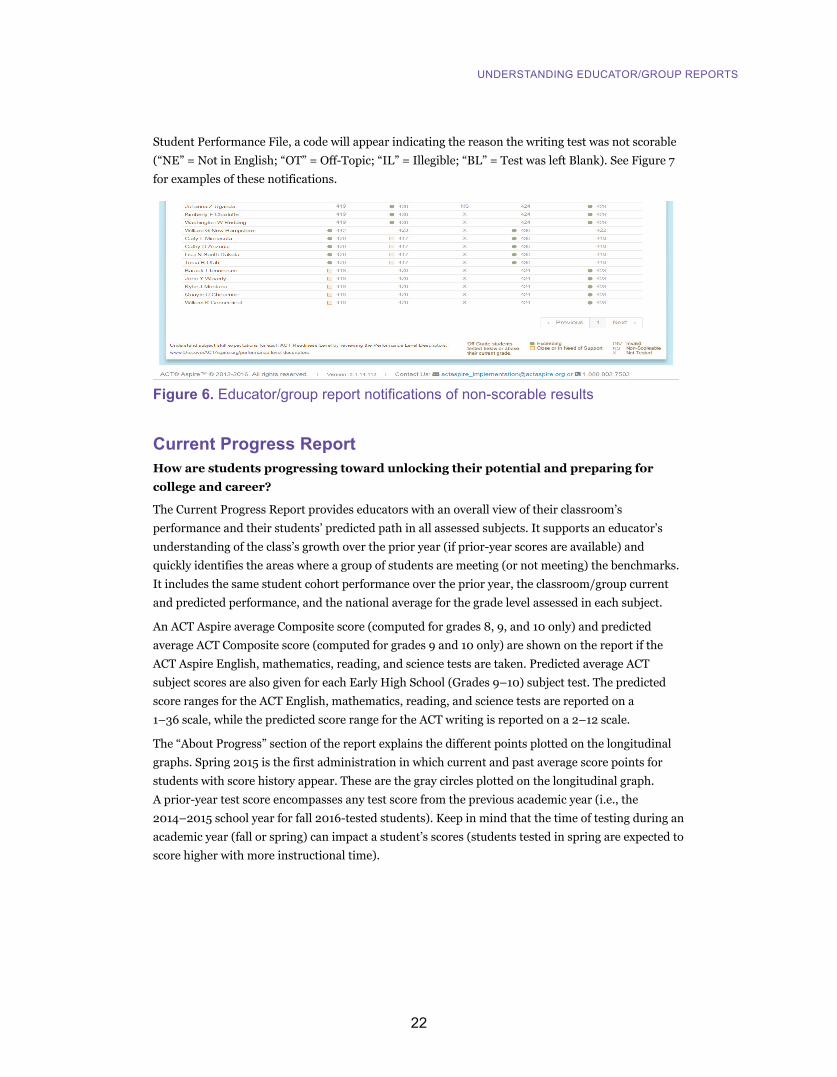
If a room supervisor observes a student engaging in any prohibited behaviors during testing, the student’s test must be invalidated. When a test is invalidated, the score for that test will not be reported for that student on the Subject Proficiency by Student Report or in the Student Performance File. Instead, for each subject test that was invalidated, “INV” will be displayed, indicating that a score was not earned. An “X” will appear on the report for students for whom a subject test was not administered. For the writing test, there are circumstances under which a student’s test may not be scorable. If the student response is in a language other than English, off-topic, illegible, or blank, a message will appear on the Current Progress Report indicating that the writing test was non-scorable, and “NS” will appear on the report for that student. In the
22
UNDERSTANDiNG EDUCATOR/GROUP REPORTS
Student Performance File, a code will appear indicating the reason the writing test was not scorable (“NE” = Not in English; “OT” = Off-Topic; “IL” = Illegible; “BL” = Test was left Blank). See Figure 7 for examples of these notifications.
Figure 6. Educator/group report notifi cations of non-scorable results
Current Progress ReportHow are students progressing toward unlocking their potential and preparing for college and career?
The Current Progress Report provides educators with an overall view of their classroom’s performance and their students’ predicted path in all assessed subjects. It supports an educator’s understanding of the class’s growth over the prior year (if prior-year scores are available) and quickly identifies the areas where a group of students are meeting (or not meeting) the benchmarks. It includes the same student cohort performance over the prior year, the classroom/group current and predicted performance, and the national average for the grade level assessed in each subject.
An ACT Aspire average Composite score (computed for grades 8, 9, and 10 only) and predicted average ACT Composite score (computed for grades 9 and 10 only) are shown on the report if the ACT Aspire English, mathematics, reading, and science tests are taken. Predicted average ACT subject scores are also given for each Early High School (Grades 9–10) subject test. The predicted score ranges for the ACT English, mathematics, reading, and science tests are reported on a 1–36 scale, while the predicted score range for the ACT writing is reported on a 2–12 scale.
The “About Progress” section of the report explains the different points plotted on the longitudinal graphs. Spring 2015 is the first administration in which current and past average score points for students with score history appear. These are the gray circles plotted on the longitudinal graph. A prior-year test score encompasses any test score from the previous academic year (i.e., the 2014–2015 school year for fall 2016-tested students). Keep in mind that the time of testing during an academic year (fall or spring) can impact a student’s scores (students tested in spring are expected to score higher with more instructional time).

23
UNDERSTANDiNG EDUCATOR/GROUP REPORTS
Supplemental Scores ReportHow can additional performance measures inform decisions?
The Supplemental Scores Report aggregates the classroom/group additional measures of performance, including National Percentile Ranks, ELA, STEM, Progress with Text Complexity, and Progress toward Career Readiness. These additional measures of student performance are only available if specific subjects and grade level tests are assessed. See Table 7 for the subject and grade requirements for each of the supplemental scores.
• National Percentile Rank. Median of student national percentile ranks are given for each subject tested. This is to compare the median group performance to the performance of all students included in the national norm group. The numbered ranks show the percentage of students in the nation who received a score equal to or lower than the group’s median score for the grade and subject tested.
• English Language Arts (ELA). A classroom/group average ELA score is calculated by taking the average of all individual student ELA scores (English, reading, and writing assessments must be tested in order to receive an ELA score). The ACT Readiness Range Distribution chart represents the overall performance on ELA in terms relative to the ACT Readiness Range. The percentage and n-count of students that scored in the ACT Readiness Range are shown first, followed by the percentage and n-count of students that scored below the range.
• Progress with Text Complexity. A Progress with Text Complexity indicator is shown if the reading test was administered. Student performance on the Progress with Text Complexity measure is compared to a readiness range empirically derived from the ACT Readiness Benchmarks in reading. Performance is categorized as either making “sufficient progress” or “insufficient progress.” The educator/group report shows the percentage and number of students who made sufficient progress with text complexity and the percentage and number of students who made insufficient progress.
• Science, Technology, Engineering, and Mathematics (STEM). A classroom/group average STEM score is calculated by taking the average of all individual student STEM scores (mathematics and science must be tested in order to receive a STEM score). The ACT Readiness Range Distribution chart represents the overall performance on STEM in terms relative to the ACT Readiness Range. The percentage and n-count of students who scored in the ACT Readiness Range are shown first, followed by the percentage and n-count of students who scored below the range. Reports for grades 9 and 10 include additional ideas for how to help students prepare for STEM college coursework and careers.
• Progress toward Career Readiness. Students who receive scale scores on English, mathematics, reading, and science tests taken in grades 8, 9, or 10 are given a Progress toward Career Readiness indicator. The Progress toward Career Readiness indicator links the student’s ACT Aspire Composite score with predicted performance toward an ACT NCRC. The educator/group report shows the group’s average Composite score and score range. It also categorizes the percentage and number of students who are making progress toward a Bronze, Silver, or Gold level ACT NCRC and students who are not making progress toward any of these levels (indicated as “none”).

24
UNDERSTANDiNG EDUCATOR/GROUP REPORTS
Profi ciency Summary ReportHow can students be grouped by subject proficiency and growth to inform teaching?
This report details a classroom’s performance in a given subject. It supports an educator’s ability to quickly understand the overall performance of the class and each individual student’s performance and growth rate. It also aggregates the classroom/group performance in assessed skill areas for that subject.
Readiness DistributionThe readiness distribution graph (see Figure 7) is a stacked bar graph that shows the number and percentage of students whose scores fell into each of the ACT Readiness Levels: Exceeding, Ready, Close, and In Need of Support. The total number of students assessed is identified at the bottom of the graph. This is the number of students who received valid scale scores for the subject. This total may not reflect the total number of students in the particular class if, for example, some students were absent on test day or if student scores were invalidated due to testing irregularities. The report displays a maximum of 30 students.
Figure 7. Profi ciency Summary Report section of the educator/group reports
Proficiency SummaryThe proficiency summary (see Figure 7) shows student images and names placed along a score “pathway.” The pathway shows a maximum of thirty students. The pathway visualizes the four ACT Readiness Levels and the ACT Readiness Benchmark for the grade and subject. Individual student
Readiness Distribution Graph
Subject Profi ciency Pathway
Growth Distribution Graph
Skills Distribution Chart

25
UNDERSTANDiNG EDUCATOR/GROUP REPORTS
icons are placed on the pathway according to the scale score each student achieved. Scale scores are depicted on the white signs each icon holds in its hands. Below the scale score number shown on the white sign is a short light gray arrow, a slightly longer dark gray arrow, or a long black arrow. These arrows correspond with the arrows shown in the growth distribution graph in the upper right corner of the report. Light gray indicates the student is achieving low growth, dark gray indicates average growth, and black indicates high growth. Growth data is only shown if students have prior-year ACT Aspire scores available.
The student proficiency pathway shows educators where their students are in relation to subject performance and growth. For example, a student whose icon is depicted slightly below the benchmark with a high-growth indicator may not be of as much concern as a student whose icon is slightly above the benchmark with a low-growth indicator.
Growth Distribution The growth distribution graph (see Figure 7) shows how the classroom distribution looks in terms of student growth percentiles and subject scale scores. The x-axis plots SGPs on the range 1–100. (See the section “ACT Aspire Growth Models” for more information on the meaning and calculation of student growth percentiles.) The SGPs are categorized into low, average, and high ranges, and the percentage of students that fell into each of these categories is given at the top of the graph. If a student does not have prior-year scale score data available, an SGP cannot be calculated, and the student data will not be plotted on the graph. A note that indicates the number of students without growth history data is given below the distribution graph. The y-axis plots student scale scores. It ranges from the lowest achievable scale score to the highest achievable scale score for the tested grade. The student scale scores are further broken out into the ACT Readiness Levels.
Skills DistributionThe skills distribution chart (see Figure 7) summarizes classroom performance in each reporting category assessed for the subject. The percentage and student n-count that fell within and below the ACT Readiness Range are depicted for each skill.
Skill Proficiency ReportHow can students be grouped by skill proficiency to inform teaching?
The Skill Proficiency Report assists educators in quickly identifying students in need of extra support in a particular subject as well as students who might benefit from additional rigor. It also pinpoints skill areas where curriculum adjustments or professional development might be needed. The report includes students’ scale score performance, categorizes students into the ACT Readiness Levels, and highlights students who are falling below the ACT Readiness Range in particular reporting categories. It identifies the reporting category most in need of improvement and includes a detailed description of what the test measures in that category. It also identifies, for those students who took ACT Aspire the previous year, a level of growth (low, average, or high).
Skill Proficiency by Group ReportHow can decisions be informed based upon groups’ skill proficiencies?
The Skill Proficiency by Group Report summarizes students’ performances by group in reporting categories for each specific subject. This report indicates the group where fewer than 50% of students scored within the Readiness Range for each reporting category. The left of the report

26
UNDERSTANDiNG EDUCATOR/GROUP REPORTS
provides the percentages of students in each Readiness Level by group with comparison to national and school percentages.
New Class RosterHow can teachers prepare to meet the needs of his/her incoming students?
The New Class Roster provides classroom teachers with subject test scores and ACT Readiness Level information on each student who will be entering his/her class in the upcoming school year. This Roster summarizes ACT Aspire Summative test data from the prior year’s testing. The Roster provides teachers with insights into each incoming student’s current level of skill and knowledge to inform instruction and meet the needs of individual students.
27
Understanding ACT Aspire School ReportsThese reports are available to individuals with an ACT Aspire administrator or test coordinator role.
• Current Progress
• Supplemental Scores
• Subject Proficiency by Grade Level
• Subject Proficiency by Student
• Subject Proficiency by Demographic
• Skill Proficiency by Subject
• Skill Proficiency by Demographic
Current Progress ReportHow are students progressing toward unlocking their potential and preparing for college and a career?The Current Progress Report provides an overall view of school performance and students’ predicted path in all assessed subjects. It supports the ability to understand the school’s growth over the prior year (if prior-year scores are available) and to identify areas where a group of students are meeting (or not meeting) the benchmarks. It includes the same student cohort performance over the prior year, the school’s current and predicted performance, and the national average for the grade level assessed in each subject.
An ACT Aspire average Composite score (computed for grades 8, 9, and 10 only) and predicted average ACT Composite score (computed for grades 9 and 10 only) are shown on the report if the ACT Aspire English, mathematics, reading, and science tests are taken. Predicted average ACT subject scores are also given for each Early High School (Grades 9–10) subject test. The predicted score ranges for the ACT English, mathematics, reading, and science tests are reported on a 1–36 scale, while the predicted score range for the ACT writing is reported on a 2–12 scale.
The “About Progress” section of the report explains the different points plotted on the longitudinal graphs. Spring 2015 is the first administration in which current and past average score points for students with score history appear. These are the gray circles plotted on the longitudinal graph. A prior-year test score encompasses any test score from the previous academic year (i.e., the 2014–2015 school year for spring 2016-tested students). Keep in mind that the time of testing during an academic year (fall or spring) can impact a student’s scores (students tested in spring should score higher with more instructional time).
28
UNDERSTANDiNG ACT ASPiRE SChOOL REPORTS
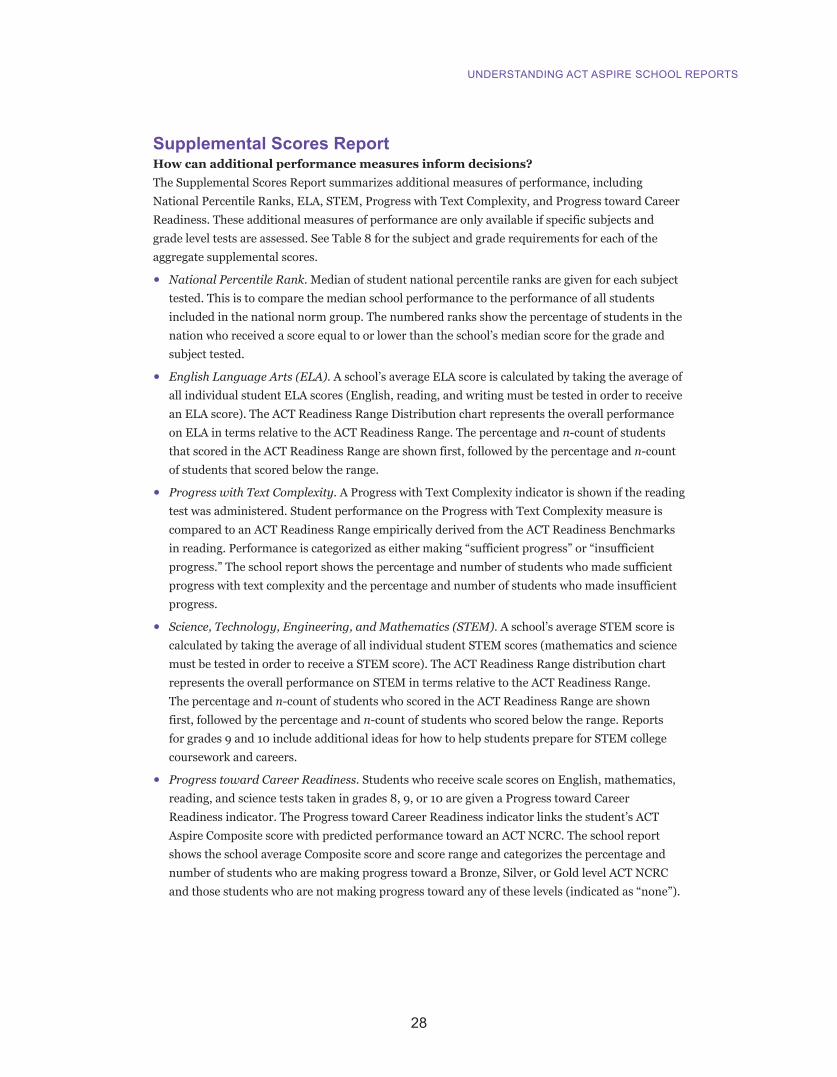
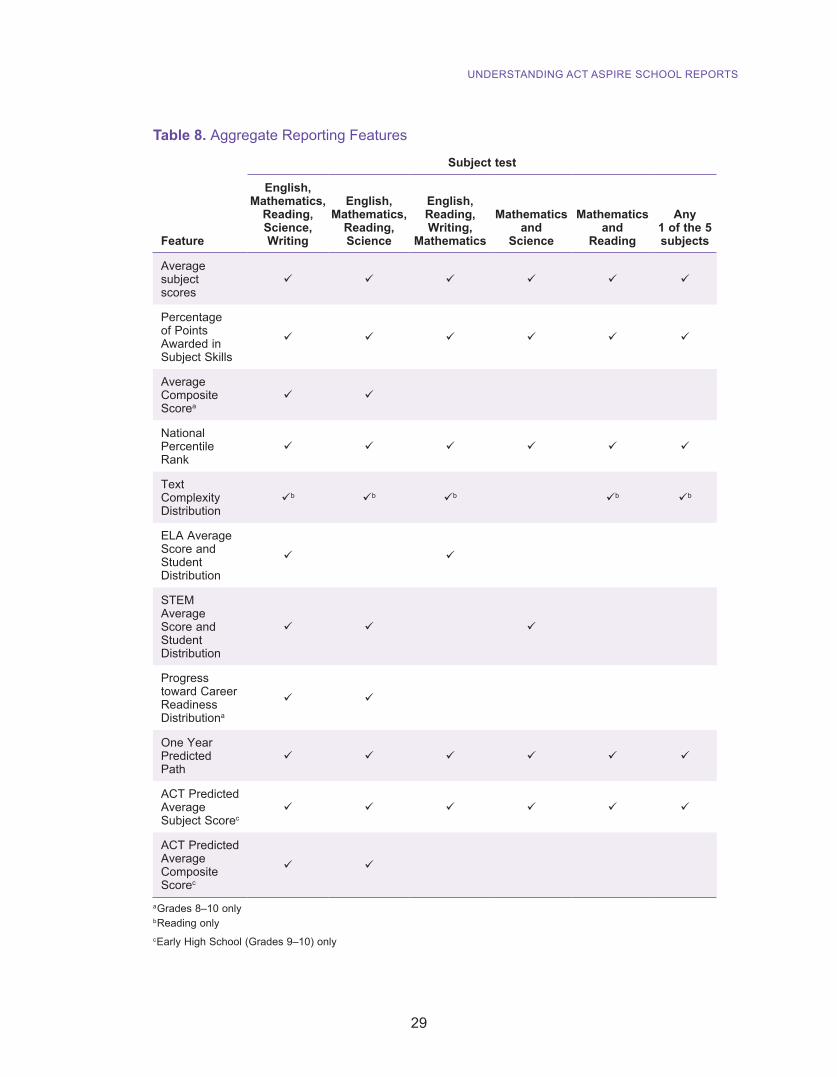
Supplemental Scores ReportHow can additional performance measures inform decisions?The Supplemental Scores Report summarizes additional measures of performance, including National Percentile Ranks, ELA, STEM, Progress with Text Complexity, and Progress toward Career Readiness. These additional measures of performance are only available if specific subjects and grade level tests are assessed. See Table 8 for the subject and grade requirements for each of the aggregate supplemental scores.
• National Percentile Rank. Median of student national percentile ranks are given for each subject tested. This is to compare the median school performance to the performance of all students included in the national norm group. The numbered ranks show the percentage of students in the nation who received a score equal to or lower than the school’s median score for the grade and subject tested.
• English Language Arts (ELA). A school’s average ELA score is calculated by taking the average of all individual student ELA scores (English, reading, and writing must be tested in order to receive an ELA score). The ACT Readiness Range Distribution chart represents the overall performance on ELA in terms relative to the ACT Readiness Range. The percentage and n-count of students that scored in the ACT Readiness Range are shown first, followed by the percentage and n-count of students that scored below the range.
• Progress with Text Complexity. A Progress with Text Complexity indicator is shown if the reading test was administered. Student performance on the Progress with Text Complexity measure is compared to an ACT Readiness Range empirically derived from the ACT Readiness Benchmarks in reading. Performance is categorized as either making “sufficient progress” or “insufficient progress.” The school report shows the percentage and number of students who made sufficient progress with text complexity and the percentage and number of students who made insufficient progress.
• Science, Technology, Engineering, and Mathematics (STEM). A school’s average STEM score is calculated by taking the average of all individual student STEM scores (mathematics and science must be tested in order to receive a STEM score). The ACT Readiness Range distribution chart represents the overall performance on STEM in terms relative to the ACT Readiness Range. The percentage and n-count of students who scored in the ACT Readiness Range are shown first, followed by the percentage and n-count of students who scored below the range. Reports for grades 9 and 10 include additional ideas for how to help students prepare for STEM college coursework and careers.
• Progress toward Career Readiness. Students who receive scale scores on English, mathematics, reading, and science tests taken in grades 8, 9, or 10 are given a Progress toward Career Readiness indicator. The Progress toward Career Readiness indicator links the student’s ACT Aspire Composite score with predicted performance toward an ACT NCRC. The school report shows the school average Composite score and score range and categorizes the percentage and number of students who are making progress toward a Bronze, Silver, or Gold level ACT NCRC and those students who are not making progress toward any of these levels (indicated as “none”).
29
UNDERSTANDiNG ACT ASPiRE SChOOL REPORTS
Table 8. Aggregate Reporting Features
Subject test
Feature
English, Mathematics,
Reading, Science, Writing
English, Mathematics,
Reading, Science
English, Reading, Writing,
Mathematics
Mathematics and
Science
Mathematics and
Reading
Any 1 of the 5 subjects
Average subject scores
ü ü ü ü ü ü
Percentage of Points Awarded in Subject Skills
ü ü ü ü ü ü
Average Composite Scorea
ü ü
National Percentile Rank
ü ü ü ü ü ü
Text Complexity Distribution
üb üb üb üb üb
ELA Average Score and Student Distribution
ü ü
STEM Average Score and Student Distribution
ü ü ü
Progress toward Career Readiness Distributiona
ü ü
One Year Predicted Path
ü ü ü ü ü ü
ACT Predicted Average Subject Scorec
ü ü ü ü ü ü
ACT Predicted Average Composite Scorec
ü ü
a Grades 8–10 onlyb Reading onlyc Early high School (Grades 9–10) only
30
UNDERSTANDiNG ACT ASPiRE SChOOL REPORTS
Subject Proficiency by Grade Level ReportHow can decisions be informed based upon grade level subject proficiency?
The Subject Proficiency by Grade Level Report summarizes the school’s performance in all assessed grade levels and subjects. It supports the ability to quickly grasp how each grade level is performing relative to the ACT Readiness Benchmarks, the ACT Readiness Levels, and the national norm. It also provides the total number of students and percentages of students that fell into each readiness level: Exceeding, Ready, Close, and In Need of Support. The percentage of students nationally who performed in the Ready or Exceeding levels is also graphically represented.
Subject Proficiency by Student ReportHow can students be group by subject to inform teaching?
The Subject Proficiency by Student Report indicates the number of students in the school who are at the “Exceeding or Ready” level and the “Close or In Need of Support” level. It also provides a roster of students indicating the test score for each subject.
Subject Proficiency by Demographic ReportHow can decisions be informed based upon demographics’ subject proficiencies?
The Subject Proficiency by Demographic Report summarizes students’ performance by demographic group in all assessed subjects. It supports the ability to quickly grasp how each demographic group is performing relative to the ACT Readiness Benchmarks, the ACT Readiness Levels, and the national norm. It also provides the number of students who fell into each readiness level: Exceeding, Ready, Close, and In Need of Support. The percentage of students at the school who performed in the Ready or Exceeding levels is also graphically represented.
Skill Proficiency by Subject ReportHow can students be grouped by skill proficiency to inform learning?
The Skill Proficiency by Subject Report provides a roster of students (organized by readiness level) along with their subject score. The report also indicates whether or not each student is in or below the ACT Readiness Range in each reporting category for that subject. A level of growth (high, average, or low) is also indicated for those students who have taken ACT Aspire in consecutive years.
Skill Proficiency by Demographic ReportHow can students be grouped by demographic to inform learning?
The Skill Proficiency by Demographic Report is organized by demographics and indicates whether or not each demographic is in or below the ACT Readiness Range in each reporting category for that subject.
31
Understanding ACT Aspire District and State Report PackagesMore reports are available to individuals with an ACT Aspire administrator or test coordinator role at the district and state level:
• Subject Proficiency by Grade Level
• Current Progress
• Supplemental Scores
• Subject Proficiency by Demographic
• Skill Proficiency by Demographic
• Skill Proficiency by School (for districts only)
• Skill Proficiency by District (for states only)
• Subject Proficiency by School (for districts only)
• Subject Proficiency by District (for states only)
See “Understanding Your ACT Aspire School Report Package” for information about the individual reports. District and state reports include the same reports as the school reports (with different aggregate data), with the exception of the last reports in each package: Subject Proficiency by School Report, Skill Proficiency by School Report, Subject Proficiency by District Report, and Skill Proficiency by School Report. Instead of reporting at the skill or the reporting category level, as is done in the school reports, only subject-level data is reported for districts and states. This allows for a more manageable number of report pages, the identification of exceptional or problematic areas of interest, and the option to drill down for more information in other reports (like the school report).

32
GlossaryACT Readiness Benchmark. A score value which, when met or exceeded, indicates a student is on target for college and career readiness when they take the ACT test in grade 11.
ACT Readiness Level. These levels are defined as Exceeding, Ready, Close, and In Need of Support. Each level corresponds to a score range that varies by subject and grade and indicates the level of performance students achieved on a particular assessment.
ACT Readiness Range. A score range provided for each reporting category to show where a student who has met the ACT Readiness Benchmark in the corresponding subject would typically perform in that reporting category.
Composite Score. ACT Aspire Composite Score—the average of the English, mathematics, reading, and science test scores.
Cumulative Percent (CP). A number used to describe the standing of an individual relative to a defined group. If an examinee with a score of 420 has a CP of 73, it means that 73% of the examinees in the norm group received a score of 420 or lower, or that the student scored the same as or better than 73% of the students in the defined group.
Insights. Additional information and improvement ideas.
Mean (Average). The arithmetic sum of a set of scores divided by the total number of scores.
Median. The middle score value of a range of values.
National Average. The mean score of all students in the norm group.
Percent. The number of students who gave a certain response, or who obtained a certain scale score, divided by the total number of students and multiplied by 100.
Predicted Path. A projection of where scores will fall based upon expected growth rates.
Scale Score. Scores equated across test forms to adjust for differences in test difficulty and to ensure comparability of scores across different ACT Aspire test forms. An examinee’s raw score is obtained by summing over the scores the examinees earned on each item. The raw score is then converted to a scale score.
Text Complexity. How challenging the reading material is at a specific grade level.

33
Appendix A: Subject Assessments and Reporting CategoriesReadingACT Aspire reading assessments determine whether students can understand what increasingly challenging texts say explicitly and what can reasonably be inferred from these texts, understand general academic and domain-specific language in the context in which it is used, and integrate knowledge and ideas from multiple texts.
Reporting CategoriesKey Ideas and Details. The questions and tasks in this skill category assess students’ ability to read texts closely; to determine central ideas and themes and summarize information and ideas accurately; and to understand sequential, comparative, and cause-effect relationships.
Craft and Structure. The questions and tasks in this skill category assess students’ ability to determine word and phrase meanings and analyze an author’s word choice rhetorically as well as influences on the English language, to analyze text structure, and to understand purpose and point of view in texts.
Integration of Knowledge and Ideas. The questions and tasks in this skill category assess students’ ability to understand how arguments are constructed, to make connections to prior knowledge, and to make connections between and among texts.
EnglishACT Aspire English assessments evaluate students’ ability to revise and edit texts; to understand the rhetorical purpose and focus of a piece of writing in order to develop a topic effectively; to use strategies for logical organization, topical unity, and general cohesion; and to employ knowledge of language to ensure that writing is precise, concise, and stylistically consistent.
Reporting CategoriesProduction of Writing. The questions and tasks in this skill category assess students’ ability to understand the rhetorical purpose and focus of a piece of writing in order to develop a topic

34
APPENDix A: SUBJECT ASSESSMENTS AND REPORTiNG CATEGORiES
effectively; to use strategies to achieve logical organization, topical unity, and general cohesion; and to ensure that writing is precise, concise, and stylistically consistent.
Knowledge of Language. The questions and tasks in this skill category assess students’ ability to demonstrate effective language use through ensuring precision and concision in word choice and maintaining consistency in style and tone.
Conventions of Standard English. The questions and tasks in this skill category assess students’ understanding of the conventions of standard English grammar, usage, and mechanics to revise and edit text.
WritingACT Aspire writing assessments are designed to provide a strong indication of whether students have the writing skills they will need to succeed as they begin work at their next grade level. Student responses are evaluated according to analytic rubrics that assess the generation, development, organization, and communication of ideas in standard written English.
Reporting CategoriesIdeas and Analysis. This skill category assesses students’ ability to generate ideas in response to a given writing task. The ideas are assessed based on the extent to which they lead to critical and complex argument, analysis, or reflection.
Development and Support. This skill category assesses students’ ability to explore and explain their ideas. Skillful writers provide persuasive support for their claims, illustrate their ideas with well-chosen examples, or convey meaning through effective narration.
Organization. This skill category assesses students’ ability to shape their ideas into a cohesive body of writing. Through effective organization, a writer builds a logical argument, provides a clearly sequenced explanation, or relays a coherent narrative.
Language Use and Conventions. This skill category assesses students’ ability to communicate ideas in standard written English. Strong writers demonstrate command-of-language conventions and make purposeful stylistic choices to clarify and guide the reader’s understanding.
ScienceACT Aspire science assessments assess students’ science practices using real-world scientific scenarios. Scenarios in upper-grade assessments include student investigations, formal scientific research, formal scientific data from references, and students or scientists providing competing explanations for real scientific phenomena. At the earlier grades, topics generally focus on everyday student discovery rather than formal science.
Reporting CategoriesGrades 3–5Interpretation of Data. The questions and tasks in this skill category assess students’ ability to manipulate and analyze student-gathered data presented in simple tables, graphs, and diagrams (e.g., select and compare data, find trends in data, convert a table into a simple graph, and extend

35
APPENDix A: SUBJECT ASSESSMENTS AND REPORTiNG CATEGORiES
from trends in data).
Scientific Investigation. The questions and tasks in this skill category assess students’ ability to understand experimental tools, procedures, and design (e.g., identify the factor the students changed during an investigation) and compare and extend investigations (e.g., describe differences between two student investigations).
Evaluation of Models, Inferences, and Experimental Results. The questions and tasks in this skill category assess students’ ability to judge the validity of simple scientific information and make conclusions and predictions based on that information (e.g., determine which set of data supports or weakens a student’s claim).
Grades 6–Early High SchoolInterpretation of Data. The questions and tasks in this skill category assess students’ ability to manipulate and analyze scientific data presented in tables, graphs, and diagrams (e.g., recognize trends in data, translate tabular data into graphs, interpolate and extrapolate, and reason mathematically).
Scientific Investigation. The questions and tasks in this skill category assess students’ ability to understand experimental tools, procedures, and design (e.g., identify variables and controls) and compare, extend, and modify experiments (e.g., predict the results of additional trials).
Evaluation of Models, Inferences, and Experimental Results. The questions and tasks in this skill category assess students’ ability to judge the validity of scientific information and formulate conclusions and predictions based on that information (e.g., determine which explanation for a scientific phenomenon is supported by new findings).
MathematicsACT Aspire mathematics assessments assess students’ ability to solve problems, explain and justify, and model with the mathematics up through the given grade.
Reporting CategoriesGrade 3Grade Level Progress. The questions and tasks in this skill category assess students’ understanding of and fluency in mathematics new to grade 3 and include Operations and Algebraic Thinking, Number and Operations in Base 10, Number and Operations—Fractions, Measurement and Data, and Geometry.
• Operations and Algebraic Thinking. The questions and tasks in this skill category assess students’ ability to understand multiplying as finding the total number in equal-sized groups, and dividing as sharing equally; multiply and divide within 100; and write expressions using multiplication and division.
• Number and Operations in Base 10. The questions and tasks in this skill category assess students’ ability to use place value to add and subtract within 1,000; to round to 10s and 100s; and to multiply 1-digit numbers by multiples of 10 that are 2-digit numbers.
• Number and Operations—Fractions. The questions and tasks in this skill category assess students’ ability to understand fractions, especially unit fractions, as numbers and as parts of a
36
APPENDix A: SUBJECT ASSESSMENTS AND REPORTiNG CATEGORiES
whole; understand that different-looking fractions can be the same number; and compare two fractions based on the size of numerators or denominators.
• Measurement and Data. The questions and tasks in this skill category assess students’ ability to understand measuring, show a set of measurements on a bar graph, find area using unit squares, connect multiplication to the area of a rectangle in terms of unit squares, and solve problems about perimeter and area.
• Geometry. The questions and tasks in this skill category assess students’ ability to understand how sets of shapes (like rectangles and rhombuses) can be part of a larger set of shapes (like quadrilaterals) and how to divide shapes into parts with equal areas.
Integrating Essential Skills. The questions and tasks in this skill category assess students’ continued use and strengthening of mathematics learned in earlier grades.
Justification and Explanation. The tasks in this skill category assess students’ ability to explain mathematical reasons for why things work the way they do.
Modeling. The questions and tasks in this skill category assess students’ ability to connect problems to mathematical drawings and expressions that can help them understand the problem and figure out what to do.
Grade 4Grade Level Progress. The questions and tasks in this skill category assess students’ understanding of and fluency in mathematics new to grade 4 and include Operations and Algebraic Thinking, Number and Operations in Base 10, Number and Operations—Fractions, Measurement and Data, and Geometry.
• Operations and Algebraic Thinking. The questions and tasks in this skill category assess students’ ability to understand how to solve multistep word problems using operations with whole numbers, find factors and multiples of whole numbers within 1–100, and generate and analyze patterns that follow a given rule.
• Number and Operations in Base 10. The questions and tasks in this skill category assess students’ ability to understand place value for multidigit whole numbers and use this understanding to perform multidigit arithmetic.
• Number and Operations—Fractions. The questions and tasks in this skill category assess students’ ability to explain fraction equivalence, compare two fractions, add and subtract fractions (including mixed numbers) with like denominators, multiply a fraction by a whole number, and use decimal notation for fractions.
• Measurement and Data. The questions and tasks in this skill category assess students’ ability to solve problems involving measurement and conversion of measurements from a larger unit to a smaller unit in the same measurement system and to understand angle concepts and measure angles.
• Geometry. The questions and tasks in this skill category assess students’ ability to draw and identify lines and angles, classify shapes by properties of their lines and angles, and understand a line of symmetry in terms of folding along the line.
Integrating Essential Skills. The questions and tasks in this skill category assess students’ continued use and strengthening of mathematics learned in earlier grades.

37
APPENDix A: SUBJECT ASSESSMENTS AND REPORTiNG CATEGORiES
Justification and Explanation. The tasks in this skill category assess students’ ability to explain mathematical reasons for why things work the way they do.
Modeling. The questions and tasks in this skill category assess students’ ability to connect problems to mathematical drawings and expressions that can help them understand the problem and figure out what to do.
Grade 5Grade Level Progress. The questions and tasks in this skill category assess students’ understanding of and fluency in mathematics new to grade 5 and include Operations and Algebraic Thinking, Number and Operations in Base 10, Number and Operations—Fractions, Measurement and Data, and Geometry.
• Operations and Algebraic Thinking. The questions and tasks in this skill category assess students’ ability to write expressions to record calculations; interpret numerical expressions without finding the value; and, for two rules, generate patterns, compare corresponding terms, and graph ordered pairs of corresponding terms.
• Number and Operations in Base 10. The questions and tasks in this skill category assess students’ ability to understand how the value of a digit changes if it shifts one place; explain patterns when multiplying by a power of 10; and add, subtract, multiply, and divide decimals to hundredths and explain the calculation strategy.
• Number and Operations—Fractions. The questions and tasks in this skill category assess students’ ability to use equivalent fractions to add and subtract fractions with unlike denominators, interpret fractions as division, interpret multiplication as scaling, multiply fractions, divide unit fractions by whole numbers and vice versa, and divide 4-digit numbers by 2-digit factors.
• Measurement and Data. The questions and tasks in this skill category assess students’ ability to convert within a given measurement system, understand volume in terms of unit cubes, and relate volume to multiplication and addition.
• Geometry. The questions and tasks in this skill category assess students’ ability to graph points in the first quadrant to solve problems, classify two-dimensional figures into categories that have a hierarchy, and understand that properties of all figures in a category also apply to all figures in a subcategory.
Integrating Essential Skills. The questions and tasks in this skill category assess students’ continued use and strengthening of mathematics learned in earlier grades.
Justification and Explanation. The tasks in this skill category assess students’ ability to explain mathematical reasons for why things work the way they do.
Modeling. The questions and tasks in this skill category assess students’ ability to connect problems to mathematical drawings and expressions that can help them understand the problem and figure out what to do.
Grade 6Grade Level Progress. The questions and tasks in this skill category assess students’
38
APPENDix A: SUBJECT ASSESSMENTS AND REPORTiNG CATEGORiES
understanding of and fluency in mathematics new to grade 6 and include Ratios and Proportional Relationships, The Number System, Expressions and Equations, Geometry, and Statistics and Probability.
• Ratios and Proportional Relationships. The questions and tasks in this skill category assess students’ ability to understand ratio concepts, including unit rate; connect rate relationships to multiplication and division and to equivalent fractions; and use ratio reasoning to solve problems.
• The Number System. The questions and tasks in this skill category assess students’ ability to divide fractions by fractions and explain why procedures make sense, explain and use relationships between a positive whole number or fraction and its negative counterpart, and understand absolute value as distance from zero.
• Expressions and Equations. The questions and tasks in this skill category assess students’ ability to apply arithmetic understandings to algebraic expressions, understand what solving an equation means, solve one-variable equations and inequalities, write an equation to represent a quantity in terms of a related quantity and analyze the relationship, and assess numerical expressions with whole-number exponents.
• Geometry. The questions and tasks in this skill category assess students’ ability to rearrange parts of triangles and special quadrilaterals to form rectangles and connect to area formulas; decompose shapes, including nets, into triangles and rectangles to find area and surface area; understand why the volume formula works for right rectangular prisms with fractional dimensions; and draw polygons in the coordinate plane.
• Statistics and Probability. The questions and tasks in this skill category assess students’ ability to recognize statistical questions as expecting variability across a population, display data in plots on the number line, and summarize data in relation to context.
Integrating Essential Skills. The questions and tasks in this skill category assess students’ continued integration, strengthening, and application of mathematics learned in earlier grades.
Justification and Explanation. The tasks in this skill category assess students’ ability to explain reasons behind mathematical statements, results, and procedures.
Modeling. The questions and tasks in this skill category assess students’ ability to demonstrate their modeling skills by creating, interpreting, evaluating, and improving mathematical models.
Grade 7Grade Level Progress. The questions and tasks in this skill category assess students’ understanding of and fluency in mathematics new to grade 7 and include Ratios and Proportional Relationships, The Number System, Expressions and Equations, Geometry, and Statistics and Probability.
• Ratios and Proportional Relationships. The questions and tasks in this skill category assess students’ ability to recognize, represent, and analyze proportional relationships between quantities and solve multistep ratio and percent problems and to compute unit rates from ratios of fractions.
• The Number System. The questions and tasks in this skill category assess students’ ability to understand how addition, subtraction, multiplication, and division extend to negative integers
39
APPENDix A: SUBJECT ASSESSMENTS AND REPORTiNG CATEGORiES
and fractions and to convert a fraction to decimal form and know it must terminate in zeroes or eventually repeat.
• Expressions and Equations. The questions and tasks in this skill category assess students’ ability to use properties of operations to create equivalent expressions, solve problems using numerical and algebraic expressions and simple equations, and compare solving algebraically to solving arithmetically.
• Geometry. The questions and tasks in this skill category assess students’ ability to describe geometric relationships, for example, about scale drawings; construct triangles with given angle measures or side lengths; solve problems involving area, surface area, and volume; and describe how circumference and area are related for a circle.
• Statistics and Probability. The questions and tasks in this skill category assess students’ ability to understand that random sampling produces samples that tend to represent the population, compare populations based on random samples, interpret probability in terms of likelihood, and find probability using organized lists or drawings.
Integrating Essential Skills. The questions and tasks in this skill category assess students’ continued integration, strengthening, and application of mathematics learned in earlier grades.
Justification and Explanation. The tasks in this skill category assess students’ ability to explain reasons behind mathematical statements, results, and procedures.
Modeling. The questions and tasks in this skill category assess students’ ability to demonstrate their modeling skills by creating, interpreting, evaluating, and improving mathematical models.
Grade 8Grade Level Progress. The questions and tasks in this skill category assess students’ understanding of and fluency in mathematics new to grade 8 and include The Number System, Expressions and Equations, Functions, Geometry, and Statistics and Probability.
• The Number System. The questions and tasks in this skill category assess students’ ability to recognize decimal expansion of numbers, understand rational numbers as those whose decimal expansions eventually repeat, approximate irrational numbers, and convert the form of rational numbers.
• Expressions and Equations. The questions and tasks in this skill category assess students’ ability to work with integer exponents, scientific notation, square roots, and cube roots; connect proportional relationships, lines, and linear equations; and solve linear equations and pairs of linear equations.
• Functions. The questions and tasks in this skill category assess students’ ability to understand functions in terms of input-output using rules, tables, graphs, and descriptions; understand y = mx + b as a linear function with constant rate of change; and model with linear functions.
• Geometry. The questions and tasks in this skill category assess students’ ability to understand congruence and similarity in terms of rotations, reflections, translations, and dilations; understand the Pythagorean Theorem; and find volumes of cylinders, cones, and spheres.
• Statistics and Probability. The questions and tasks in this skill category assess students’ ability to use patterns of association between 2 quantities as seen in scatterplots and in 2-way frequency tables, and, for appropriate scatterplots, model with a linear function and interpret slope and intercept.

40
Integrating Essential Skills. The questions and tasks in this skill category assess students’ continued integration, strengthening, and application of mathematics learned in earlier grades.
Justification and Explanation. The tasks in this skill category assess students’ ability to explain reasons behind mathematical statements, results, and procedures.
Modeling. The questions and tasks in this skill category assess students’ ability to demonstrate their modeling skills by creating, interpreting, evaluating, and improving mathematical models.
Early High SchoolGrade Level Progress. The questions and tasks in this skill category assess students’ understanding of and fluency in mathematics new to the early high school grades (grades 9 and 10) and include Number and Quantity, Algebra, Functions, Geometry, and Statistics and Probability.
• Number and Quantity. The questions and tasks in this skill category assess students’ ability to understand how properties of exponents extend to all rational numbers, rewrite radical expressions in terms of rational exponents, use units to solve problems, and understand numbers in terms of decimal expansion.
• Algebra. The questions and tasks in this skill category assess students’ ability to see structure in expressions; perform operations on polynomials; create equations; understand and explain solving as a reasoning process; and solve linear equations and inequalities, or pairs of these, and quadratic equations.
• Functions. The questions and tasks in this skill category assess students’ ability to interpret functions in different representations; understand average rate of change; and build and model with functions; all with a focus on linear, exponential, quadratic, square-root, absolute value, and piecewise-defined functions.
• Geometry. The questions and tasks in this skill category assess students’ ability to apply and derive geometric relationships and explain geometric reasoning related to congruence, similarity, lines, angles, triangles, parallelograms, circles, and distance; and to model with geometric objects.
• Statistics and Probability. The questions and tasks in this skill category assess students’ ability to compare distributions and interpret differences, interpret 2-way frequency tables and conditional probability in context, fit models to scatterplots and examine residuals, understand randomization in surveys and experiments, and find probability for sampling with and without replacement.
Integrating Essential Skills. The questions and tasks in this skill category assess students’ continued integration, strengthening, and application of mathematics learned in earlier grades.
Justification and Explanation. The tasks in this skill category assess students’ ability to explain reasons behind mathematical statements, results, and procedures.
Modeling. The questions and tasks in this skill category assess students’ ability to demonstrate their modeling skills by creating, interpreting, evaluating, and improving mathematical models.