Interpreting Mammalian Target of Rapamycin and Cell Growth ...Preclinical Development Interpreting...
14
Preclinical Development Interpreting Mammalian Target of Rapamycin and Cell Growth Inhibition in a Genetically Engineered Mouse Model of Nf1-Deficient Astrocytes Sutapa Banerjee 1 , Scott M. Gianino 1 , Feng Gao 2 , Uwe Christians 3 , and David H. Gutmann 1 Abstract The identification of mammalian target of rapamycin (mTOR) as a major mediator of neurofibromatosis-1 (NF1) tumor growth has led to the initiation of clinical trials using rapamycin analogs. Previous studies from our laboratory have shown that durable responses to rapamycin treatment in a genetically engineered mouse model of Nf1 optic glioma require 20 mg/kg/day, whereas only transient tumor growth suppression was observed with 5 mg/kg/day rapamycin despite complete silencing of ribosomal S6 activity. To gain clinically relevant insights into the mechanism underlying this dose-dependent effect, we used Nf1-deficient glial cells in vitro and in vivo. First, there was an exponential relationship between blood and brain rapamycin levels. Second, we show that currently used biomarkers of mTOR pathway inhibition (phospho-S6, phospho-4EBP1, phospho-STAT3, and Jagged-1 levels) and tumor proliferation (Ki67) do not accurately reflect mTOR target inhibition or Nf1-deficient glial growth suppression. Third, the incomplete suppression of Nf1-deficient glial cell proliferation in vivo following 5 mg/kg/day rapamycin treatment reflects mTOR-mediated AKT activation, such that combined 5 mg/kg/day rapamycin and PI3-kinase (PI3K) inhibition or dual PI3K/ mTOR inhibition recapitulates the growth suppressive effects of 20 mg/kg/day rapamycin. These new findings argue for the identification of more accurate biomarkers for rapamycin treatment response and provide reference preclinical data for comparing human rapamycin levels with target effects in the brain. Mol Cancer Ther; 10(2); 279–91. Ó2011 AACR. Introduction Individuals with the neurofibromatosis type 1 (NF1) inherited cancer syndrome are prone to the development of brain (glial cell) tumors that arise in young children along the optic pathway (optic pathway glioma; refs. 1, 2). NF1-associated optic pathway gliomas are World Health Organization grade I astrocytomas composed of glial fibrillary acidic protein (GFAP)-immunoreactive cells (3). These tumors have low proliferative indices and commonly exhibit indolent clinical behavior. Although many of these tumors do not require treatment, those that lead to reduced visual function are managed with carbo- platin/vincristine chemotherapy. However, genotoxic therapies are concerning in the setting of a tumor pre- disposition syndrome. For this reason, numerous studies have focused on the identification of targeted therapies for these common tumors in children with NF1 (4, 5). To develop preclinical small-animal models of NF1- associated optic glioma, we and others have used Nf1 mutant genetically engineered mice (GEM; refs. 6, 7). Nf1þ/- mice with Nf1 gene inactivation in GFAPþ cells develop optic gliomas in the prechiasmatic optic nerve and chiasm by 3 months of age (8, 9). Similar to their human counterparts, these Nf1 mouse gliomas have low proliferative indices, and exhibit microglial infiltration and increased vascularity (9, 10). On the basis of their similarity to NF1-associated optic glioma, Nf1 GEM have been successfully used for proof-of-principle preclinical studies using chemotherapy (temozolomide) to show tumor shrinkage, reduced glioma proliferation, and increased tumor apoptosis (11). Analysis of Nf1-deficient astrocytes and other NF1- deficient cell types previously revealed that the NF1 protein, neurofibromin, functions to negatively regulate cell growth by inactivating the Ras proto-oncogene (12, 13). Neurofibromin contains a 300 amino acid residue domain with sequence similarity to members of the GTPase activating protein family of molecules that serve to accelerate the conversion of Ras from its active GTP- Authors' Affiliations: 1 Department of Neurology and 2 Division of Biosta- tistics, Washington University School of Medicine, St. Louis, Missouri; and 3 Department of Anesthesiology, University of Colorado Denver, Aurora, Colorado Note: Supplementary material for this article is available at Molecular Cancer Therapeutics Online (http://mct.aacrjournals.org/). Corresponding Author: David H. Gutmann, Department of Neurology, Washington University School of Medicine, Box 8111, 660 South Euclid Avenue, St. Louis 63110, MO. Phone: 314-362-7379; Fax: 314-362-2388. E-mail: [email protected] doi: 10.1158/1535-7163.MCT-10-0654 Ó2011 American Association for Cancer Research. Molecular Cancer Therapeutics www.aacrjournals.org 279 Research. on March 14, 2020. © 2011 American Association for Cancer mct.aacrjournals.org Downloaded from Published OnlineFirst January 7, 2011; DOI: 10.1158/1535-7163.MCT-10-0654
Transcript of Interpreting Mammalian Target of Rapamycin and Cell Growth ...Preclinical Development Interpreting...

Preclinical Development
Interpreting Mammalian Target of Rapamycin and CellGrowth Inhibition in a Genetically Engineered MouseModel of Nf1-Deficient Astrocytes
Sutapa Banerjee1, Scott M. Gianino1, Feng Gao2, Uwe Christians3, and David H. Gutmann1
AbstractThe identification of mammalian target of rapamycin (mTOR) as a major mediator of neurofibromatosis-1
(NF1) tumor growth has led to the initiation of clinical trials using rapamycin analogs. Previous studies from
our laboratory have shown that durable responses to rapamycin treatment in a genetically engineered mouse
model of Nf1 optic glioma require 20 mg/kg/day, whereas only transient tumor growth suppression was
observed with 5 mg/kg/day rapamycin despite complete silencing of ribosomal S6 activity. To gain clinically
relevant insights into the mechanism underlying this dose-dependent effect, we used Nf1-deficient glial cells
in vitro and in vivo. First, there was an exponential relationship between blood and brain rapamycin levels.
Second, we show that currently used biomarkers of mTOR pathway inhibition (phospho-S6, phospho-4EBP1,
phospho-STAT3, and Jagged-1 levels) and tumor proliferation (Ki67) do not accurately reflect mTOR target
inhibition or Nf1-deficient glial growth suppression. Third, the incomplete suppression of Nf1-deficient glial
cell proliferation in vivo following 5 mg/kg/day rapamycin treatment reflects mTOR-mediated AKT
activation, such that combined 5 mg/kg/day rapamycin and PI3-kinase (PI3K) inhibition or dual PI3K/
mTOR inhibition recapitulates the growth suppressive effects of 20 mg/kg/day rapamycin. These new
findings argue for the identification of more accurate biomarkers for rapamycin treatment response and
provide reference preclinical data for comparing human rapamycin levels with target effects in the brain.
Mol Cancer Ther; 10(2); 279–91. �2011 AACR.
Introduction
Individuals with the neurofibromatosis type 1 (NF1)inherited cancer syndrome are prone to the developmentof brain (glial cell) tumors that arise in young childrenalong the optic pathway (optic pathway glioma; refs. 1, 2).NF1-associated optic pathway gliomas are World HealthOrganization grade I astrocytomas composed of glialfibrillary acidic protein (GFAP)-immunoreactive cells(3). These tumors have low proliferative indices andcommonly exhibit indolent clinical behavior. Althoughmany of these tumors do not require treatment, those thatlead to reduced visual function are managed with carbo-platin/vincristine chemotherapy. However, genotoxic
therapies are concerning in the setting of a tumor pre-disposition syndrome. For this reason, numerous studieshave focused on the identification of targeted therapiesfor these common tumors in children with NF1 (4, 5).
To develop preclinical small-animal models of NF1-associated optic glioma, we and others have used Nf1mutant genetically engineered mice (GEM; refs. 6, 7).Nf1þ/- mice with Nf1 gene inactivation in GFAPþ cellsdevelop optic gliomas in the prechiasmatic optic nerveand chiasm by 3 months of age (8, 9). Similar to theirhuman counterparts, these Nf1 mouse gliomas have lowproliferative indices, and exhibit microglial infiltrationand increased vascularity (9, 10). On the basis of theirsimilarity to NF1-associated optic glioma, Nf1 GEM havebeen successfully used for proof-of-principle preclinicalstudies using chemotherapy (temozolomide) to showtumor shrinkage, reduced glioma proliferation, andincreased tumor apoptosis (11).
Analysis of Nf1-deficient astrocytes and other NF1-deficient cell types previously revealed that the NF1protein, neurofibromin, functions to negatively regulatecell growth by inactivating the Ras proto-oncogene (12,13). Neurofibromin contains a 300 amino acid residuedomain with sequence similarity to members of theGTPase activating protein family of molecules that serveto accelerate the conversion of Ras from its active GTP-
Authors' Affiliations: 1Department of Neurology and 2Division of Biosta-tistics, Washington University School of Medicine, St. Louis, Missouri; and3Department of Anesthesiology, University of Colorado Denver, Aurora,Colorado
Note: Supplementary material for this article is available at MolecularCancer Therapeutics Online (http://mct.aacrjournals.org/).
Corresponding Author: David H. Gutmann, Department of Neurology,Washington University School of Medicine, Box 8111, 660 South EuclidAvenue, St. Louis 63110, MO. Phone: 314-362-7379; Fax: 314-362-2388.E-mail: [email protected]
doi: 10.1158/1535-7163.MCT-10-0654
�2011 American Association for Cancer Research.
MolecularCancer
Therapeutics
www.aacrjournals.org 279
Research. on March 14, 2020. © 2011 American Association for Cancermct.aacrjournals.org Downloaded from
Published OnlineFirst January 7, 2011; DOI: 10.1158/1535-7163.MCT-10-0654

bound to its inactive guanosine diphosphate-bound form(14–16). Subsequent studies further showed that neurofi-bromin Ras-mediated growth regulation operatesthrough the mammalian target of rapamycin (mTOR)pathway (17, 18). In this regard, NF1-deficient humanandmouse cells exhibit increased mTOR pathway activa-tion as evidenced by high levels of activity of the mTOReffector, ribosomal S6. Using activation-specific phospho-S6 antibodies, several groups showed increased mTORactivation in human and mouse NF1-associated tumors,including human and mouse optic gliomas. This excitingfinding prompted investigators to do preclinical studiesusing the rapamycin macrolide to inhibit mTOR activa-tion and NF1-deficient tumor growth in vivo (11, 17, 19).In these studies, we previously showed that Nf1 mouseoptic glioma proliferation was reduced following rapa-mycin treatment. Treatment with 5 mg/kg/day rapamy-cin for 14 days resulted in reduced tumor proliferationusing Ki67 (MIB-1) immunohistochemistry and attenu-ated mTOR pathway activation by phospho-S6 immu-nostaining; however, this effect was dependent on thecontinued presence of rapamycin, such that proliferationand mTOR activity returned to pretreatment levels2 weeks after the cessation of rapamycin treatment. Incontrast, Nf1 mutant mice treated with 20 mg/kg/dayrapamycin had a durable response that was not depen-dent on continued drug dosing (11). These interestingresults prompted us to define the molecular basis for thistreatment effect.
In this study, we measured rapamycin levels in theblood and brain in Nf1 mutant mice following treatmentwith 0, 2, 5, and 20 mg/kg/day rapamycin, and corre-lated drug dose with mTOR pathway signaling andproliferation in vivo. We found that 5 mg/kg/day rapa-mycin dosing resulted in increased AKT activation,which was suppressed following 20 mg/kg/day rapa-mycin treatment. However, neither Ki67 nor phospho-S6activity were robust biomarkers of the in vivo response torapamycin. Instead, phospho-histone-H3 most stronglycorrelated with combined inhibition of both S6 and AKTphosphorylation. We recapitulated these in vivo resultsusing Nf1-deficient mouse low-grade glioma cells in vitroto show that combined treatment with rapamycin and theLY294002 PI3-kinase (PI3-K) inhibitor suppressed cellgrowth to levels seen with higher doses of rapamycinalone. Collectively, these data suggest that additionalbiomarkers will be required to adequately assess mTORtarget inhibition and tumor proliferative responses torapamycin treatment in vivo.
Materials and Methods
MiceIn this study, 5- to 6-week-old Nf1GFAPCKO mice
(Nf1flox/flox; GFAP-Cre) were used. These mice lack Nf1geneexpressioninGFAPþ (glial)cells,andweregeneratedby successive intercrossing of Nf1flox/flox and Nf1flox/wt;GFAP-Cremice as previously described (6). Allmicewere
used in accordancewith establishedand approvedanimalstudies protocols at the Washington University School ofMedicine. Mice were maintained on an inbred C57Bl/6background.
mTOR inhibitor (rapamycin) treatment in vivoRapamycin (LC Laboratories) was administered at the
indicated doses (2, 5, or 20 mg/kg) by daily intraperito-neal injections of rapamycin dissolved in ethanol (5 daysper week for 2 weeks total). Vehicle-treatedmice receiveddaily injections of an identical solution lacking rapamy-cin. At least 5 mice were included in each treatmentgroup. After the final injection, mice were euthanized.Blood samples were collected for rapamycin concentra-tion determination, and then themicewere perfusedwithice-cold normal saline. Brains were dissected and half ofthe brain was kept at �80�C to measure brain rapamycinconcentrations. The remaining brain was divided intotwo parts for Western blotting and vibratome sectioningfor Ki67 determinations.
Measurement of blood and brain rapamycin levelsCalibrators and quality controlswere prepared by spik-
ing known amounts of sirolimus into blank EDTAmouseblood or homogenized mouse brain tissue (Bioreclama-tion). sirolimus and the internal standard sirolimus-d3were from Toronto Research Chemicals. Samples wereextracted and analyzed using a modification of an onlineextraction liquid chromatography-electrospray ioniza-tion-tandem mass spectrometry (LC/LC–MS/MS) assaypreviously described for the analysis of zotarolimus inblood and tissues (20). Mouse brains were weighed, high-performance liquid chromatography (HPLC)-gradewaterwas added (1:3; w/v) and tissues were homogenized.For protein precipitation of 100 mL brain homogenatesor 100 mL EDTA blood, 400 mL of ZnSO4�7H2O (17.28 g/L)in 30:70 (v/v) HPLC-grade water/HPLC-grade methanolcontaining the internal standard sirolimus-d3 (5 ng/mL)was added. Samples were vortexed for 2.5 minutes atroom temperature and centrifuged at 13,000 � g for 8minutes at 4�C using a bench-top microfuge. The super-natantwas transferred into 2mLHPLC autosampler glassvials and 100 mL was injected into the LC/LC–MS/MSsystem (HPLC Agilent 1100 Series, Applied Biosystems/Sciex API 4000). HPLC I was used for online sampleextraction, HPLC II for sample analysis and both wereconnected via a 6-port switching valve (20).
For online sample cleanup, an extraction column ( 4.6�12.5 mm, 5 mm, Eclipse XDB-C8, Agilent) was used andsamples were washed using 20% HPLC-grade methanol/80% HPLC-grade water þ 0.1% formic acid delivered at aflow rate of 5mL/min for 1minute. The analyteswere thenbackflushed onto a C8 analytical column (4.6 � 150 mm,5 mm, Zorbax XDB -C8, Agilent) that was kept at 65�C. Thefollowing gradient was run: 87% methanol/13% 0.1% for-mic acid to 100% methanol within 2.0 minutes and then100%methanol for an additional 1.5minutes. The flow ratewas 1 mL/min. The mass spectrometer was run in the
Banerjee et al.
Mol Cancer Ther; 10(2) February 2011 Molecular Cancer Therapeutics280
Research. on March 14, 2020. © 2011 American Association for Cancermct.aacrjournals.org Downloaded from
Published OnlineFirst January 7, 2011; DOI: 10.1158/1535-7163.MCT-10-0654

positive MRM (multiple reaction monitoring) mode. Thedesolvation gas was heated to 600�C, and the declusteringpotential was set to 160 V and the collision energy to 77 eV.The following ion transitions were monitored: m/z ¼936.5! 409.3 for sirolimus [M þ Naþ] and m/z ¼939.5! 409.3 for the internal standard sirolimus-d3 [Mþ Naþ]. The lower limit of quantitation in mouse braintissue was 2 mg/g and in EDTA blood 0.5 ng/mL. Therange of reliable responsewas 2 to 1,000mg/gand1 to 5,000ng/mL, respectively (r > 0.99). The interday accuracy wasbetween 85% and 115%and total imprecisionwas less than15%. No relevant carryover, matrix interferences, and ionsuppression/ ion enhancement were detected.
Cell linesThe mouse K4622 grade II glioma cell line was derived
from a C57Bl/6 Nf1þ/�; p53þ/� (NPCis) mouse and wasshown to be both Nf1- and p53-deficient (21). These cellswere maintained in Dulbecco’s Modified Eagles’ Med-ium supplemented with 10% fetal bovine serum and 1%Pen-Strep.
Pharmacologic inhibitorsRapamycin (LC Laboratories, catalog number R-5000;
Supplementary Fig. S1A), NVP-BEZ235 (LC Laboratories,catalog number 915019–65-7; Supplementary Fig. S1B),and LY294002 (Calbiochem) were purchased from com-mercial sources. In vitro treatmentswere for 16 to 18 hoursunless otherwise indicated. Experiments were done atleast 3 times with identical results.
Cell proliferationK4622 mouse glioma cells were plated (10,000 cells per
well) in 24-well dishes and allowed to adhere for 24 hoursfollowed by treatment with rapamycin, NVP-BEZ235, orLY294002 at the indicated concentrations. Cells wereexposed to [3H]-thymidine (1 mCi/mL) for 4 hours. Allassays were done 3 times with identical results (18, 21).
ImmunohistochemistryBrain tissues from rapamycin-treated or vehicle-trea-
ted mice were postfixed in 4% paraformaldehyde in PBS.Following sectioning on a vibratome, immunostainingwith Ki67 (BD PharMingen) antibodies was done aspreviously described (6). The number of Ki-67–immunor-eactive cells in the dentate gyrus was quantified by directcounting on 3 consecutive sections from each mouse.
Western blottingBrain tissues were harvested in NP-40 lysis buffer with
protease andphosphatase inhibitors andhomogenized bymechanical disruption.K4622 cellswere lysed in standardNP-40 lysis buffer with protease and phosphatase inhibi-tors. Western blotting was done as previously described(22). All antibodies were purchased from Cell SignalingTechnology and used at a 1:1,000 dilution unless other-wise stated. Primary phospho-histone-H3 (Ser10) anti-body was purchased from Abcam, Inc. Following
horseradish peroxidase–conjugated secondary antibody(Cell Signaling Technology) incubation, detection wasaccomplished by enhanced chemiluminescence (Amer-sham Biosciences). Densitometry analysis was done withGel-Pro Analyzer 4.0 software (Media Cybernetics) usinga-tubulin (Sigma), b-actin or non–phospho-STAT3, AKT,S6, and 4EBP1 antibodies for normalization.
Statistical analysisThe measures of all biomarkers were summarized
using the mean and SEM. The raw data were checkedgraphically and data transformation was done as neces-sary. The relationship between blood and brain rapamy-cin concentrations was described by linear regressionanalysis. For each biomarker, the differences of meansamong rapamycin dose levels were compared using 1-way ANOVA, followed by post hoc tests to compareindividual treatment conditions to the wild-type oruntreated group. To control the family-wise false-positiverate at the designed 0.05 level; however, such post hoccomparisons were conducted only if the overall differ-ence in ANOVA was significant. All the analyses wereimplemented by the comprehensive statistical package R(http://cran.r-project.org/) and P < 0.05 were consideredto be statistically significant.
Results
Brain rapamycin levels are exponentially correlatedwith blood rapamycin levels
One of the major obstacles in translating preclinicaldrug studies to human clinical trials is a relative paucityof reported blood and target tissue drug levels. In thesestudies, we sought to determine whether rapamycincrosses theblood–brainbarrier andhowbrain tissue levelscorrelated with rapamycin dose and circulating levels.First, wemeasured rapamycin concentrations in the bloodand brain tissues of 6- to 8-week-old Nf1GFAPCKO miceeither treated with rapamycin or vehicle daily for 2 con-secutive weeks. Nf1GFAPCKO mice were chosen as theylack neurofibromin expression in glial cells (astrocytes),but do not develop tumors. The optic glioma tumors inNf1þ/�GFAPCKO mice are too small for accurate determi-nations of rapamycin levels or drug target inhibition.Using LC/LC–MS/MS assay methods, we found dose-dependent increases in rapamycin concentrations inblood (Fig. 1A) and brain tissue (Fig. 1B). These observa-tions showed that intraperitoneal rapamycin administra-tion increases both blood andbrain levels.However, brainrapamycin levels were exponentially correlated withblood rapamycin levels (Fig. 1C; R2 ¼ 0.8, P < 0.0001).
Phospho-S6 is not a reliable biomarker ofrapamycin inhibition in the brain
Assessment of drug effects often involves the use ofsurrogatemarkers of drug target inhibition. Rapamycin isa robust inhibitor of mTOR signaling, and is most effec-tive at blocking TORC1 activity (23–27). TORC1 signaling
Rapamycin Inhibition of Nf1�/� Glial Cell Growth
www.aacrjournals.org Mol Cancer Ther; 10(2) February 2011 281
Research. on March 14, 2020. © 2011 American Association for Cancermct.aacrjournals.org Downloaded from
Published OnlineFirst January 7, 2011; DOI: 10.1158/1535-7163.MCT-10-0654

involves raptor-mediated activation of ribosomal S6kinase and S6. To this end, activation-specific phospho-S6 antibodies have been used as a surrogate biomarker ofmTOR inhibition by rapamycin and rapamycin analogs.
First, we measured phospho-S6 levels in rapamycin-trea-ted (2, 5, 20 mg/kg/day) or vehicle-treated Nf1GFAPCKOmouse brains. Rapamycin treatment at 5 and 20 mg/kg/day doses resulted in suppression of S6 activation
A
C
B(n
g/m
L)
Figure 1. Brain rapamycin levels are exponentially correlated with blood rapamycin levels. A, top, blood rapamycin concentration was increased withincreasing dose as measured by LC/LC–MS/MS and represented as a column graph. Error bars represent the SEM. Bottom, representative scatter plot showsthe linear regression analysis (R2 ¼ 0.91, P < 0.0001). B, rapamycin concentrations in brain tissue were increased as a function of dose (top). Error barsrepresent the SEM. Bottom, scatter plot shows the linear regression analysis (R2 ¼ 0.91, P < 0.0001). C, the relationship between blood and brain rapamycinwas exponential (R2 ¼ 0.8, P < 0.0001). Data from 5 mice per treatment group were included and all the R2 and P values were obtained after logarithmdata transformation. *, P < 0.01; **, P < 0.001; ***, P < 0.0001.
Banerjee et al.
Mol Cancer Ther; 10(2) February 2011 Molecular Cancer Therapeutics282
Research. on March 14, 2020. © 2011 American Association for Cancermct.aacrjournals.org Downloaded from
Published OnlineFirst January 7, 2011; DOI: 10.1158/1535-7163.MCT-10-0654

using both phospho-S6-Ser235/236 (Fig. 2A) and phospho-S6-Ser240/244 (data not shown) antibodies after normal-ization to total S6 levels. No significant phospho-S6reduction was observed at the 2 mg/kg/day rapamycindose. Identical results were also obtained if the totalnumber of phospho-S6–immunoreactive cells were quan-titated by immunohistochemistry in the brains of
Nf1GFAPCKO mice following rapamycin treatment (datanot shown).
Second, to additionally evaluate mTOR activity in thebrain after rapamycin treatment, we examined Thr37/46
phosphorylation of the mTOR effector 4EBP1 (Fig. 2B).Similar to S6 activation, 4EBP1 phosphorylation wasunchanged at the 2mg/kg/day dose, whereas significant
Figure 2. Phospho-S6 is not a reliable biomarker of rapamycin inhibition in the brain. A, left, mTOR inhibition is shown following rapamycin treatment ofNf1GFAPCKO mice (5 and 20 mg/kg/day) using the phospho-S6 (Ser235/236) surrogate biomarker. No significant inhibition was observed at 2 mg/kg/day. TotalS6 served as an internal loading control. *, P < 0.05 between control and rapamycin-treated mice. Fold changes as determined by scanning densitometryare shown in the right panel. B, 4EBP1 Thr37/46 phosphorylation (left) was significantly decreased (*, P < 0.05) following 5 and 20 mg/kg/day rapamycintreatment. Total 4EBP1 was included as an internal loading control (quantitation was included in the right panel). C, Western blotting with activation-specificSTAT3 (Ser727) antibodies shows that rapamycin-treated (5 and 20 mg/kg/day) mice have significantly reduced STAT3 activation by Western blotting (left) anddensitometry (right). No inhibition was observed following 2 mg/kg/day rapamycin. Total STAT3 was used as an internal loading control. *, P < 0.05.
Rapamycin Inhibition of Nf1�/� Glial Cell Growth
www.aacrjournals.org Mol Cancer Ther; 10(2) February 2011 283
Research. on March 14, 2020. © 2011 American Association for Cancermct.aacrjournals.org Downloaded from
Published OnlineFirst January 7, 2011; DOI: 10.1158/1535-7163.MCT-10-0654

reductions were observed both at 5 and 20 mg/kg/dayrapamycin doses. Third, recent studies showed thatmTOR regulates Jagged-1 levels in tuberous sclerosiscomplex–deficient cells (28). To determine whetherJagged-1 levels are elevated in Nf1-deficient primaryastrocytes, we did Western blotting. We observed a 2-fold increase in Jagged-1 protein expression in Nf1�/�
relative to wild-type astrocytes (SupplementaryFig. S2A). This increase in Jagged-1 protein expressionwas inhibited by rapamycin treatment; however, Jagged-1 levels were reduced inNf1GFAPCKOmice treated with 2mg/kg/day rapamycin—a dose at which no change inphospho-S6 expression was seen (SupplementaryFig. S2B).
Although neurofibromin regulates cell growth throughthe mTOR pathway in many distinct cell types, we pre-viously showed that increased Nf1-deficient astrocytegrowth reflects raptor-dependent signaling through theRac1/STAT3 pathway (21). In light of this tissue speci-ficity, we next measured STAT3 activation using phos-pho-STAT3 (Ser727) antibodies. Consistent with theresults obtained using phospho-S6 and phospho-4EBP1, STAT3 inhibition was only observed in the brainat the 5 and 20 mg/kg/day doses (Fig. 2C). Collectively,these data show that inhibition of mTOR downstreamsignaling in the brain requires at least 5 mg/kg/dayrapamycin treatment.
Ki67 does not accurately reflect rapamycininhibition of glial cell proliferation in vivo
Previous preclinical studies from our laboratory and byothers have used Ki67 as a marker of tumor cell prolif-eration (11, 29). In these studies, we found that either thenumber of Ki67 cells or the percent of Ki67-positive cellsin Nf1þ/�GFAPCKO mouse optic glioma tumors or Nf1-deficient glial cells correlated well with other markers ofcell proliferation in vivo, including bromodeoxyuridineincorporation (11). To determine whether Ki67 accuratelyreflected rapamycin inhibition ofNf1-deficient brain glialcell proliferation in vivo, we quantified the number ofproliferating cells in a defined region of the dentate gyrususing standard Ki67 (MIB-1) immunostaining. Surpris-ingly, we observed a significant decrease in the number ofKi67-immunoreactive (proliferating) cells (Fig. 3A) at 2mg/kg/day rapamycin. As shown earlier, 2 mg/kg/dayrapamycin did not inhibit mTOR signaling. This findingsuggests that Ki67 may not be the ideal marker to mea-sure glial cell proliferation in preclinical Nf1 GEM low-grade glioma rapamycin drug studies. Using a lessconventional marker of cell proliferation (proliferatingcell nuclear antigen; PCNA), statistically significantreductions in cell proliferation were only observed fol-lowing 20 mg/kg/day rapamycin treatment (Supple-mentary Fig. S3B). However, the low numbers ofPCNA-immunoreactive cells present in each sectionlimits the routine use of this marker for preclinical stu-dies, consistent with other reports comparing these twobiomarkers (30–33).
To identifymore accuratemarkers ofNf1-deficient glialcell proliferation in vivo, we next measured cyclin D1levels. Cyclin D1 was chosen on the basis of our previousstudies, which showed that STAT3 regulates cyclin D1expression in Nf1-deficient cells (21). Interestingly, wefound that inhibition of cyclin D1was only observed at 20mg/kg/day rapamycin dosing (Fig. 3B). To confirm theapparent inhibition of cell growth only at 20 mg/kg/dayrapamycin dosing, we measured phospho-histone H3(HH3) levels using phospho-HH3 (Ser10) antibodies.Similar to the results obtained using cyclin D1 antibodies,we observed reduced phospho-HH3 only with 20 mg/kg/day rapamycin (Fig. 3C). Collectively, these resultsshow that phospho-HH3 and cyclin D1 may be moreaccurate indicators of mTOR-mediated glial growth inhi-bition in the brain.
The inability of 5 mg/kg/day rapamycin to stronglyinhibit glial proliferation in vivo reflects AKThyperactivation
On the basis of the results described earlier, we soughtto determine why equivalent mTOR pathway inhibitionusing several surrogate markers of mTOR activity wasobserved following 5 and 20 mg/kg/day rapamycintreatment; however, only 20 mg/kg/day rapamycinled to reduced glial cell proliferation in vivo. Previousstudies have shown that rapamycin inhibition can para-doxically cause an increase AKT activation as a result ofinhibition of TORC1-mediated AKT inhibition and/orTORC2-mediated AKT activation (34–37). Although thisanomalous AKT activation has been reported in humanNF1-associated tumors (19, 29), this has not been pre-viously observed in Nf1 GEM tumors or primary tissues(11, 38). To determine whether AKT activation was seenin the brain following rapamycin treatment, wemeasuredAKT Ser473 phosphorylation in vivo, and found a 4-foldincrease in AKT activation at 5 mg/kg/day, but not at 2or 20 mg/kg/day. These results suggest that AKT activa-tion might counteract the growth suppressive effects ofrapamycin-mediated mTOR inhibition.
To establish an in vitromodel for these observations, weexamined AKT activation, mTOR activity, and cell pro-liferation in Nf1-deficient K4622 glioma cells treated overa wide range of rapamycin concentrations from 0.001 to500 nmol/L (data not shown). On the basis of this doserange, we selected 3 rapamycin doses (0.001, 0.75, and 10nmol/L) to parallel the effects of 2, 5, and 20 mg/kg/dayrapamycin treatment. Similar to the results obtainedfollowing 5 mg/kg/day rapamycin treatment in vivo,we found that 0.75 nmol/L rapamycin resulted in a 5-fold increase in AKT activation compared with vehiclecontrol, whereas no change in AKT Ser473 phosphoryla-tion was observed at 0.001 or 10 nmol/L rapamycin(Fig. 4A). No change in AKT phosphorylation at residueThr-308 was observed following 0.75 nmol/L rapamycintreatment (Supplementary Fig. S4A), and no increase inAKT Thr-308 phosphorylationwas found inNf1-deficientastrocytes relative to their wild-type controls (data not
Banerjee et al.
Mol Cancer Ther; 10(2) February 2011 Molecular Cancer Therapeutics284
Research. on March 14, 2020. © 2011 American Association for Cancermct.aacrjournals.org Downloaded from
Published OnlineFirst January 7, 2011; DOI: 10.1158/1535-7163.MCT-10-0654

shown). In addition, S6-Ser235/236, STAT3-Ser727, and4EBP1-Thr37/46 phosphorylationwas decreased in a rapa-mycin dose-dependent fashion (Fig. 4B).Next, to determine whether rapamycin inhibits Nf1-
deficient glioma cell proliferation in vitro, we examined
the effect of rapamycin treatment (0.001, 0.75, and 10nmol/L) on [3H]-thymidine incorporation and histone-H3-Ser10 phosphorylation. Similar to the in vivo resultsdescribed earlier, we observed a maximum inhibitoryeffect on cell growth and histone-H3 phosphorylation
Figure 3. Ki67 does not accurately reflect rapamycin inhibition of glial cell proliferation in vivo. A, Ki67 (MIB-1) immunolabeling (left) shows significantlydecreased proliferation in the dentate gyrus in rapamycin (2, 5, and 20 mg/kg/day)-treated mice compared with vehicle-treated controls (quantitation in rightpanel). Inset shows an enlarged view of the Ki67þ cell indicated by the arrow. Magnification, �200. Scale bar, 100 mmol/L. *, P < 0.0001. B, Western blotting(left) of brain lysates from rapamycin- and vehicle-treated mice shows significant inhibition of cyclin D1 expression (P ¼ 0.036) following 20 mg/kg/dayrapamycin (right). C, 20 mg/kg/day rapamycin treatment reduced histone-H3 phosphorylation (Ser10 phosphorylation) by Western blotting (left) anddensitometry (right). Actin was used as an internal control for equal protein loading. *, P < 0.02.
Rapamycin Inhibition of Nf1�/� Glial Cell Growth
www.aacrjournals.org Mol Cancer Ther; 10(2) February 2011 285
Research. on March 14, 2020. © 2011 American Association for Cancermct.aacrjournals.org Downloaded from
Published OnlineFirst January 7, 2011; DOI: 10.1158/1535-7163.MCT-10-0654
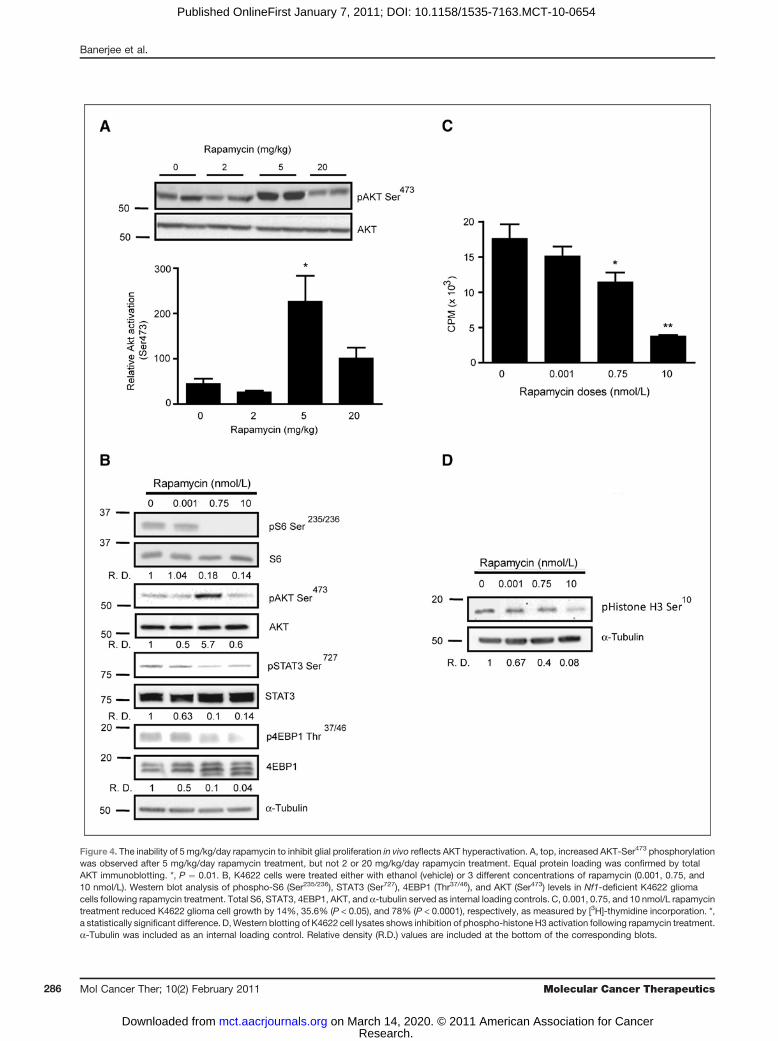
Figure 4. The inability of 5 mg/kg/day rapamycin to inhibit glial proliferation in vivo reflects AKT hyperactivation. A, top, increased AKT-Ser473 phosphorylationwas observed after 5 mg/kg/day rapamycin treatment, but not 2 or 20 mg/kg/day rapamycin treatment. Equal protein loading was confirmed by totalAKT immunoblotting. *, P ¼ 0.01. B, K4622 cells were treated either with ethanol (vehicle) or 3 different concentrations of rapamycin (0.001, 0.75, and10 nmol/L). Western blot analysis of phospho-S6 (Ser235/236), STAT3 (Ser727), 4EBP1 (Thr37/46), and AKT (Ser473) levels in Nf1-deficient K4622 gliomacells following rapamycin treatment. Total S6, STAT3, 4EBP1, AKT, and a-tubulin served as internal loading controls. C, 0.001, 0.75, and 10 nmol/L rapamycintreatment reduced K4622 glioma cell growth by 14%, 35.6% (P < 0.05), and 78% (P < 0.0001), respectively, as measured by [3H]-thymidine incorporation. *,a statistically significant difference. D,Western blotting of K4622 cell lysates shows inhibition of phospho-histone H3 activation following rapamycin treatment.a-Tubulin was included as an internal loading control. Relative density (R.D.) values are included at the bottom of the corresponding blots.
Banerjee et al.
Mol Cancer Ther; 10(2) February 2011 Molecular Cancer Therapeutics286
Research. on March 14, 2020. © 2011 American Association for Cancermct.aacrjournals.org Downloaded from
Published OnlineFirst January 7, 2011; DOI: 10.1158/1535-7163.MCT-10-0654
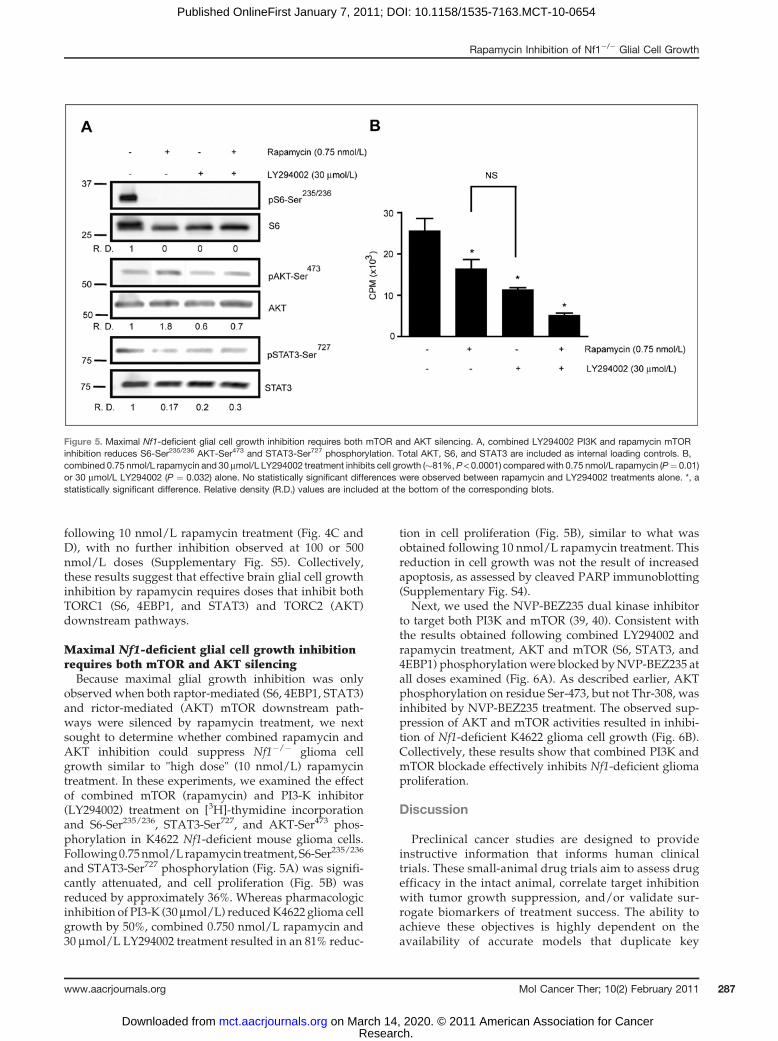
following 10 nmol/L rapamycin treatment (Fig. 4C andD), with no further inhibition observed at 100 or 500nmol/L doses (Supplementary Fig. S5). Collectively,these results suggest that effective brain glial cell growthinhibition by rapamycin requires doses that inhibit bothTORC1 (S6, 4EBP1, and STAT3) and TORC2 (AKT)downstream pathways.
Maximal Nf1-deficient glial cell growth inhibitionrequires both mTOR and AKT silencingBecause maximal glial growth inhibition was only
observed when both raptor-mediated (S6, 4EBP1, STAT3)and rictor-mediated (AKT) mTOR downstream path-ways were silenced by rapamycin treatment, we nextsought to determine whether combined rapamycin andAKT inhibition could suppress Nf1�/� glioma cellgrowth similar to "high dose" (10 nmol/L) rapamycintreatment. In these experiments, we examined the effectof combined mTOR (rapamycin) and PI3-K inhibitor(LY294002) treatment on [3H]-thymidine incorporationand S6-Ser235/236, STAT3-Ser727, and AKT-Ser473 phos-phorylation in K4622 Nf1-deficient mouse glioma cells.Following0.75nmol/Lrapamycin treatment,S6-Ser235/236
and STAT3-Ser727 phosphorylation (Fig. 5A) was signifi-cantly attenuated, and cell proliferation (Fig. 5B) wasreduced by approximately 36%. Whereas pharmacologicinhibition of PI3-K (30 mmol/L) reducedK4622 glioma cellgrowth by 50%, combined 0.750 nmol/L rapamycin and30 mmol/L LY294002 treatment resulted in an 81% reduc-
tion in cell proliferation (Fig. 5B), similar to what wasobtained following 10 nmol/L rapamycin treatment. Thisreduction in cell growth was not the result of increasedapoptosis, as assessed by cleaved PARP immunoblotting(Supplementary Fig. S4).
Next, we used the NVP-BEZ235 dual kinase inhibitorto target both PI3K and mTOR (39, 40). Consistent withthe results obtained following combined LY294002 andrapamycin treatment, AKT and mTOR (S6, STAT3, and4EBP1) phosphorylationwere blocked byNVP-BEZ235 atall doses examined (Fig. 6A). As described earlier, AKTphosphorylation on residue Ser-473, but not Thr-308, wasinhibited by NVP-BEZ235 treatment. The observed sup-pression of AKT and mTOR activities resulted in inhibi-tion of Nf1-deficient K4622 glioma cell growth (Fig. 6B).Collectively, these results show that combined PI3K andmTOR blockade effectively inhibits Nf1-deficient gliomaproliferation.
Discussion
Preclinical cancer studies are designed to provideinstructive information that informs human clinicaltrials. These small-animal drug trials aim to assess drugefficacy in the intact animal, correlate target inhibitionwith tumor growth suppression, and/or validate sur-rogate biomarkers of treatment success. The ability toachieve these objectives is highly dependent on theavailability of accurate models that duplicate key
Figure 5. Maximal Nf1-deficient glial cell growth inhibition requires both mTOR and AKT silencing. A, combined LY294002 PI3K and rapamycin mTORinhibition reduces S6-Ser235/236 AKT-Ser473 and STAT3-Ser727 phosphorylation. Total AKT, S6, and STAT3 are included as internal loading controls. B,combined 0.75 nmol/L rapamycin and 30 mmol/L LY294002 treatment inhibits cell growth (�81%, P < 0.0001) comparedwith 0.75 nmol/L rapamycin (P¼ 0.01)or 30 mmol/L LY294002 (P ¼ 0.032) alone. No statistically significant differences were observed between rapamycin and LY294002 treatments alone. *, astatistically significant difference. Relative density (R.D.) values are included at the bottom of the corresponding blots.
Rapamycin Inhibition of Nf1�/� Glial Cell Growth
www.aacrjournals.org Mol Cancer Ther; 10(2) February 2011 287
Research. on March 14, 2020. © 2011 American Association for Cancermct.aacrjournals.org Downloaded from
Published OnlineFirst January 7, 2011; DOI: 10.1158/1535-7163.MCT-10-0654

features of the human condition coupled with a rigor-ous evaluation of potential drug therapies. In the case ofNF1-associated tumors, including optic glioma andmalignant peripheral nerve sheath tumor (MPNST),rapamycin inhibits tumor growth in vivo (11, 19, 29,38). However, in these various models, there were sig-nificant differences in the doses of rapamycin used(1 mg/kg/day to 20 mg/kg/day) and the effects ofrapamycin on mTOR signaling. This variation couldreflect differences in tumor species of origin [mouse(11, 38) versus human (19, 29)], host species immuno-competence [GEM (11, 38) versus tumor explants intoimmunocompromised mice (19, 29)], or tumor location[brain (11, 38) versus body (19, 29, 38)]. Similarly, thesedifferences could result from disparities in rapamycinbioavailability. In this study, we did a series of experi-ments to address some of these critical issues.
First, we sought to define the relationship betweenblood and brain rapamycin levels and drug dose.
Althoughwe observed a dose-dependent increase in bothblood and brain rapamycin concentrations with escalat-ing rapamycin doses, the relationship between blood andbrain rapamycin levels deserves further discussion. MostNf1mouse preclinical studies have used rapamycin dosesbetween 1 and 10 mg/kg/day (11, 38). In the brain, therewas a linear relationship between blood and brain rapa-mycin concentrations at the lower doses (2 and 5mg/kg/day); however, we observed an exponential relationshipat the higher dose (20 mg/kg/day). This result suggeststhat rapamycin brain delivery may involve differentorder kinetics than that observed for peripheral tissues.It is well established that p-glycoprotein as an effluxtransporter is a critical component of the blood–brainbarrier (41). As such, it limits the entry of drugs that aresubstrates, such as rapamycin, into the brain (42). Ourdata may indicate that at the highest rapamycin dose (20mg/kg) systemic rapamycin exposure exceeds the capa-city of brain barrier efflux transporters, leading to the
Figure 6. Treatment with the dual PI3K/mTOR inhibitor NVP-BEZ235 inhibits Nf1-deficient glioma cell growth. A, Nf1-deficient K4622 glioma cells weretreated with dimethyl sulfoxide (vehicle) or 3 different concentrations of NVP-BEZ235 (0.5, 1, and 2.5 mmol/L). Western blot analysis following NVP-BEZ235treatment revealed reduced AKT (Ser473), S6 (Ser235/236), STAT3 (Ser727), and 4EBP1 (Thr37/46) phosphorylation. Total S6, AKT, 4EBP1, and STAT3served as internal protein loading controls. Relative density (R.D.) values are included at the bottom of the corresponding blots. B, NVP-BEZ235treatment reduced K4622 glioma cell growth by approximately 90% (P < 0.0001), similar to combined treatment with LY294002 and rapamycin. *, astatistically significant difference.
Banerjee et al.
Mol Cancer Ther; 10(2) February 2011 Molecular Cancer Therapeutics288
Research. on March 14, 2020. © 2011 American Association for Cancermct.aacrjournals.org Downloaded from
Published OnlineFirst January 7, 2011; DOI: 10.1158/1535-7163.MCT-10-0654

observed exponential increase in brain rapamycin con-centrations.Next, we evaluatedmTOR target inhibition in the brain
following rapamycin treatment, and were surprised tofind that phospho-S6 inhibition did not correlate withreduced Nf1-deficient glial cell proliferation. This is con-sistent with in vitro studies using Nf1-deficient NPCisglioma cells or primary brain astrocytes (SupplementaryFig. S6A and B). In these experiments, more than 90%reduction in phospho-S6 levels (using either phospho-Ser235/236 or phospho-S6-Ser240/244 antibodies) was seenat rapamycin doses 10-fold lower than doses required toinhibit Nf1-deficient glial cell proliferation. Similarly,other mTOR downstream effectors, including STAT3and 4EBP1, showed similar relationships between targetinhibition and growth suppression. These findings sug-gest that maximal rapamycin-mediated growth suppres-sion involves more than mTOR/raptor downstreamtarget inhibition.It is also possible that the inability of mTOR/raptor
inhibition (phospho-S6/4EBP1/STAT3 levels) to predictmTOR-mediated growth suppression reflects rapamycin-induced mTOR-dependent AKT activation. Following5 mg/kg/day rapamycin treatment, there is increasedAKT Ser-473 phosphorylation in the brains ofNf1GFAPCKO mice. To model this rapamycin effect invitro, we used Nf1-deficient NPCis mouse glioma cells,and show that 0.75 nmol/L rapamycin likewise increasesAKT activation. Following simultaneous PI3-K andmTOR inhibition, NPCis glioma cell growth inhibitionis similar to that observed with high-dose rapamycintreatment alone. Although these findings indicate thatmaximal growth suppression requires silencing of bothmTOR and AKT activation, the combined use of phos-pho-AKT and phospho-S6 as surrogate biomarkerswould be misleading. It would be impossible to deter-mine whether low phospho-AKT and phospho-S6 levelsin the tumor reflect inadequate target inhibition (2 mg/kg/day) or the desired effect (20 mg/kg/day). In thisregard, there is a pressing need for more accurate bio-markers that better show optimal mTOR pathway inhibi-tion following rapamycin treatment.Previous rapamycin-based Nf1 preclinical mouse
model drug studies have measured tumor volume, andobserved that tumor size reduction was completelydependent on continuous drug treatment. In the Nf1GEM optic glioma model, we found that cessation of 5mg/kg/day rapamycin therapy resulted in increasedtumor proliferation (as assessed by Ki67 immunohisto-chemistry) and increased tumor volume within 2 weeks.Similar findings were reported in NF1-associated
MPNST preclinical studies, supporting the conclusionthat these doses of rapamycin do not achieve a durableeffect. One exception to this short-lived antitumoralresponse was seen following 20 mg/kg/day rapamycinin Nf1 GEM optic glioma (11). For this reason, we soughtto identify proliferation biomarkers that correlate withthe sustained tumor growth suppression. In this study,we found that phospho-histone-H3 and cyclin D1 moreaccurately reflected reduced Nf1-deficient glial cellgrowth in response to rapamycin in vitro and in vivo.The finding that cyclin D1 levels paralleled growth inhi-bition has also been noted in NF1-deficient MPNST pre-clinical studies (38). To this end, reexpression of theGTPase activating domain of neurofibromin was suffi-cient to restore cyclin D1 levels to normal.
As we attempt to leverage the emerging experiencewith GEM preclinical therapeutic studies to designmore effective drug regimens for brain tumors, itbecomes increasingly important to validate surrogatemarkers of disease activity and target inhibition inrelevant small-animal models. The findings describedin this study suggest that blood rapamycin levels do notaccurately reflect brain concentrations and that cur-rently used mTOR signaling biomarkers inadequatelycorrelate with inhibition of Nf1�/� glial cell prolifera-tion. Moreover, as suggested by other preclinical studieson glioma and MPNST (39, 43), dual kinase inhibitorsthat block both PI3K and mTOR function may haveparticular efficacy in the treatment of NF1-associatedglioma. Future studies should focus on identifyingadditional surrogate biomarkers for NF1-deficienttumors suitable for preclinical and eventually clinicalstudies targeting the AKT/mTOR signaling pathway(39, 43–48). The availability of more accurate biomarkersmay increase the utility of preclinical mouse models ininforming human clinical drug trials.
Disclosure of Potential Conflicts of Interest
D.H. Gutmann: University of Michigan; NF1 gene patent.
Grant Support
This work was funded in part by a grant from the Department ofDefense to DHG (W81XWH061022). The Siteman Cancer Center is sup-ported by NCI Cancer Center Support Grant P30-CA91842.
The costs of publication of this article were defrayed in part by thepayment of page charges. This article must therefore be hereby markedadvertisement in accordance with 18 U.S.C. Section 1734 solely to indicatethis fact.
Received July 9, 2010; revised November 1, 2010; accepted November19, 2010; published OnlineFirst January 7, 2011.
References1. Listernick R, Ferner RE, Liu GT, Gutmann DH. Optic pathway gliomas
in neurofibromatosis-1: controversies and recommendations. AnnNeurol 2007;61:189–98.
2. ListernickR,LouisDN,PackerRJ,GutmannDH.Opticpathwaygliomasin children with neurofibromatosis 1: consensus statement from theNF1 Optic Pathway Glioma Task Force. Ann Neurol 1997;41:143–9.
Rapamycin Inhibition of Nf1�/� Glial Cell Growth
www.aacrjournals.org Mol Cancer Ther; 10(2) February 2011 289
Research. on March 14, 2020. © 2011 American Association for Cancermct.aacrjournals.org Downloaded from
Published OnlineFirst January 7, 2011; DOI: 10.1158/1535-7163.MCT-10-0654

3. Louis DN, Ohgaki H, Wiestler OD, Cavenee WK, Burger PC, Jouvet A,et al. The 2007 WHO classification of tumours of the central nervoussystem. Acta Neuropathol 2007;114:97–109.
4. Burzynski SR. Treatments for astrocytic tumors in children: currentand emerging strategies. Paediatr Drugs 2006;8:167–78.
5. Gottfried ON, Viskochil DH, Couldwell WT. Neurofibromatosis Type 1and tumorigenesis: molecular mechanisms and therapeutic implica-tions. Neurosurg Focus 2010;28:E8.
6. Bajenaru ML, Zhu Y, Hedrick NM, Donahoe J, Parada LF, GutmannDH. Astrocyte-specific inactivation of the neurofibromatosis 1 gene(NF1) is insufficient for astrocytoma formation. Mol Cell Biol 2002;22:5100–13.
7. Zhu Y, Harada T, Liu L, Lush ME, Guignard F, Harada C, et al.Inactivation of NF1 in CNS causes increased glial progenitor prolif-eration and optic glioma formation. Development 2005;132:5577–88.
8. Bajenaru ML, Hernandez MR, Perry A, Zhu Y, Parada LF, Garbow JR,et al. Optic nerve glioma in mice requires astrocyte Nf1 gene inactiva-tion and Nf1 brain heterozygosity. Cancer Res 2003;63:8573–7.
9. Bajenaru ML, Garbow JR, Perry A, Hernandez MR, Gutmann DH.Natural history of neurofibromatosis 1-associated optic nerve gliomain mice. Ann Neurol 2005;57:119–27.
10. Daginakatte GC, Gutmann DH. Neurofibromatosis-1 (Nf1) heterozy-gous brain microglia elaborate paracrine factors that promote Nf1-deficient astrocyte and glioma growth. Hum Mol Genet 2007;16:1098–112.
11. Hegedus B, Banerjee D, Yeh TH, Rothermich S, Perry A, Rubin JR,et al. Preclinical cancer therapy in a mouse model of neurofibroma-tosis-1 optic glioma. Cancer Res 2008;68:1520–8.
12. DeClue JE, Papageorge AG, Fletcher JA, Diehl SR, Ratner N, VassWC, et al. Abnormal regulation of mammalian p21ras contributes tomalignant tumor growth in von Recklinghausen (type 1) neurofi-bromatosis. Cell 1992;69:265–73.
13. Basu TN, Gutmann DH, Fletcher JA, Glover TW, Collins FS, Down-ward J. Aberrant regulation of ras proteins in malignant tumour cellsfrom type 1 neurofibromatosis patients. Nature 1992;356:713–5.
14. Ballester R, Marchuk D, Boguski M, Saulino A, Letcher R, Wigler M,et al. The NF1 locus encodes a protein functionally related to mam-malian GAP and yeast IRA proteins. Cell 1990;63:851–9.
15. Martin GA, Viskochil D, Bollag G, McCabe PC, Crosier WJ, HaubruckH, et al. The GAP-related domain of the neurofibromatosis type 1 geneproduct interacts with ras p21. Cell 1990;63:843–9.
16. Xu GF, O’Connell P, Viskochil D, Cawthon R, Robertson M, Culver M,et al. The neurofibromatosis type 1 gene encodes a protein related toGAP. Cell 1990;62:599–608.
17. Johannessen CM, Reczek EE, James MF, Brems H, Legius E,Cichowski K. The NF1 tumor suppressor critically regulates TSC2and mTOR. Proc Natl Acad Sci U S A 2005;102:8573–8.
18. Dasgupta B, Yi Y, Chen DY, Weber JD, Gutmann DH. Proteomicanalysis reveals hyperactivation of the mammalian target of rapamy-cin pathway in neurofibromatosis 1-associated human and mousebrain tumors. Cancer Res 2005;65:2755–60.
19. Johansson G, Mahller YY, Collins MH, Kim KO, Nobukuni T, Perent-esis J, et al. Effective in vivo targeting of the mammalian target ofrapamycin pathway in malignant peripheral nerve sheath tumors. MolCancer Ther 2008;7:1237–45.
20. Zhang YL, Bendrick-Peart J, Strom T, Haschke M, Christians U.Development and validation of a high-throughput assay for quantifi-cation of the proliferation inhibitor ABT-578 using LC/LC-MS/MS inblood and tissue samples. Ther Drug Monit 2005;27:770–8.
21. Banerjee S, Byrd JN, Gianino SM, Harpstrite SE, Rodriguez FJ,Tuskan RG, et al. The neurofibromatosis type 1 tumor suppressorcontrols cell growth by regulating signal transducer and activator oftranscription-3 activity in vitro and in vivo. Cancer Res 2010;70:1356–66.
22. Sandsmark DK, Zhang H, Hegedus B, Pelletier CL, Weber JD,Gutmann DH. Nucleophosmin mediates mammalian target of rapa-mycin-dependent actin cytoskeleton dynamics and proliferationin neurofibromin-deficient astrocytes. Cancer Res 2007;67:4790– 9.
23. Wang X, Fonseca BD, Tang H, Liu R, Elia A, Clemens MJ, et al. Re-evaluating the roles of proposed modulators of mammalian target ofrapamycin complex 1 (mTORC1) signaling. J Biol Chem 2008;283:30482–92.
24. Liu L, Li F, Cardelli JA, Martin KA, Blenis J, Huang S. Rapamycininhibits cell motility by suppression of mTOR-mediated S6K1 and 4E-BP1 pathways. Oncogene 2006;25:7029–40.
25. Yang Q, Inoki K, Kim E, Guan KL. TSC1/TSC2 and Rheb have differenteffects on TORC1 and TORC2 activity. Proc Natl Acad Sci U S A2006;103:6811–6.
26. Jacinto E, Loewith R, Schmidt A, Lin S, Ruegg MA, Hall A, et al.Mammalian TOR complex 2 controls the actin cytoskeleton and israpamycin insensitive. Nat Cell Biol 2004;6:1122–8.
27. Loewith R, Jacinto E, Wullschleger S, Lorberg A, Crespo JL, Bone-nfant D, et al. Two TOR complexes, only one of which is rapamycinsensitive, have distinct roles in cell growth control. Mol Cell2002;10:457–68.
28. Ma J, Meng Y, Kwiatkowski DJ, Chen X, Peng H, Sun Q, et al.Mammalian target of rapamycin regulates murine and human celldifferentiation through STAT3/p63/Jagged/Notch cascade. J ClinInvest 2010;120:103–14.
29. Bhola P, Banerjee S, Mukherjee J, Balasubramanium A, Arun V, KarimZ, et al. Preclinical in vivo evaluation of rapamycin in humanmalignantperipheral nerve sheath explant xenograft. Int J Cancer 2010;126:563–71.
30. Scott RJ, Hall PA, Haldane JS, van Noorden S, Price Y, Lane DP, et al.A comparison of immunohistochemical markers of cell proliferationwith experimentally determined growth fraction. J Pathol 1991;165:173–8.
31. Bromley M, Rew D, Becciolini A, Balzi M, Chadwick C, Hewitt D, et al.A comparison of proliferation markers (BrdUrd, Ki-67, PCNA) deter-mined at each cell position in the crypts of normal human colonicmucosa. Eur J Histochem 1996;40:89–100.
32. Kordek R, Biernat W, Alwasiak J, Liberski PP. Proliferating cell nuclearantigen (PCNA) and Ki-67 immunopositivity in human astrocytictumours. Acta Neurochir (Wien) 1996;138:509–12.
33. Muskhelishvili L, Latendresse JR, Kodell RL, Henderson EB. Evalua-tion of cell proliferation in rat tissues with BrdU, PCNA, Ki-67(MIB-5)immunohistochemistry and in situ hybridization for histone mRNA. JHistochem Cytochem 2003;51:1681–8.
34. Shi Y, Yan H, Frost P, Gera J, Lichtenstein A. Mammalian target ofrapamycin inhibitors activate the AKT kinase in multiple myeloma cellsby up-regulating the insulin-like growth factor receptor/insulin recep-tor substrate-1/phosphatidylinositol 3-kinase cascade. Mol CancerTher 2005;4:1533–40.
35. Sun SY, Rosenberg LM,Wang X, Zhou Z, Yue P, Fu H, et al. Activationof Akt and eIF4E survival pathways by rapamycin-mediatedmammalian target of rapamycin inhibition. Cancer Res 2005;65:7052–8.
36. O’Reilly KE, Rojo F, She QB, Solit D, Mills GB, Smith D, et al. mTORinhibition induces upstream receptor tyrosine kinase signaling andactivates Akt. Cancer Res 2006;66:1500–8.
37. Wan X, Harkavy B, Shen N, Grohar P, Helman LJ. Rapamycin inducesfeedback activation of Akt signaling through an IGF-1R-dependentmechanism. Oncogene 2007;26:1932–40.
38. Johannessen CM, Johnson BW, Williams SM, Chan AW, Reczek EE,Lynch RC, et al. TORC1 is essential for NF1-associated malignancies.Curr Biol 2008;18:56–62.
39. Liu TJ, Koul D, LaFortune T, Tiao N, Shen RJ, Maira SM, et al. NVP-BEZ235, a novel dual phosphatidylinositol 3-kinase/mammalian tar-get of rapamycin inhibitor, elicits multifaceted antitumor activities inhuman gliomas. Mol Cancer Ther 2009;8:2204–10.
40. Maira SM, Stauffer F, Brueggen J, Furet P, Schnell C, Fritsch C, et al.Identification and characterization of NVP-BEZ235, a new orallyavailable dual phosphatidylinositol 3-kinase/mammalian target ofrapamycin inhibitor with potent in vivo antitumor activity. Mol CancerTher 2008;7:1851–63.
41. Schinkel AH, Wagenaar E, van Deemter L, Mol CA, Borst P. Absenceof the mdr1a P-Glycoprotein in mice affects tissue distribution and
Banerjee et al.
Mol Cancer Ther; 10(2) February 2011 Molecular Cancer Therapeutics290
Research. on March 14, 2020. © 2011 American Association for Cancermct.aacrjournals.org Downloaded from
Published OnlineFirst January 7, 2011; DOI: 10.1158/1535-7163.MCT-10-0654

pharmacokinetics of dexamethasone, digoxin, and cyclosporin A. JClin Invest 1995;96:1698–705.
42. Christians U, Strom T, Zhang YL, SteudelW, Schmitz V, Trump S, et al.Active drug transport of immunosuppressants: new insights for phar-macokinetics and pharmacodynamics. Ther Drug Monit 2006;28:39–44.
43. Zou CY, Smith KD, Zhu QS, Liu J, McCutcheon IE, Slopis JM, et al.Dual targeting of AKT andmammalian target of rapamycin: A potentialtherapeutic approach for malignant peripheral nerve sheath tumor.Mol Cancer Ther 2009;8:1157–68.
44. Kreisl TN, Lassman AB, Mischel PS, Rosen N, Scher HI, Teruya-Feldstein J, et al. Apilot studyof everolimusandgefitinib in the treatmentof recurrent glioblastoma (GBM). J Neurooncol 2009;92:99–105.
45. Sparagana SP, Wilkes DC, Thompson CE, Bowers DC. Optic nervetumor in tuberous sclerosis complex is not responsive to sirolimus.Pediatr Neurol 2010;42:443–6.
46. Kuhn JG, Chang SM, Wen PY, Cloughesy TF, Greenberg H, Schiff D,et al. Pharmacokinetic and tumor distribution characteristics of tem-sirolimus in patients with recurrent malignant glioma. Clin Cancer Res2007;13:7401–6.
47. Cloughesy TF, Yoshimoto K, Nghiemphu P, Brown K, Dang J, Zhu S,et al. Antitumor activity of rapamycin in a Phase I trial for patients withrecurrent PTEN-deficient glioblastoma. PLoS Med 2008;5:e8.
48. Franz DN, Leonard J, Tudor C, Chuck G, Care M, Sethuraman G, et al.Rapamycin causes regression of astrocytomas in tuberous sclerosiscomplex. Ann Neurol 2006;59: 490–8.
Rapamycin Inhibition of Nf1�/� Glial Cell Growth
www.aacrjournals.org Mol Cancer Ther; 10(2) February 2011 291
Research. on March 14, 2020. © 2011 American Association for Cancermct.aacrjournals.org Downloaded from
Published OnlineFirst January 7, 2011; DOI: 10.1158/1535-7163.MCT-10-0654

2011;10:279-291. Published OnlineFirst January 7, 2011.Mol Cancer Ther Sutapa Banerjee, Scott M. Gianino, Feng Gao, et al.
-Deficient AstrocytesNf1of Growth Inhibition in a Genetically Engineered Mouse Model Interpreting Mammalian Target of Rapamycin and Cell
Updated version
10.1158/1535-7163.MCT-10-0654doi:
Access the most recent version of this article at:
Material
Supplementary
http://mct.aacrjournals.org/content/suppl/2011/01/07/1535-7163.MCT-10-0654.DC1
Access the most recent supplemental material at:
Cited articles
http://mct.aacrjournals.org/content/10/2/279.full#ref-list-1
This article cites 48 articles, 18 of which you can access for free at:
Citing articles
http://mct.aacrjournals.org/content/10/2/279.full#related-urls
This article has been cited by 4 HighWire-hosted articles. Access the articles at:
E-mail alerts related to this article or journal.Sign up to receive free email-alerts
SubscriptionsReprints and
To order reprints of this article or to subscribe to the journal, contact the AACR Publications
Permissions
Rightslink site. (CCC)Click on "Request Permissions" which will take you to the Copyright Clearance Center's
.http://mct.aacrjournals.org/content/10/2/279To request permission to re-use all or part of this article, use this link
Research. on March 14, 2020. © 2011 American Association for Cancermct.aacrjournals.org Downloaded from
Published OnlineFirst January 7, 2011; DOI: 10.1158/1535-7163.MCT-10-0654