Interpreting Frequency Tables Constructing Categories.
30
Interpreting Frequency Tables Constructing Categories
-
Upload
tianna-cavell -
Category
Documents
-
view
217 -
download
1
Transcript of Interpreting Frequency Tables Constructing Categories.

Interpreting Frequency Tables
Constructing Categories

Frequency tables include:
A reorganization of raw data. A frequency count of observations
for each value in the data set or for groups of observations (categories)
Usually the percentage of observations in each category
The number of total observations in the table.

Categories are determined by the researcher.
Methods for choosing categories can include:
Based on how previous researchers have organized categories for this variable or on existing theories.
By visually scanning computer print-out to determine the range of values in the data set and how they are grouped.
By putting an equal number of observations in each category.
By using conventional “rules of thumb” to organize categories (for example, “under 18” or “65 and older”)

Two important rules for choosing categories are:
Categories must be mutually exclusive (no overlap between them – respondents should not have trouble choosing the right category)
Categories must be exhaustive (all possible categories should be chosen)

Are there problems with the following categories:
How satisfied are you with the services you have received?1) Very satisfied2) Satisfied3) Neutral4) Somewhat unsatisfied
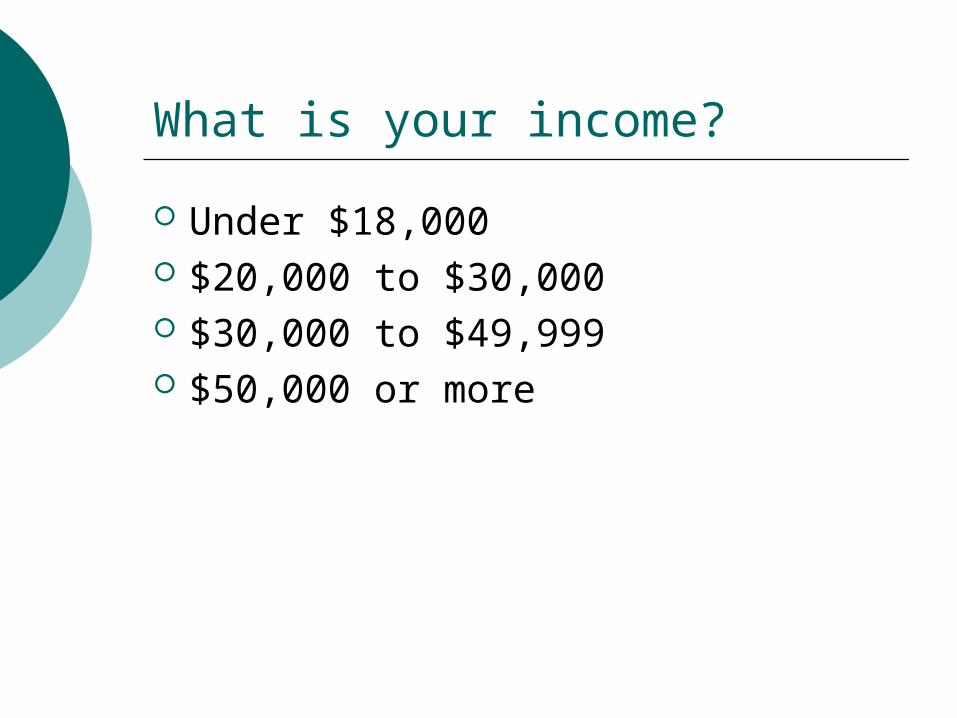
What is your income?
Under $18,000 $20,000 to $30,000 $30,000 to $49,999 $50,000 or more

Rewrite of income table:
Under $18,000 $18,000 - $19,999 $20,000 - $29,999 $30,000 - $49,999 $50,000 or more

What is the most important problem facing students today?
High tuition Large classes Finding jobs No problems

(Rewrite of student problem question)
What is the most important problem facing students today?1) High tuition2) Large classes3) Finding jobs4) No problems5) Other ______________________

Most tables contain percentages
Percentages represent the proportion of responses within each category.
Percentages help us make comparisons between categories. They are necessary because raw data may not be distributed equally among categories.
To calculate the percentage, you need to know the number of observations in the category and the total number of observations in the data set.

The formula for percentages
Percentage = f /N * 100%where f = the number of observations
in the category and N = the total number of observations in the data set.
N can also be described as the “base,” “total,” or universe.

Examples
1) People in poverty in Fresno County = 400,000
Total number of people in Fresno County = 1,000,000Percentage = ????
2) Of 100 people in the study, 35 were women? What percentage were women?

Example:
75 people completed a survey in New Jersey. They were asked to name the “Boss” of New Jersey. These were the results:
15 - Tony Soprano20 - the Governor of New Jersey35 - Bruce Springsteen 5 - Other What percentage of people responded in
each of the four categories?

Who’s the Boss? Boss of New Jersey Percentage
Bruce Springsteen 46.67%
Governor of New Jersey 26.67%
Tony Soprano 20.0%
Other 6.67%
Total 100.00%
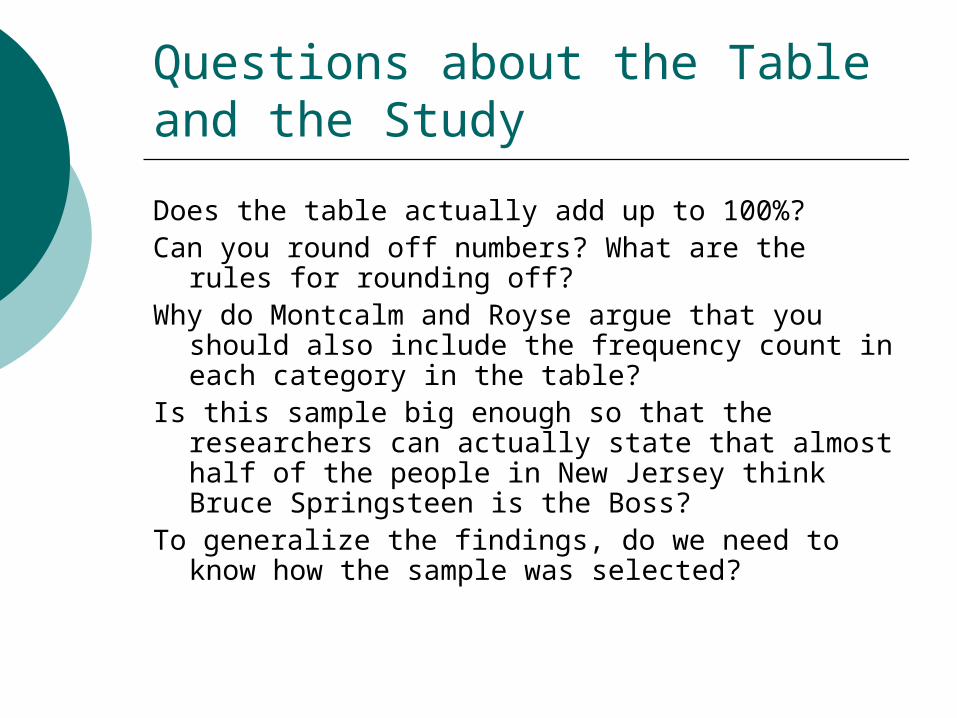
Questions about the Table and the Study
Does the table actually add up to 100%?Can you round off numbers? What are the rules for
rounding off?Why do Montcalm and Royse argue that you should
also include the frequency count in each category in the table?
Is this sample big enough so that the researchers can actually state that almost half of the people in New Jersey think Bruce Springsteen is the Boss?
To generalize the findings, do we need to know how the sample was selected?

Decision Rules
Decimals over 5 should be rounded up to the nearest number. For example, 6.67 should be rounded to 6.7.
9.5 should be rounded to 10You must tell SPSS if you want one or two
decimal places. SPSS automatically rounds the numbers in the table so that they total 100%. (Unless you change the specifications, SPSS will use two decimal places in all tables and statistical analyses.)

SPSS Tables include:
Values or categories. Percentages Valid Percent (Percentage in each
category minus any missing values in the data set)
Cumulative Percent (Starting with the first category, the percentage in each new category is added on to the total. This can be used in hand calculations to make sure that your totals are correct. It also helps if you are going to add categories together)

SPSS Table
RS HIGHEST DEGREE
189 10.2 10.2 10.2
947 51.3 51.3 61.5
132 7.1 7.1 68.7
386 20.9 20.9 89.6
193 10.4 10.4 100.0
1847 100.0 100.0
lt high school
high school
junior college
bachelor
graduate degree
Total
ValidFrequency Percent Valid Percent
CumulativePercent

Qualitative Data:
Requires that you collect data without using categories.
To analyze this data you create categories after the data is collected.

To do this, you use methods similar to those in quantitative research
Based on how previous researchers have organized categories for this variable or on existing theories.
By visually scanning your data (usually transcriptions of interviews or notes from your observations) to determine how responses are grouped.
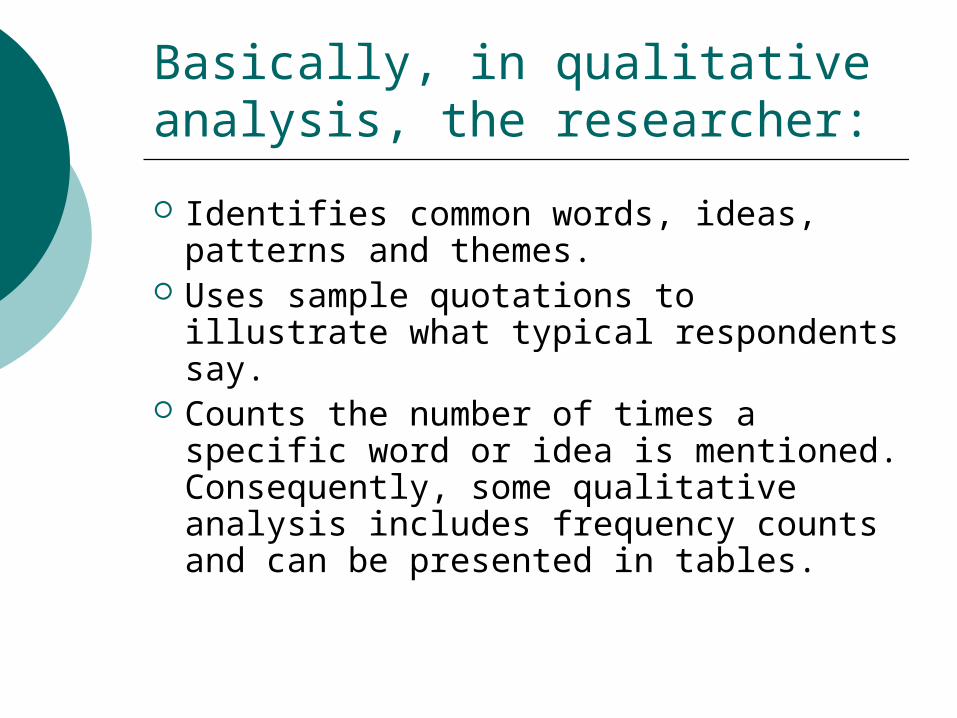
Basically, in qualitative analysis, the researcher:
Identifies common words, ideas, patterns and themes.
Uses sample quotations to illustrate what typical respondents say.
Counts the number of times a specific word or idea is mentioned. Consequently, some qualitative analysis includes frequency counts and can be presented in tables.
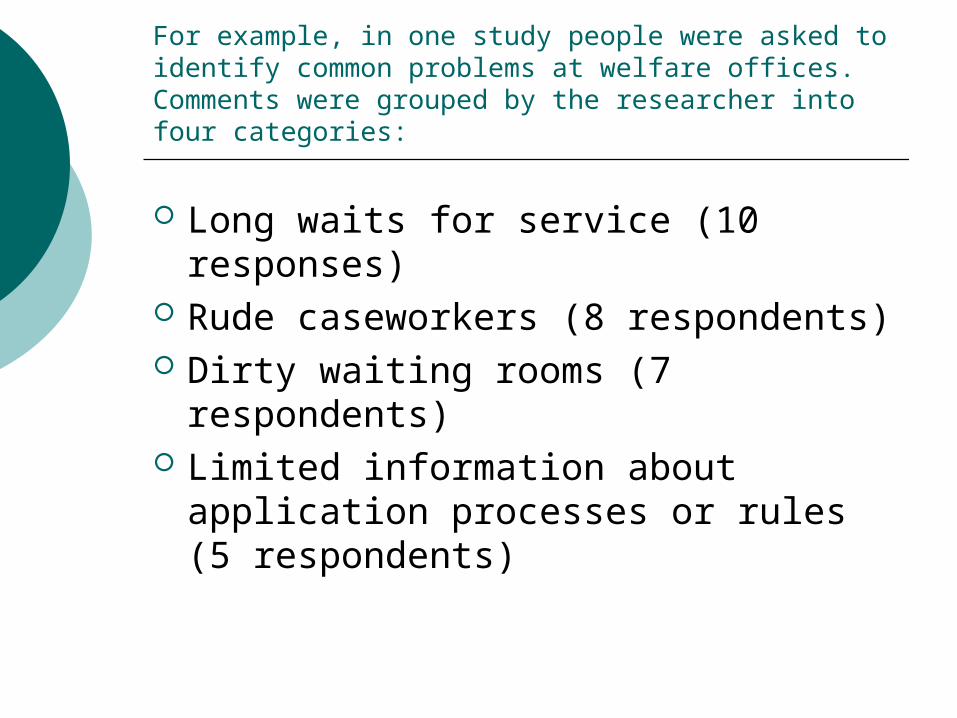
For example, in one study people were asked to identify common problems at welfare offices. Comments were grouped by the researcher into four categories:
Long waits for service (10 responses)
Rude caseworkers (8 respondents) Dirty waiting rooms (7 respondents) Limited information about
application processes or rules (5 respondents)

Fifteen people participated in this study. Do the results suggest that people made more than one comment about the welfare office?

It is necessary in qualitative analysis to:
Choose what will be your unit of measurement: words, phrases, sentences, or the entire set of comments a respondent made to one or a set of questions
Calculate the base (total) of all words, phrases, etc to be included in your total tally of responses. You do this to determine whether you have included all words or phrases etc. in your tally. Sometimes researchers will also calculate the percentage of time a response occurs.

Steps in Qualitative Analysis
Bring together all responses. Organize them so that you can
visually scan common elements. Put the common elements into
categories. (first level analysis) Identify whether there are common
themes and patterns among the different elements of the study (second level of analysis)
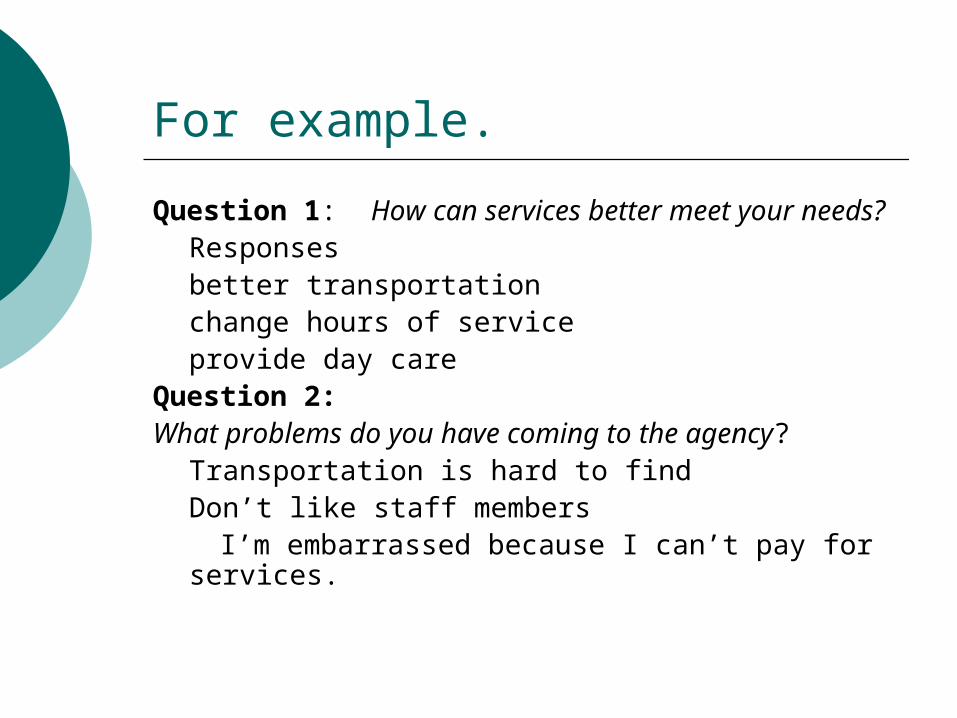
For example.
Question 1: How can services better meet your needs?Responses better transportationchange hours of serviceprovide day care
Question 2: What problems do you have coming to the agency?
Transportation is hard to findDon’t like staff members
I’m embarrassed because I can’t pay for services.

How to tell if you have qualitative data:
No categories for responses. Data collected through content
analysis, observation, or interviews ( In some cases quantitative
surveys may contain open-ended/no category responses. These questions are qualitative)
No intervention has been introduced.

For example, one type of interview involves a focus group.
Focus groups include 6 to 8 people plus a facilitator and a note taker.
Focus group interviews are usually taped.The facilitator asks 6 to 8 open-ended
questions. Group members volunteer responses. One response may build on another. Results usually generate a consensus about what the group perceives or feels about an issue.
Focus groups are often used in politics or marketing. They can be used to see how people view services or policies.

Example of Focus Group Questions:
1. Can you describe how you first became aware of your deafness?
2. How do you see yourself today, in terms of your deafness?
3. What does your deafness mean to you?
4. Can you describe any particularly difficult or traumatic experiences in your life related to your deafness?
5. Can you describe how you fit into deaf culture?
From Janesick, V. (1998). "Stretching" exercises for qualitative researchers. Thousand Oaks, CA: Sage, p. 75.

Remember that questions in qualitative research ask:
“How” questions “Why questions
Do not use questions that people can answer yes or no!!!


![Assumed Knowledge (Geometry and graphs)€¦ · C Polygons [4.1] D Symmetry [4.2] E Constructing triangles F Congruence [4.1] G Interpreting graphs and tables [11.1] Angles are described](https://static.fdocuments.in/doc/165x107/5f96632b4c6fb54e840ac411/assumed-knowledge-geometry-and-graphs-c-polygons-41-d-symmetry-42-e-constructing.jpg)