Interplay Ca2
9
Interplay of Ca 2 and cAMP Signaling in the Insulin-secreting MIN6 -Cell Line* □ S Received for publication, May 24, 2005, and in revised form, June 24, 2005 Published, JBC Papers in Press, June 29, 2005, DOI 10.1074/jbc.M505657200 Luis R. Landa, Jr.‡§, Mark Harbe ck‡§, Kelly Kaihara‡, Oleg Chepur ny¶, Kajorn Kitiphongspattana‡, Oliver Graf‡, Viacheslav O. Nikolaev , Martin J. Lohse, George G. Holz¶, and Michael W. Roe‡** From the ‡ Department of Medicine, The University of Chicago, Chicago, Illinois 60637, the ¶ Department of Physiology and Neuroscience, New York University School of Medicine, New York, New York 10016, and the Institute of Pharmacology and Toxicology, University of Wu ¨ rzburg, D-97078 Wu ¨ rzburg, Germany Ca 2 and cAMP are impo rtant second messenger s tha t regulate multiple cellular processes. Although previous studies have sug gested dire ct int era ctions between Ca 2 and cAMP signal ing pat hwa ys, the underl ying mechanisms remain unr eso lved. In part icular, dire ct ev- idence for Ca 2 -regul ate d cAMP product ion in livi ng cells is incomplete. Genetically encoded fluorescence resonance energy transfer-based biosensors have made possible real-time imaging of spatial and temporal gra- dients of intracellular cAMP concentration in single liv- ing cells. Here, we used confocal microscopy , fluore s- cence resonance energy transfer, and insulin-secreting MIN6 cells expre ssing Epac1-camps, a biosyn thetic uni- mol ecular cAMP indi cator, to bet ter understand the role of intrac ellula r Ca 2 in cAMP produc tion . We report that depolarization with high external K , tolbutamide, or glucose caused a rapid incr eas e in cAMP that was dependent on extra cellula r Ca 2 and inhibi ted by ni- trendipine, a Ca 2 channel blocker, or 2,5-dideoxyade- nosine, a P-site antagonist of transmembrane adenylate cyclases. Stimulation of MIN6 cells with glucose in the prese nce of tetra ethyla mmonium chloride gene rated concomitant Ca 2 and cAMP oscillations that were abol- ished in the absence of extracellular Ca 2 and blocked by 2,5-dideox yadeno sine or 3-isobutyl-1 -methylxan- thine, an inhibitor of phosphodiesterase. Simultaneous measurements of Ca 2 and cAMP concen tratio ns with Fura-2 and Epac1-camps, respectively, revealed a close temporal and causal interrelationship between the in- creases in cytoplasmic Ca 2 and cAMP levels following membrane depo lari zat ion. The se findings indi cate highly coordinat ed interplay betwe en Ca 2 and cAMP signa ling in electr ically excitable endocrine cells and suggest that Ca 2 -dependent cAMP oscillations are de- rived from an increase in adenylate cyclase activity and periodi c activat ion and inactivation of cAMP-hy drolyz- ing phosphodiesterase. Ca 2 and cAMP are ubiquitous second messengers that reg- ulate many cellular functions, including gene expression, pro- tein biosynthesis, and exocytosis. In eukaryote cells, Ca 2 and cAMP signaling cascades are interconnected and often exhibit subcellular concentration gradients that are spatially and tem- porally heterogeneous (1–4). Intracellular cAMP concentration can be affected by activation of Ca 2 -sens itive isoforms of ad- enylate cyclase (5–7) and phosphodiesterase (8, 9). Conversely, cAMP and protein kinase A modulation of Ca 2 channels and pla sma membra ne Ca 2 -ATPases inf lue nces Ca 2 signal transduction (4, 10–14). The way in which these dynamic sig- nals are integ rated in single cells remains unresolve d. Only two studies have reported measurements of both second mes sen ger sig nal ing pat hwa ys simult aneous ly in sin gle cell s (15 , 16). Co nc urre nt imaging of cAMP an d Ca 2 in C6- 2B glio ma cells and REF-52 fibroblasts loaded with FlCRhR, a recombinant flu- orescence reson ance energy transfer (FRET ) 1 -based cAMP indi- cator, and Fur a-2reveal ed tha t the increase in int rac ell ula r Ca 2 following appl icatio n of thap sigarg in and ionomycin causes a decrea se in isopr oteren ol-st imula ted cAMP accumu latio n in C6-2B glioma cells, but not in REF-52 fibroblasts (15). In Rana esculenta ventricular cells, simultaneous detection of cAMP with FlCRhR and who le cell L-typ e Ca 2 curren t by patch -clamp electrophysiology indicated that increases in cAMP production activate Ca 2 channel conductance (16). Spontaneous Ca 2 and cAMP increases have been observed in embryonic Xenopus neurons loade d with Fluo-4, a fluore scent Ca 2 indi ca to r, and Fl CRhR (17). Th e cell s gen erate three to fo ur pulse s of cAMP/ h, each lasting 3–7 min. cAMP accumu latio n app ear s to aff ect Ca 2 spiki ng; the frequ ency of spont aneou s Ca 2 transients (3–10/h) is increased by application of forskolin, an activator of adenylate cyclase (AC), and decreased by inhibi- tion of protein kinase A with KT5720. Stimulation of neurons with pulses (12/min) of forsk olin and 3-iso butyl- 1-met hylxan - thine (IBMX) also increases Ca 2 spike frequency. On the other hand, elimination of the spontaneous Ca 2 transients inhibits cAMP production , where as trans ient Ca 2 spi kes evo ked by pulses of 100 mM KCl generate cAMP transients in embryonic Xenopus neurons. Altho ugh these elegant studies suggested a role for AC and protein kinase A in mediating the cAMP-induced effects on Ca 2 signaling and confirmed that the formation of cAMP is Ca 2 -dependent, the temporal interrelationships were * This work was supported by research grants from the American Diabetes Association (to G. G. H. and M. W. R.) and by National Insti- tutes of Healt h Grant DK45817 (to G. G. H.) and Grant s DK6349 3, DK64162, and DK68822 (to M. W. R.). The costs of publication of this article were defrayed in part by the payment of page charges. This article must therefore be hereby marked “advertisement ” in accordance with 18 U.S.C. Section 1734 solely to indicate this fact. □ S The on-line version of this article (available at http://www.jbc.org) contains supplemental Fig. S1 and Table 1. § Both authors contributed equally to this work. ** To whom correspon dence should be addres sed: Dept. of Medici ne MC-1027, The University of Chicago, 5841 South Maryland Ave., Chi- cago, IL 60637. Tel.: 773-702-4965; Fax: 773-834 -0486; E-mail: mroe@ medicine.bsd.uchicago.edu. 1 The abbreviations used are: FRET, fluorescence resona nce energy transf er; AC, adenyl ate cyclas e; IBMX, 3-iso butyl -1-met hylxa nthi ne; ECFP, enhanced cyan fluorescent protein; EYFP, enhanced yellow flu- orescent protei n; [cAMP] c , cytopl asmic cAMP conce ntrat ion; [Ca 2 ] c , cytopl asmic Ca 2 conce ntrati on; DDA, 2,5-dideoxyadenosine; PDE, phosphodiesterase; TEA, tetraethylammonium chloride. THE JOURNAL OF BIOLOGICAL CHEMISTRY Vol. 280, No. 35, Issue of Septe mber 2, pp. 31294–31302 , 2005 © 2005 by The American Society for Biochemistry and Molecular Biology, Inc. Printed in U.S.A. This paper is available on line at http://www.jbc.org 31294 a t S U N Y U p s t a t e e d i c a l U i v e r s i t y L i b r a r y , o M a y 2 8 , 2 0 1 0 w w w . j b c o r g D o w n l o a d e d f r o m http://www.jbc.org/content/suppl/2005/07 /15/M505657200.DC1.html Supplemental Material can be found at:
Transcript of Interplay Ca2
8/6/2019 Interplay Ca2
http://slidepdf.com/reader/full/interplay-ca2 1/9
Interplay of Ca2 and cAMP Signaling in the Insulin-secretingMIN6 -Cell Line*□S
Received for publication, May 24, 2005, and in revised form, June 24, 2005Published, JBC Papers in Press, June 29, 2005, DOI 10.1074/jbc.M505657200
Luis R. Landa, Jr.‡§, Mark Harbeck‡§, Kelly Kaihara‡, Oleg Chepurny¶,
Kajorn Kitiphongspattana‡, Oliver Graf‡, Viacheslav O. Nikolaev, Martin J. Lohse,George G. Holz¶, and Michael W. Roe‡**
From the ‡ Department of Medicine, The University of Chicago, Chicago, Illinois 60637, the ¶ Department of Physiologyand Neuroscience, New York University School of Medicine, New York, New York 10016, and the Institute of Pharmacology and Toxicology, University of Wurzburg, D-97078 Wurzburg, Germany
Ca2 and cAMP are important second messengers that
regulate multiple cellular processes. Although previous
studies have suggested direct interactions between
Ca2 and cAMP signaling pathways, the underlyingmechanisms remain unresolved. In particular, direct ev-
idence for Ca2-regulated cAMP production in living
cells is incomplete. Genetically encoded fluorescence
resonance energy transfer-based biosensors have madepossible real-time imaging of spatial and temporal gra-dients of intracellular cAMP concentration in single liv-
ing cells. Here, we used confocal microscopy, fluores-
cence resonance energy transfer, and insulin-secreting
MIN6 cells expressing Epac1-camps, a biosynthetic uni-molecular cAMP indicator, to better understand the role
of intracellular Ca2 in cAMP production. We report
that depolarization with high external K, tolbutamide,
or glucose caused a rapid increase in cAMP that was
dependent on extracellular Ca2 and inhibited by ni-trendipine, a Ca2 channel blocker, or 2,5-dideoxyade-
nosine, a P-site antagonist of transmembrane adenylate
cyclases. Stimulation of MIN6 cells with glucose in the
presence of tetraethylammonium chloride generated
concomitant Ca
2
and cAMP oscillations that were abol-ished in the absence of extracellular Ca2 and blocked
by 2,5-dideoxyadenosine or 3-isobutyl-1-methylxan-
thine, an inhibitor of phosphodiesterase. Simultaneous
measurements of Ca2 and cAMP concentrations with
Fura-2 and Epac1-camps, respectively, revealed a closetemporal and causal interrelationship between the in-
creases in cytoplasmic Ca2 and cAMP levels following
membrane depolarization. These findings indicate
highly coordinated interplay between Ca2 and cAMP
signaling in electrically excitable endocrine cells andsuggest that Ca2-dependent cAMP oscillations are de-
rived from an increase in adenylate cyclase activity and
periodic activation and inactivation of cAMP-hydrolyz-
ing phosphodiesterase.
Ca2 and cAMP are ubiquitous second messengers that reg-
ulate many cellular functions, including gene expression, pro-
tein biosynthesis, and exocytosis. In eukaryote cells, Ca2 and
cAMP signaling cascades are interconnected and often exhibit
subcellular concentration gradients that are spatially and tem-
porally heterogeneous (1–4). Intracellular cAMP concentration
can be affected by activation of Ca2-sensitive isoforms of ad-
enylate cyclase (5–7) and phosphodiesterase (8, 9). Conversely,cAMP and protein kinase A modulation of Ca2 channels and
plasma membrane Ca2-ATPases influences Ca2 signal
transduction (4, 10–14). The way in which these dynamic sig-
nals are integrated in single cells remains unresolved.
Only two studies have reported measurements of both second
messenger signaling pathways simultaneously in single cells (15,
16). Concurrent imaging of cAMP and Ca2 in C6-2B glioma cells
and REF-52 fibroblasts loaded with FlCRhR, a recombinant flu-
orescence resonance energy transfer (FRET)1-based cAMP indi-
cator, and Fura-2 revealed that the increase in intracellular Ca2
following application of thapsigargin and ionomycin causes a
decrease in isoproterenol-stimulated cAMP accumulation in
C6-2B glioma cells, but not in REF-52 fibroblasts (15). In Rana
esculenta ventricular cells, simultaneous detection of cAMP withFlCRhR and whole cell L-type Ca2 current by patch-clamp
electrophysiology indicated that increases in cAMP production
activate Ca2 channel conductance (16).
Spontaneous Ca2 and cAMP increases have been observed in
embryonic Xenopus neurons loaded with Fluo-4, a fluorescent
Ca2 indicator, and FlCRhR (17). The cells generate three to four
pulses of cAMP/h, each lasting 3–7 min. cAMP accumulation
appears to affect Ca2 spiking; the frequency of spontaneous
Ca2 transients (3–10/h) is increased by application of forskolin,
an activator of adenylate cyclase (AC), and decreased by inhibi-
tion of protein kinase A with KT5720. Stimulation of neurons
with pulses (12/min) of forskolin and 3-isobutyl-1-methylxan-
thine (IBMX) also increases Ca2 spike frequency. On the other
hand, elimination of the spontaneous Ca2 transients inhibits
cAMP production, whereas transient Ca2 spikes evoked by
pulses of 100 mM KCl generate cAMP transients in embryonic
Xenopus neurons. Although these elegant studies suggested a
role for AC and protein kinase A in mediating the cAMP-induced
effects on Ca2 signaling and confirmed that the formation of
cAMP is Ca2-dependent, the temporal interrelationships were
* This work was supported by research grants from the AmericanDiabetes Association (to G. G. H. and M. W. R.) and by National Insti-tutes of Health Grant DK45817 (to G. G. H.) and Grants DK63493,DK64162, and DK68822 (to M. W. R.). The costs of publication of thisarticle were defrayed in part by the payment of page charges. Thisarticle must therefore be hereby marked “advertisement” in accordancewith 18 U.S.C. Section 1734 solely to indicate this fact.□S The on-line version of this article (available at http://www.jbc.org)
contains supplemental Fig. S1 and Table 1.§ Both authors contributed equally to this work.** To whom correspondence should be addressed: Dept. of Medicine
MC-1027, The University of Chicago, 5841 South Maryland Ave., Chi-cago, IL 60637. Tel.: 773-702-4965; Fax: 773-834-0486; E-mail: [email protected].
1 The abbreviations used are: FRET, fluorescence resonance energytransfer; AC, adenylate cyclase; IBMX, 3-isobutyl-1-methylxanthine;ECFP, enhanced cyan fluorescent protein; EYFP, enhanced yellow flu-orescent protein; [cAMP]
c, cytoplasmic cAMP concentration; [Ca2]
c,
cytoplasmic Ca2 concentration; DDA, 2,5-dideoxyadenosine; PDE,phosphodiesterase; TEA, tetraethylammonium chloride.
THE JOURNAL OF BIOLOGICAL CHEMISTRY Vol. 280, No. 35, Issue of September 2, pp. 31294–31302, 2005 © 2005 by The American Society for Biochemistry and Molecular Biology, Inc. Printed in U.S.A.
This paper is available on line at http://www.jbc.org31294
http://www.jbc.org/content/suppl/2005/07/15/M505657200.DC1.htmlSupplemental Material can be found at:
8/6/2019 Interplay Ca2
http://slidepdf.com/reader/full/interplay-ca2 2/9
not directly established in these experiments because the two
signals were not measured simultaneously.
We sought to better understand the temporal and causal
interrelationships between Ca2 and cAMP signals by real-
time imaging. To accomplish this, we developed a new meth-
odology that allows simultaneous measurements of Ca2 and
cAMP in single cells. We show in insulin-secreting MIN6
-cells expressing Epac1-camps, a biosynthetic FRET-based
cAMP sensor (18), and loaded with the Ca2 indicator Fura-2
(19) that cAMP and Ca2 signals are tightly coupled. The datasuggest that increased production of cAMP following stimula-
tion with secretagogues is dependent on Ca2 influx through
L-type voltage-dependent Ca2 channels. We also observed
rapid and transient Ca2-induced cAMP oscillations. Our find-
ings indicate that Ca2 and cAMP signals interact as a coordi-
nated network capable of producing diverse temporal signaling
patterns in electrically excitable endocrine cells.
EXPERIMENTAL PROCEDURES
Cell Culture—MIN6 cells (passages 18–30) were grown in Dulbecco’s
modified Eagle’s medium supplemented with 10% heat-inactivated fe-tal bovine serum, 1 mM L-glutamine, 100 units/ml penicillin, 10 g/mlstreptomycin, and 55 M -mercaptoethanol and maintained in a hu-
midified incubator with 95% air and 5% CO2
at 37 °C.
Transfections—One day before transfection, MIN6 cells (5 105
cells) were plated on uncoated and sterilized 25-mm circular glass
coverslips in 6-well tissue culture plates and maintained in completeDulbecco’s modified Eagle’s medium. Cells were transiently transfectedwith 1 g of plasmid encoding Epac1-camps (18) using Lipofectamine
2000 (Invitrogen) following the manufacturer’s instructions. Transfec-tion efficiencies ranged between 5 and 20%.
FRET Measurements and Ca 2 Imaging—Imaging experiments were
conducted 48–96 h after transfection. The growth medium was removedand replaced with Krebs-Ringer bicarbonate solution containing 119mM NaCl, 4.7 mM KCl, 2.5 mM CaCl
2, 1 mM MgCl
2, 1 mM KH
2PO
4, 25
mM NaHCO3
or 10 mM HEPES-NaOH (pH 7.40), and 2 mM glucose.Coverslips were placed into a heated microperifusion chamber mountedon the specimen stage of an inverted fluorescence microscope (NikonTE-2000U) equipped with a CARV spinning disk confocal system (Atto
Bioscience Inc.). Cells were constantly superfused with Krebs-Ringerbicarbonate solution (2–5 ml/min) at 37 °C. For imaging Epac1-camps
FRET, cells were visualized with a Nikon Super Fluor 40 oil immer-sion or Nikon Plan Apo 60 oil immersion objective. The Epac1-campsexcitation wavelength was 440 nm and was attenuated 50–90% usingneutral density filters. Dual emission ratio imaging at 485 nm (FRET
donor, enhanced cyan fluorescent protein (ECFP)) and 535 nm (FRETacceptor, enhanced yellow fluorescent protein (EYFP)) was accom-plished using a computer-controlled high speed filter wheel (Lambda
10-2 optical filter changer, Sutter Instrument Co., Novato, CA); thetime for changing emission filters was 60–80 ms. Images (50–250-msexposure) were captured with a 16-bit Cascade 650 digital camera
(Roper Instruments) at 10-s intervals. Epac1-camps FRET decreaseswith increasing cAMP concentration; an increase in the 485/535 nmFRET emission ratio is indicative of an increase in cytoplasmic cAMPconcentration ([cAMP]
c) (18).
For simultaneous measurements of intracellular Ca2 and cAMPlevels, we used Fura-2 to detect cytoplasmic Ca2 concentration([Ca2]
c) (19). Spectral separation of Epac1-camps and Fura-2 excita-
tion and emission permits simultaneous imaging of [cAMP]c
and [Ca2]c
in single cells. The combination of Fura-2 and the FRET-based Ca2
biosensor D1ER, which consists of ECFP and citrine (a variant of
EYFP), has been used by Tsien and co-workers (20) to simultaneouslymeasure [Ca2]
cand endoplasmic reticulum Ca2 concentration in
HeLa and MCF-7 cells. For concurrent [cAMP]c
and [Ca2]c
measure-
ments, MIN6 cells transiently transfected with Epac1-camps wereloaded with 500 nM Fura-2 acetoxymethyl ester (Molecular Probes, Inc.)for 15–20 min at 37 °C. A Nikon Super Fluor 40 oil immersion objec-
tive was used for these studies. 340- and 380-nm excitation filters anda 530-nm emission filter were used for Fura-2 dual excitation ratioimaging. A 455-nm dichroic filter (Chroma Technology Corp.) was usedfor Epac1-camps and Fura-2. Loading cells with Fura-2 acetoxymethyl
ester did not affect maximum Epac1-camps responses following appli-cation of 10 M forskolin and 100 M IBMX, and conversely, Fura-2detection of Ca2 was not affected by Epac1-camps. Imaging data ac-
quisition and analysis were accomplished using MetaMorph/MetaFluor
software (Universal Imaging Corp.) and OriginPro 7E (OriginLabCorp.). Emission intensities were background-subtracted. Data are ex-pressed as the ratio of FRET donor and acceptor emission (485/535 nm
ratio) and the Fura-2 340 and 380 nm excitation (340/380 nm ratio). Inaddition, data were normalized to the average base-line values of the485/535 and 340/380 nm ratios (485/535 and 340/380 nm relative ratios,
respectively) to facilitate comparisons between responses in differentcells. Data summaries are expressed as means S.E.
PCR and Nucleotide Sequence Analysis—Total RNA from MIN6 cells
was extracted using an RNeasy kit (Qiagen Inc.). The RNA quality and
quantity were determined in an Ultrospec 3000 spectrophotometer(Amersham Biosciences, Cambridge, UK). First-strand cDNA was gen-
erated with a reverse transcription system kit (Promega Corp., Madi-son, WI) using oligo(dT) primers following the manufacturer’s protocol.Specific cDNA sequences were amplified in GeneAmp PCR System 9700
(Applied Biosystems, Foster City, CA) using REDTaq ReadyMix PCRReaction Mix (Sigma). Amplified PCR products were run on 1.2% aga-rose gel and further characterized by DNA sequencing and BLASTanalysis against the GenBankTM Data Bank.
RESULTS
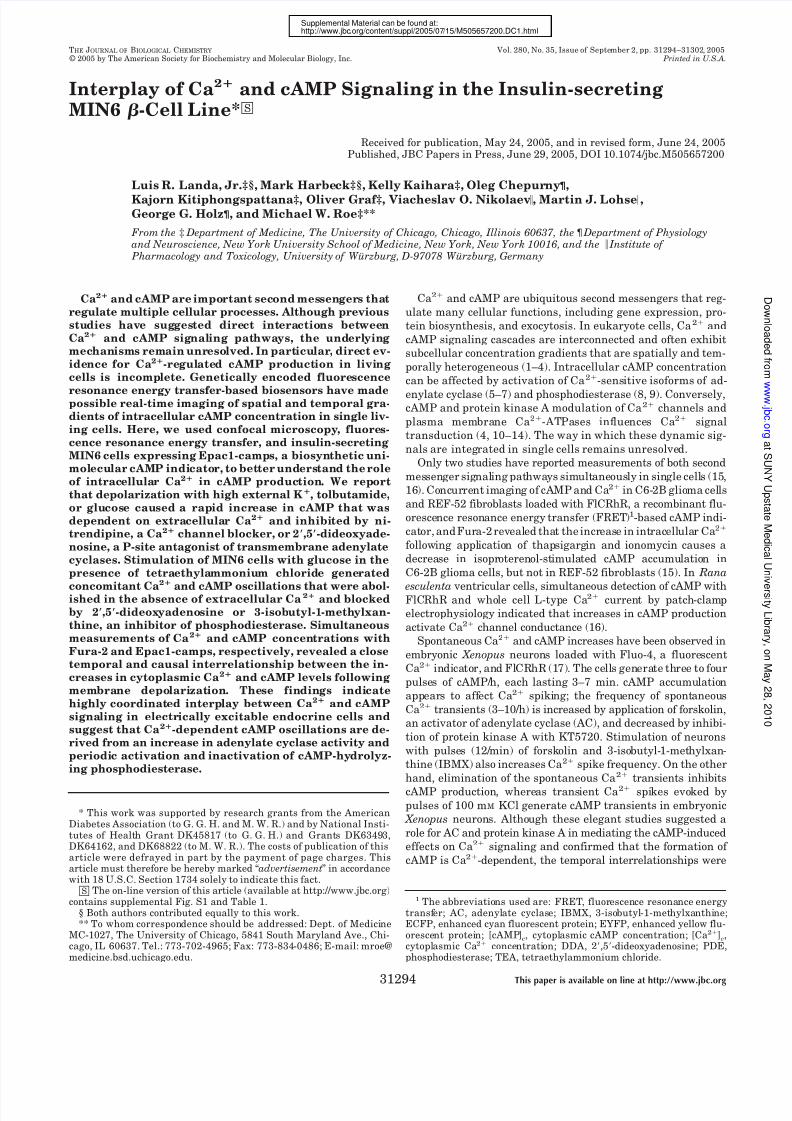
cAMP Biosensor Expression and Function in MIN6
Cells—We transfected MIN6 cells with Epac1-camps, a biosyn-
thetic FRET-based sensor that contains a single cAMP-binding
domain of human Epac1 (exchange protein directly activated
by cAMP 1) fused between ECFP and EYFP (18). Fluorescence
from individual cells was easily detected 24 h after transfec-tion. The intensity of fluorescence emission from ECFP and
EYFP was 2–8-fold higher than autofluorescence from un-
transfected cells. As in Chinese hamster ovary cells and mouse
primary neurons and peritoneal macrophages (18), Epac1-
camps was distributed throughout the cytoplasm and excluded
from the nucleus in MIN6 cells (Fig. 1 A).
The unimolecular biosynthetic cAMP indicators, including
Epac1-camps, Epac2-camps, ICUE1, ICUE2, and cyan fluores-
cent protein-Epac-yellow fluorescent protein (18, 21, 22), rely on
cAMP-dependent FRET between chromophores of two mutants
of green fluorescent protein as the basis for optical measure-
ments of intracellular cAMP gradients. The green fluorescent
protein mutants in Epac1-camps are ECFP and EYFP. Binding
of cAMP to Epac induces a conformational change in Epac1-
camps that increases the distance between ECFP and EYFP. As
[cAMP]c
rises, FRET between ECFP and EYFP declines, causing
fluorescence emission from ECFP to increase and from EYFP to
decrease. The ratio of ECFP (FRET donor) and EYFP (FRET
acceptor) fluorescence emission is indicative of [cAMP]c. FRET
between ECFP and EYFP in individual MIN6 cells was meas-
ured by spinning disk confocal microscopy. We observed hetero-
geneity of the FRET emission intensity ratio in unstimulated
cells (Fig. 1 A). This raises the possibility that the FRET ratio
heterogeneity might reflect regional variation in [cAMP]c
and
suggests that MIN6 -cell cAMP is regulated by different mech-
anisms in distinct subregions. More work will need to be done to
explore these hypotheses.
We tested the function of the sensor by measuring responses
to reagents that stimulate cAMP production. Approximately6 0 s (n 20 cells) after application of 10 nM exendin-4, a
glucagon-like peptide-1 receptor agonist that increases cAMP,
Epac1-camps FRET decreased (Fig. 1 B), and the FRET donor/
acceptor emission ratio increased (Fig. 1C). The FRET ratio
increased to maximum levels that were 20–30% greater than
base-line values (Fig. 1 D). A similar response was elicited by 10
M forskolin, an activator of AC (Fig. 1 E).
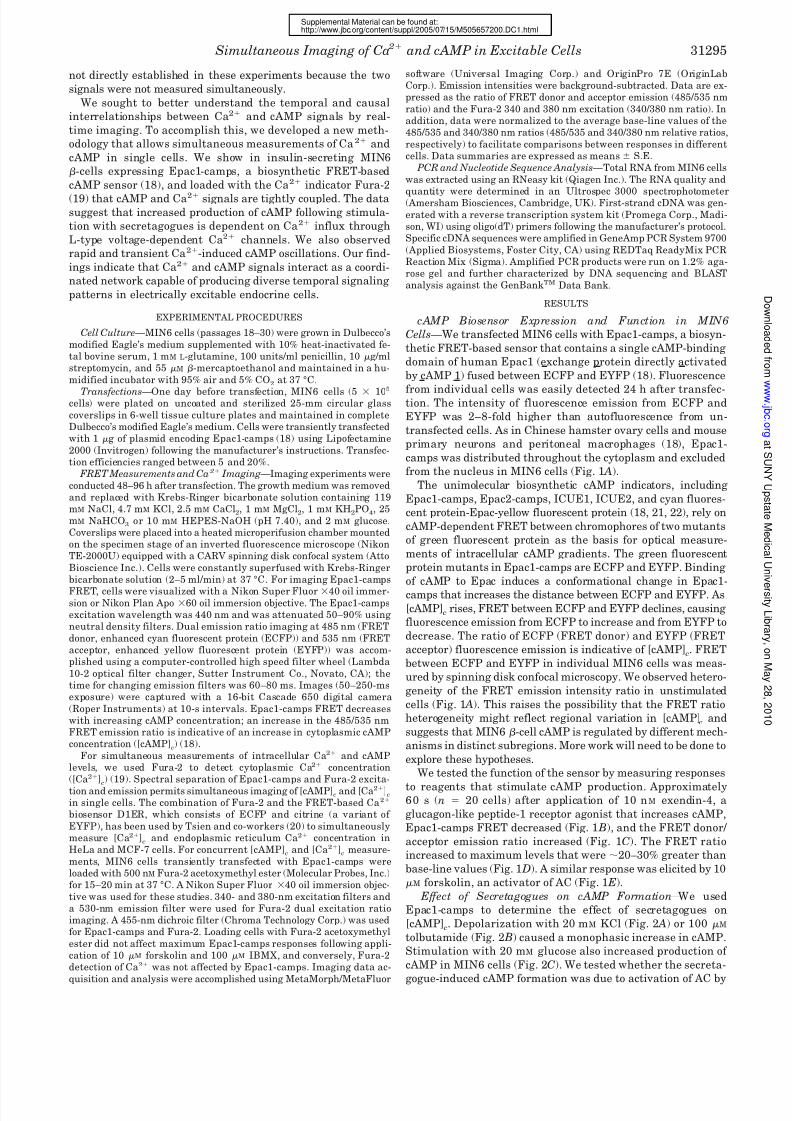
Effect of Secretagogues on cAMP Formation—We used
Epac1-camps to determine the effect of secretagogues on
[cAMP]c. Depolarization with 20 mM KCl (Fig. 2 A) or 100 M
tolbutamide (Fig. 2 B) caused a monophasic increase in cAMP.
Stimulation with 20 mM glucose also increased production of
cAMP in MIN6 cells (Fig. 2C). We tested whether the secreta-
gogue-induced cAMP formation was due to activation of AC by
Simultaneous Imaging of Ca 2 and cAMP in Excitable Cells 31295
http://www.jbc.org/content/suppl/2005/07/15/M505657200.DC1.htmlSupplemental Material can be found at:
8/6/2019 Interplay Ca2
http://slidepdf.com/reader/full/interplay-ca2 3/9
measuring the effect of 2,5-dideoxyadenosine (DDA), a P-site
inhibitor of membrane-bound AC isoforms. DDA inhibited
cAMP formation stimulated by high K
, tolbutamide, and glu-cose by 62, 63, and 66%, respectively (Fig. 2 D).
Role of Calcium in cAMP Production in MIN6 Cells—Be-
cause it is well known that secretagogue stimulation in-
creases [Ca2]c, we next determined whether the cAMP re-
sponses are Ca2-dependent. The increases in [cAMP]c
evoked by KCl (Fig. 3 A), tolbutamide (Fig. 3 B), and glucose
(Fig. 3C) were abolished by removal of extracellular Ca2 and
by nitrendipine, a blocker of L-type voltage-dependent Ca2
channels. Curve integration analysis indicated that cAMP
production by high K , tolbutamide, and glucose was reduced
by 114, 83, and 97%, respectively, when experiments were
conducted in Ca2-free solutions (Fig. 3 E). Ca2 channel
blockade with nitrendipine inhibited secretagogue-induced
cAMP accumulation to similar levels (Fig. 3 E). The contribu-
tion of intracellular Ca2 store discharge to cAMP production
was also assessed. Application of carbachol, a muscarinic
agonist that stimulates inositol 1,4,5-trisphosphate forma-tion and release of Ca2 sequestered within the endoplasmic
reticulum, in either the presence or absence of extracellular
Ca2 increased cAMP formation to levels 10–20% of those
caused by high K or tolbutamide (Fig. 3, D and E). In some
cells bathed in Ca2-free solutions, carbachol evoked a tran-
sient decrease in cAMP (17 of 48 cells), suggesting that
transient release of Ca2 from the endoplasmic reticulum
activates phosphodiesterase (PDE) or inhibits AC. Reconsti-
tution of extracellular Ca2 following intracellular Ca2
store depletion by carbachol stimulation in Ca2-free solu-
tions increased cAMP production (data not shown), suggest-
ing a role of Ca2 entry through store-operated Ca2 chan-
nels in mediating cAMP signaling in MIN6 cells. Our data
indicate that secretagogue-induced elevation of cAMP con-
FIG. 1. cAMP biosensor expression and function in MIN6 cells. A, confocal images of MIN6 cells transiently expressing Epac1-camps.Distribution of the biosensor was cytoplasmic and excluded from the nucleus and other organelles. The pseudo-colored display of the FRET donor( 485 nm panel) and acceptor (535 nm panel) emission intensity ratio ( Ratio 485/535 panel) suggests regional variation in [cAMP]
c. The color bar
depicts the range of 485/535 nm ratio values. Scale bar 10 m. B–D, kinetics of the Epac1-camps response in the same MIN6 cell. B,time-dependent change in Epac1-camps FRET donor (ECFP; FL485) and acceptor (EYFP; FL535) fluorescence after application of 10 nM exendin-4.Traces illustrate the average fluorescence intensity of Epac1-camps FRET recorded at 485 nm (blue) and 535 nm ( green) from a single MIN6 cellby confocal microscopy. Note that the fluorescence signals moved in opposite directions: ECFP fluorescence increased and EYFP decreased afterstimulation with exendin-4, reflecting a decrease in FRET. C, FRET donor/acceptor fluorescence emission ratio ( FL485/535) measured in the cellfrom A. The increase in the ratio indicates an increase in [cAMP]
c. D, amplitude of the Epac1-camps response relative to the base line. Data are
expressed as the FRET donor/acceptor fluorescence emission ratio at 485/535 nm normalized to the average base-line ratio values measured 1 minbefore stimulation (485/535 nm relative ratio). E, kinetics of cAMP production in a single MIN6 cell following application of forskolin (10 M; FSK ).Note that both exendin-4 and forskolin induced a monophasic increase in [cAMP]
c. Results are representative of 22 cells for each treatment.
Simultaneous Imaging of Ca 2 and cAMP in Excitable Cells31296
http://www.jbc.org/content/suppl/2005/07/15/M505657200.DC1.htmlSupplemental Material can be found at:
8/6/2019 Interplay Ca2
http://slidepdf.com/reader/full/interplay-ca2 4/9
centration is a Ca2-dependent signaling event requiring the
influx of Ca2 through voltage-gated Ca2 channels and sug-
gest that mobilization of endoplasmic reticulum Ca2 stores
plays a limited role in cAMP production.
Simultaneous Imaging of Cytoplasmic Calcium and
cAMP—We determined the temporal interrelationships be-
tween cAMP and Ca2 signaling by concurrent imaging of
Epac1-camps FRET and Fura-2 dual wavelength ratiometric
excitation microscopy. Fura-2 and Epac1-camps fluorescence
was easily distinguished in MIN6 cells (Fig. 4 A). In five inde-
pendent experiments (n 24 cells), stimulation with forskolin
increased [cAMP]c and caused little or no change in [Ca2]c(Fig. 4 B). The magnitude and temporal pattern of the forskolin-
induced cAMP response in cells loaded with the Ca2 indicator
were similar to those observed in cells expressing only Epac1-
camps (Fig. 1 E), indicating that the presence of Fura-2 did notaffect cAMP biosensor function or interfere with Ca2-depend-
ent cAMP production.
Application of 20 mM KCl increased both [Ca2]c
and
[cAMP]c. The Ca2 response preceded cAMP accumulation in
every cell we imaged (n 43) (Fig. 4C). The amount of time
before the initial rises in [Ca2]c
and [cAMP]c
was significantly
different, occurring 47 5 and 115 9 s ( p 0.001), respec-
tively, following addition of high K . Both signals rose to a new
steady-state concentration and returned to base-line levels af-
ter K was lowered. Similar monophasic responses were elic-
ited by 100 M tolbutamide (Fig. 4 D), a sulfonylurea drug
that increases [Ca2]c
by activating -cell Ca2 influx through
voltage-dependent Ca2 channels consequent to closure of
ATP-sensitive K
channels and membrane depolarization.
The rise in [cAMP]c
induced by tolbutamide lagged signifi-
cantly behind the increase in [Ca2]c
(59 5 and 35 5 s,
respectively (n 15 cells); p 0.001). Glucose stimulation also
increased [cAMP]c; the delay between the Ca2 and cAMP
elevation was not statistically significant (264 12 and 262
14 s for [cAMP]c
and [Ca2]c, respectively (n 34 cells); p
0.05) (Fig. 4 E).
Interplay between Intracellular Calcium and cAMP Oscilla-
tions—The data indicate a close temporal and causal interre-
lationship between increases in [Ca2]c
and cAMP accumula-
tion. This raises the possibility that Ca2 oscillations elicit
cAMP oscillations. In -cells, stable and voltage-dependent
Ca2 oscillations with periodicities ranging between 0.5 and
10/min can be generated by glucose and other secretagogues.
The combination of glucose stimulation in the presence of tet-
raethylammonium chloride (TEA), an inhibitor of K
channels,induces depolarization-dependent Ca2 oscillations in rodent
islets of Langerhans and insulin-secreting -cell-like cell lines
(23, 24). Application of 20 mM glucose and 20 mM TEA elicited
rapid oscillations in [Ca2]c
and [cAMP]c
(Fig. 5 A). The mean
S.E. frequency of the coupled Ca2 and cAMP oscillations was
0.50 0.02/min (30.2 1.2/h, n 32 cells). Ca2 oscillations
were characterized by transient increases that returned to near
base-line levels during the interspike phase. However, cAMP
oscillations did not return to base-line levels. The transient
spikes in [Ca2]c
coincided with rapid decreases in [cAMP]c
(Fig. 5 B). During the quiescent period between Ca2 oscilla-
tions, [cAMP]c
gradually increased (Fig. 5 B). To ascertain the
role of extracellular Ca2 in regulating [cAMP]c oscillations, we
superfused the cells with Ca2
-free solutions (Fig. 5C) or ap-
FIG. 2. Effect of secretagogues on cAMP formation. A–C, effects of 20 mM KCl, 100 M tolbutamide (TB), and 20 mM glucose, respectively,on cAMP accumulation in the presence (blue lines) and absence ( green lines) of 50 M DDA, an inhibitor of membrane-bound adenylate cyclases.Cells were exposed to DDA 2–5 min prior to application of secretagogues. D, comparison of dynamic cAMP production following stimulation withsecretagogues. Data are expressed as means S.E. (n 12 cells) of the area under the 485/535 nm relative ratio curve ( AUC) recorded during an8-min (KCl or tolbutamide) or a 10-min (glucose) application of the stimulus ( green bars). The effect of DDA (blue bars) and the statisticalsignificance of comparisons with control responses for each stimulus are depicted. ***, p 0.001.
Simultaneous Imaging of Ca 2 and cAMP in Excitable Cells 31297
http://www.jbc.org/content/suppl/2005/07/15/M505657200.DC1.htmlSupplemental Material can be found at:
8/6/2019 Interplay Ca2
http://slidepdf.com/reader/full/interplay-ca2 5/9
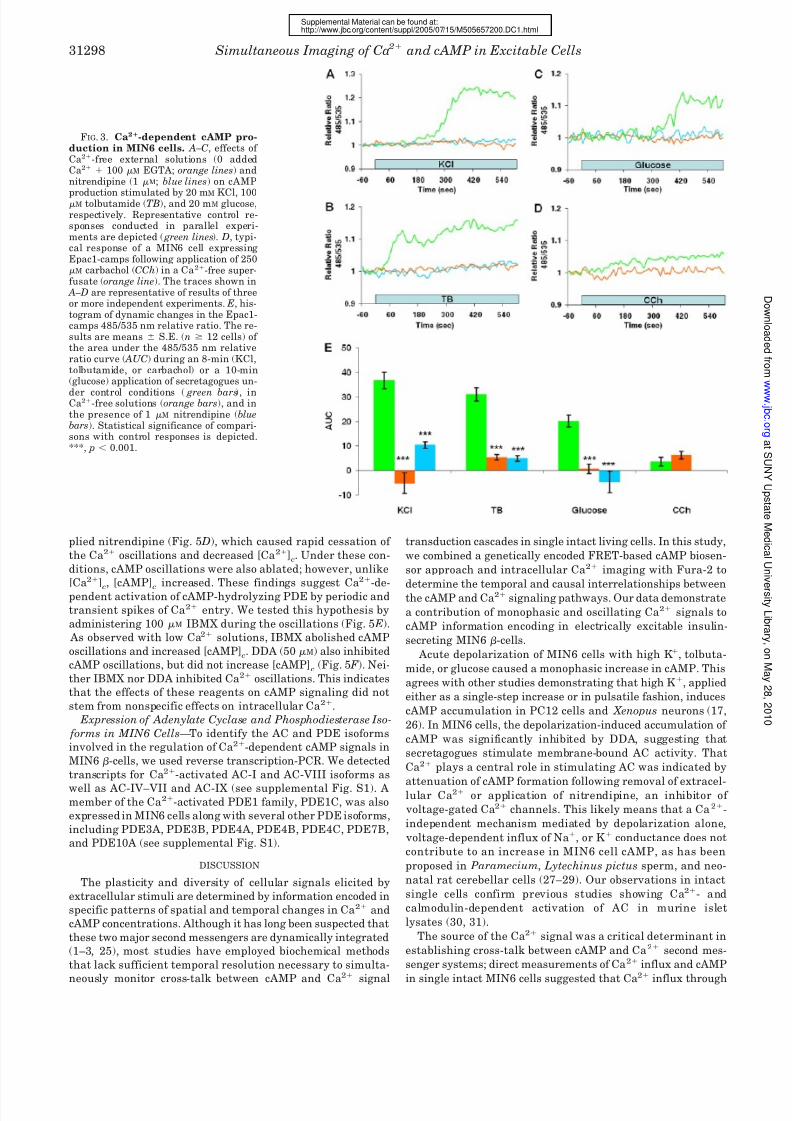
plied nitrendipine (Fig. 5 D), which caused rapid cessation of
the Ca2 oscillations and decreased [Ca2]c. Under these con-
ditions, cAMP oscillations were also ablated; however, unlike
[Ca2]c, [cAMP]
cincreased. These findings suggest Ca2-de-
pendent activation of cAMP-hydrolyzing PDE by periodic and
transient spikes of Ca2 entry. We tested this hypothesis by
administering 100 M IBMX during the oscillations (Fig. 5 E).
As observed with low Ca2 solutions, IBMX abolished cAMP
oscillations and increased [cAMP]c. DDA (50 M) also inhibited
cAMP oscillations, but did not increase [cAMP]c
(Fig. 5 F ). Nei-
ther IBMX nor DDA inhibited Ca2 oscillations. This indicates
that the effects of these reagents on cAMP signaling did not
stem from nonspecific effects on intracellular Ca2.
Expression of Adenylate Cyclase and Phosphodiesterase Iso-
forms in MIN6 Cells—To identify the AC and PDE isoforms
involved in the regulation of Ca2-dependent cAMP signals in
MIN6 -cells, we used reverse transcription-PCR. We detected
transcripts for Ca2-activated AC-I and AC-VIII isoforms as
well as AC-IV–VII and AC-IX (see supplemental Fig. S1). Amember of the Ca2-activated PDE1 family, PDE1C, was also
expressed in MIN6 cells along with several other PDE isoforms,
including PDE3A, PDE3B, PDE4A, PDE4B, PDE4C, PDE7B,
and PDE10A (see supplemental Fig. S1).
DISCUSSION
The plasticity and diversity of cellular signals elicited by
extracellular stimuli are determined by information encoded in
specific patterns of spatial and temporal changes in Ca2 and
cAMP concentrations. Although it has long been suspected that
these two major second messengers are dynamically integrated
(1–3, 25), most studies have employed biochemical methods
that lack sufficient temporal resolution necessary to simulta-
neously monitor cross-talk between cAMP and Ca2
signal
transduction cascades in single intact living cells. In this study,
we combined a genetically encoded FRET-based cAMP biosen-
sor approach and intracellular Ca2 imaging with Fura-2 to
determine the temporal and causal interrelationships betweenthe cAMP and Ca2 signaling pathways. Our data demonstrate
a contribution of monophasic and oscillating Ca2 signals to
cAMP information encoding in electrically excitable insulin-
secreting MIN6 -cells.
Acute depolarization of MIN6 cells with high K , tolbuta-
mide, or glucose caused a monophasic increase in cAMP. This
agrees with other studies demonstrating that high K , applied
either as a single-step increase or in pulsatile fashion, induces
cAMP accumulation in PC12 cells and Xenopus neurons (17,
26). In MIN6 cells, the depolarization-induced accumulation of
cAMP was significantly inhibited by DDA, suggesting that
secretagogues stimulate membrane-bound AC activity. That
Ca2 plays a central role in stimulating AC was indicated by
attenuation of cAMP formation following removal of extracel-lular Ca2 or application of nitrendipine, an inhibitor of
voltage-gated Ca2 channels. This likely means that a Ca2-
independent mechanism mediated by depolarization alone,
voltage-dependent influx of Na, or K conductance does not
contribute to an increase in MIN6 cell cAMP, as has been
proposed in Paramecium, Lytechinus pictus sperm, and neo-
natal rat cerebellar cells (27–29). Our observations in intact
single cells confirm previous studies showing Ca2- and
calmodulin-dependent activation of AC in murine islet
lysates (30, 31).
The source of the Ca2 signal was a critical determinant in
establishing cross-talk between cAMP and Ca2 second mes-
senger systems; direct measurements of Ca2 influx and cAMP
in single intact MIN6 cells suggested that Ca2
influx through
FIG. 3. Ca2-dependent cAMP pro-duction in MIN6 cells. A–C, effects of Ca2-free external solutions (0 addedCa2 100 M EGTA; orange lines) andnitrendipine (1 M; blue lines) on cAMP
production stimulated by 20 mM KCl, 100M tolbutamide (TB), and 20 mM glucose,respectively. Representative control re-sponses conducted in parallel experi-ments are depicted ( green lines). D, typi-cal response of a MIN6 cell expressingEpac1-camps following application of 250M carbachol (CCh) in a Ca2-free super-fusate (orange line). The traces shown in
A–D are representative of results of threeor more independent experiments. E, his-togram of dynamic changes in the Epac1-camps 485/535 nm relative ratio. The re-sults are means S.E. (n 12 cells) of the area under the 485/535 nm relativeratio curve ( AUC) during an 8-min (KCl,tolbutamide, or carbachol) or a 10-min(glucose) application of secretagogues un-
der control conditions ( green bars), inCa2-free solutions (orange bars), and inthe presence of 1 M nitrendipine (bluebars). Statistical significance of compari-sons with control responses is depicted.***, p 0.001.
Simultaneous Imaging of Ca 2 and cAMP in Excitable Cells31298
http://www.jbc.org/content/suppl/2005/07/15/M505657200.DC1.htmlSupplemental Material can be found at:
8/6/2019 Interplay Ca2
http://slidepdf.com/reader/full/interplay-ca2 6/9
nitrendipine-sensitive voltage-gated Ca2 channels stimulated
cAMP formation. This is in agreement with other studies that
have shown partial inhibition of glucose- and glucagon-like
peptide-1-stimulated cAMP accumulation in homogenates of
rat primary -cells by verapamil, a blocker of L-type Ca2
channels (32). Entry of Ca2 and other monovalent and diva-
lent cations through L-type voltage-dependent and Ca2
store-
operated Ca2 channels has been implicated in stimulating AC
activity in rat C6-2B glioma cells and human embryonic kidney
293 cells transiently expressing Ca2-dependent AC-VIII (2,
33–35). On the other hand, evidence indicates that mobilization
of intracellular Ca2 stores does not activate AC in 1321N1
astrocytoma cells and A7r5 smooth muscle cells (36, 37).
Rather than stimulate cAMP formation, discharge of endoplas-
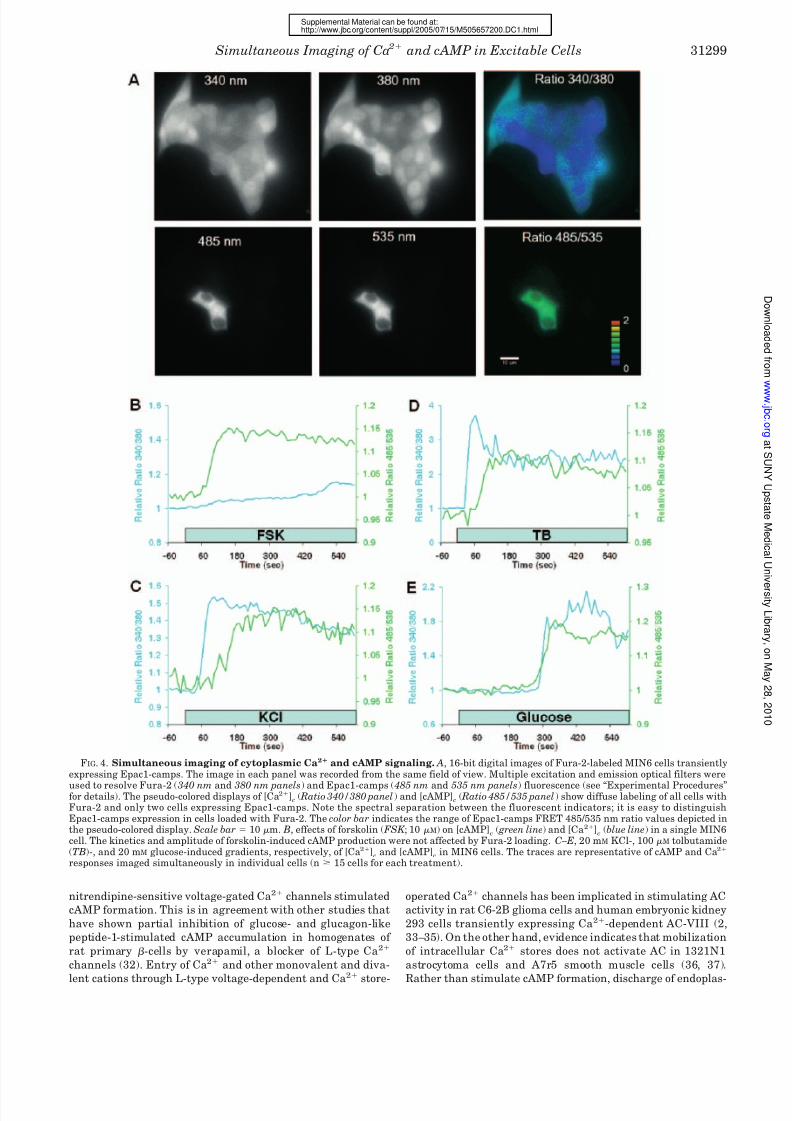
FIG. 4. Simultaneous imaging of cytoplasmic Ca2 and cAMP signaling. A, 16-bit digital images of Fura-2-labeled MIN6 cells transientlyexpressing Epac1-camps. The image in each panel was recorded from the same field of view. Multiple excitation and emission optical filters were
used to resolve Fura-2 ( 340 nm and 380 nm panels) and Epac1-camps ( 485 nm and 535 nm panels) fluorescence (see “Experimental Procedures”for details). The pseudo-colored displays of [Ca2]
c( Ratio 340/380 panel) and [cAMP]
c( Ratio 485/535 panel) show diffuse labeling of all cells with
Fura-2 and only two cells expressing Epac1-camps. Note the spectral separation between the fluorescent indicators; it is easy to distinguishEpac1-camps expression in cells loaded with Fura-2. The color bar indicates the range of Epac1-camps FRET 485/535 nm ratio values depicted inthe pseudo-colored display. Scale bar 10 m. B, effects of forskolin ( FSK ; 10 M) on [cAMP]
c( green line) and [Ca2]
c(blue line) in a single MIN6
cell. The kinetics and amplitude of forskolin-induced cAMP production were not affected by Fura-2 loading. C–E, 20 mM KCl-, 100 M tolbutamide(TB)-, and 20 mM glucose-induced gradients, respectively, of [Ca2]
cand [cAMP]
cin MIN6 cells. The traces are representative of cAMP and Ca2
responses imaged simultaneously in individual cells (n 15 cells for each treatment).
Simultaneous Imaging of Ca 2 and cAMP in Excitable Cells 31299
http://www.jbc.org/content/suppl/2005/07/15/M505657200.DC1.htmlSupplemental Material can be found at:
8/6/2019 Interplay Ca2
http://slidepdf.com/reader/full/interplay-ca2 7/9
mic reticulum Ca2 induces a prolonged inhibition of AC (37).
In electrically excitable A7r5 cells, phospholipase C-mediated
Ca2 release from intracellular sites of sequestration and ac-
tivation of Ca2 /calmodulin-dependent protein kinase II in-
hibit AC-III (37). This may represent an important negative
feedback mechanism regulating cross-talk between Ca2 and
cAMP signaling. In this study, we found that application of
carbachol and release of endoplasmic reticulum Ca2 stores did
not cause a marked increase in cAMP production in MIN6 cells.
Whether carbachol or other agonists that mobilize intracellular
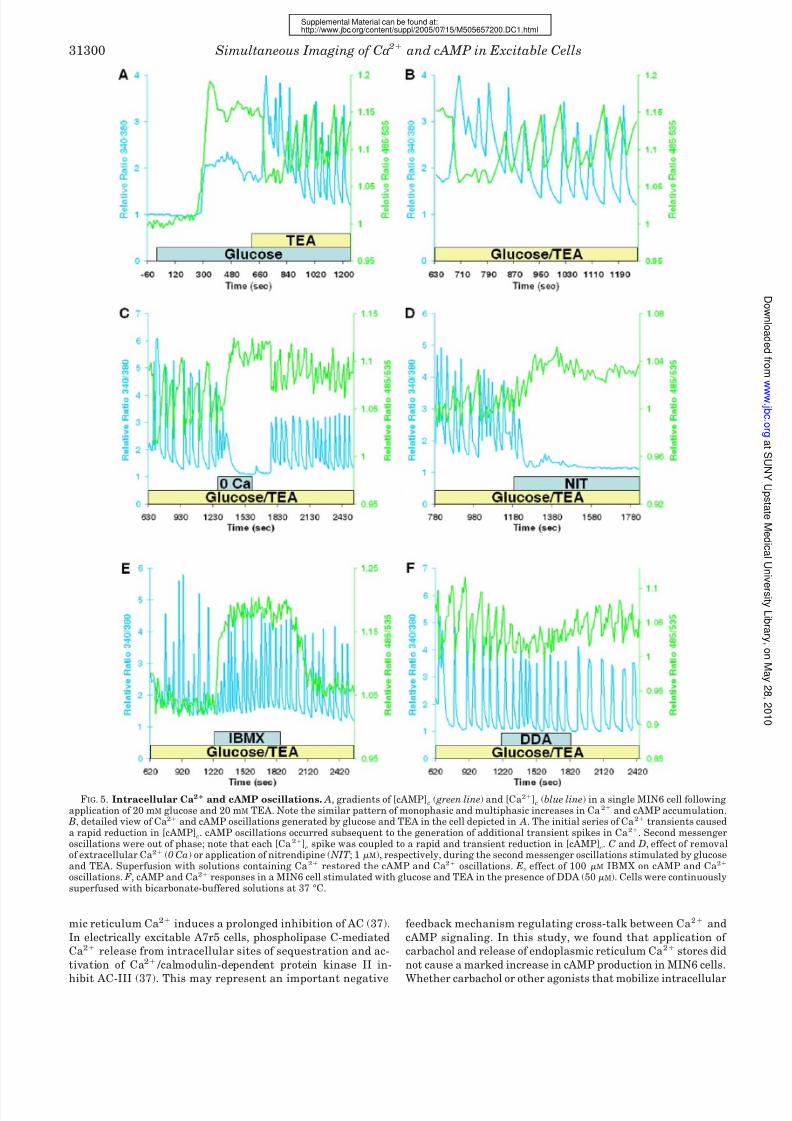
FIG. 5. Intracellular Ca2 and cAMP oscillations. A, gradients of [cAMP]c
( green line) and [Ca2]c
(blue line) in a single MIN6 cell followingapplication of 20 mM glucose and 20 mM TEA. Note the similar pattern of monophasic and multiphasic increases in Ca 2 and cAMP accumulation.
B, detailed view of Ca2 and cAMP oscillations generated by glucose and TEA in the cell depicted in A. The initial series of Ca2 transients causeda rapid reduction in [cAMP]
c. cAMP oscillations occurred subsequent to the generation of additional transient spikes in Ca2. Second messenger
oscillations were out of phase; note that each [Ca2]c
spike was coupled to a rapid and transient reduction in [cAMP]c. C and D, effect of removal
of extracellular Ca2 (0 Ca) or application of nitrendipine ( NIT ; 1 M), respectively, during the second messenger oscillations stimulated by glucoseand TEA. Superfusion with solutions containing Ca2 restored the cAMP and Ca2 oscillations. E, effect of 100 M IBMX on cAMP and Ca2
oscillations. F , cAMP and Ca2 responses in a MIN6 cell stimulated with glucose and TEA in the presence of DDA (50 M). Cells were continuouslysuperfused with bicarbonate-buffered solutions at 37 °C.
Simultaneous Imaging of Ca 2 and cAMP in Excitable Cells31300
http://www.jbc.org/content/suppl/2005/07/15/M505657200.DC1.htmlSupplemental Material can be found at:
8/6/2019 Interplay Ca2
http://slidepdf.com/reader/full/interplay-ca2 8/9
Ca2 stores prevent cAMP rises consequent to MIN6 cell depo-
larization remains to be determined.
The concurrent measurements of [cAMP]c
and [Ca2]c
fur-
ther support the hypothesis that cAMP formation is Ca2-de-
pendent in MIN6 cells. Simultaneous imaging of both second
messenger signals clearly showed that the rise in [Ca2]c
stim-
ulated by high K and tolbutamide preceded cAMP accumula-
tion. This is consistent with the increase in [Ca2]c, subsequent
to Ca2 flux across the plasma membrane, driving production
of cAMP and differs from observations in other cell types inwhich the elevation of [cAMP]
ccaused an increase in [Ca2]
c(2,
3, 16). For example, in R. esculenta ventricular myocytes, si-
multaneous measurements of cAMP with FlCRhR and whole
cell L-type Ca2 current by patch-clamp electrophysiology re-
vealed that cAMP responses precede Ca2 currents following
focal application of isoproterenol or forskolin. These findings
raise the possibility that Ca2 signaling depends on activation
of AC and accumulation of cAMP (16). However, our results do
not support this role of cAMP in MIN6 -cells. Nevertheless,
because our imaging studies were limited to measurements of
global changes in second messenger signaling in single cells,
the data do not rule out possible effects of focal or microdomain
increases in cAMP on Ca2 channel gating. We do not yet
understand the molecular mechanisms underlying the delaybetween depolarization-induced increases in Ca2 and cAMP.
This may in part be explained by the amount of substrate
(ATP) available for production of cAMP by AC. The glucose
experiments support this possibility. Although glucose-induced
cAMP accumulation was dependent on Ca2 influx (Fig. 3C),
unlike depolarization with high K or tolbutamide, the Ca2
and cAMP responses following glucose stimulation occurred
concurrently. The most likely explanation is that glucose me-
tabolism increases ATP production and augments the dynamic
responses of Ca2-dependent production of cAMP. Additional
studies will be necessary to explore this hypothesis.
Our findings provide compelling evidence directly linking os-
cillations in Ca2 signaling with periodic cAMP accumulation by
demonstrating, for the first time, simultaneous oscillations in[Ca2]
cand [cAMP]
cin single mammalian cells. The existence of
cyclic nucleotide oscillations was originally suggested by pulsa-
tile release of cAMP into the medium by Dictyostelium (38) and
more recently shown to be coupled to spontaneous periodic
changes in the mitogen-activated protein kinase ERK2 (extracel-
lular signal-regulated kinase-2) (39). Coupling of cAMP oscilla-
tions to each contraction cycle in Rana pipiens cardiomyocytes
has been proposed, but the temporal interrelationships between
periodic cAMP changes and other signaling pathways were not
evaluated (40). More recent studies using FRET measurements
with FlCRhR have reported Ca2-dependent cAMP fluctuations
in rat pheochromocytoma PC12 cells and Xenopus neurons (17,
26). Repetitive administration of high K induces pulses of cAMP
accumulation in Xenopus neurons that are dependent on extra-cellular Ca2 (17). In our experiments, simultaneous imaging of
Ca2 and cAMP signaling revealed tightly coupled oscillations of
[cAMP]c
and [Ca2]c
induced by endogenous oscillations in mem-
brane potential and Ca2 influx following glucose stimulation in
the presence of TEA. Inhibiting Ca2 influx by removal of extra-
cellular Ca2 or blockade of voltage-gated Ca2 channels with
nitrendipine ablated the cyclic nucleotide oscillations, confirming
the essential role of Ca2 influx in regulating cAMP oscillations.
We have not yet identified specific components of the cAMP
signaling system involved in the generation of cAMP oscilla-
tions. AC and PDE, enzymes that regulate [cAMP]c, have been
proposed to mediate Ca2-dependent effects on cAMP signal
transduction cascades (2– 4). Diversity of cAMP signaling is
determined by expression of multiple AC and PDE isoforms
that are differentially regulated by Ca2, G-proteins, and pro-
tein kinases (6, 7, 41, 42). Individual cells express multiple AC
and PDE isoforms that further contribute to signaling plastic-
ity. Nine membrane-bound AC isoforms and a soluble AC iso-
form are expressed in mammalian cells (7). Inhibition of cAMP
oscillations with DDA, a broad-spectrum inhibitor of mem-
brane-bound AC, suggests a role of AC activity, but does not
identify the specific isoforms involved or elucidate the role of
soluble AC. Previous studies have shown that AC-I–VII and
four splice variants of AC-VIII are expressed in islets andinsulin-secreting cells (32, 43–45). Several AC isoforms are
targets of Ca2 signaling; AC-I and AC-VIII activity is stimu-
lated by Ca2, whereas increased intracellular Ca2 inhibits
AC-III, AC-V, and AC-VI (7, 44, 46). Reverse transcription-PCR
analysis revealed expression of AC-I and AC-VIII transcripts in
MIN6 cells. This suggests that depolarization-induced Ca2
influx causes cAMP formation by activation of AC-I or AC-VIII.
Additional molecular studies are necessary to resolve the con-
tribution of specific membrane-bound AC isoforms and to ex-
plore the role of soluble AC in Ca2-dependent cAMP accumu-
lation following secretagogue stimulation.
The temporal interrelationships between Ca2-dependent
AC and PDE activities that generate cAMP oscillations remain
uncertain. Oscillations could be produced by periodic activationand deactivation of AC or PDE. Our data suggest, however,
that the increase in [Ca2]c
following secretagogue stimulation
causes a sustained activation of AC. The temporal interrela-
tionships between the [Ca2]c
and [cAMP]c
oscillations indicate
that each transient increase in [Ca2]c
is coupled to a rapid and
transient decrease in [cAMP]c
(Fig. 5, A and B). This effect is
consistent with activation of Ca2-dependent PDE by the Ca2
spikes. These observations suggest that periodic activation of
PDE by the Ca2 transients underlies the cAMP oscillations.
This model is supported by our studies using IBMX, an inhib-
itor of PDE. IBMX blocked the cAMP oscillations and increased
[cAMP]c, but did not inhibit the Ca2 transients. Reverse tran-
scription-PCR analysis demonstrated expression of multiple
PDE isoforms in MIN6 cells, including PDE1C, which is acti-
vated by calmodulin in a Ca2-dependent fashion (41, 47).
Taken together, our findings suggest that dynamic interplay
between Ca2-dependent AC-I and AC-VIII and PDE1C differ-
entially encodes oscillatory Ca2 signal inputs to generate
cAMP oscillations in electrically excitable cells.
In summary, using newly developed biosynthetic FRET-
based cAMP sensor technology in combination with a standard
Ca2 imaging approach, we have demonstrated, for the first
time, Ca2-dependent amplitude and frequency encoding of
cAMP signaling in MIN6 -cells. Whether the results of our
studies extend to other electrically excitable cells will be ascer-
tained in future studies. Nonetheless, the temporal and causal
interrelationships between cAMP and Ca2 signaling suggest
that the interplay between second messenger systems forms a
signal transduction network capable of affecting and integrat-ing multiple levels of signaling processes. This dynamic orga-
nization of second messenger signaling cascades may be essen-
tial in determining the specificity of cellular responses to
extracellular stimuli.
Acknowledgments—We thank Drs. Louis H. Philipson, MatthewBrady, and Christopher Rhodes for helpful discussions and suggestionsduring the course of our studies.
REFERENCES
1. Rasmussen, H. (1981) Calcium and cAMP as Synarchic Messengers, WileyInterScience, New York
2. Cooper, D. M. F., Mons, N., and Karpen, J. W. (1995) Nature 374, 421–4243. Zaccolo, M., and Pozzan, T. (2003) Trends Neurosci. 26 53–554. Bruce, J. I. E., Straub, S. V., and Yule, D. I. (2003) Cell Calcium 34, 431–4445. Antoni, F. A. (1997) Trends Endocrinol. Metab. 8, 7–14
6. Hurley, J. H. (1999) J. Biol. Chem. 274, 7599–7602
Simultaneous Imaging of Ca 2 and cAMP in Excitable Cells 31301
http://www.jbc.org/content/suppl/2005/07/15/M505657200.DC1.htmlSupplemental Material can be found at:
8/6/2019 Interplay Ca2
http://slidepdf.com/reader/full/interplay-ca2 9/9
7. Cooper, D. M. F. (2003) Biochem. J. 375, 517–5298. Ang, K.-L., and Antoni, F. A. (2002) J. Neurochem. 81, 422–4339. Maurice, D. H., Palmer, D., Tilley, D. G., Dunkerley, H. A., Netherton, S. J.,
Raymond, D. R., Elbatarny, H. S., and Jimmo, S. L. (2003) Mol. Pharmacol.64, 533–546
10. Nakade, S., Rhee, S. K., Hamanaka, H., and Mikoshiba, K. (1994) J. Biol.Chem. 269, 6735–6742
11. Dean, W. L., Chen, D., Brandt, P. C., and Vanaman, T. C. (1997) J. Biol. Chem.272, 15113–15119
12. Holz, G. G., Leech, C. A., Heller, R. S., Castonguay, M., and Habener, J. F.(1999) J. Biol. Chem. 274, 14147–14156
13. Kang, G., Chepurny, O. G., and Holz, G. G. (2001) J. Physiol. ( Lond.) 536,375–385
14. Bruce, J. I., Yule, D. I., and Shuttleworth, T. J. (2002) J. Biol. Chem. 277,48172–48181
15. DeBernardi, M. A., and Brooker, G. (1996) Proc. Natl. Acad. Sci. U. S. A. 93,4577–4582
16. Goaillard, J.-M., Vincent, P., and Fischmeister, R. (2001) J. Physiol. ( Lond.)530, 79–91
17. Gorbunova, Y. V., and Spitzer, N. C. (2002) Nature 418, 93–9618. Nikolaev, V. O., Bunemann, M., Hein, L., Hannawacker, A., and Lohse, M. J.
(2004) J. Biol. Chem. 279, 37215–3721819. Grynkiewicz, G., Poenie, M., and Tsien, R. Y. (1985) J. Biol. Chem. 260,
3440–345020. Palmer, A. E., Jin, C., Reed, J. C., and Tsien, R. Y. (2004) Proc. Natl. Acad. Sci.
U. S. A. 101, 17404–1740921. Ponsioen, B., Zhao, J., Riedl, J., Zwartkruis, F., van der Krogt, G., Zaccolo, M.,
Moolenaar, W. H., Bos, J. L., and Jalink, K. (2004) EMBO Rep. 5,1176–1180
22. DiPilato, L. M., Cheng, X., and Zhang, J. (2004) Proc. Natl. Acad. Sci. U. S. A.101, 16513–16518
23. Roe, M. W., Worley, J. F., III, Mittal, A. A., Kuznetsov, A., DasGupta, S.,Mertz, R. J., Witherspoon, S. M., III, Blair, N., Lancaster, M. E., McIntyre,
M. S., Shehee, W. R., Dukes, I. D., and Philipson, L. H. (1996) J. Biol. Chem.271, 32241–32246
24. Roe, M. W., Worley, J. F., III, Qian, F., Tamarina, N., Mittal, A. A., Dralyuk,F., Blair, N. T., Mertz, R. J., Philipson, L. H., and Dukes, I. D. (1998) J. Biol.Chem. 273, 10402–10410
25. Rapp, P. E., and Berridge, M. J. (1977) J. Theor. Biol. 66, 497–525
26. Agnihotri, N., Kisaalita, W. S., and Keith, C. H. (1997) J. Neurosci. Res. 47,
555–56027. Schultz, J. E., Klumpp, S., Benz, R., Schurhoff-Goeters, W. J., and Schmid, A.
(1992) Science 255, 600–60328. Beltran, C., Zapata, O., and Darszon, A. (1996) Biochemistry 35, 7591–759829. Cooper, D. M.F., Schell, M. J.,Thorn, P.,and Irvine, R.F. (1998) J. Biol.Chem.
273, 27703–2770730. Karl, R. C., Zawalich, W. S., Ferrendelli, J. A., and Matschinsky, F. M. (1975)
J. Biol. Chem. 250, 4575–457931. Valverde, I., Vandermeers, A., Anjaneyulu, R., and Malaisse, W. J. (1979)
Science 206, 225–22732. Delmeire, D., Flamez, D., Hinke, S. A., Cali, J. J., Pipeleers, D., and Schuit, F.
(2003) Diabetologia 46, 1383–139333. Chiono, M., Mahey, R., Tate, G., and Cooper, D. M. F. (1995) J. Biol. Chem.270, 1149–1155
34. Fagan, K. A., Mahey, R., and Cooper, D. M. F. (1996) J. Biol. Chem. 271,
12438–1244435. Fagan, K. A., Mons, N., and Cooper, D. M. F. (1996) J. Biol. Chem. 273,
9297–930536. Goraya, T. A., Masada, N., Ciruela, A., and Cooper, D. M. F. (2004) J. Biol.
Chem. 279, 40494–4050437. Dyer, J. L., Liu, Y., Pino de la Huerga, I., and Taylor, C. W. (2005) J. Biol.
Chem. 280, 8936–894438. Roos, W., Scheidegger, C., and Gerisch, G. (1977) Nature 266, 259–26139. Maeda, M., Lu, S., Shaulsky, G., Miyazaki, Y., Kuwayama, H., Tanaka, Y.,
Kuspa, A., and Loomis, W. F. (2004) Science 304, 875–87840. Booker, G. (1973) Science 182, 933–93441. Mehats, C., Andersen, C. B., Filopanti, S.-L., Jin, C., and Conti, M. (2002)
Trends Endocrinol. Metab. 13, 29–3542. Houslay, M. D., and Milligan, G. (1997) Trends Biochem. Sci. 22, 217–22443. Leech, C. A., Castonguay, M. A., and Habener, J. F. (1999) Biochem. Biophys.
Res. Commun. 254, 703–706
44. Tian, Y., and Laychock, S. G. (2003) Mol. Cell. Endocrinol. 204, 75–8445. Guenifi, A., Portela-Gomes, G. M., Grimelius, L., Efendic, S., and Abdel-Halim,
S. M. (2000) Histochem. Cell Biol. 113, 81–8946. Guillou, J.-L., Nakata, H., and Cooper, D. M. F. (1999) J. Biol. Chem. 274,
35539–3554547. Pyne, N. J., and Furman, B. L. (2003) Diabetologia 46, 1179–1189
Simultaneous Imaging of Ca 2 and cAMP in Excitable Cells31302
http://www.jbc.org/content/suppl/2005/07/15/M505657200.DC1.htmlSupplemental Material can be found at:


![Evidence of Ca2+-Dependent Carbohydrate Association ... · Ca2+I2+ and [2Lex + Ca2+]2+. The CID experiments of the [2Lex-LacCer + Ca2+I2+ dimers resulted in a neutral loss covalently](https://static.fdocuments.in/doc/165x107/5f8af1f17b5f935beb015692/evidence-of-ca2-dependent-carbohydrate-association-ca2i2-and-2lex-ca22.jpg)