Tsunami analyses of great interplate earthquakes along the central Kurile subduction zone

19
Interplate coupling in the Ryukyu Trench: possibility of large interplate earthquakes and mega-tsunamis
Mamoru Nakamura Associate Professor, Faculty of Science, University of the Ryukyus, Japan
E-mail: [email protected]
Abstract
Although the seismic coupling is assumed to be only 5 % along the Ryukyu Trench, the mega-tsunamis occurred repeatedly in the Ryukyu Trench. The source of 1771 April 24 Yaeyama tsunami was the latest interplate earthquake which occurred at the south of Ishigaki Island, south Ryukyu Trench. The recurrence interval of the mega-tsunami in the Ryukyu Trench was about 500 years from ages of the coral fossils which brought from reef to land. However, the displacements associated with the back-slip cannot be detected in the GPS station in the Ryukyu arc if the coupled zone is limited near the Trench. To detect the inter-plate coupling near the central Ryukyu trench, the GPS/acoustic seafloor observation had been started. This measurement system contains two main tasks: precise acoustic ranging between a ship station (observation vessel) and seafloor transponders, and kinematic GPS positioning of observation vessels. The seafloor reference point was set at about 33 km landward from the axis of the Ryukyu trench (southeast of Okinawa Island). A set of three acoustic transponders has been installed on the seafloor, at a depth of about 2900m. The coordinates of the seafloor benchmark were calculated using the least-squares technique; this technique minimizes the square sum of acoustic travel-time residuals. The result shows that the benchmark moved to northwest direction for two years at a rate of 4 cm/yr relative to the Amurian plate. Since the benchmark would move south direction at a rate of 2 cm/yr if the interplate coupling rate is weak, this movement shows that the coupled zone is distributed near the Trench. The estimated width of the interplate coupling area is about 50 km from the Ryukyu trench. The results also show that the length of the coupled area is over 50 km. Since the calculated displacements are not sensitive to the change in the length of the coupled area, the accurate length is uncertain. The observation suggests that the coupled zone exists near the Ryukyu Trench. This can cause magnitude 8 class earthquake if length of the coupled zone is over 100 km. The coupled zone near the Ryukyu Trench would be the source of historical mega-tsunami which occurred repeatedly at an interval of 500 years, and it would cause large interplate earthquakes and mega-tsunami in future.
1. INTRODUCTION
The Ryukyu Trench is a convergent plate boundary. The Philippine Sea plate is subducting at a rate of 82 mm/yr in the central Ryukyu Trench (Seno, 1993). The seismic coupling, which is defined by the ratio of the seismic slip rate estimated from the cumulative seismic moment of large interplate earthquakes to the relative plate velocity, is 5 % in the Ryukyu Trench (Peterson and Seno, 1993).

ThemagYaeseisman ireacplatdistrtsunRecwasthe the r
Fig.
AlthTrenattac
e Ryukyu Tregnitudes are oeyama earthqumic intensity island of the sched 1~3 km eau-like topogribution of th
nami runup heently, for the proposed fromega-tsunamreef to land by
1: Plate tectonArrows shosouth Ryukhistorical eover 6.0 (Uof the bencdotted line(Heki and Rectangle stsunami (N
hough the seinch, historicacked the islan
ench had beeover 6.0 had ruake. The mag(Usami, 2002south Ryukyuinland at Taragraphy (averahe tsunami rueights was extr
cause of the m the numeri
mis before 177y mega-tsunam
nic setting of Row the GPS stakyu arc. Circleearthquakes w
Utsu, 1979). Thchmark in this s show the fauKataoka, 2008show the fault
Nakamura, 200
smic couplingal records sugnds of the sou
en absence orecorded sincegnitude of the2) (Fig. 1). Thu arc [Nakata ama island, w
age heights waunup heights wremely larger earthquake, thcal simulation
71 were shownmis.
Ryukyu Trenchations in the cees show the epihose magnitud
he star shows thstudy. Rectan
ults of slow slip8; Nakamura, 2
of the 1771 Ya09b).
g is weak froggest that larguth Ryukyu ar
20
of large histoe 1600 (Utsu,e earthquake whe maximum r
and Kawanawhere is circulas about 10 mwas 8.5 (Abethan the mag
he interplate en of the tsunamn from the bo
h region. entral and icenters of des were he position
ngles with p events 2009a). aeyama
om 100 years ge interplate erc. This impli
orical earthqu, 1979). An ewas estimatedrunup height
a, 1995]. The lar island who
m) (Fig. 2). Thee, 1999). Thegnitude from thearthquake nemi (Nakamuraoulders of the
Fig. 2: (top) IYaeyamIsland. houses.bouldercoral fovertical
large earthquearthquakes gicates the stra
uakes: few eaexceptional evd as 7.4 from of the tsunaminundation arose diameter e magnitude emagnitude e
he seismic intear the southera, 2009a) (Figcoral which
nundation arema tsunami in Triangles show
. Circles show rs. Numbers shossil on the boul cross section
uake activity agenerated megain accumulati
arthquakes wvent was the the distributio
mi reached 30 rea of the tsunis 4.5 km andestimated fromstimated fromtensity distriburn Ryukyu Trg. 1). The tracwere moved
ea of the 1771 the Tarama w the inundatethe tsunami how the age ofulders. (bottomof Tarama Isl
along the Ryuga-tsunami, wion in the Ryu
whose 1771 on of m in nami d has m the m the ution. rench es of from
ed
f the m) and.
ukyu which ukyu
21
plate boundary zone. However, the detection of coupled zone has some difficulties. Since the GPS stations of the Islands arc region are aliened along the trench, the horizontal deformation along the trench can be detectable. However, since the baseline length perpendicular to the trench is short, the horizontal deformation perpendicular to the Trench is difficult. From the 2D numerical simulation, the estimated horizontal velocity is less than 7 mm/yr far from the 100 km from the Trench axis when the convergence rate of the plates are 100 mm/yr, the coupled zone start from trench axis, and its width is 50 km.
Since the daily positions have some ambiguities, it is difficult to detect deformation by the coupled zone using GPS measurement whose locations are restricted to the island arc. The deformation of the overriding continental plate by the coupled zone near the Trench can be detected using the seafloor geodetic technique.
2. METHODS
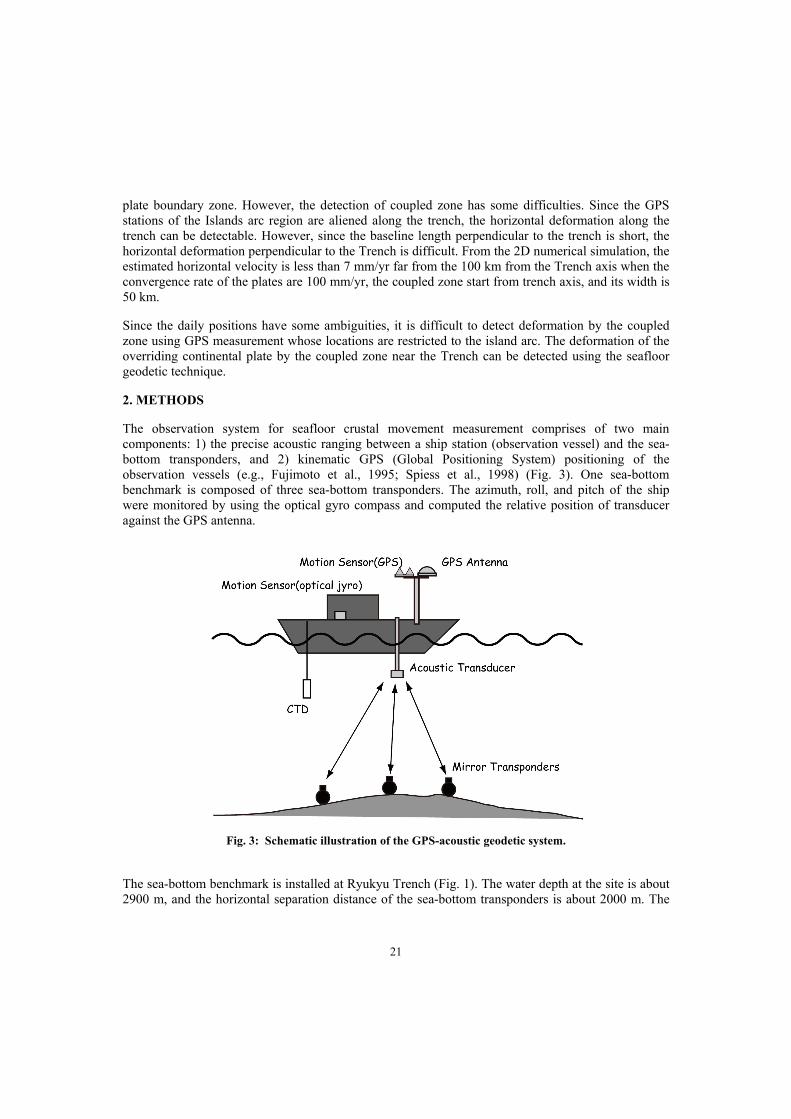
The observation system for seafloor crustal movement measurement comprises of two main components: 1) the precise acoustic ranging between a ship station (observation vessel) and the sea-bottom transponders, and 2) kinematic GPS (Global Positioning System) positioning of the observation vessels (e.g., Fujimoto et al., 1995; Spiess et al., 1998) (Fig. 3). One sea-bottom benchmark is composed of three sea-bottom transponders. The azimuth, roll, and pitch of the ship were monitored by using the optical gyro compass and computed the relative position of transducer against the GPS antenna.
Fig. 3: Schematic illustration of the GPS-acoustic geodetic system.
The sea-bottom benchmark is installed at Ryukyu Trench (Fig. 1). The water depth at the site is about 2900 m, and the horizontal separation distance of the sea-bottom transponders is about 2000 m. The

22
common acoustic ranging signal, with a carrier wave frequency of 12.987 kHz and a signal length of 14.322 ms, is transmitted every 10–12 s from the transducer at the ship station to all the sea-bottom transponders. The sea-bottom transponder returns the same signal to the ship station. The waveforms of the retuned signals are recorded and digitized at a sampling rate of 500 kHz by a 16-bit A/D converter. The travel times of the acoustic signals are measured precisely by means of the cross-correlation computation, and accuracy of the travel times are checked manually. The round-trip traveltime was translated into the distance between the transducer and the transponders.
The positions of the ship transducer at the timing of signal transmission and receiving are determined through the post-processing kinematic GPS positioning technique employing the IGS (International GNSS Service) precise ephemeris. The GPS signals are recorded every 0.2 s using dual-band GPS receivers at both the ship and onshore GPS reference stations (Fig. 4). All the GPS receivers are equipped the 10 MHz external frequency reference unit to correct the internal clocks. The coordinate of sea-bottom benchmark, defined as the center of the triangular configuration composed of three sea-bottom transponders, is calculated using the least-square technique, which minimizes the square sum of travel-time residuals (Ikuta et al., 2008). During the observations, the temporal variation in sound speed was one of the major causes in the decrease of seafloor positioning accuracy. To address such concern, CTD (Conductivity, temperature, and Depth) measurements are performed several times during each observation. The temporal variation in sound speed is corrected in the calculation procedure of locating the sea-bottom benchmark (Ikuta et al., 2008) on the basis of the CTD measurement data.
Fig. 4: Location of the benchmark unit (star) at central Ryukyu Trench and onshore reference stations for kinematic GPS positioning (solid circle). Solid arrow shows the horizontal velocity at the GEONET GPS network. The enlarged map on the bottom left shows the location of the seafloor transponders.

23
The seafloor deformation monitoring started in January 2008 and we repeatly observed five times until November 2009. The onshore GPS reference station is installed at 80 km relative to the sea-bottom benchmark. The observation vessel was “Tonan-maru” of Okinawa Prefectural Fisheries and Ocean Research Center, Japan. The usual duration of acoustic ranging at one observation was about 36 hours.
We could follow arbitrary trajectories while sending and receiving signals at the observations of January 2008 and February 2008. The Tonan-maru could not follow arbitrary trajectories during measurements at the observations of July 2008, May 2009, and November 2009 because it could not send or receive signals while running owing to loud screw noise. We let the Tonan-maru drift with the wind and current for several hours while sending and receiving acoustic signals. Each drift resulted in an observation line and was repeated until the trajectories covered a suitable area. The rms was 70micro-second.
3. INTERPLATE COUPLING AREA
We estimated the horizontal velocities of the benchmark by linear interpolation. The obtained horizontal velocity is 30±19 mm/yr to westward and 35±23 mm/yr to northward (Fig. 5). The benchmark moved to 309º direction at the rate of 46 mm/yr relative to the Amurian plate (Fig. 6). We estimate the position of the coupled area in the central Ryukyu Trench. First we calculated the motion of the central Ryukyu arc. The crustal movement of the Ryukyu arc is described as the combination of the block motion and the deformation by the interplate coupling. For the estimation of the motion of overriding plate, we employed the daily position results of GPS network in the Okinawa Island and surrounding Islands by the GSI during the 8-years period between the January 1, 2002 and December 31, 2009. Horizontal velocities were calculated from the time-series analysis for the GPS stations with removing the annual and biannual components. The coseismic displacements were not observed in this region during this period. The velocities of the GPS stations are converted to the coordinate of the Amurian plate. The observed horizontal velocities of the GPS stations in the central Ryukyu arc were 23–30 mm/yr to 160–170º direction relative to the Amurian plate. The predicted motion of the central Ryukyu arc on the Amurian plate was 2.7 mm/yr to 290º direction relative to the Amurian plate using GSRM 1.2 model (Kreemer et al., 2003). The difference in the motion between the Amurian plate and the central Ryukyu arc is originated to the rifting of the Okinawa Trough.
Then we estimated the motion of the central Ryukyu arc using the block model. We adopted a rigid block rotation model for the motion of the central Ryukyu arc. In the Ryukyu arc, direction of the extension stress is along the arc (NE–SW direction in the central Ryukyu arc) (Kubo and Fukuyama, 2003). The block rotation and deformation model of the central Ryukyu arc has been estimated previously from GPS measurements (Nakamura, 2004). The estimated strain rate is of 18 × 10-9 strain/yr, which is dominant with extension strain parallel to the Ryukyu Trench. This corresponds to the velocity difference of 1.8 mm/yr per length of 100 km along the Island arc. Since the velocity difference by the extension strain is so small compared with the velocity error of the benchmark, we treated the motion of the central Ryukyu arc as a rigid body. The estimated Euler pole and rotation rate relative to the Amurian plate are 28.129ºN, 135.027ºE, and 3.53 × 10⁻⁸ radian/yr, respectively.

24
Fig.5: Results of repeated measurements at the benchmark. In Figure 4a, the temporal variation in the horizontal coordinates of the benchmark unit relative to the Amurian plate is plotted for the following five observations. The lines show the liner-interpolated results for five observations.
Fig. 6: Location of the benchmark unit (open circle) at central Ryukyu Trenchand onshore reference stations for kinematic GPS positioning (solid circle). Open arrow shows the observed horizontal velocity at the benchmark. Solid arrow shows the estimated horizontal velocity at the benchmark from the central Ryukyu block model. The horizontal velocities are fixed to the Amurian plate.
Then we calculated the horizontal velocity at the benchmark near the Ryukyu Trench using the position of Euler pole and rotation rate of the central Ryukyu arc. The estimated horizontal velocities at the benchmark near the Ryukyu Trench were 29 mm/yr to 160º direction relative to the Amurian plate (Fig. 6). This suggests that the benchmark moves to south direction if the plate interface is not locked. However, the observed motion of the benchmark is northwest direction. This suggests that the plate interface is partially locked and the Ryukyu arc near the Ryukyu Trench is deformed by the back-slip.
Then we estimated the length and width of the coupled area. For the model of subducting plate, we adopted the result of refraction survey (Kodaira et al., 1996). The survey line passes about 40 km northeastward from the benchmark (Fig. 5). We set the dip of the subducting plate to 6º from the result of the refraction survey. The convergence of the Philippine Sea plate relative to the Amurian plate is 83 mm/yr to 300º direction (Kreemer et al., 2003) (Fig. 6). Since the central Ryukyu arc at the benchmark is moving to 160º direction at the rate of 29 mm/yr as mentioned above, the convergence of the Philippine Sea plate relative to the central Ryukyu arc is to 310º direction at the rate of 106 mm/yr.
To model the displacement by the interplate coupling, we adopted the back-slip modeling approach (Savage, 1983). The Interseismic back-slip by the coupled zone is the difference between continuous

25
steady state rigid-block motion along the plate interface and continuous aseismic slip along the plate interface downdip of the coupled zone. For the calculation of the displacements by faulting we employed the formula by Okada (1992).
We set the length of the coupled zone to 100 km, changed the width of the coupled zone to 30 km, 50 km, 70 km, and 90 km, and calculated the horizontal displacements by the back-slip (Fig. 7). We set the position of the half length of the coupled area to be the position of the benchmark. The top of the coupled zone is set to the Trench axis. The depth of down-dip edge of the coupled zone for the width of 30 km, 50 km, 70 km, and 90 km is 10 km, 12km, 14 km, and 16 km from the sea surface, respectively. When the width of the coupling area is 30 km, the horizontal velocity is 9 mm/yr to 300º direction at the benchmark. This is smaller than the observed. For the widths of 50 km, 70 km, and 90 km, the calculated displacements are 35 mm/yr, 49 mm/yr, and 54 mm/yr, respectively. The directions of these cases are 330º. These are consistent with the observed value (46 ±21 mm/yr). On the other hand, the calculated horizontal velocities (7–21 mm/yr) at the south Okinawa Island and in the vicinity of the Okinawa Island, which are slightly smaller than the observed ones (23–30 mm/yr) when the width of the coupled area is 90 km. These suggest that the horizontal velocities by the backslip could be detected by the GPS network when the width of the coupled area is over 90 km. Then we assumed that the width of the coupled area is between 50 km and 70 km. The depth of lower limit of the coupled zone ranges 12–14 km from the sea surface (Fig. 8).
Fig. 7: Red and black arrows denote the observed and calculated horizontal velocity at GEONET GPS stations and the benchmark relative to the Amurian plate. Rectangles show the fault of the coupled zone. Solid lines show the top of the fault. Fault width is set to (a) 70 km, (b) 50 km, and (c) 30 km, respectively.

26
Fig. 8: Vertical cross section of the refraction survey at central Ryukyu Trench in the profile shown in Figure 4 (Kodaira et al., 1996). Numbers in the figure are P wave velocity. Thick line shows the estimated fault plane of the coupled zone with fault width of 50 km. The star shows the benchmark.
4. DISCUSSION
The updip and downdip rupture limits of great subduction thrust earthquakes were controlled by thermal structure (Tichelaar and Ruff, 1993]. From the data on the past great earthquake seismic limit for Cascadia, SW Japan, south Alaska and Chile, updip limit of seismic zone corresponds to the position where the thrust temperature reaches about 100 ºC, that is, depths of about 4 km from sea surface. This temprerature agrees with the phase transition from smectite to illite which occurs between ~100 ºC and 150 ºC (Pytte and Reynmolds, 1989).
However this model is not consistent with the temperature model estimated in the central Ryukyu Trench. In the central Ryukyu Trench, the age of the subducting Philippine Sea plate is 50 Ma (Deschamps and Lallemand, 2002). Convergence rate of the Phillipine Sea plate to the Ryukyu arc is 106 mm/yr. Using the 1-D temperature model of the subduction area where plate age and convergence rate are similar, the temperature reaches to 100 ºC at the depth of 10–12 km from sea surface for the plate age about 50 Ma (Oleskevich et al., 1999). Since observed coupling area is shallower than 12–14 km in depth in the central Ryukyu Trench, the phase transition of the clay minerals is excluded for the cause of the coupled zone.
The alternative model is that the coupled zone is distributed near the shallow part of the subduction zone when the pore pressure in the overriding continental lithosphere is low. The distribution of coupled zone is controlled by the pore pressure in the Hikurangi subduction zone, New Zealand (Fagereng and Ellis, 2009). When the pore pressure is in the state of hydrostatic, the brittle-viscous transition occurs significantly shallower than the near-lithostatic case. The interplate coupled zone continues from the Trench to depth of 10 km in the east of North Island of the New Zealand. The slow slip events occur at the depth of 10–15 km in the east of the North Island.

27
In this case, the continental lithosphere above the coupled zone is compressional stress regime, whereas the continental lithosphere above the stable sliding zone is extensional stress regime. The Ryukyu arc is in the extensional stage, which is shown as the rifting of the Okinawa Trough and trench-parallel extensional stress in the Ryukyu arc.
The distribution of the coupled zone in the Ryukyu Trench suggests that the inter-plate large earthquakes and tsunami would occur repeatedly in the Ryukyu Trench. The ages of the coral fossils on the tsunami boulders concentrate to several periods: about 200, 500, 1000, 2000, and 2500 years ago (Goto et al., 2010). This shows that the tsunami occurred repeatedly in the Ryukyu Trench.
5. CONCLUSION
We employed a GPS-acoustic measurement to monitor the seafloor deformation by the interplate coupled zone near the central Ryukyu Trench. The system consisted of kinematic GPS technique in the aerial region and acoustic ranging in the underwater region. The benchmark moved 30 mm/yr to west direction and 35 mm/yr to north direction relative to the Amurian plate. The calculated horizontal velocity at the GPS stations are consistent with observed ones when the width of the coupled zone is over 50 km.
The observed coupling area is shallower than 12 km in depth in the central Ryukyu Trench. The coupled zone at the shallow part of the plate interface is the unstable sliding of clay mineral on the higher pore pressure condition.
The traces of mega-tsunamis recorded in the historical records (old literatures and tsunami sediments) in the Yaeyama region suggest the mega-tsunami had been attacked in this area about 5 times for 3000 years. The interplate coupled zone near the Ryukyu Trench would be the cause of repeating mega-tsunami in this subduction zone.
6. REFERENCES
[1] Abe, K. (1999), Quantification of historical tsunamis by the Mt scale. Zisin, 52, 369–377 (in Japanese with English abst.).
[2] Deschamps, A. and S. Lallemand (2002), The West Philippine Basin: An Eocene to early Oligocene back arc basin opened between two opposed subduction zones. J. Geophys. Res., 107, doi:10.1029/2001JB001706.
[3] Fagereng, A. and S. Ellis (2009), On factors controlling the depth of Interseismic coupling on the Hikulangi subduction interface, New Zealand. Earth Planet. Sci. Lett., 278, 120-130.
[4] Fujimoto, H., T. Kanazawa, and H. Murakami (1995), Experiment on precise seafloor acoustic ranging: A promising result of observations (in Japanese), J. Seismol. Soc. Jpn., 48, 289– 292.
[5] Goto, K. T. Kawana, and F. Imamura (2010), Historical and geological evidence of boulders deposited by tsunamis, southern Ryukyu Islands, Japan, Earth-Science Reviews, 102, 77-99.
[6] Ikuta, R., K. Tadokoro, M. Ando, T. Okuda, S. Sugimoto, K. Takatani, K. Yada, G. M. Besana (2008), A new GPS-acoustic method for measuring ocean floor crustal deformation: Application to the Nankai Trough, J. Geophys. Res., 113, doi:10.1029/2006JB004875.

28
[7] Kodaira, S., T. Iwasaki, T. Urabe, T. Kanazawa, F. Egloff, J. Makris, and H. Shimamura (1996), Crustal structure across the middle Ryukyu trench obtained from ocean bottom seismographic data, Tectonophysics, 263, 39–60.
[8] Kreemer, C., W.E. Holt, and A.J. Haines (2003), An integrated global model of present-day plate motions and plate boundary deformation, Geophys. J. Int., 154, 8–34, 2003.
[9] Nakamura, M. (2004), Crustal Deformation in the central and southern Ryukyu arc estimated from GPS data, Earth Planet. Sci. Lett., 217, 389-398.
[10] Nakamura, M. (2009), Fault model of the 1771 Yaeyama earthquake along the Ryukyu Trench estimated from the devastating tsunami, Geophys. Res. Lett., 36, doi:10.1029/2009GL037930.
[11] Nakamura, M. (2009), Aseismic crustal movement in southern Ryukyu Trench, southwest Japan, Geophysical Res. Lett., 36, doi:10.1029/2009GL040357.
[12] Nakata, T., and T. Kawana (1995), Historical and prehistorical large tsunamis in the southern Ryukyus, Japan, in Tsunami: Progress in Prediction, Disaster Prevention and Warning, edited by Y. Tsuchiya and N. Shuto, pp. 211–222, Kluwer Academic Publishers, Netherlands.
[13] Okada, Y. (1992), Internal deformation due to shear and tensile faults in a half-space. Bull. Seismol. Soc. Am. 82, 1018–1040.
[14] Pytte, A.M., and Reynolds, R.C., 1989, The thermal transformation of smectite to illite, in Naeser, N.D., and McCulloh, T.H., eds., Thermal history of sedimentary Basins: Methods and case histories: New York, Springer-Verlag, p. 33–40. Saffer, D.M., and Bekins, B.A.,
[15] Peterson, E.T., T. Seno (1984), Factors affecting seismic moment release rates in subduction zones. J. Geophys. Res. 89, 10233–10248.
[16] Saffer, D. M., K. M. Frye, C. Marone, and K. Mair (2001), Laboratory results indicating complex and potentially unstable frictinal behavior of smectite clay, Geophys. Res. Lett., 28, 2297–2300.
[17] Savage, J.C. (1983), A dislocation model of strain accumulation and release at a subduction zone, J. Geophys. Res., 88, 4984–4996.
[18] Seno, T. (1993), A model for the motion of the Philippine Sea plate consistent with NUVEL-1 and geological data, J. Geophys. Res., 98, 17941-17948.
[19] Seno, T. (2002), Tsunami earthquakes as transient phenomena, Geophys. Res. Lett., 29, doi:10.1029/2002GL014868.
[20] Spiess, F. N., C. D. Chadwell, J. A. Hildebrand, L. E. Young, G. H. Purcell Jr., and H. Dragert (1998), Precise GPS/acoustic positioning of seafloor reference points for tectonic studies, Phys. Earth Planet. Inter., 108, 101– 112.
[21] Tichelaar, B. W. and L. J. Ruff (1993), Depth of seismic coupling along subduction zones, J. Geophys. Res., 98, 2017-2037.
[22] Usami, T. (2002), Historical earthquakes in Japan, in IASPEI handbook of earthquake & engineering seismology, edited by W. H. K. Lee, H. Kanamori, and P. C. Jennings, pp. 799–802, Academic Press, Boston, 799–802.
[23] Utsu, T. (1979), Seismicity of Japan from 1885 through 1925 (in Japanese with English abstract), Bull. Earthqu. Res. Inst., 54, 253–308.