Internet, broadband, and cell phone statistics...January 5, 2010 Overview In a national survey...
16
Internet, broadband, and cell phone statistics By: Lee Rainie, Director January 5, 2010 Overview In a national survey between November 30 and December 27, 2009, we find: 74% of American adults (ages 18 and older) use the internet ‐‐ a slight drop from our survey in April 2009, which did not include Spanish interviews. At that time we found that 79% of English‐ speaking adults use the internet. 60% of American adults use broadband connections at home – a drop that is within the margin of error from 63% in April 2009. 55% of American adults connect to the internet wirelessly, either through a WiFi or WiMax connection via their laptops or through their handheld device like a smart phone. This figure did not change in a statistically significant way during 2009. These data come from the Pew Research Center’s Internet & American Life Project. The most recent survey was conducted from November 30 to December 27, 2009, using landline and cell phones and including interviews in Spanish. Some 2,258 adults were interviewed and the overall sample has a margin of error of ± 2 percentage points. 1
Transcript of Internet, broadband, and cell phone statistics...January 5, 2010 Overview In a national survey...
Internet, broadband, and cell phone statistics By: Lee Rainie, Director January 5, 2010
Overview In a national survey between November 30 and December 27, 2009, we find:
74% of American adults (ages 18 and older) use the internet ‐‐ a slight drop from our survey in April 2009, which did not include Spanish interviews. At that time we found that 79% of English‐speaking adults use the internet.
60% of American adults use broadband connections at home – a drop that is within the margin of error from 63% in April 2009.
55% of American adults connect to the internet wirelessly, either through a WiFi or WiMax connection via their laptops or through their handheld device like a smart phone. This figure did not change in a statistically significant way during 2009.
These data come from the Pew Research Center’s Internet & American Life Project. The most recent survey was conducted from November 30 to December 27, 2009, using landline and cell phones and including interviews in Spanish. Some 2,258 adults were interviewed and the overall sample has a margin of error of ± 2 percentage points.
1

Internet Users Not all Pew Internet Project surveys include Spanish interviews, so these survey results are not completely comparable to all previous Project surveys. This latest survey finds that 74% of adults use the internet, a figure that has not markedly changed since early 2006, when we measured the online population at 73%. There is some variation from survey to survey. Here is the current profile of internet users:1
1 Note: The numbers for internet access by race/ethnicity were originally reported to be 59% for non-Hispanic Blacks and 55% for Hispanics. These have been corrected to 70% for non-Hispanic Blacks and 64% for Hispanics.
2
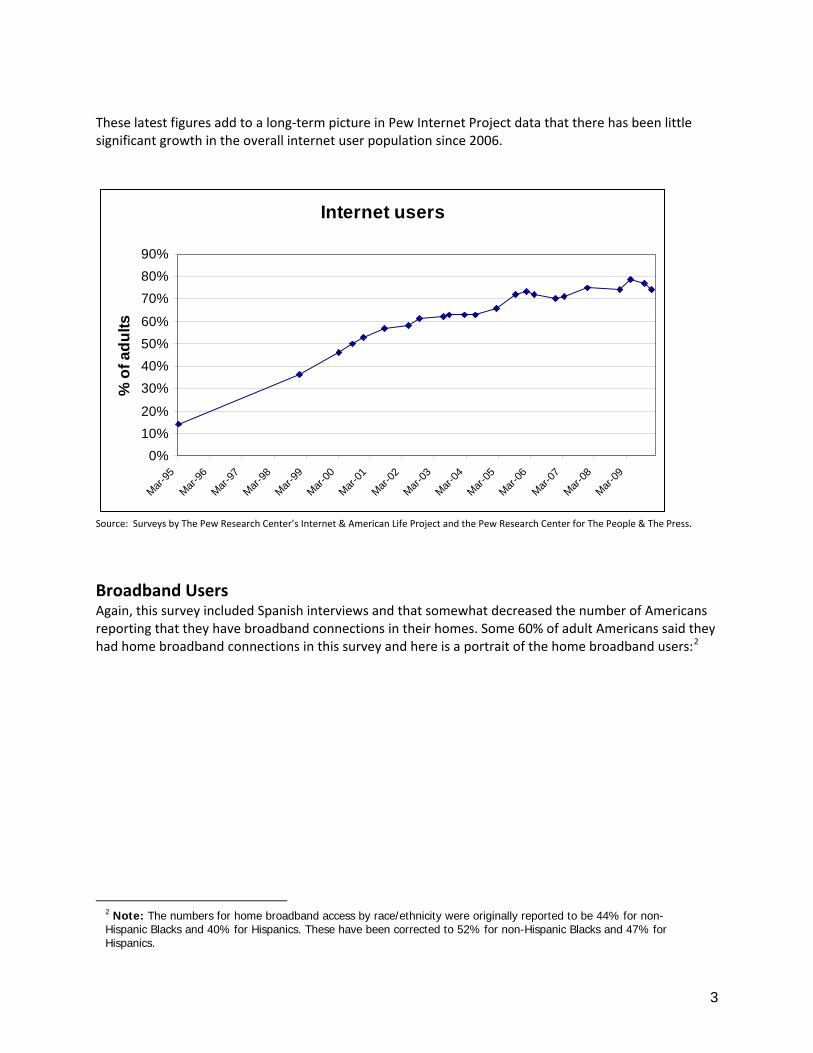
These latest figures add to a long‐term picture in Pew Internet Project data that there has been little significant growth in the overall internet user population since 2006.
Internet users
0%
10%
20%
30%
40%
50%
60%
70%
80%
90%
Mar
-95
Mar
-96
Mar
-97
Mar
-98
Mar
-99
Mar
-00
Mar
-01
Mar
-02
Mar
-03
Mar
-04
Mar
-05
Mar
-06
Mar
-07
Mar
-08
Mar
-09
% o
f ad
ult
s
Source: Surveys by The Pew Research Center’s Internet & American Life Project and the Pew Research Center for The People & The Press.
Broadband Users Again, this survey included Spanish interviews and that somewhat decreased the number of Americans reporting that they have broadband connections in their homes. Some 60% of adult Americans said they had home broadband connections in this survey and here is a portrait of the home broadband users:2
2 Note: The numbers for home broadband access by race/ethnicity were originally reported to be 44% for non-Hispanic Blacks and 40% for Hispanics. These have been corrected to 52% for non-Hispanic Blacks and 47% for Hispanics.
3

4
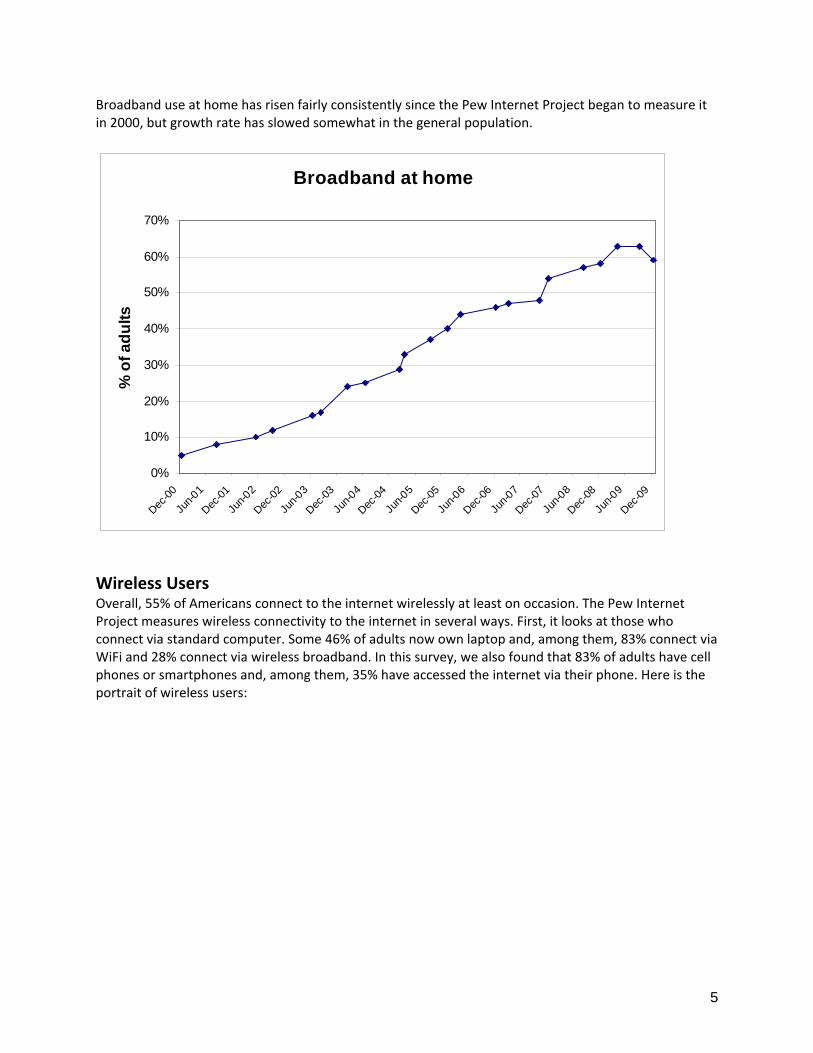
Broadband use at home has risen fairly consistently since the Pew Internet Project began to measure it in 2000, but growth rate has slowed somewhat in the general population.
Broadband at home
0%
10%
20%
30%
40%
50%
60%
70%
Dec-0
0
Jun-
01
Dec-0
1
Jun-
02
Dec-0
2
Jun-
03
Dec-0
3
Jun-
04
Dec-0
4
Jun-
05
Dec-0
5
Jun-
06
Dec-0
6
Jun-
07
Dec-0
7
Jun-
08
Dec-0
8
Jun-
09
Dec-0
9
% o
f a
du
lts
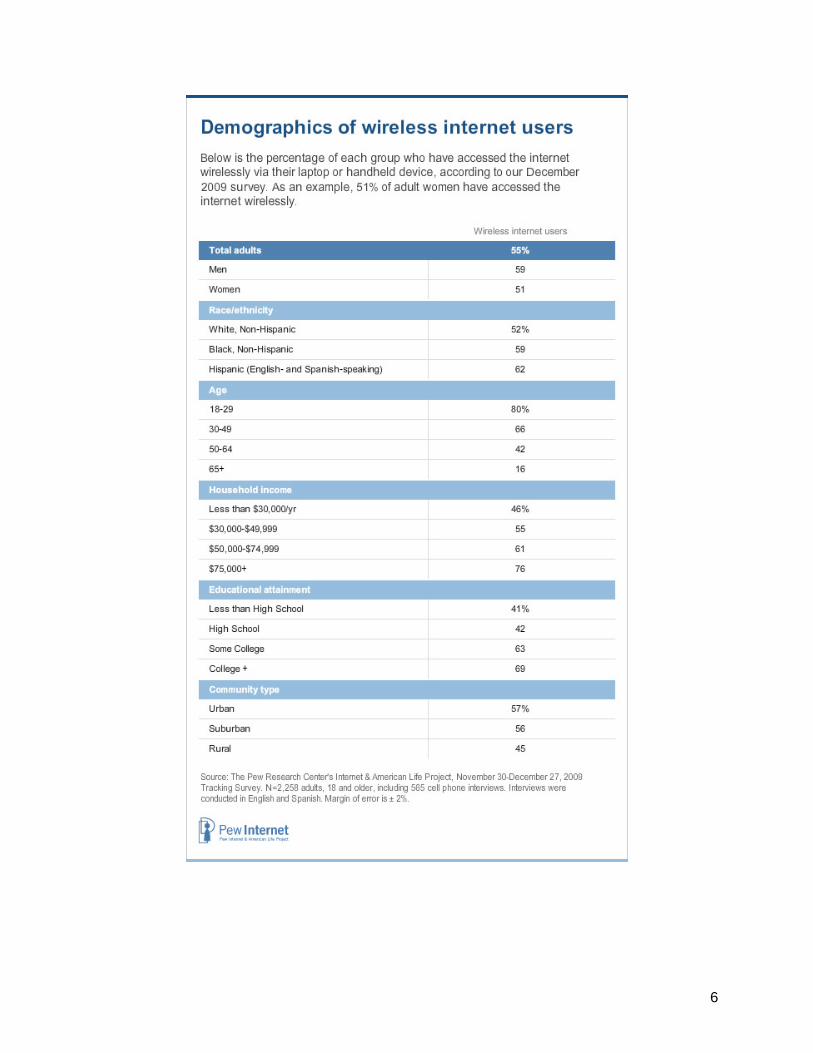
Wireless Users Overall, 55% of Americans connect to the internet wirelessly at least on occasion. The Pew Internet Project measures wireless connectivity to the internet in several ways. First, it looks at those who connect via standard computer. Some 46% of adults now own laptop and, among them, 83% connect via WiFi and 28% connect via wireless broadband. In this survey, we also found that 83% of adults have cell phones or smartphones and, among them, 35% have accessed the internet via their phone. Here is the portrait of wireless users:
5
6

About the Pew Research Center’s Internet & American Life Project The Pew Research Center’s Internet & American Life Project is one of seven projects that make up the Pew Research Center, a nonpartisan, nonprofit "fact tank" that provides information on the issues, attitudes and trends shaping America and the world. The Project produces reports exploring the impact of the internet on families, communities, work and home, daily life, education, health care, and civic and political life. The Project aims to be an authoritative source on the evolution of the internet through surveys that examine how Americans use the internet and how their activities affect their lives. The Pew Internet Project takes no positions on policy issues related to the internet or other communications technologies. It does not endorse technologies, industry sectors, companies, nonprofit organizations, or individuals.
Methodology This report is based on the findings of a daily tracking survey on Americans' use of the internet. The results in this report are based on data from telephone interviews conducted by Princeton Survey Research Associates International between November 30 and December 27, 2009, among a sample of 2,258 adults, age 18 and older. Interviews were conducted in both English (n=2,197) and Spanish (n=61). For results based on the total sample, one can say with 95% confidence that the error attributable to sampling and other random effects is plus or minus 2.4 percentage points. For results based internet users (n=1,676), the margin of sampling error is plus or minus 2.8 percentage points. In addition to sampling error, question wording and practical difficulties in conducting telephone surveys may introduce some error or bias into the findings of opinion polls. A combination of landline and cellular random digit dial (RDD) samples was used to represent all adults in the continental United States who have access to either a landline or cellular telephone. Both samples were provided by Survey Sampling International, LLC (SSI) according to PSRAI specifications. Numbers for the landline sample were selected with probabilities in proportion to their share of listed telephone households from active blocks (area code + exchange + two‐digit block number) that contained three or more residential directory listings. The cellular sample was not list‐assisted, but was drawn through a systematic sampling from dedicated wireless 100‐blocks and shared service 100‐blocks with no directory‐listed landline numbers. New sample was released daily and was kept in the field for at least five days. The sample was released in replicates, which are representative subsamples of the larger population. This ensures that complete call procedures were followed for the entire sample. At least 7 attempts were made to complete an interview at sampled telephone number. The calls were staggered over times of day and days of the week to maximize the chances of making contact with a potential respondent. Each number received at least one daytime call in an attempt to find someone available. For the landline sample, half of the time interviewers first asked to speak with the youngest adult male currently at home. If no male was at home at the time of the call, interviewers asked to speak with the youngest adult female. For the other half of the contacts interviewers first asked to speak with the youngest adult female currently at home. If no female was available, interviewers asked to speak with the youngest adult male at home. For the cellular sample, interviews were conducted with the person who answered the phone. Interviewers verified that the person was an adult and in a safe place before administering the survey. Cellular
7

sample respondents were offered a post‐paid cash incentive for their participation. All interviews completed on any given day were considered to be the final sample for that day. Non‐response in telephone interviews produces some known biases in survey‐derived estimates because participation tends to vary for different subgroups of the population, and these subgroups are likely to vary also on questions of substantive interest. In order to compensate for these known biases, the sample data are weighted in analysis. The demographic weighting parameters are derived from a special analysis of the most recently available Census Bureau’s March 2009 Annual Social and Economic Supplement. This analysis produces population parameters for the demographic characteristics of adults age 18 or older. These parameters are then compared with the sample characteristics to construct sample weights. The weights are derived using an iterative technique that simultaneously balances the distribution of all weighting parameters.
8

Following is the full disposition of all sampled telephone numbers:
Table 1:Sample Disposition
Landline Cell
21990 8100 T Total Numbers Dialed
1263 183 OF Non‐residential
1068 6 OF Computer/Fax
10 0 OF Cell phone
9496 3132 OF Other not working
1130 140 UH Additional projected not working
9023 4639 Working numbers
41.0% 57.3% Working Rate
377 47 UH No Answer / Busy
1201 1101 UONC Voice Mail
40 8 UONC Other Non‐Contact
7405 3483 Contacted numbers
82.1% 75.1% Contact Rate
668 642 UOR Callback
4868 1940 UOR Refusal
1869 901 Cooperating numbers
25.2% 25.9% Cooperation Rate
66 27 IN1 Language Barrier
0 291 IN2 Child's cell phone
1803 583 Eligible numbers
96.5% 64.7% Eligibility Rate
110 18 R Break‐off
1693 565 I Completes
93.9% 96.9% Completion Rate
19.5% 18.8% Response Rate
The disposition reports all of the sampled telephone numbers ever dialed from the original telephone number samples. The response rate estimates the fraction of all eligible respondents in the sample that were ultimately interviewed. At PSRAI it is calculated by taking the product of three component rates:
o Contact rate – the proportion of working numbers where a request for interview was made o Cooperation rate – the proportion of contacted numbers where a consent for interview was at
least initially obtained, versus those refused o Completion rate – the proportion of initially cooperating and eligible interviews that were
completed
Thus the response rate for the landline sample was 19.5 percent. The response rate for the cellular sample was 18.8 percent. Survey Questions
9

December Tracking Survey 2009 Final Topline 1/4/10
Data for November 30 – December 27, 2009
Princeton Survey Research Associates International for the Pew Research Center’s Internet & American Life Project
Sample: n= 2,258 national adults, age 18 and older, including 565 cell phone interviews Interviewing dates: 11.30.09 – 12.27.09 Margin of error is plus or minus 2 percentage points for results based on Total [n=2,258] Margin of error is plus or minus 3 percentage points for results based on internet users [n=1,676]
Q6a Do you use the internet, at least occasionally?
Q6b Do you send or receive email, at least occasionally?3
USES INTERNET DOES NOT USE INTERNET
Current 74 26
September 2009 77 23
April 2009i 79 21
December 2008ii 74 26
November 2008iii 74 26
August 2008iv 75 25
July 2008v 77 23
May 2008vi 73 27
April 2008vii 73 27
January 2008viii 70 30
December 2007ix 75 25
September 2007x 73 27
February 2007xi 71 29
December 2006xii 70 30
November 2006xiii 68 32
August 2006xiv 70 30
April 2006xv 73 27
February 2006xvi 73 27
December 2005xvii 66 34
September 2005xviii 72 28
June 2005xix 68 32
February 2005xx 67 33
January 2005xxi 66 34
Nov 23‐30, 2004xxii 59 41
November 2004xxiii 61 39
June 2004xxiv 63 37
February 2004xxv 63 37
November 2003xxvi 64 36
August 2003xxvii 63 37
3 Prior to January 2005, question wording was “Do you ever go online to access the Internet or World Wide Web or to send and receive email?”
10

June 2003xxviii 62 38
May 2003xxix 63 37
March 3‐11, 2003xxx 62 38
February 2003xxxi 64 36
December 2002xxxii 57 43
November 2002xxxiii 61 39
October 2002xxxiv 59 41
September 2002xxxv 61 39
July 2002xxxvi 59 41
March/May 2002xxxvii 58 42
January 2002xxxviii 61 39
December 2001xxxix 58 42
November 2001xl 58 42
October 2001xli 56 44
September 2001xlii 55 45
August 2001xliii 59 41
February 2001xliv 53 47
December 2000xlv 59 41
November 2000xlvi 53 47
October 2000xlvii 52 48
September 2000xlviii 50 50
August 2000xlix 49 51
June 2000l 47 53
May 2000li 48 52
Q8 About how often do you use the internet or email from … [INSERT IN ORDER] – several times a
day, about once a day, 3‐5 days a week, 1‐2 days a week, every few weeks, less often or never?
Based on internet users [N=1,676]
SEVERAL TIMES A DAY
ABOUT ONCE A DAY
3‐5 DAYS A WEEK
1‐2 DAYS A WEEK
EVERY FEW
WEEKS LESS OFTEN NEVER
DON’T KNOW REFUSED
a. Home Current 38 21 13 13 4 4 6 * *
September 2009 37 21 13 13 4 4 6 * *
April 2009 37 22 15 11 3 3 8 * *
December 2008 35 22 15 13 4 3 6 * *
November 2008 34 23 15 12 4 5 7 * *
August 2008 35 22 15 13 5 3 7 * ‐‐ July 20084 29 25 17 14 4 4 7 * ‐‐
May 2008 37 21 15 11 5 6 6 * ‐‐ December 2007 36 22 14 11 5 6 7 * ‐‐
September 2007 34 21 15 12 5 6 6 * ‐‐ February 2007 31 24 15 12 6 7 5 * ‐‐
November 2006 30 24 16 13 5 5 7 * ‐‐ February 2006 29 25 17 12 5 6 6 * ‐‐
June 2005 27 22 15 13 6 7 10 * ‐‐ July 2004lii 27 27 17 13 5 5 7 * ‐‐
4 Beginning in July 2008, “Never” is offered as an explicitly read category. Prior to July 2008, it was a volunteered category.
11

March 2004liii 29 24 15 13 6 5 8 * ‐‐ b. Work
Current 33 6 4 3 1 2 49 * *
September 2009 34 7 4 4 2 3 46 * *
April 2009 36 8 6 4 1 2 41 * 1
December 2008 36 9 5 4 2 2 40 * *
November 2008 36 7 4 4 2 3 44 * *
August 2008 37 7 5 5 2 2 42 1 ‐‐ July 2008 32 8 4 3 1 2 48 2 ‐‐
May 2008 36 8 5 5 1 7 37 1 ‐‐ December 2007 37 9 3 4 1 5 40 1 ‐‐
September 2007 35 9 5 4 1 4 42 * ‐‐ February 2007 38 9 5 3 2 5 38 1 ‐‐
November 2006 31 9 5 5 2 4 43 1 ‐‐ February 2006 35 8 5 3 2 7 40 1 ‐‐
June 2005 35 9 5 4 2 6 39 * ‐‐ July 2004 28 12 5 4 1 5 44 * ‐‐
March 2004 28 10 5 6 2 4 44 * ‐‐
Q9 As I read the following list of items, please tell me if you happen to have each one, or not. Do
you have… [INSERT ITEMS IN ORDER]?
YES NO DON’T KNOW REFUSED
a. A desktop computer
Current 58 42 * *
September 2009 62 37 0 * April 2009 64 36 * * April 2008 65 34 * ‐‐ Dec 2007 65 35 * ‐‐ April 2006 68 32 * ‐‐
b. A laptop computer [includes netbook]
Current 46 53 * *
September 2009 47 53 * * April 2009 47 53 * * April 2008 39 61 * ‐‐ Dec 2007 37 63 * ‐‐ April 2006 30 69 * ‐‐
c. A cell phone or a Blackberry or iPhone or other device that is also a cell phone5
Current 83 17 0 *
September 2009 84 15 * *
April 2009 85 15 * *
April 2008 78 22 * ‐‐
Dec 2007 75 25 * ‐‐
5 Prior to April 2009, item wording was “A cell phone.” Beginning December 2007, this item was not asked of the cell phone sample, but results shown here reflect Total combined Landline and cell phone sample.
12
Sept 2007 78 22 * ‐‐
April 2006 73 27 * ‐‐
January 20056 66 34 * ‐‐
November 23‐30, 2004 65 35 * ‐‐
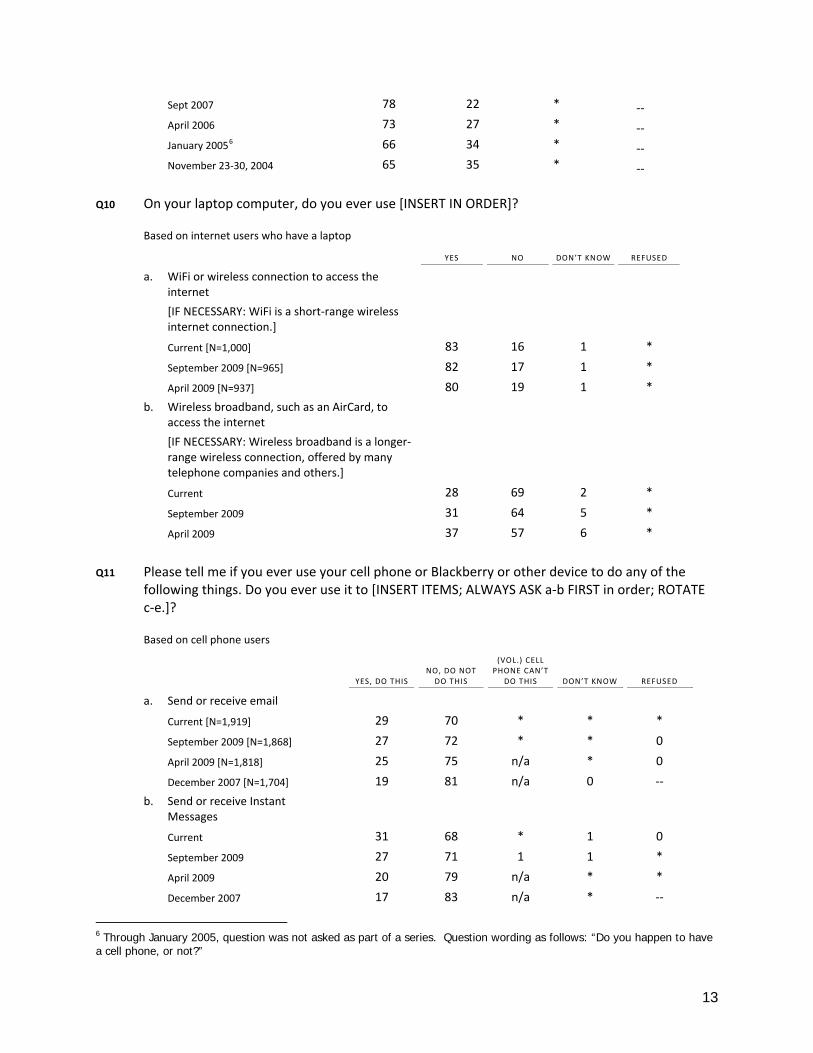
Q10 On your laptop computer, do you ever use [INSERT IN ORDER]?
Based on internet users who have a laptop
YES NO DON’T KNOW REFUSED
a. WiFi or wireless connection to access the internet
[IF NECESSARY: WiFi is a short‐range wireless internet connection.]
Current [N=1,000] 83 16 1 *
September 2009 [N=965] 82 17 1 *
April 2009 [N=937] 80 19 1 *
b. Wireless broadband, such as an AirCard, to access the internet
[IF NECESSARY: Wireless broadband is a longer‐range wireless connection, offered by many telephone companies and others.]
Current 28 69 2 *
September 2009 31 64 5 *
April 2009 37 57 6 *
Q11 Please tell me if you ever use your cell phone or Blackberry or other device to do any of the
following things. Do you ever use it to [INSERT ITEMS; ALWAYS ASK a‐b FIRST in order; ROTATE c‐e.]?
Based on cell phone users
YES, DO THIS NO, DO NOT DO THIS
(VOL.) CELL PHONE CAN’T
DO THIS DON’T KNOW REFUSED
a. Send or receive email
Current [N=1,919] 29 70 * * *
September 2009 [N=1,868] 27 72 * * 0
April 2009 [N=1,818] 25 75 n/a * 0
December 2007 [N=1,704] 19 81 n/a 0 ‐‐
b. Send or receive Instant Messages
Current 31 68 * 1 0
September 2009 27 71 1 1 *
April 2009 20 79 n/a * *
December 2007 17 83 n/a * ‐‐
6 Through January 2005, question was not asked as part of a series. Question wording as follows: “Do you happen to have a cell phone, or not?”
13

14
c. Access the internet7
Current 32 67 1 * 0
September 2009 29 71 1 * 0
April 2009 25 74 n/a * *
December 2007 19 81 n/a 0 ‐‐
WIRELESS Wireless internet use8
WIRELESS INTERNET
USER INTERNET USER BUT
NOT WIRELESS ALL OTHERS
Current 55 24 21
September 2009 54 25 21
April 2009 56 23 20
December 2008 43 30 26
November 2008 37 37 26
i April 2009 trends based on the Spring 2009 Tracking survey, conducted March 26-April 19, 2009 [N=2,253, including 561 cell phone interviews]. ii December 2008 trends based on the Fall Tracking survey, conducted November 19-December 20, 2008 [N=2,253, including 502 cell phone interviews]. Trends do not include California oversample. iii November 2008 trends based on the Post-Election 2008 Tracking survey, conducted November 20-December 4, 2008 [N=2,254]. iv August 2008 trends based on the August Tracking 2008 survey, conducted August 12-31, 2008 [N=2,251]. v July 2008 trends based on the Personal Networks and Community survey, conducted July 9-August 10, 2008 [N=2,512, including 505 cell phone interviews] vi May 2008 trends based on the Spring Tracking 2008 survey, conducted April 8-May 11, 2008 [N=2,251]. vii April 2008 trends based on the Networked Workers survey, conducted March 27-April 14, 2008. Most questions were asked only of full- or part-time workers [N=1,000], but trend results shown here reflect the total sample [N=2,134]. viii January 2008 trends based on the Networked Families survey, conducted December 13, 2007-January 13, 2008 [N=2,252]. ix December 2007 trends based on the Annual Gadgets survey, conducted October 24-December 2, 2007 [N=2,054, including 500 cell phone interviews]. x September 2007 trends based on the Consumer Choice survey, conducted August 3-September 5, 2007 [N=2,400, oversample of 129 cell phone interviews].
7 In December 2007, item wording was “Access the internet for news, weather, sports, or other information” 8 Definitions for wireless internet use may vary from survey to survey.

15
xi February 2007 trends based on daily tracking survey conducted February 15-March 7, 2007 [N=2,200]. xii December 2006 trends based on daily tracking survey, conducted November 30 - December 30, 2006 [N=2,373]. xiii November 2006 trends based on Post-Election tracking survey, conducted Nov. 8-Dec. 4, 2006 [N=2,562]. This includes an RDD sample [N=2,362] and a cell phone only sample [N=200]. Results reflect combined samples, where applicable. xiv August 2006 trends based on daily tracking survey, conducted August 1-31, 2006 [N=2,928]. xv April 2006 trends based on the Annual Gadgets survey, conducted Feb. 15-Apr. 6, 2006 [N=4,001]. xvi February 2006 trends based on the Exploratorium Survey, conducted Jan. 9-Feb. 6, 2006 [N=2,000]. xvii December 2005 trends based on daily tracking survey conducted Nov. 29-Dec. 31, 2005 [N=3,011]. xviii September 2005 trends based on daily tracking survey conducted Sept. 14-Oct.13, 2005 [N=2,251]. xix June 2005 trends based on the Spyware Survey, conducted May 4-June 7, 2005 [N=2,001]. xx February 2005 trends based on daily tracking survey conducted Feb. 21-March 21, 2005 [N=2,201]. xxi January 2005 trends based on daily tracking survey conducted Jan. 13-Feb.9, 2005 [N=2,201]. xxii November 23-30, 2004 trends based on the November 2004 Activity Tracking Survey, conducted November 23-30, 2004 [N=914]. xxiii November 2004 trends based on the November Post-Election Tracking Survey, conducted Nov 4-Nov 22, 2004 [N=2,200]. xxiv June 2004 trends based on daily tracking survey conducted May 14-June 17, 2004 [N=2,200]. xxv February 2004 trends based on daily tracking survey conducted February 3-March 1, 2004 [N=2,204]. xxvi November 2003 trends based on daily tracking survey conducted November 18-December 14, 2003 [N=2,013]. xxvii August 2003 trends based on ‘E-Government’ survey conducted June 25-August 3, 2003 [N=2,925]. xxviii June 2003 trends based on ‘Internet Spam’ survey conducted June 10-24, 2003 [N=2,200]. xxix May 2003 trends based on daily tracking survey conducted April 29-May 20, 2003 [N=1,632]. xxx March 3-11, 2003 trends based on daily tracking survey conducted March 3-11, 2003 [N=743]. xxxi February 2003 trends based on daily tracking survey conducted February 12-March 2, 2003 [N=1,611]. xxxii December 2002 trends based on daily tracking survey conducted Nov. 25–Dec. 22, 2002 [N=2,038]. xxxiii November 2002 trends based on daily tracking survey conducted October 28-November 24, 2002 [N=2,745]. xxxiv October 2002 trends based on daily tracking survey conducted October 7-27, 2002 [N=1,677]. xxxv September 2002 trends based on daily tracking survey conducted September 9-October 6, 2002 [N=2,092]. xxxvi July 2002 trends based on ‘Sept. 11th-The Impact Online’ survey conducted June 26-July 26, 2002 [N=2,501]. xxxvii March/May 2002 trends based on daily tracking surveys conducted March 1-31, 2002 and May 2-19, 2002. xxxviii January 2002 trends based on a daily tracking survey conducted January 3-31, 2002. xxxix December 2001 trends represent a total tracking period of December 1-23, 2001 [N=3,214]. This tracking period based on daily tracking surveys conducted December 17-23, 2001 and November 19-December 16, 2001.
xl November 2001 trends represent a total tracking period of November 1-30, 2001 [N=2,119]. This tracking period based on daily tracking surveys conducted October 19 – November 18, 2001 and November 19 – December 16, 2001. xli October 2001 trends represent a total tracking period of October 1-31, 2001 [N=1,924]. This tracking period based on daily tracking surveys conducted September 20 – October 1, 2001, October 2-7, 2001, October 8-18, 2001, and October 19 – November 18, 2001. xlii September 2001 trends represent a total tracking period of September 1-30, 2001 [N=742]. This tracking period based on daily tracking surveys conducted August 13-September 10, 2001, September 12-19, 2001 and September 20 – October 1, 2001.
16
xliii August 2001 trends represent a total tracking period of August 13-31, 2001 [N=1,505]. This tracking period based on a daily
tracking survey conducted August 13-September 10, 2001.
xliv February 2001 trends based on a daily tracking survey conducted February 1, 2001-March 1, 2001 [N=2,096]. xlv December 2000 trends based on a daily tracking survey conducted December 2-22, 2000 [N=2,383]. xlvi November 2000 trends based on a daily tracking survey conducted November 2, 2000 – December 1 [N=6,322]. xlvii October 2000 trends based on a daily tracking survey conducted October 2 – November 1, 2000 [N=3,336]. xlviii September 2000 trends based on a daily tracking survey conducted September 15 – October 1, 2000 [N=1,302]. xlix August 2000 trends based on a daily tracking survey conducted July 24 – August 20, 2000 [N=2,109]. l June 2000 trends based on a daily tracking survey conducted May 2 – June 30, 2000 [N=4,606]. li May 2000 trends based on a daily tracking survey conducted March 1 – May 1, 2000 [N=6,036]. lii July 2004 trend figures based on the “Selective Exposure” survey, conducted June 14-July 3, 2004 [N=1,510]. liii March 2004 trends based on “Weak Ties” survey conducted February 17-March 17, 2004 [N=2,200].