Internet Access Services: Status as of December …This report summarizes information about Internet...
63
Internet Access Services: Status as of December 31, 2016 Industry Analysis and Technology Division Wireline Competition Bureau February 2018 This report is available for reference in the FCC’s Reference Information Center, Courtyard Level, 445 12th Street, SW, Washington, DC. Copies may be purchased by contacting Best Copy and Printing, Inc., 445 12th Street, SW, Room CY-B402, Washington, DC 20554, telephone (800) 378-3160, or via their website at www.bcpiweb.com. The report can also be downloaded from the Internet Access Services Reports webpage at https://www.fcc.gov/general/iatd-data-statistical-reports.
Transcript of Internet Access Services: Status as of December …This report summarizes information about Internet...
Internet Access Services:
Status as of December 31, 2016
Industry Analysis and Technology Division
Wireline Competition Bureau
February 2018
This report is available for reference in the FCC’s Reference Information Center, Courtyard Level, 445 12th
Street, SW, Washington, DC. Copies may be purchased by contacting Best Copy and Printing, Inc., 445 12th
Street, SW, Room CY-B402, Washington, DC 20554, telephone (800) 378-3160, or via their website at
www.bcpiweb.com. The report can also be downloaded from the Internet Access Services Reports webpage
at https://www.fcc.gov/general/iatd-data-statistical-reports.
Table of Contents
SECTION 1: OVERVIEW & HIGHLIGHTS .....................................................................1
Introduction ..............................................................................................................................1
Total Connections ....................................................................................................................2
Figure 1 Fixed and Mobile Connections by Speed 2013-2016 .....................................2
Connections by Speed ..............................................................................................................3
Figure 2(a) Distribution of Fixed Connections by Downstream Speed.............................3
Figure 2(b) Distribution of Fixed Connections by Upstream Speed .................................4
Figure 3 Fixed Connections by Speed 2013-2016 ........................................................5
Number of Providers by Census Block ..................................................................................6
Figure 4 Percentages of Developed Census Blocks in which Providers
Report Deployment of Residential Fixed Broadband .....................................6
Internet Access Subscribership ..............................................................................................7
Figure 5 Fixed Connections 2001-2016 ........................................................................7
Other Report Highlights..........................................................................................................8
SECTION 2: SUMMARY STATISTICS - THE NATION ..............................................10
SECTION 3: SUMMARY STATISTICS - THE STATES ...............................................28
SECTION 4: SUMMARY STATISTICS - COUNTIES AND CENSUS TRACTS .......38
SECTION 5: CORRELATION RESULTS - DEMOGRAPHIC MEASURES ..............48
Technical Notes ......................................................................................................................56
Glossary ..................................................................................................................................59
SECTION 1: OVERVIEW & HIGHLIGHTS
Introduction
This report summarizes information about Internet access connections in the United States as of
December 31, 2016 as collected by FCC Form 477. For purposes of this report, Internet access
connections are those in service, over 200 kilobits per second (kbps) in at least one direction, and reported
to the FCC through Form 477.1
The report includes data on total and residential Internet access connections by downstream and upstream
speed, by technology, by geography, and over time. Section 2 of the report presents nationwide statistics,
Section 3 provides state-level data, and Section 4 includes data on the subscribership differences among
counties and census tracts.2 In addition, Section 5 of the report includes an analysis of the correlations
between subscribership ratios and various demographic measures.3 Maps depicting the number of fixed
connections per 1,000 households by census tract and the number of fixed providers by census block are
available online at https://www.fcc.gov/reports-research/reports/internet-access-services-reports/internet-
access-services-reports.
1 See the Technical Notes and Glossary at the end of this report for more-detailed information about the Form 477
data collection and the meaning of terms used in this report. Note that the Form 477 data for the June 30, 2014
filing period were not subject to typical quality checks. See Internet Access Services: Status as of December 31,
2014 (March 2016) at 2, available at https://apps.fcc.gov/edocs_public/attachmatch/DOC-338630A1.pdf. In
addition, the figures on mobile broadband subscribership by speed tier (formerly Figures 4(a), 4(b), and 12) have
been removed to maintain firm confidentiality.
2 The Commission began collecting census tract-level data for data as of December 31, 2008. See High-Speed
Services for Internet Access: Status as of December 31, 2008 (February 2010) (December 2008 High-Speed Report)
at 1-4, available at http://www.fcc.gov/encyclopedia/high-speed-services-internet-access-reports.
3 Publicly-available data that are too voluminous to include in this report are available online at
https://www.fcc.gov/general/fcc-form-477-additional-data.
1
Total Connections
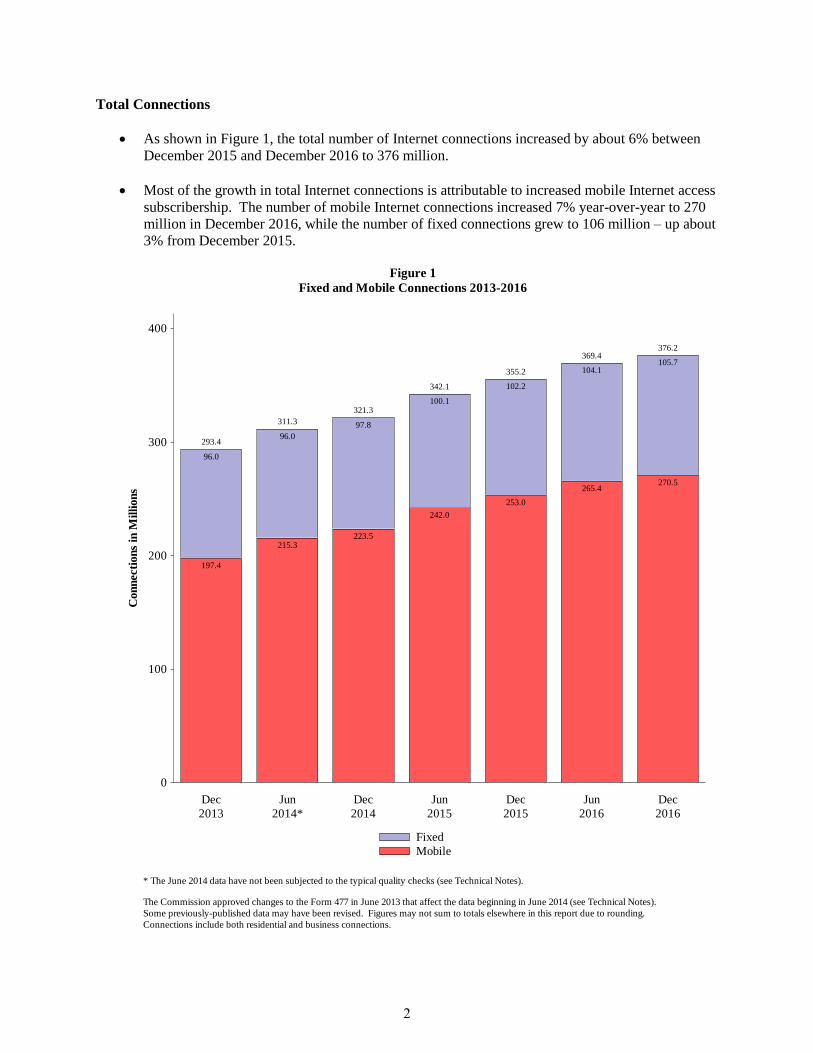
As shown in Figure 1, the total number of Internet connections increased by about 6% between
December 2015 and December 2016 to 376 million.
Most of the growth in total Internet connections is attributable to increased mobile Internet access
subscribership. The number of mobile Internet connections increased 7% year-over-year to 270
million in December 2016, while the number of fixed connections grew to 106 million – up about
3% from December 2015.
Figure 1
Fixed and Mobile Connections 2013-2016
Connections include both residential and business connections.
Some previously-published data may have been revised. Figures may not sum to totals elsewhere in this report due to rounding.
The Commission approved changes to the Form 477 in June 2013 that affect the data beginning in June 2014 (see Technical Notes).
* The June 2014 data have not been subjected to the typical quality checks (see Technical Notes).
Fixed
Mobile
197.4
96.0
293.4
215.3
96.0
311.3
223.5
97.8
321.3
242.0
100.1
342.1
253.0
102.2
355.2
265.4
104.1
369.4
270.5
105.7
376.2
Con
necti
on
s in
Mil
lion
s
0
100
200
300
400
Dec
2013
Jun
2014*
Dec
2014
Jun
2015
Dec
2015
Jun
2016
Dec
2016
2
Connections by Speed
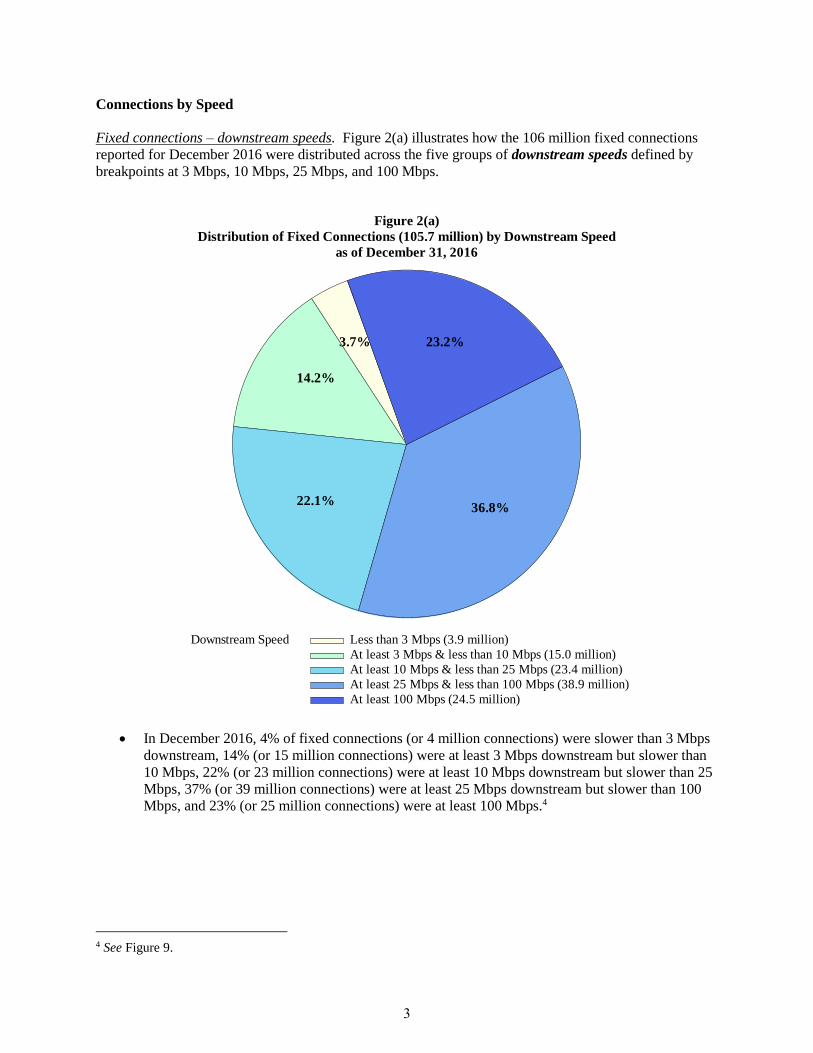
Fixed connections – downstream speeds. Figure 2(a) illustrates how the 106 million fixed connections
reported for December 2016 were distributed across the five groups of downstream speeds defined by
breakpoints at 3 Mbps, 10 Mbps, 25 Mbps, and 100 Mbps.
In December 2016, 4% of fixed connections (or 4 million connections) were slower than 3 Mbps
downstream, 14% (or 15 million connections) were at least 3 Mbps downstream but slower than
10 Mbps, 22% (or 23 million connections) were at least 10 Mbps downstream but slower than 25
Mbps, 37% (or 39 million connections) were at least 25 Mbps downstream but slower than 100
Mbps, and 23% (or 25 million connections) were at least 100 Mbps.4
4 See Figure 9.
Figure 2(a)
Distribution of Fixed Connections (105.7 million) by Downstream Speed
as of December 31, 2016
Downstream Speed Less than 3 Mbps (3.9 million)
At least 3 Mbps & less than 10 Mbps (15.0 million)
At least 10 Mbps & less than 25 Mbps (23.4 million)
At least 25 Mbps & less than 100 Mbps (38.9 million)
At least 100 Mbps (24.5 million)
3.7%
14.2%
22.1%36.8%
23.2%
3
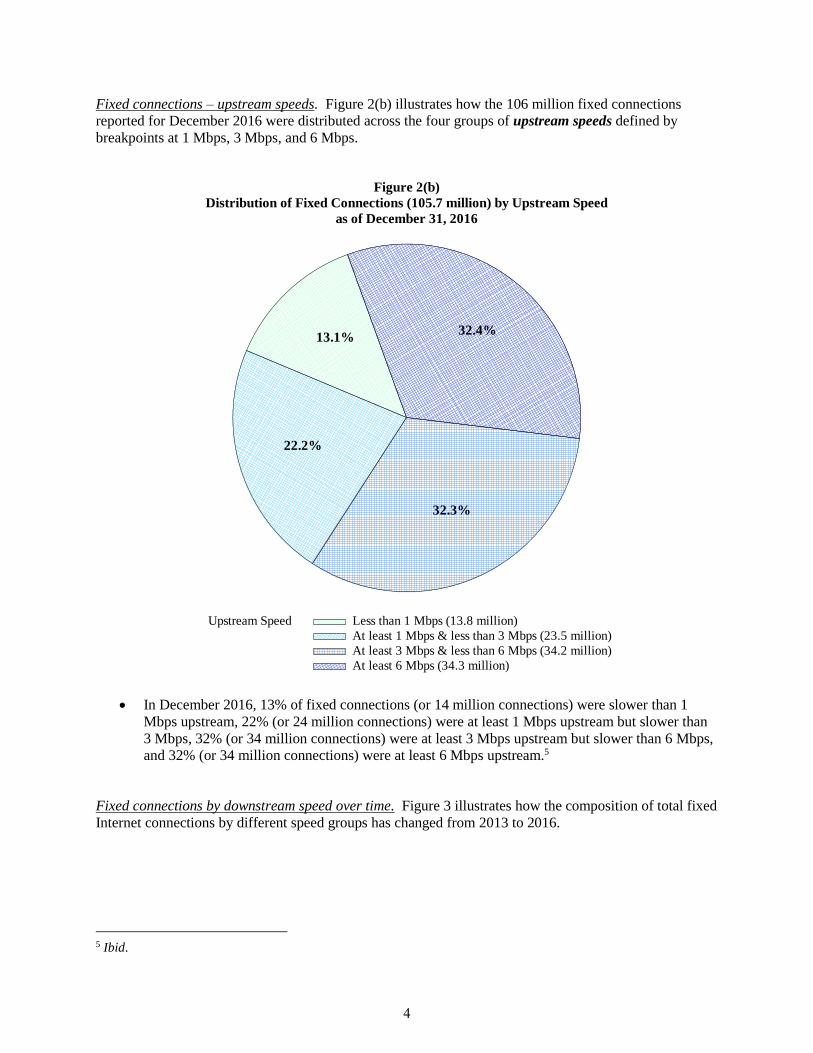
Fixed connections – upstream speeds. Figure 2(b) illustrates how the 106 million fixed connections
reported for December 2016 were distributed across the four groups of upstream speeds defined by
breakpoints at 1 Mbps, 3 Mbps, and 6 Mbps.
In December 2016, 13% of fixed connections (or 14 million connections) were slower than 1
Mbps upstream, 22% (or 24 million connections) were at least 1 Mbps upstream but slower than
3 Mbps, 32% (or 34 million connections) were at least 3 Mbps upstream but slower than 6 Mbps,
and 32% (or 34 million connections) were at least 6 Mbps upstream.5
Fixed connections by downstream speed over time. Figure 3 illustrates how the composition of total fixed
Internet connections by different speed groups has changed from 2013 to 2016.
5 Ibid.
Figure 2(b)
Distribution of Fixed Connections (105.7 million) by Upstream Speed
as of December 31, 2016
Upstream Speed Less than 1 Mbps (13.8 million)
At least 1 Mbps & less than 3 Mbps (23.5 million)
At least 3 Mbps & less than 6 Mbps (34.2 million)
At least 6 Mbps (34.3 million)
13.1%
22.2%
32.3%
32.4%
4
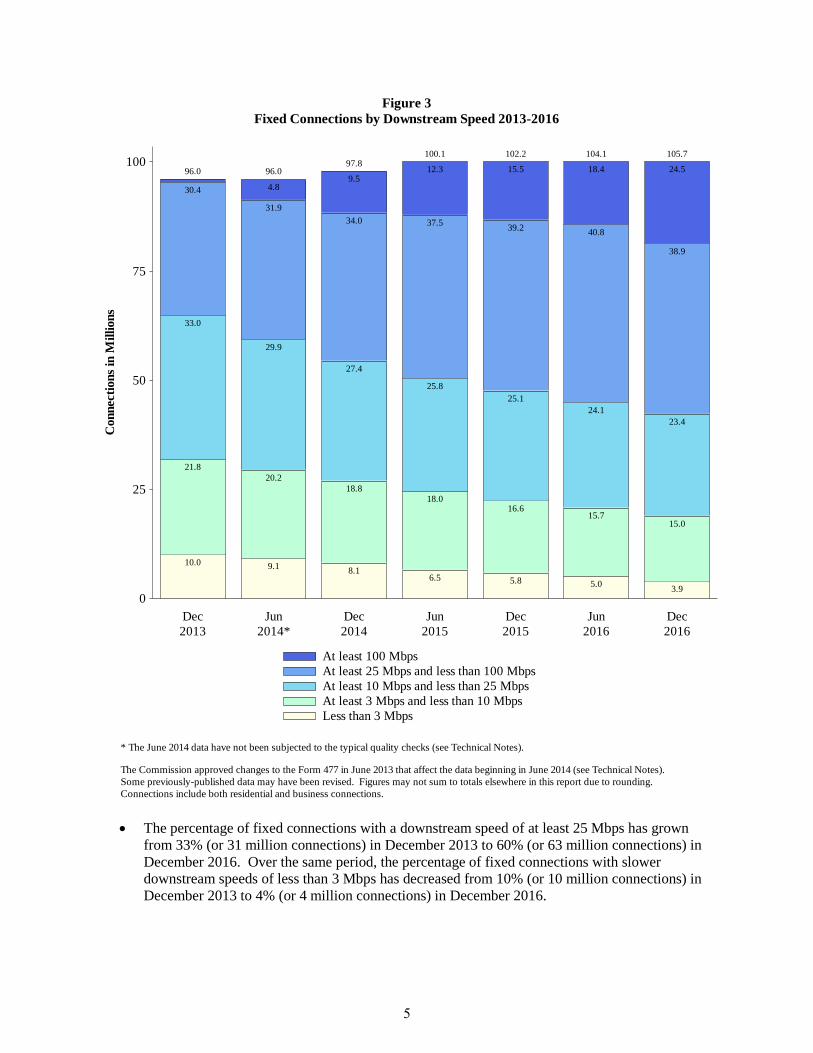
The percentage of fixed connections with a downstream speed of at least 25 Mbps has grown
from 33% (or 31 million connections) in December 2013 to 60% (or 63 million connections) in
December 2016. Over the same period, the percentage of fixed connections with slower
downstream speeds of less than 3 Mbps has decreased from 10% (or 10 million connections) in
December 2013 to 4% (or 4 million connections) in December 2016.
Figure 3
Fixed Connections by Downstream Speed 2013-2016
Connections include both residential and business connections.
Some previously-published data may have been revised. Figures may not sum to totals elsewhere in this report due to rounding.
The Commission approved changes to the Form 477 in June 2013 that affect the data beginning in June 2014 (see Technical Notes).
* The June 2014 data have not been subjected to the typical quality checks (see Technical Notes).
At least 100 Mbps
At least 25 Mbps and less than 100 Mbps
At least 10 Mbps and less than 25 Mbps
At least 3 Mbps and less than 10 Mbps
Less than 3 Mbps
10.0
21.8
33.0
30.4
96.0
9.1
20.2
29.9
31.9
4.8
96.0
8.1
18.8
27.4
34.0
9.5
97.8
6.5
18.0
25.8
37.5
12.3
100.1
5.8
16.6
25.1
39.2
15.5
102.2
5.0
15.7
24.1
40.8
18.4
104.1
3.9
15.0
23.4
38.9
24.5
105.7
Con
necti
on
s in
Mil
lion
s
0
25
50
75
100
Dec
2013
Jun
2014*
Dec
2014
Jun
2015
Dec
2015
Jun
2016
Dec
2016
5
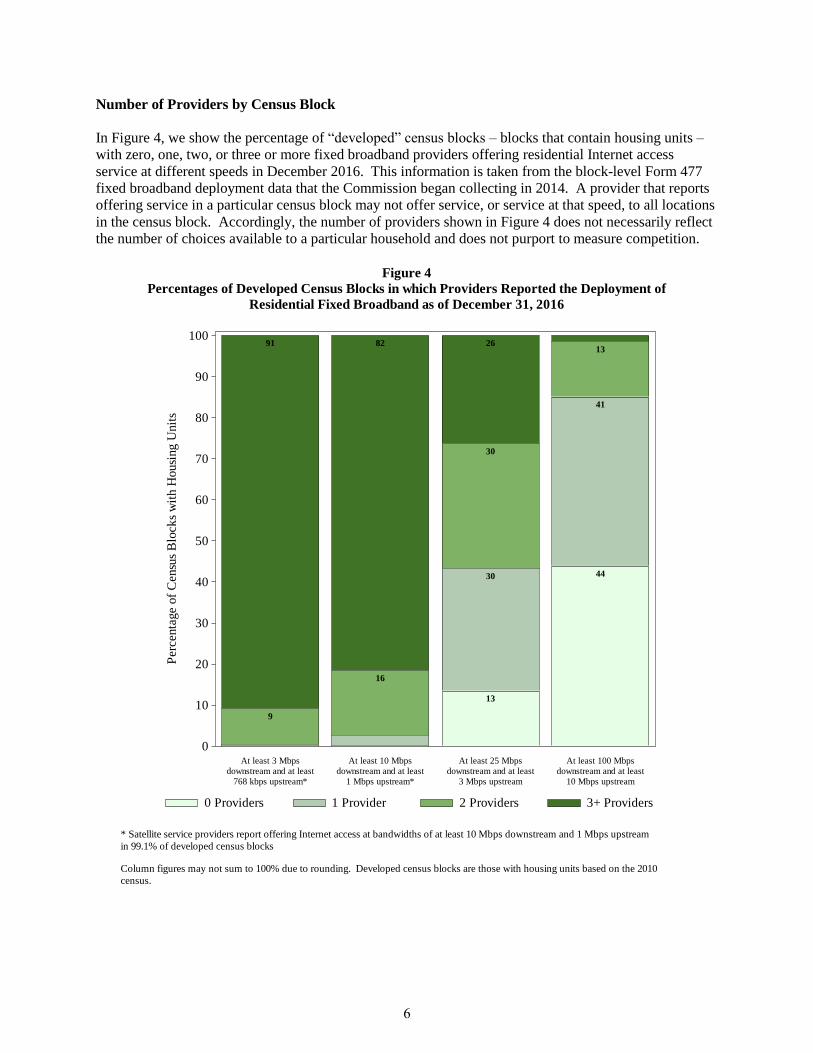
Number of Providers by Census Block
In Figure 4, we show the percentage of “developed” census blocks – blocks that contain housing units –
with zero, one, two, or three or more fixed broadband providers offering residential Internet access
service at different speeds in December 2016. This information is taken from the block-level Form 477
fixed broadband deployment data that the Commission began collecting in 2014. A provider that reports
offering service in a particular census block may not offer service, or service at that speed, to all locations
in the census block. Accordingly, the number of providers shown in Figure 4 does not necessarily reflect
the number of choices available to a particular household and does not purport to measure competition.
Figure 4
Percentages of Developed Census Blocks in which Providers Reported the Deployment of
Residential Fixed Broadband as of December 31, 2016
census.
Column figures may not sum to 100% due to rounding. Developed census blocks are those with housing units based on the 2010
in 99.1% of developed census blocks
* Satellite service providers report offering Internet access at bandwidths of at least 10 Mbps downstream and 1 Mbps upstream
0 Providers 1 Provider 2 Providers 3+ Providers
9
91
16
82
13
30
30
26
44
41
13
Per
centa
ge
of
Cen
sus
Blo
cks
wit
h H
ousi
ng U
nit
s
0
10
20
30
40
50
60
70
80
90
100
At least 3 Mbps
downstream and at least
768 kbps upstream*
At least 10 Mbps
downstream and at least
1 Mbps upstream*
At least 25 Mbps
downstream and at least
3 Mbps upstream
At least 100 Mbps
downstream and at least
10 Mbps upstream
6
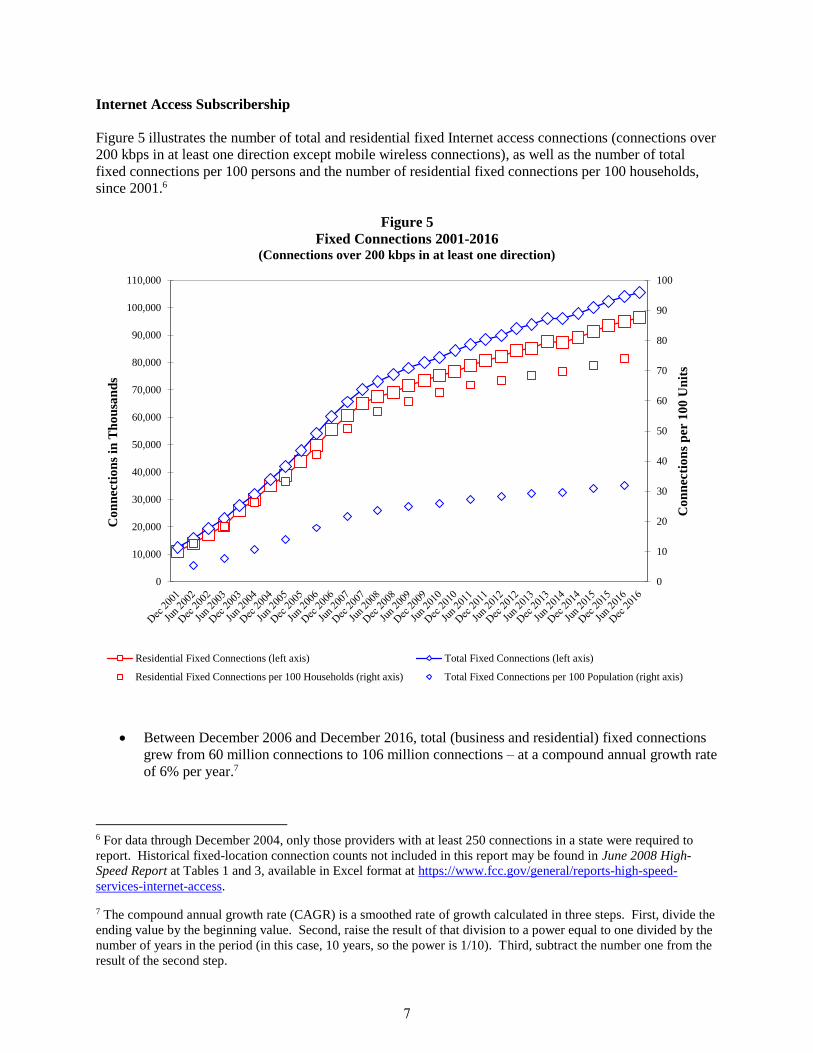
Internet Access Subscribership
Figure 5 illustrates the number of total and residential fixed Internet access connections (connections over
200 kbps in at least one direction except mobile wireless connections), as well as the number of total
fixed connections per 100 persons and the number of residential fixed connections per 100 households,
since 2001.6
Figure 5
Fixed Connections 2001-2016 (Connections over 200 kbps in at least one direction)
Between December 2006 and December 2016, total (business and residential) fixed connections
grew from 60 million connections to 106 million connections – at a compound annual growth rate
of 6% per year.7
6 For data through December 2004, only those providers with at least 250 connections in a state were required to
report. Historical fixed-location connection counts not included in this report may be found in June 2008 High-
Speed Report at Tables 1 and 3, available in Excel format at https://www.fcc.gov/general/reports-high-speed-
services-internet-access.
7 The compound annual growth rate (CAGR) is a smoothed rate of growth calculated in three steps. First, divide the
ending value by the beginning value. Second, raise the result of that division to a power equal to one divided by the
number of years in the period (in this case, 10 years, so the power is 1/10). Third, subtract the number one from the
result of the second step.
0
10
20
30
40
50
60
70
80
90
100
0
10,000
20,000
30,000
40,000
50,000
60,000
70,000
80,000
90,000
100,000
110,000
Co
nn
ecti
on
s p
er 1
00
Un
its
Co
nn
ecti
on
s in
Th
ou
san
ds
Residential Fixed Connections (left axis) Total Fixed Connections (left axis)
Residential Fixed Connections per 100 Households (right axis) Total Fixed Connections per 100 Population (right axis)
7
Over the same ten-year period, residential fixed connections grew from 56 million connections to
97 million connections – also at a compound annual growth rate of 6% per year.
From June 2006 to June 2016, the number of residential fixed connections per 100 U.S.
households increased from 42 to 74.8
Other Report Highlights
Average speeds
The median downstream speed of all reported fixed connections was 40 Mbps and the median
upstream speed was 5 Mbps. For residential fixed connections, the median downstream speed
was 50 Mbps and the median upstream speed was 5 Mbps.
Residential connections
Residential fixed Internet access connections increased by about 3% between December 2015 and
December 2016, to 97 million. See Figure 7.
Residential (non-business) mobile wireless Internet access connections on mobile devices with
data plans for full Internet access increased by 7%, to 226 million, between December 2015 and
December 2016. See Figure 7.
Approximately 81% of residential fixed connections had a speed of at least 10 Mbps downstream
and 1 Mbps upstream in December 2016, while 62% had a speed of at least 25 Mbps downstream
and 3 Mbps upstream. About 24% percent of all residential fixed connections had a downstream
speed of at least 100 Mbps. See Figures 10 and 27.
As a national average in December 2016, there were 66 residential fixed connections with speeds
of at least 10 Mbps downstream and 1 Mbps upstream per 100 households.9 See Figure 32.
8 We calculate residential fixed connections per 100 households using, in the denominator, U.S. household estimates
from the Census Bureau’s Current Population Survey (CPS) for July of each year and, for Puerto Rico and the other
inhabited island areas, Census 2010 households for 2010 and later years and Census 2000 households for the earlier
years. (The CPS also estimates U.S. households for March and November of each year.) Figure 5 also shows total
(business and residential) fixed connections per 100 population, which we calculate using U.S. Census Bureau
population estimates for the United States and Puerto Rico – which are as of July 1 each year – and, for the
remaining inhabited island areas, Census 2010 population for 2010 and later years and Census 2000 population for
the earlier years. This statistic incorporates connections to business locations into a comparison to persons. (We
note that the ratio of accurately-measured residential fixed connections to population has a maximum value for any
given country and point in time – the value when every household is connected – if we assume that no household
would have more than one fixed connection to its premises. For the United States in June, for example, the
maximum value would be 39 because there were about 128 million households in the United States and inhabited
insular areas and a population of about 327 million according to the sources used for Figure 5.)
9 Increases over time in the ratio of residential fixed connections to households indicate that increasing shares of
households are connected at home. The ratio is somewhat different from the “take rate” of offered service (which
may also be called an “adoption rate”) because some households may be located in areas where no fixed-location
service is offered. These methodological differences are discussed in greater detail in Inquiry Concerning the
Deployment of Advanced Telecommunications Capability to All Americans in a Reasonable and Timely Fashion,
and Possible Steps to Accelerate Such Deployment Pursuant to Section 706 of the Telecommunications Act of 1996,
8
Census tract and county shares of households with reportable connections
We estimate the share of households with fixed Internet access connections in individual census
tracts and counties as of December 31, 2016.10 We continue to observe substantial variation
among these estimates. See Figures 37 and 39.
Household subscribership rates and demographics
The report includes charts that illustrate correlations between household subscribership rates and
demographic measures. We update charts based on income, household density, education, age,
and race. The data indicate that some demographic variables are correlated with Internet access
subscribership rates. See Figures 44-50.
Amended by the Broadband Data Improvement Act, GN Docket No.11-121, Eighth Broadband Progress Report, 27
FCC Rcd 10342, 10386, para. 94 (2012).
10 For both census tracts and counties, we continue to find estimates above 100% for the share of households with
fixed Internet access connections. See p. 57 for more information.
9
SECTION 2
SUMMARY STATISTICS: THE NATION
Table of Contents
Figure 6 Connections over 200 kbps in at Least One Direction 2012-2016 .......................... 12
Figure 7 Residential Connections over 200 kbps in at Least One
Direction 2012-2016 ................................................................................................ 12
Figure 8 Residential Fixed Connections by Speed 2013-2016 .............................................. 13
Figure 9 Distribution of Fixed Connections over 200 kbps in at Least One
Direction as of December 31, 2016 ......................................................................... 14
Figure 10 Distribution of Residential Fixed Connections over 200 kbps in at Least
One Direction as of December 31, 2016 ................................................................. 15
Figure 11 Connections over 200 kbps in at Least One Direction by Technology
2012-2016 ................................................................................................................ 16
Figure 12 Connections by Technology as of December 31, 2016 ........................................... 16
Figure 13 Residential Connections over 200 kbps in at Least One Direction by Technology
2012-2016 ................................................................................................................ 17
Figure 14 Residential Connections by Technology as of December 31, 2016 ........................ 17
Figure 15 Fixed Connections at Least 3 Mbps Downstream and 768 kbps Upstream by
Technology 2012-2016 ............................................................................................ 18
Figure 16 Residential Fixed Connections at Least 3 Mbps Downstream and 768 kbps
Upstream by Technology 2012-2016 ...................................................................... 18
Figure 17 Fixed Connections at Least 10 Mbps Downstream and 1 Mbps Upstream by
Technology 2014-2016 ............................................................................................ 19
Figure 18 Fixed Connections at Least 10 Mbps Downstream and 1 Mbps Upstream by
Technology as of December 31, 2016 ..................................................................... 19
Figure 19 Residential Fixed Connections at Least 10 Mbps Downstream and 1 Mbps
Upstream by Technology 2014-2016 ...................................................................... 20
Figure 20 Residential Fixed Connections at Least 10 Mbps Downstream and 1 Mbps
Upstream by Technology as of December 31, 2016 ................................................ 20
Figure 21 Fixed Connections at Least 25 Mbps Downstream and 3 Mbps Upstream by
Technology 2014-2016 ............................................................................................ 21
Figure 22 Fixed Connections at Least 25 Mbps Downstream and 3 Mbps Upstream by
Technology as of December 31, 2016 ..................................................................... 21
Figure 23 Residential Fixed Connections at Least 25 Mbps Downstream and 3 Mbps Upstream
by Technology 2014-2016 ....................................................................................... 22
Figure 24 Residential Fixed Connections at Least 25 Mbps Downstream and 3 Mbps Upstream
by Technology as of December 31, 2016 ................................................................ 22
Figure 25 Residential Fixed Connections over 200 kbps in at Least One Direction by
Technology 2012-2016 (Shares of Selected Technologies) .................................... 23
10
Figure 26 Residential Fixed Connections over 200 kbps in at Least One Direction by
Technology 2012-2016 (Net Adds for Selected Technologies) .............................. 23
Figure 27 Residential Fixed Connections by Technology as of December 31, 2016
(Shares of Selected Technologies for Selected Speeds) ......................................... 24
Figure 28 Fixed Connections by Downstream Speed Tier and Technology as of
December 31, 2016 ................................................................................................. 25
Figure 29 Residential Fixed Connections by Downstream Speed Tier and Technology as of
December 31, 2016 ................................................................................................. 26
Figure 30 Nationwide Number of Providers of Connections over 200 kbps in at Least One
Direction by Technology 2012-2016 ...................................................................... 27
Figure 31 Nationwide Number of Providers of Connections over 200 kbps in at Least One
Direction - Selected Technologies 2012-2016 ....................................................... 27
11
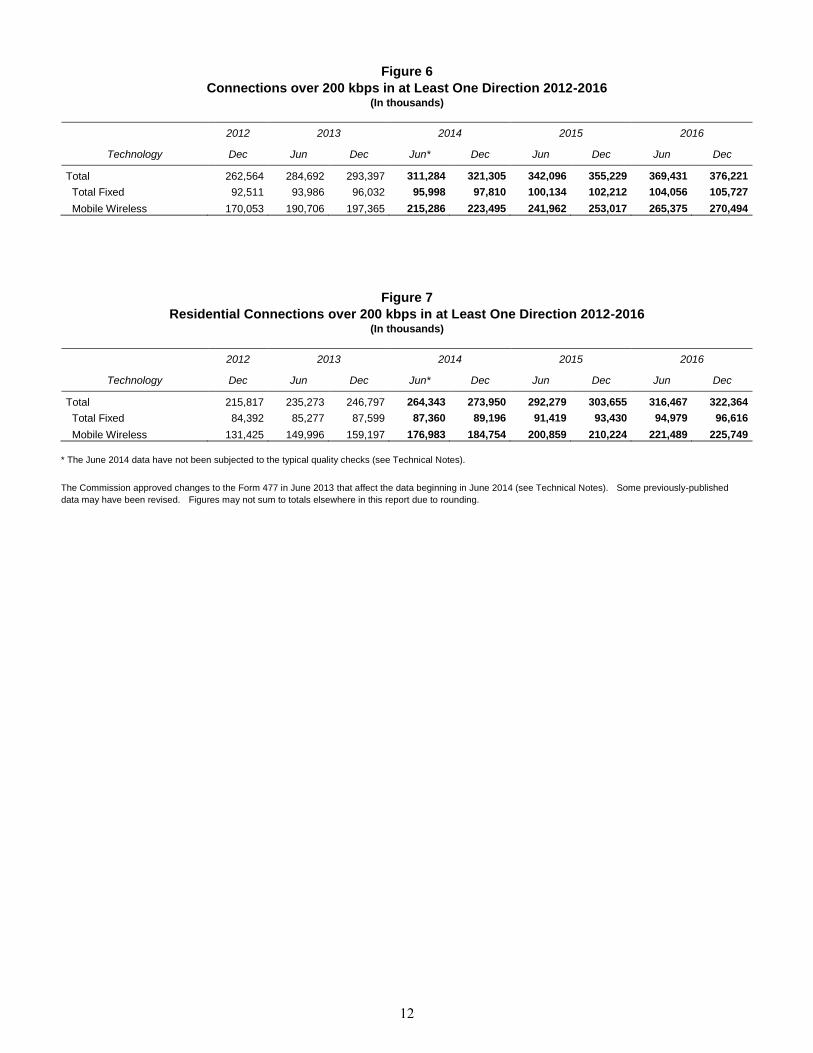
Figure 6
Connections over 200 kbps in at Least One Direction 2012-2016 (In thousands)
2012 2013 2014 2015 2016
Technology Dec Jun Dec Jun* Dec Jun Dec Jun Dec
Total 262,564 284,692 293,397 311,284 321,305 342,096 355,229 369,431 376,221
Total Fixed 92,511 93,986 96,032 95,998 97,810 100,134 102,212 104,056 105,727
Mobile Wireless 170,053 190,706 197,365 215,286 223,495 241,962 253,017 265,375 270,494
Figure 7
Residential Connections over 200 kbps in at Least One Direction 2012-2016 (In thousands)
2012 2013 2014 2015 2016
Technology Dec Jun Dec Jun* Dec Jun Dec Jun Dec
Total 215,817 235,273 246,797 264,343 273,950 292,279 303,655 316,467 322,364
Total Fixed 84,392 85,277 87,599 87,360 89,196 91,419 93,430 94,979 96,616
Mobile Wireless 131,425 149,996 159,197 176,983 184,754 200,859 210,224 221,489 225,749
* The June 2014 data have not been subjected to the typical quality checks (see Technical Notes).
The Commission approved changes to the Form 477 in June 2013 that affect the data beginning in June 2014 (see Technical Notes). Some previously-published
data may have been revised. Figures may not sum to totals elsewhere in this report due to rounding.
12
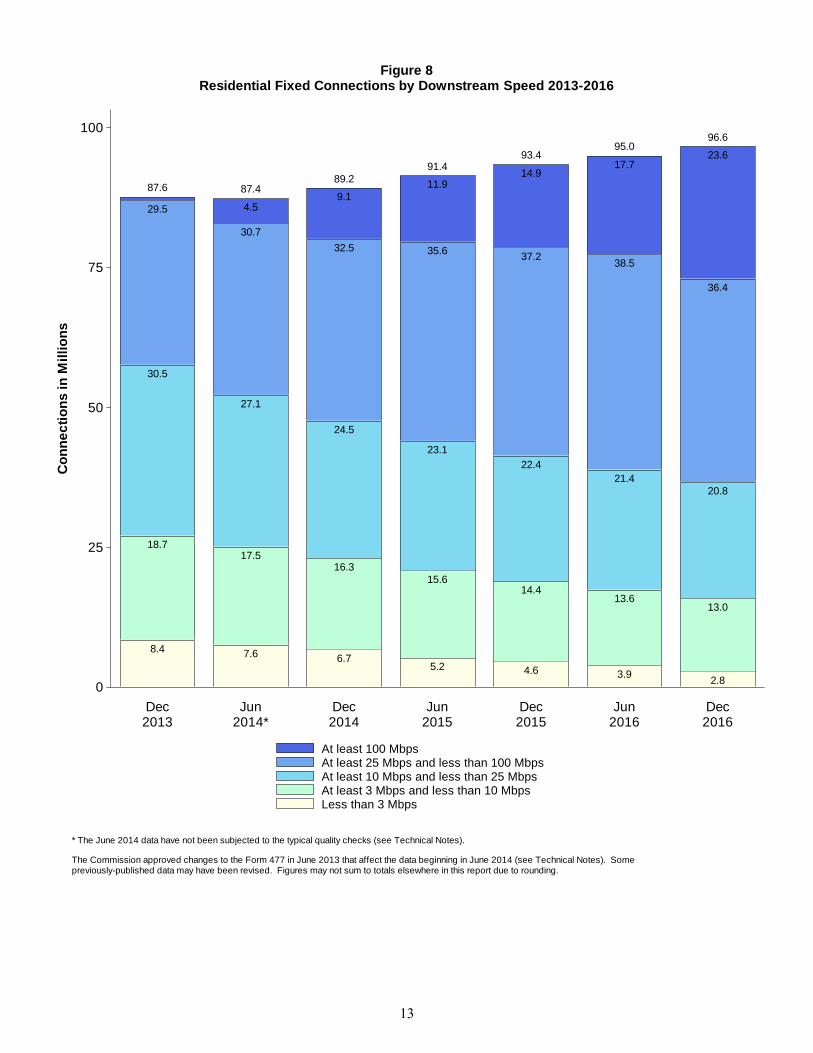
Figure 8Residential Fixed Connections by Downstream Speed 2013-2016
previously-published data may have been revised. Figures may not sum to totals elsewhere in this report due to rounding. The Commission approved changes to the Form 477 in June 2013 that affect the data beginning in June 2014 (see Technical Notes). Some
* The June 2014 data have not been subjected to the typical quality checks (see Technical Notes).
At least 100 MbpsAt least 25 Mbps and less than 100 MbpsAt least 10 Mbps and less than 25 MbpsAt least 3 Mbps and less than 10 MbpsLess than 3 Mbps
8.4
18.7
30.5
29.5
87.6
7.6
17.5
27.1
30.7
4.5
87.4
6.7
16.3
24.5
32.5
9.1
89.2
5.2
15.6
23.1
35.6
11.9
91.4
4.6
14.4
22.4
37.2
14.9
93.4
3.9
13.6
21.4
38.5
17.7
95.0
2.8
13.0
20.8
36.4
23.6
96.6
Co
nn
ec
tio
ns i
n M
illi
on
s
0
25
50
75
100
Dec2013
Jun2014*
Dec2014
Jun2015
Dec2015
Jun2016
Dec2016
13
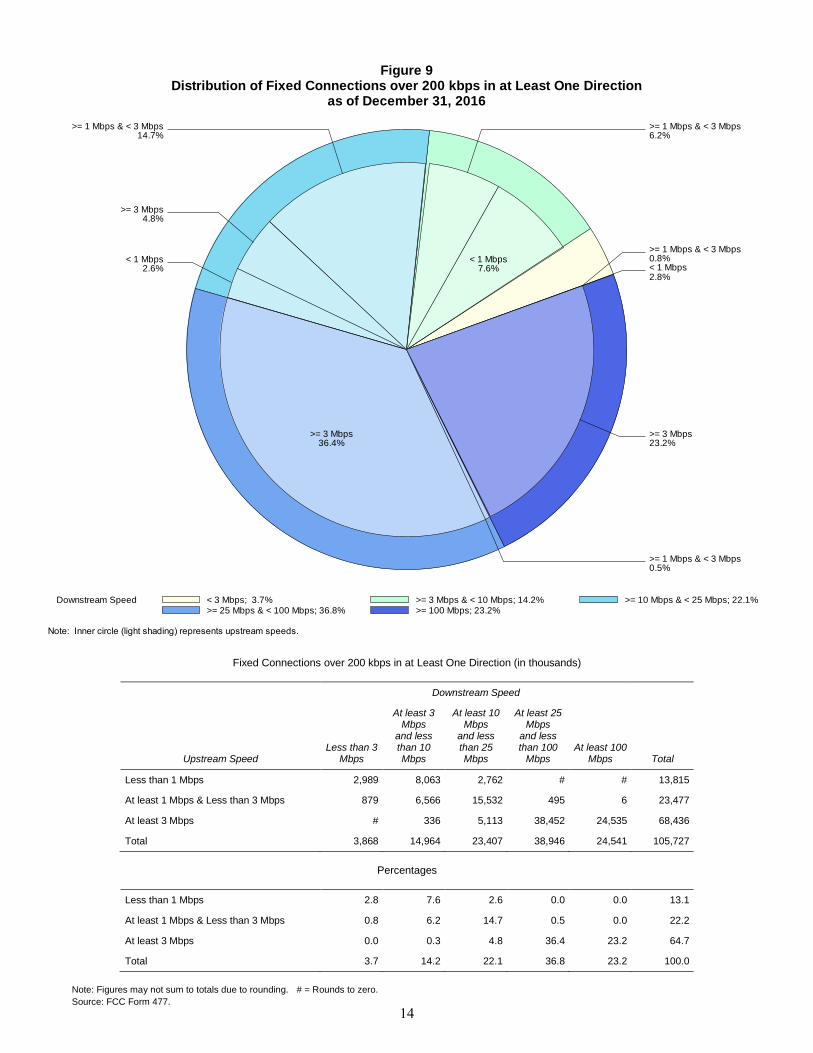
Fixed Connections over 200 kbps in at Least One Direction (in thousands)
Downstream Speed
Upstream Speed Less than 3
Mbps
At least 3 Mbps
and less than 10 Mbps
At least 10 Mbps
and less than 25 Mbps
At least 25 Mbps
and less than 100
Mbps At least 100
Mbps Total
Less than 1 Mbps 2,989 8,063 2,762 # # 13,815
At least 1 Mbps & Less than 3 Mbps 879 6,566 15,532 495 6 23,477
At least 3 Mbps # 336 5,113 38,452 24,535 68,436
Total 3,868 14,964 23,407 38,946 24,541 105,727
Percentages
Less than 1 Mbps 2.8 7.6 2.6 0.0 0.0 13.1
At least 1 Mbps & Less than 3 Mbps 0.8 6.2 14.7 0.5 0.0 22.2
At least 3 Mbps 0.0 0.3 4.8 36.4 23.2 64.7
Total 3.7 14.2 22.1 36.8 23.2 100.0
Note: Figures may not sum to totals due to rounding. # = Rounds to zero.
Source: FCC Form 477.
Figure 9Distribution of Fixed Connections over 200 kbps in at Least One Direction
as of December 31, 2016
Note: Inner circle (light shading) represents upstream speeds.
Downstream Speed < 3 Mbps; 3.7% >= 3 Mbps & < 10 Mbps; 14.2% >= 10 Mbps & < 25 Mbps; 22.1%>= 25 Mbps & < 100 Mbps; 36.8% >= 100 Mbps; 23.2%
< 1 Mbps2.8%
>= 1 Mbps & < 3 Mbps0.8%< 1 Mbps
7.6%
>= 1 Mbps & < 3 Mbps6.2%
>= 1 Mbps & < 3 Mbps14.7%
>= 3 Mbps4.8%
< 1 Mbps2.6%
>= 3 Mbps36.4%
>= 1 Mbps & < 3 Mbps0.5%
>= 3 Mbps23.2%
14

Residential Fixed Connections over 200 kbps in at Least One Direction (in thousands)
Downstream Speed
Upstream Speed Less than 3
Mbps
At least 3 Mbps
and less than 10 Mbps
At least 10 Mbps
and less than 25 Mbps
At least 25 Mbps
and less than 100
Mbps At least 100
Mbps Total
Less than 1 Mbps 2,361 6,756 2,571 # # 11,688
At least 1 Mbps & Less than 3 Mbps 447 6,108 14,158 449 4 21,166
At least 3 Mbps # 153 4,068 35,933 23,608 63,761
Total 2,808 13,018 20,796 36,382 23,612 96,616
Percentages
Less than 1 Mbps 2.4 7.0 2.7 0.0 0.0 12.1
At least 1 Mbps & Less than 3 Mbps 0.5 6.3 14.7 0.5 0.0 21.9
At least 3 Mbps 0.0 0.2 4.2 37.2 24.4 66.0
Total 2.9 13.5 21.5 37.7 24.4 100.0
Note: Figures may not sum to totals due to rounding. # = Rounds to zero.
Source: FCC Form 477.
Figure 10Distribution of Residential Fixed Connections over 200 kbps in at Least One Direction
as of December 31, 2016
Note: Inner circle (light shading) represents upstream speeds.
Downstream Speed < 3 Mbps; 2.9% >= 3 Mbps & < 10 Mbps; 13.5% >= 10 Mbps & < 25 Mbps; 21.5%>= 25 Mbps & < 100 Mbps; 37.7% >= 100 Mbps; 24.4%
< 1 Mbps2.4%
>= 1 Mbps & < 3 Mbps0.5%
< 1 Mbps7.0%
>= 1 Mbps & < 3 Mbps6.3%
>= 1 Mbps & < 3 Mbps14.7%
>= 3 Mbps4.2%
< 1 Mbps2.7%
>= 3 Mbps37.2%
>= 1 Mbps & < 3 Mbps0.5%
>= 3 Mbps24.4%
15
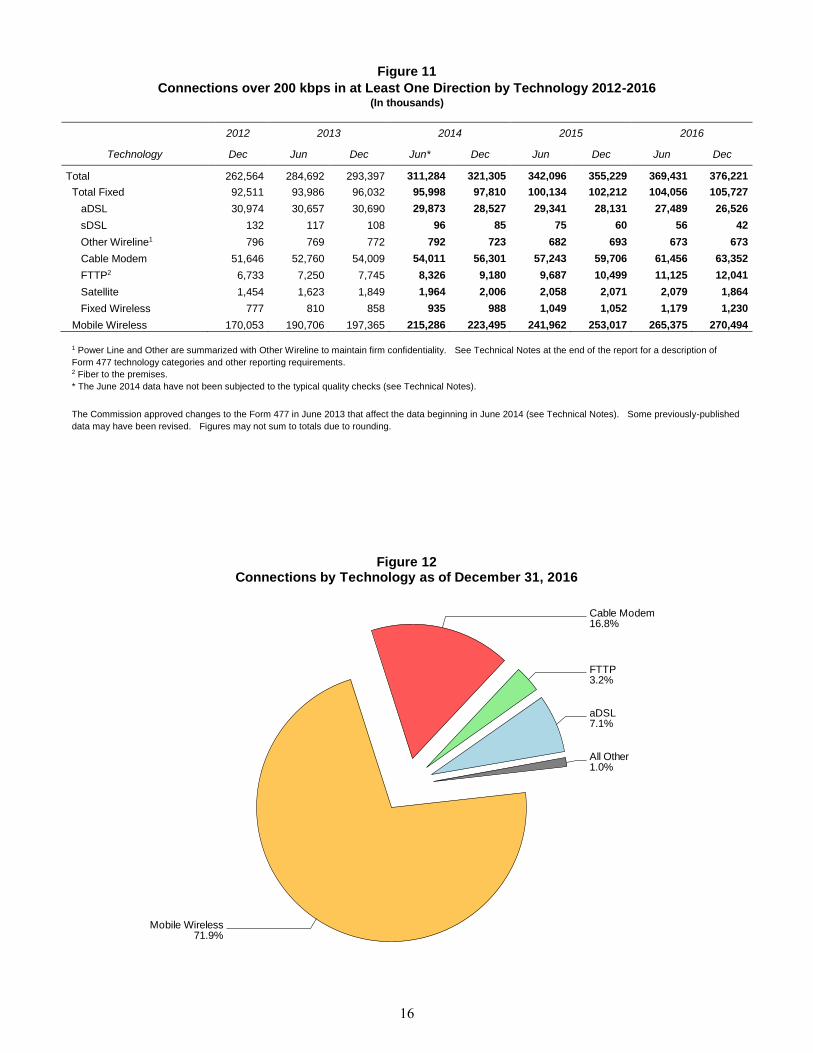
Figure 11
Connections over 200 kbps in at Least One Direction by Technology 2012-2016 (In thousands)
2012 2013 2014 2015 2016
Technology Dec Jun Dec Jun* Dec Jun Dec Jun Dec
Total 262,564 284,692 293,397 311,284 321,305 342,096 355,229 369,431 376,221
Total Fixed 92,511 93,986 96,032 95,998 97,810 100,134 102,212 104,056 105,727
aDSL 30,974 30,657 30,690 29,873 28,527 29,341 28,131 27,489 26,526
sDSL 132 117 108 96 85 75 60 56 42
Other Wireline1 796 769 772 792 723 682 693 673 673
Cable Modem 51,646 52,760 54,009 54,011 56,301 57,243 59,706 61,456 63,352
FTTP2 6,733 7,250 7,745 8,326 9,180 9,687 10,499 11,125 12,041
Satellite 1,454 1,623 1,849 1,964 2,006 2,058 2,071 2,079 1,864
Fixed Wireless 777 810 858 935 988 1,049 1,052 1,179 1,230
Mobile Wireless 170,053 190,706 197,365 215,286 223,495 241,962 253,017 265,375 270,494
1 Power Line and Other are summarized with Other Wireline to maintain firm confidentiality. See Technical Notes at the end of the report for a description of
Form 477 technology categories and other reporting requirements.
2 Fiber to the premises.
* The June 2014 data have not been subjected to the typical quality checks (see Technical Notes).
The Commission approved changes to the Form 477 in June 2013 that affect the data beginning in June 2014 (see Technical Notes). Some previously-published
data may have been revised. Figures may not sum to totals due to rounding.
Figure 12Connections by Technology as of December 31, 2016
aDSL7.1%
FTTP3.2%
Cable Modem16.8%
Mobile Wireless71.9%
All Other1.0%
16
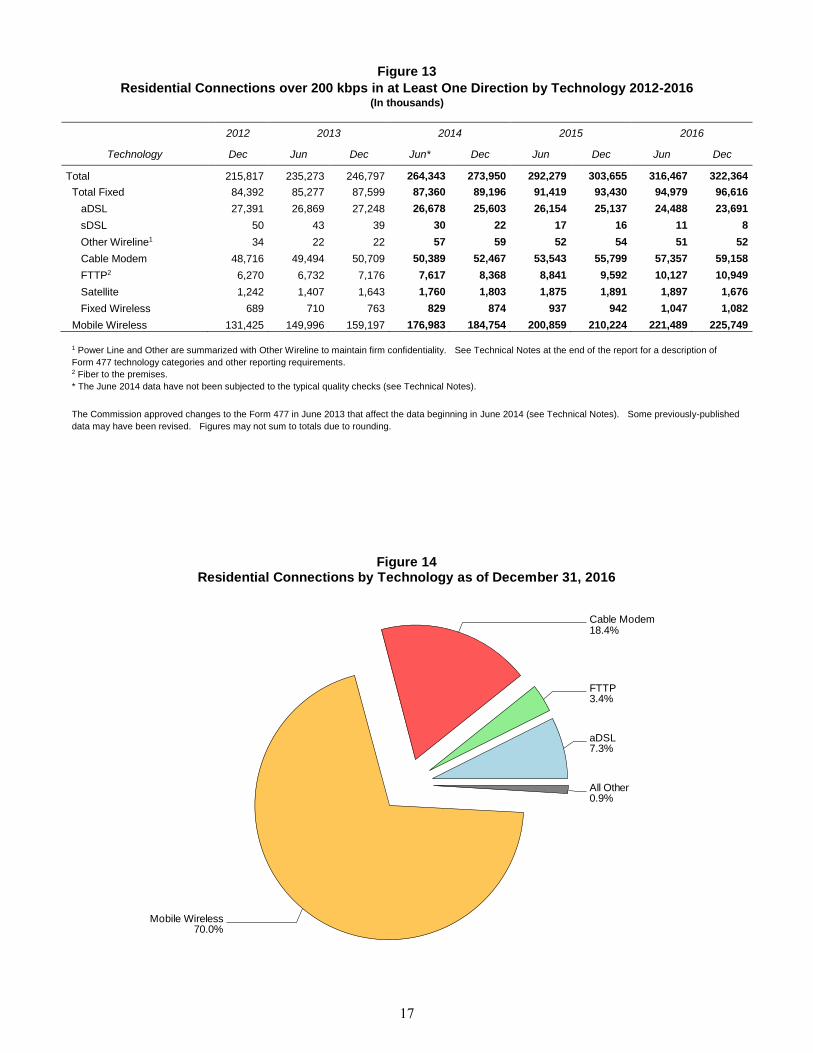
Figure 13
Residential Connections over 200 kbps in at Least One Direction by Technology 2012-2016 (In thousands)
2012 2013 2014 2015 2016
Technology Dec Jun Dec Jun* Dec Jun Dec Jun Dec
Total 215,817 235,273 246,797 264,343 273,950 292,279 303,655 316,467 322,364
Total Fixed 84,392 85,277 87,599 87,360 89,196 91,419 93,430 94,979 96,616
aDSL 27,391 26,869 27,248 26,678 25,603 26,154 25,137 24,488 23,691
sDSL 50 43 39 30 22 17 16 11 8
Other Wireline1 34 22 22 57 59 52 54 51 52
Cable Modem 48,716 49,494 50,709 50,389 52,467 53,543 55,799 57,357 59,158
FTTP2 6,270 6,732 7,176 7,617 8,368 8,841 9,592 10,127 10,949
Satellite 1,242 1,407 1,643 1,760 1,803 1,875 1,891 1,897 1,676
Fixed Wireless 689 710 763 829 874 937 942 1,047 1,082
Mobile Wireless 131,425 149,996 159,197 176,983 184,754 200,859 210,224 221,489 225,749
1 Power Line and Other are summarized with Other Wireline to maintain firm confidentiality. See Technical Notes at the end of the report for a description of
Form 477 technology categories and other reporting requirements.
2 Fiber to the premises.
* The June 2014 data have not been subjected to the typical quality checks (see Technical Notes).
The Commission approved changes to the Form 477 in June 2013 that affect the data beginning in June 2014 (see Technical Notes). Some previously-published
data may have been revised. Figures may not sum to totals due to rounding.
Figure 14Residential Connections by Technology as of December 31, 2016
aDSL7.3%
FTTP3.4%
Cable Modem18.4%
Mobile Wireless70.0%
All Other0.9%
17
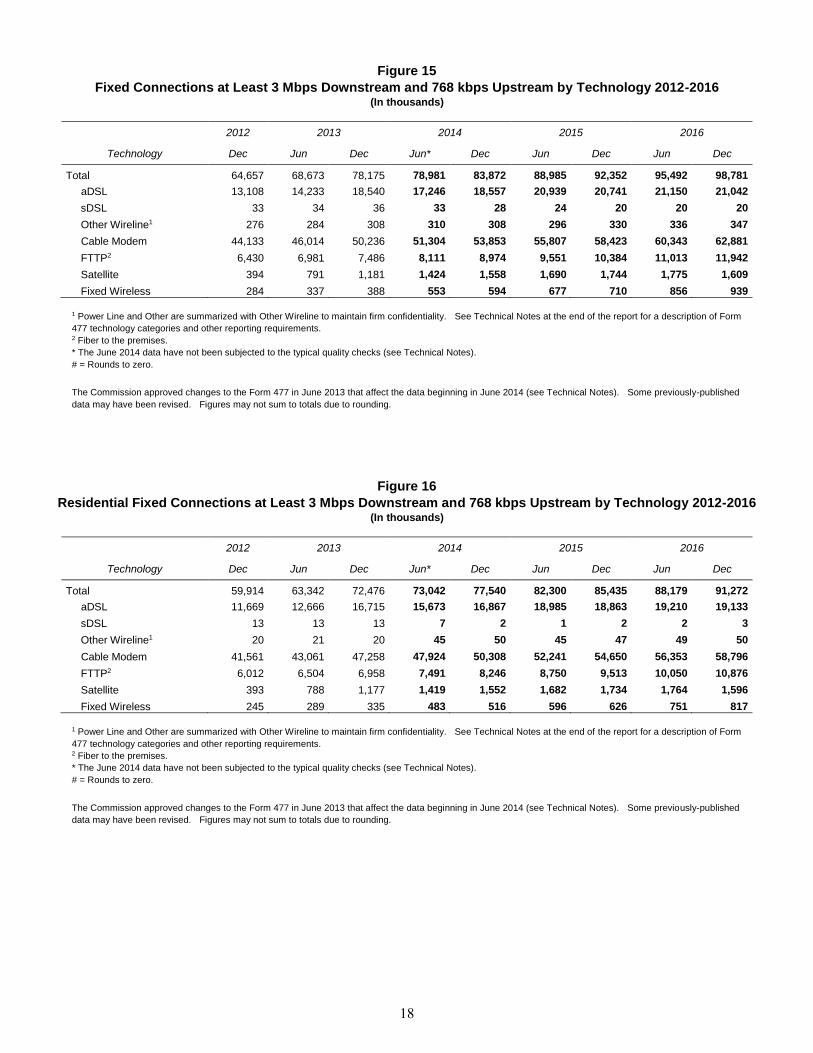
Figure 15
Fixed Connections at Least 3 Mbps Downstream and 768 kbps Upstream by Technology 2012-2016 (In thousands)
2012 2013 2014 2015 2016
Technology Dec Jun Dec Jun* Dec Jun Dec Jun Dec
Total 64,657 68,673 78,175 78,981 83,872 88,985 92,352 95,492 98,781
aDSL 13,108 14,233 18,540 17,246 18,557 20,939 20,741 21,150 21,042
sDSL 33 34 36 33 28 24 20 20 20
Other Wireline1 276 284 308 310 308 296 330 336 347
Cable Modem 44,133 46,014 50,236 51,304 53,853 55,807 58,423 60,343 62,881
FTTP2 6,430 6,981 7,486 8,111 8,974 9,551 10,384 11,013 11,942
Satellite 394 791 1,181 1,424 1,558 1,690 1,744 1,775 1,609
Fixed Wireless 284 337 388 553 594 677 710 856 939
1 Power Line and Other are summarized with Other Wireline to maintain firm confidentiality. See Technical Notes at the end of the report for a description of Form
477 technology categories and other reporting requirements.
2 Fiber to the premises.
* The June 2014 data have not been subjected to the typical quality checks (see Technical Notes).
# = Rounds to zero.
The Commission approved changes to the Form 477 in June 2013 that affect the data beginning in June 2014 (see Technical Notes). Some previously-published
data may have been revised. Figures may not sum to totals due to rounding.
Figure 16
Residential Fixed Connections at Least 3 Mbps Downstream and 768 kbps Upstream by Technology 2012-2016 (In thousands)
2012 2013 2014 2015 2016
Technology Dec Jun Dec Jun* Dec Jun Dec Jun Dec
Total 59,914 63,342 72,476 73,042 77,540 82,300 85,435 88,179 91,272
aDSL 11,669 12,666 16,715 15,673 16,867 18,985 18,863 19,210 19,133
sDSL 13 13 13 7 2 1 2 2 3
Other Wireline1 20 21 20 45 50 45 47 49 50
Cable Modem 41,561 43,061 47,258 47,924 50,308 52,241 54,650 56,353 58,796
FTTP2 6,012 6,504 6,958 7,491 8,246 8,750 9,513 10,050 10,876
Satellite 393 788 1,177 1,419 1,552 1,682 1,734 1,764 1,596
Fixed Wireless 245 289 335 483 516 596 626 751 817
1 Power Line and Other are summarized with Other Wireline to maintain firm confidentiality. See Technical Notes at the end of the report for a description of Form
477 technology categories and other reporting requirements.
2 Fiber to the premises.
* The June 2014 data have not been subjected to the typical quality checks (see Technical Notes).
# = Rounds to zero.
The Commission approved changes to the Form 477 in June 2013 that affect the data beginning in June 2014 (see Technical Notes). Some previously-published
data may have been revised. Figures may not sum to totals due to rounding.
18
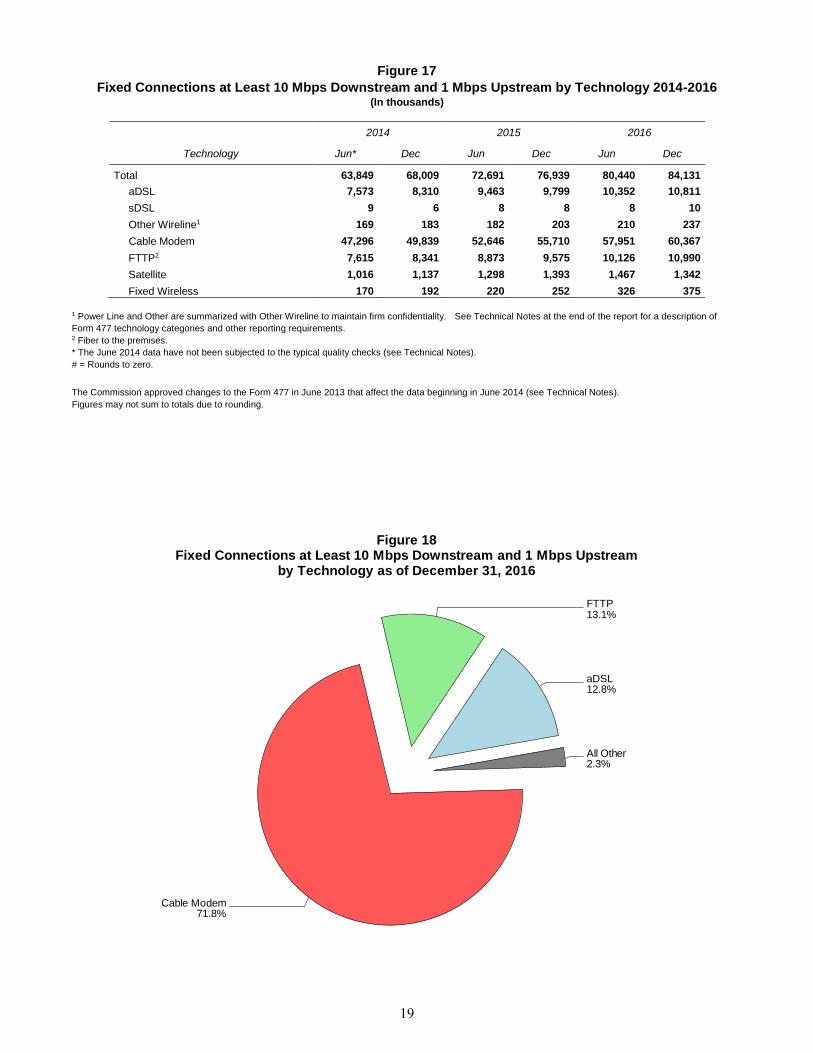
Figure 17
Fixed Connections at Least 10 Mbps Downstream and 1 Mbps Upstream by Technology 2014-2016 (In thousands)
2014 2015 2016
Technology Jun* Dec Jun Dec Jun Dec
Total 63,849 68,009 72,691 76,939 80,440 84,131
aDSL 7,573 8,310 9,463 9,799 10,352 10,811
sDSL 9 6 8 8 8 10
Other Wireline1 169 183 182 203 210 237
Cable Modem 47,296 49,839 52,646 55,710 57,951 60,367
FTTP2 7,615 8,341 8,873 9,575 10,126 10,990
Satellite 1,016 1,137 1,298 1,393 1,467 1,342
Fixed Wireless 170 192 220 252 326 375
1 Power Line and Other are summarized with Other Wireline to maintain firm confidentiality. See Technical Notes at the end of the report for a description of
Form 477 technology categories and other reporting requirements.
2 Fiber to the premises.
* The June 2014 data have not been subjected to the typical quality checks (see Technical Notes).
# = Rounds to zero.
The Commission approved changes to the Form 477 in June 2013 that affect the data beginning in June 2014 (see Technical Notes).
Figures may not sum to totals due to rounding.
Figure 18Fixed Connections at Least 10 Mbps Downstream and 1 Mbps Upstream
by Technology as of December 31, 2016
aDSL12.8%
FTTP13.1%
Cable Modem71.8%
All Other2.3%
19
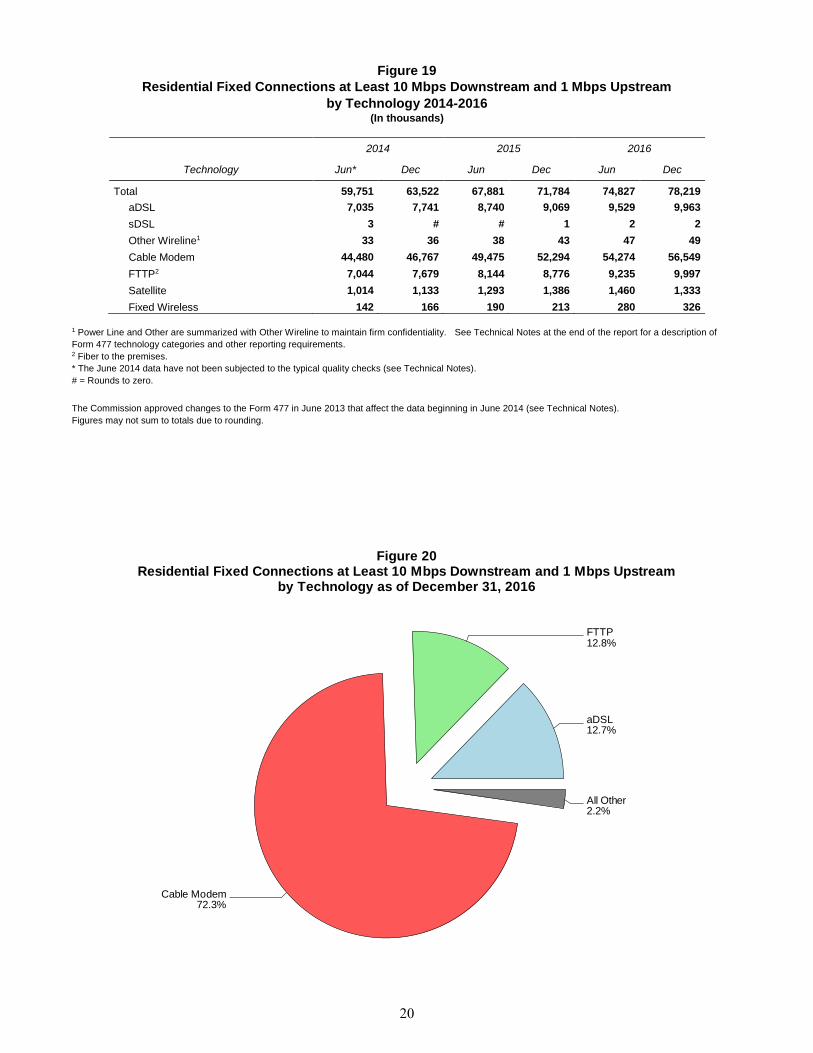
Figure 19
Residential Fixed Connections at Least 10 Mbps Downstream and 1 Mbps Upstream
by Technology 2014-2016 (In thousands)
2014 2015 2016
Technology Jun* Dec Jun Dec Jun Dec
Total 59,751 63,522 67,881 71,784 74,827 78,219
aDSL 7,035 7,741 8,740 9,069 9,529 9,963
sDSL 3 # # 1 2 2
Other Wireline1 33 36 38 43 47 49
Cable Modem 44,480 46,767 49,475 52,294 54,274 56,549
FTTP2 7,044 7,679 8,144 8,776 9,235 9,997
Satellite 1,014 1,133 1,293 1,386 1,460 1,333
Fixed Wireless 142 166 190 213 280 326
1 Power Line and Other are summarized with Other Wireline to maintain firm confidentiality. See Technical Notes at the end of the report for a description of
Form 477 technology categories and other reporting requirements.
2 Fiber to the premises.
* The June 2014 data have not been subjected to the typical quality checks (see Technical Notes).
# = Rounds to zero.
The Commission approved changes to the Form 477 in June 2013 that affect the data beginning in June 2014 (see Technical Notes).
Figures may not sum to totals due to rounding.
Figure 20Residential Fixed Connections at Least 10 Mbps Downstream and 1 Mbps Upstream
by Technology as of December 31, 2016
aDSL12.7%
FTTP12.8%
Cable Modem72.3%
All Other2.2%
20
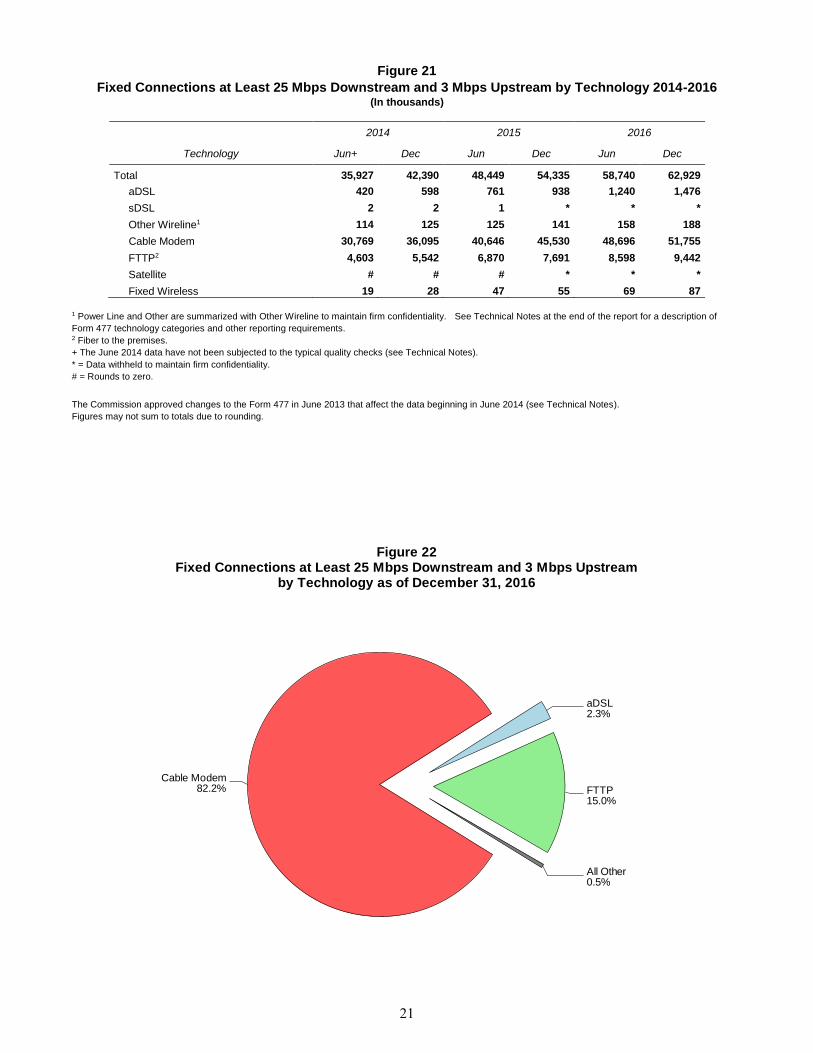
Figure 21
Fixed Connections at Least 25 Mbps Downstream and 3 Mbps Upstream by Technology 2014-2016 (In thousands)
2014 2015 2016
Technology Jun+ Dec Jun Dec Jun Dec
Total 35,927 42,390 48,449 54,335 58,740 62,929
aDSL 420 598 761 938 1,240 1,476
sDSL 2 2 1 * * *
Other Wireline1 114 125 125 141 158 188
Cable Modem 30,769 36,095 40,646 45,530 48,696 51,755
FTTP2 4,603 5,542 6,870 7,691 8,598 9,442
Satellite # # # * * *
Fixed Wireless 19 28 47 55 69 87
1 Power Line and Other are summarized with Other Wireline to maintain firm confidentiality. See Technical Notes at the end of the report for a description of
Form 477 technology categories and other reporting requirements.
2 Fiber to the premises.
+ The June 2014 data have not been subjected to the typical quality checks (see Technical Notes).
* = Data withheld to maintain firm confidentiality.
# = Rounds to zero.
The Commission approved changes to the Form 477 in June 2013 that affect the data beginning in June 2014 (see Technical Notes).
Figures may not sum to totals due to rounding.
Figure 22Fixed Connections at Least 25 Mbps Downstream and 3 Mbps Upstream
by Technology as of December 31, 2016
FTTP15.0%
aDSL2.3%
Cable Modem82.2%
All Other0.5%
21
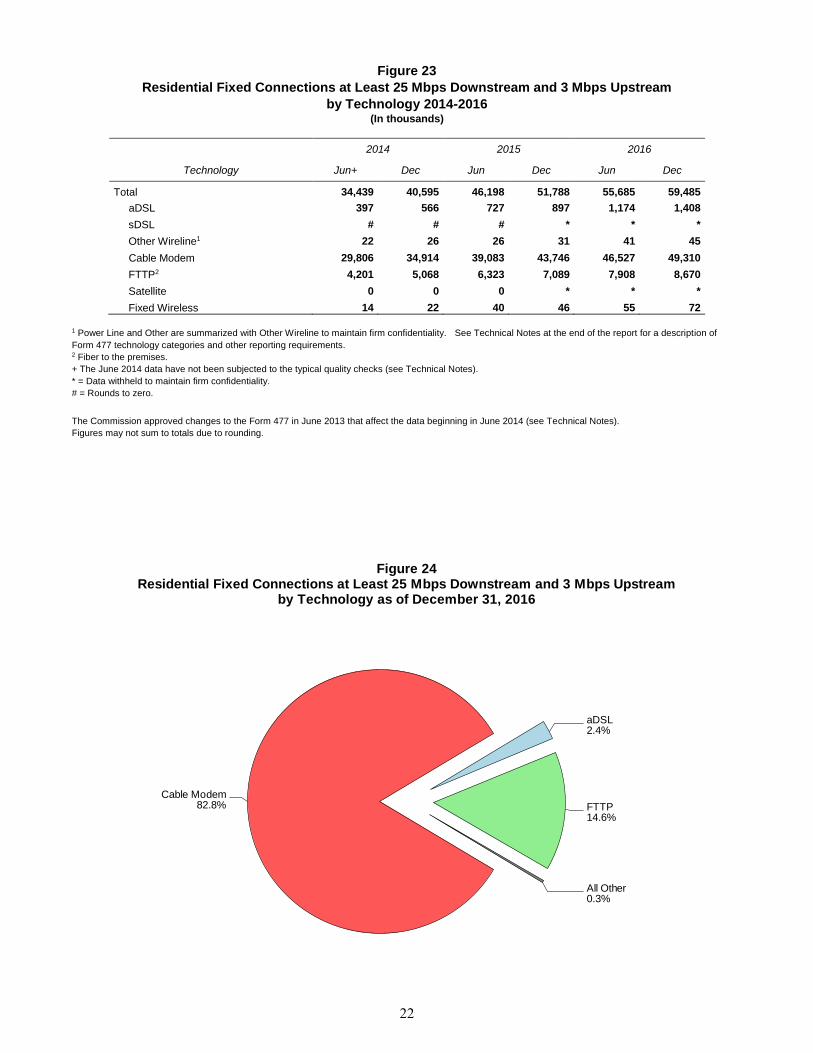
Figure 23
Residential Fixed Connections at Least 25 Mbps Downstream and 3 Mbps Upstream
by Technology 2014-2016 (In thousands)
2014 2015 2016
Technology Jun+ Dec Jun Dec Jun Dec
Total 34,439 40,595 46,198 51,788 55,685 59,485
aDSL 397 566 727 897 1,174 1,408
sDSL # # # * * *
Other Wireline1 22 26 26 31 41 45
Cable Modem 29,806 34,914 39,083 43,746 46,527 49,310
FTTP2 4,201 5,068 6,323 7,089 7,908 8,670
Satellite 0 0 0 * * *
Fixed Wireless 14 22 40 46 55 72
1 Power Line and Other are summarized with Other Wireline to maintain firm confidentiality. See Technical Notes at the end of the report for a description of
Form 477 technology categories and other reporting requirements.
2 Fiber to the premises.
+ The June 2014 data have not been subjected to the typical quality checks (see Technical Notes).
* = Data withheld to maintain firm confidentiality.
# = Rounds to zero.
The Commission approved changes to the Form 477 in June 2013 that affect the data beginning in June 2014 (see Technical Notes).
Figures may not sum to totals due to rounding.
Figure 24Residential Fixed Connections at Least 25 Mbps Downstream and 3 Mbps Upstream
by Technology as of December 31, 2016
FTTP14.6%
aDSL2.4%
Cable Modem82.8%
All Other0.3%
22
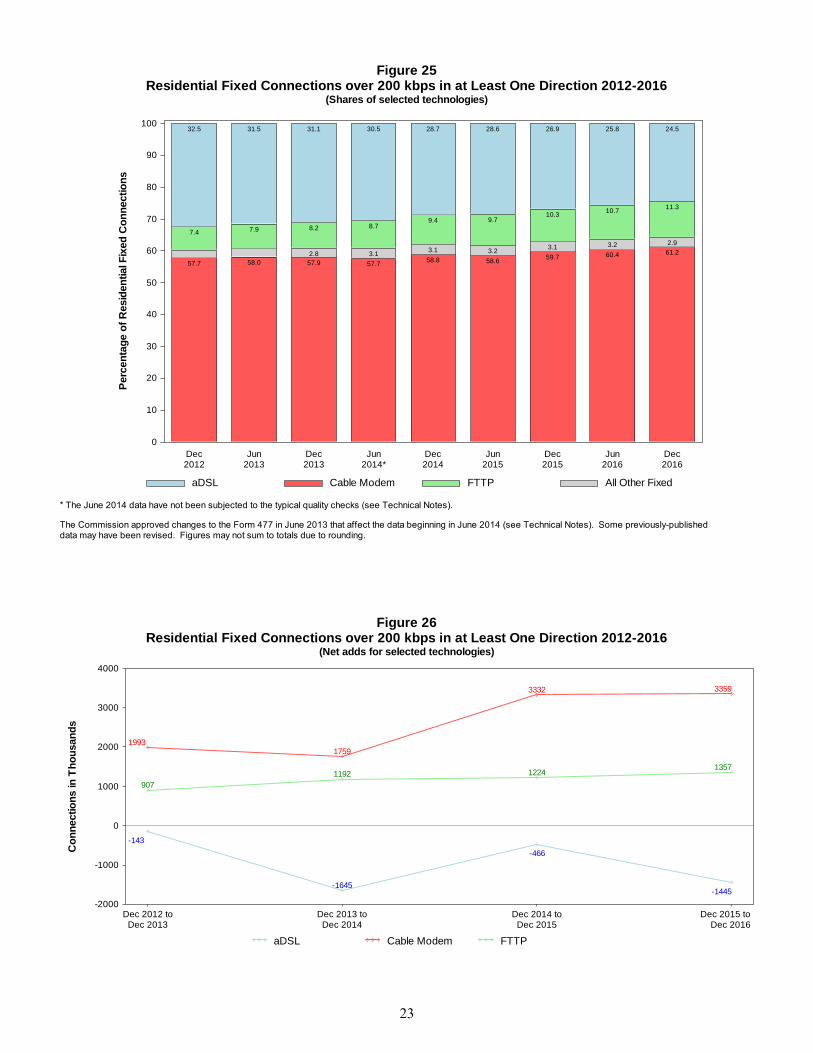
Figure 25Residential Fixed Connections over 200 kbps in at Least One Direction 2012-2016
(Shares of selected technologies)
data may have been revised. Figures may not sum to totals due to rounding. The Commission approved changes to the Form 477 in June 2013 that affect the data beginning in June 2014 (see Technical Notes). Some previously-published
* The June 2014 data have not been subjected to the typical quality checks (see Technical Notes).
aDSL Cable Modem FTTP All Other Fixed
57.7
7.4
32.5
57.9
2.8
8.2
31.1
58.8
3.1
9.4
28.7
59.7
3.1
10.3
26.9
61.2
2.9
11.3
24.5
58.0
7.9
31.5
57.7
3.1
8.7
30.5
58.6
3.2
9.7
28.6
60.4
3.2
10.7
25.8P
erc
en
tag
e o
f R
esid
en
tial F
ixed
Co
nn
ectio
ns
0
10
20
30
40
50
60
70
80
90
100
Dec2012
Jun2013
Dec2013
Jun2014*
Dec2014
Jun2015
Dec2015
Jun2016
Dec2016
Co
nn
ectio
ns in
Th
ou
san
ds
-2000
-1000
0
1000
2000
3000
4000
Dec 2012 toDec 2013
Dec 2013 toDec 2014
Dec 2014 toDec 2015
Dec 2015 toDec 2016
Figure 26Residential Fixed Connections over 200 kbps in at Least One Direction 2012-2016
(Net adds for selected technologies)
aDSL Cable Modem FTTP
-143
-1645
-466
-1445
19931759
3332 3359
907
1192 12241357
23
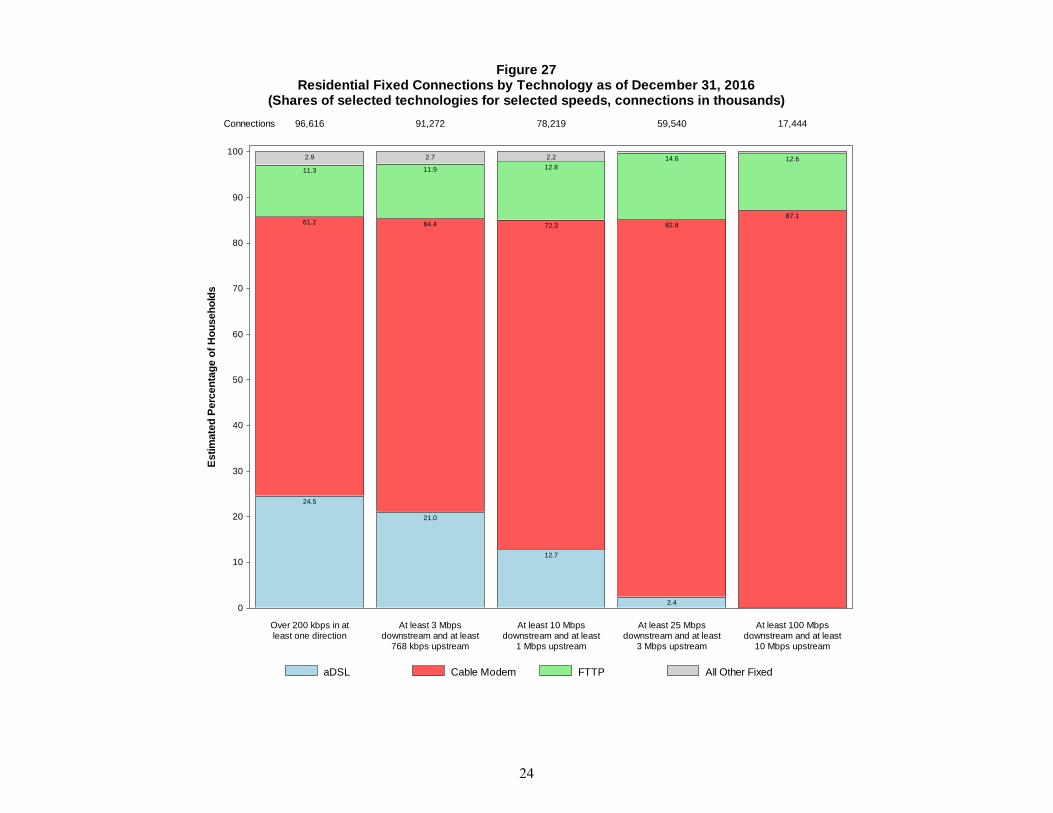
Figure 27Residential Fixed Connections by Technology as of December 31, 2016
(Shares of selected technologies for selected speeds, connections in thousands)
aDSL Cable Modem FTTP All Other Fixed
24.5
61.2
11.3
2.9
21.0
64.4
11.9
2.7
12.7
72.3
12.8
2.2
2.4
82.8
14.6
87.1
12.6
Estim
ate
d P
erc
en
tag
e o
f H
ou
seh
old
s
0
10
20
30
40
50
60
70
80
90
100
Over 200 kbps in atleast one direction
At least 3 Mbpsdownstream and at least
768 kbps upstream
At least 10 Mbpsdownstream and at least
1 Mbps upstream
At least 25 Mbpsdownstream and at least
3 Mbps upstream
At least 100 Mbpsdownstream and at least
10 Mbps upstream
Connections 96,616 91,272 78,219 59,540 17,444
24
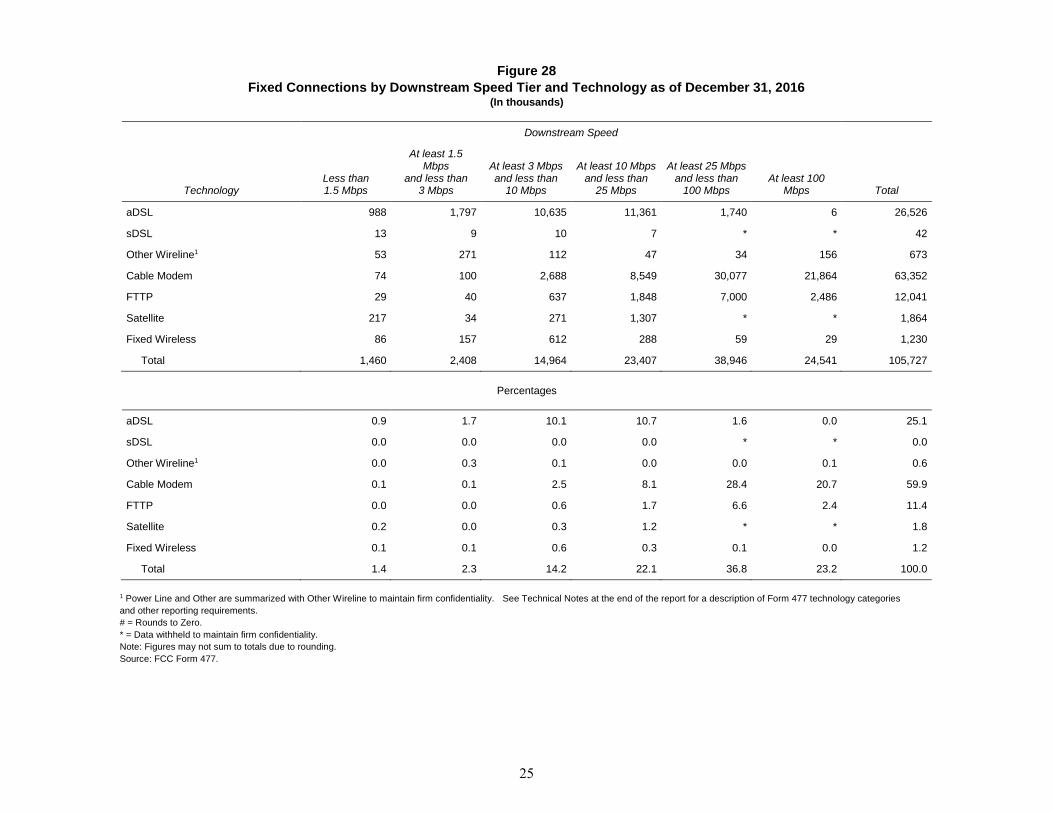
Figure 28
Fixed Connections by Downstream Speed Tier and Technology as of December 31, 2016 (In thousands)
Downstream Speed
Technology Less than 1.5 Mbps
At least 1.5 Mbps
and less than 3 Mbps
At least 3 Mbps and less than
10 Mbps
At least 10 Mbps and less than
25 Mbps
At least 25 Mbps and less than
100 Mbps At least 100
Mbps Total
aDSL 988 1,797 10,635 11,361 1,740 6 26,526
sDSL 13 9 10 7 * * 42
Other Wireline1 53 271 112 47 34 156 673
Cable Modem 74 100 2,688 8,549 30,077 21,864 63,352
FTTP 29 40 637 1,848 7,000 2,486 12,041
Satellite 217 34 271 1,307 * * 1,864
Fixed Wireless 86 157 612 288 59 29 1,230
Total 1,460 2,408 14,964 23,407 38,946 24,541 105,727
Percentages
aDSL 0.9 1.7 10.1 10.7 1.6 0.0 25.1
sDSL 0.0 0.0 0.0 0.0 * * 0.0
Other Wireline1 0.0 0.3 0.1 0.0 0.0 0.1 0.6
Cable Modem 0.1 0.1 2.5 8.1 28.4 20.7 59.9
FTTP 0.0 0.0 0.6 1.7 6.6 2.4 11.4
Satellite 0.2 0.0 0.3 1.2 * * 1.8
Fixed Wireless 0.1 0.1 0.6 0.3 0.1 0.0 1.2
Total 1.4 2.3 14.2 22.1 36.8 23.2 100.0
1 Power Line and Other are summarized with Other Wireline to maintain firm confidentiality. See Technical Notes at the end of the report for a description of Form 477 technology categories
and other reporting requirements.
# = Rounds to Zero.
* = Data withheld to maintain firm confidentiality.
Note: Figures may not sum to totals due to rounding.
Source: FCC Form 477.
25
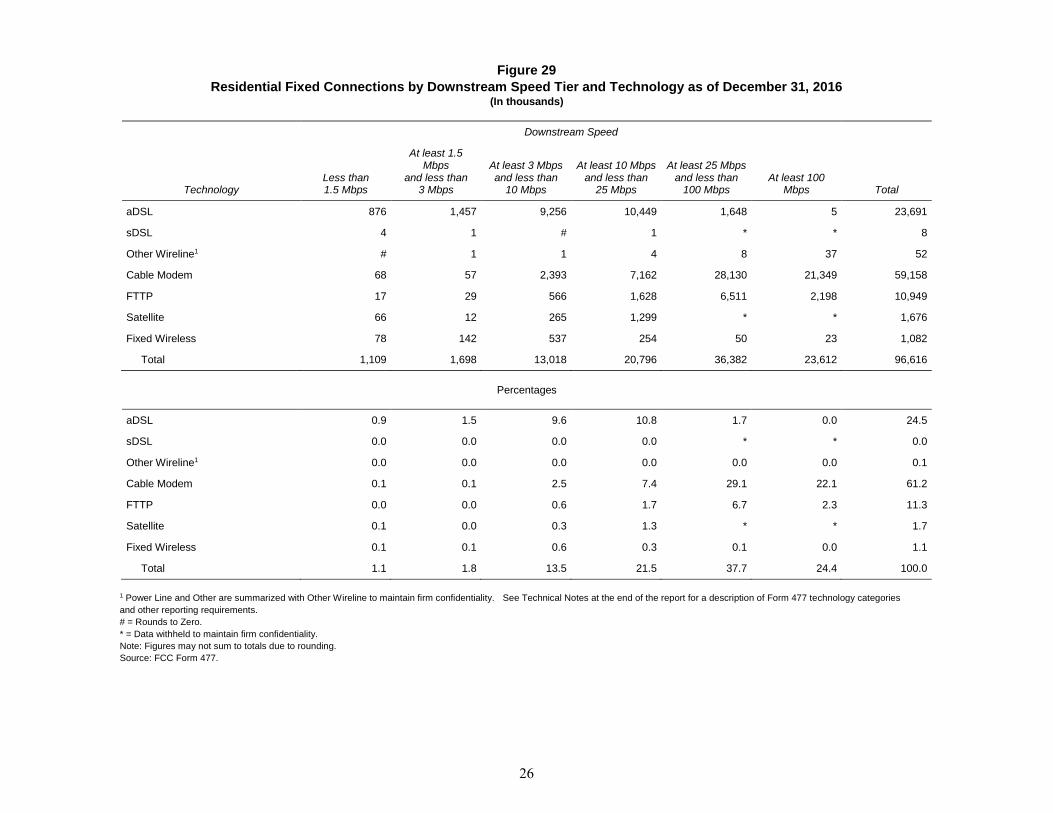
Figure 29
Residential Fixed Connections by Downstream Speed Tier and Technology as of December 31, 2016 (In thousands)
Downstream Speed
Technology Less than 1.5 Mbps
At least 1.5 Mbps
and less than 3 Mbps
At least 3 Mbps and less than
10 Mbps
At least 10 Mbps and less than
25 Mbps
At least 25 Mbps and less than
100 Mbps At least 100
Mbps Total
aDSL 876 1,457 9,256 10,449 1,648 5 23,691
sDSL 4 1 # 1 * * 8
Other Wireline1 # 1 1 4 8 37 52
Cable Modem 68 57 2,393 7,162 28,130 21,349 59,158
FTTP 17 29 566 1,628 6,511 2,198 10,949
Satellite 66 12 265 1,299 * * 1,676
Fixed Wireless 78 142 537 254 50 23 1,082
Total 1,109 1,698 13,018 20,796 36,382 23,612 96,616
Percentages
aDSL 0.9 1.5 9.6 10.8 1.7 0.0 24.5
sDSL 0.0 0.0 0.0 0.0 * * 0.0
Other Wireline1 0.0 0.0 0.0 0.0 0.0 0.0 0.1
Cable Modem 0.1 0.1 2.5 7.4 29.1 22.1 61.2
FTTP 0.0 0.0 0.6 1.7 6.7 2.3 11.3
Satellite 0.1 0.0 0.3 1.3 * * 1.7
Fixed Wireless 0.1 0.1 0.6 0.3 0.1 0.0 1.1
Total 1.1 1.8 13.5 21.5 37.7 24.4 100.0
1 Power Line and Other are summarized with Other Wireline to maintain firm confidentiality. See Technical Notes at the end of the report for a description of Form 477 technology categories
and other reporting requirements.
# = Rounds to Zero.
* = Data withheld to maintain firm confidentiality.
Note: Figures may not sum to totals due to rounding.
Source: FCC Form 477.
26
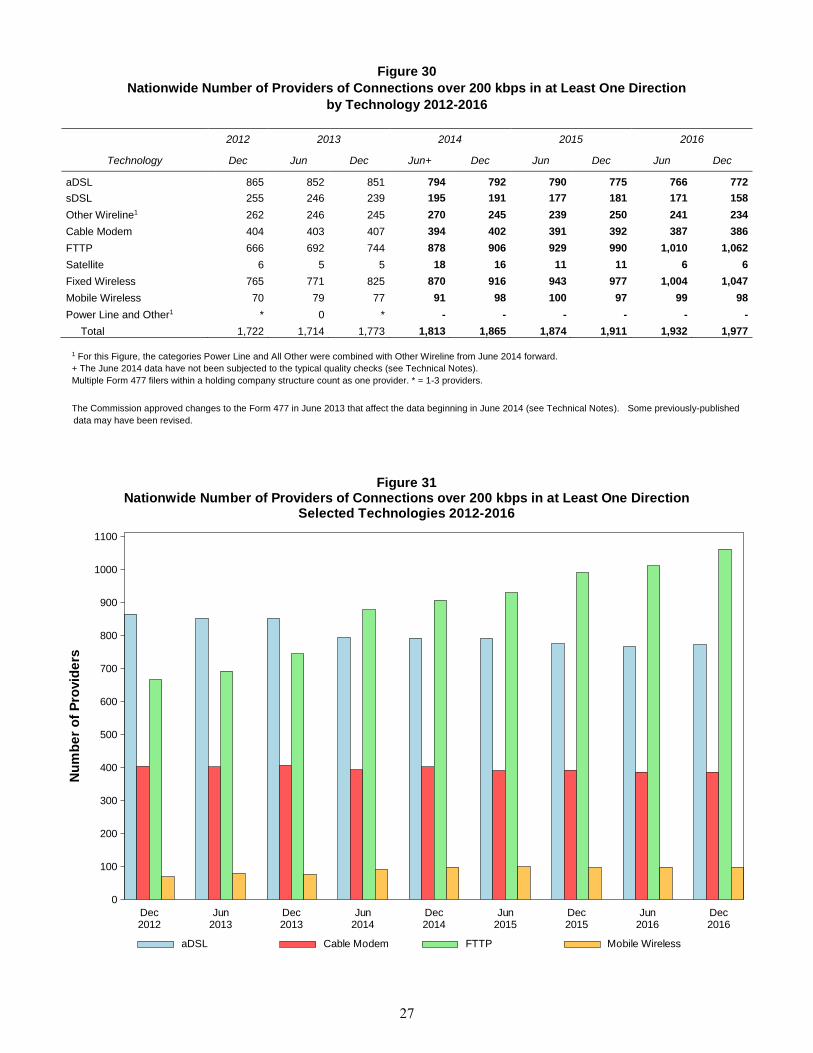
Figure 30
Nationwide Number of Providers of Connections over 200 kbps in at Least One Direction
by Technology 2012-2016
2012 2013 2014 2015 2016
Technology Dec Jun Dec Jun+ Dec Jun Dec Jun Dec
aDSL 865 852 851 794 792 790 775 766 772
sDSL 255 246 239 195 191 177 181 171 158
Other Wireline1 262 246 245 270 245 239 250 241 234
Cable Modem 404 403 407 394 402 391 392 387 386
FTTP 666 692 744 878 906 929 990 1,010 1,062
Satellite 6 5 5 18 16 11 11 6 6
Fixed Wireless 765 771 825 870 916 943 977 1,004 1,047
Mobile Wireless 70 79 77 91 98 100 97 99 98
Power Line and Other1 * 0 * - - - - - -
Total 1,722 1,714 1,773 1,813 1,865 1,874 1,911 1,932 1,977
1 For this Figure, the categories Power Line and All Other were combined with Other Wireline from June 2014 forward.
+ The June 2014 data have not been subjected to the typical quality checks (see Technical Notes).
Multiple Form 477 filers within a holding company structure count as one provider. * = 1-3 providers.
The Commission approved changes to the Form 477 in June 2013 that affect the data beginning in June 2014 (see Technical Notes). Some previously-published
data may have been revised.
Figure 31Nationwide Number of Providers of Connections over 200 kbps in at Least One Direction
Selected Technologies 2012-2016
aDSL Cable Modem FTTP Mobile Wireless
Nu
mb
er
of
Pro
vid
ers
0
100
200
300
400
500
600
700
800
900
1000
1100
Dec2012
Jun2013
Dec2013
Jun2014
Dec2014
Jun2015
Dec2015
Jun2016
Dec2016
27
SECTION 3
SUMMARY STATISTICS: THE STATES
Table of Contents
Figure 32 Residential Fixed Connections and Households by State
as of December 31, 2016 ......................................................................................... 29
Figure 33 Connections by Type of End User by State as of December 31, 2016 .................... 31
Figure 34 Connections by Technology by State as of December 31, 2016 ............................. 32
Figure 35 Percentage of Fixed Connections by Downstream Speed by State as of
December 31, 2016 .................................................................................................. 34
Figure 36 Providers of Connections by Technology by State as of December 31, 2016 ......... 36
28
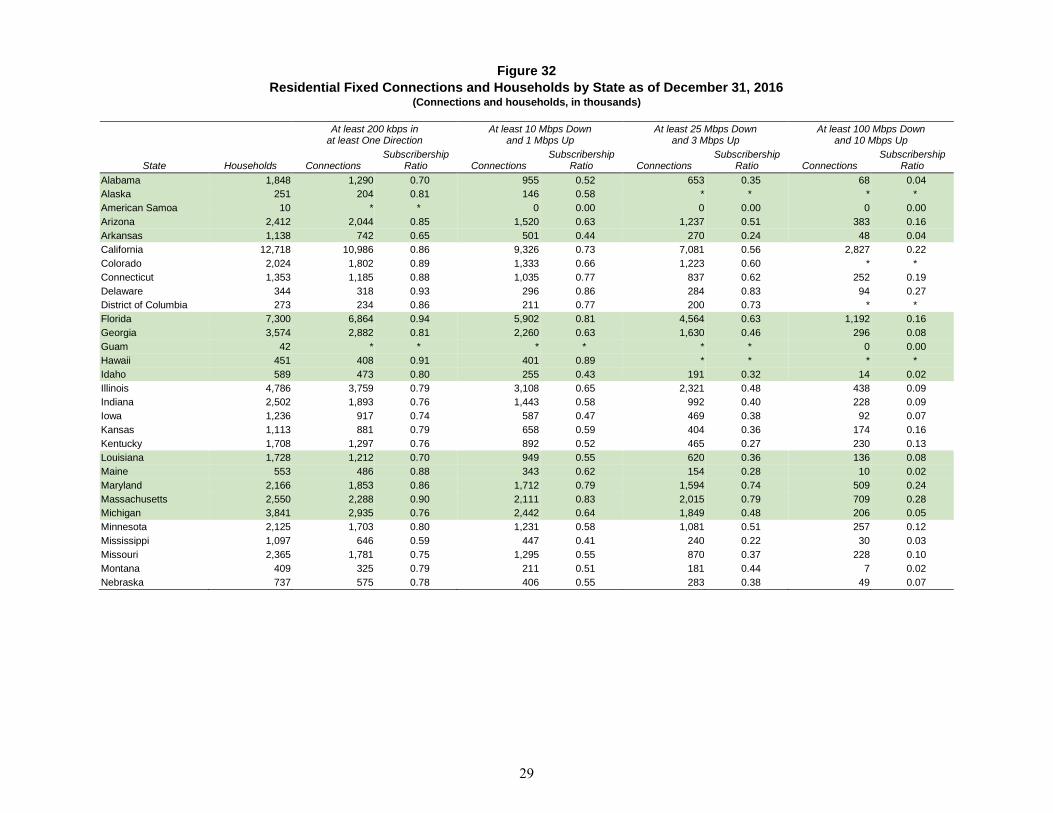
Figure 32
Residential Fixed Connections and Households by State as of December 31, 2016 (Connections and households, in thousands)
At least 200 kbps in
at least One Direction At least 10 Mbps Down
and 1 Mbps Up At least 25 Mbps Down
and 3 Mbps Up At least 100 Mbps Down
and 10 Mbps Up
State Households Connections Subscribership
Ratio Connections Subscribership
Ratio Connections Subscribership
Ratio Connections Subscribership
Ratio
Alabama 1,848 1,290 0.70 955 0.52 653 0.35 68 0.04
Alaska 251 204 0.81 146 0.58 * * * *
American Samoa 10 * * 0 0.00 0 0.00 0 0.00
Arizona 2,412 2,044 0.85 1,520 0.63 1,237 0.51 383 0.16
Arkansas 1,138 742 0.65 501 0.44 270 0.24 48 0.04
California 12,718 10,986 0.86 9,326 0.73 7,081 0.56 2,827 0.22
Colorado 2,024 1,802 0.89 1,333 0.66 1,223 0.60 * *
Connecticut 1,353 1,185 0.88 1,035 0.77 837 0.62 252 0.19
Delaware 344 318 0.93 296 0.86 284 0.83 94 0.27
District of Columbia 273 234 0.86 211 0.77 200 0.73 * *
Florida 7,300 6,864 0.94 5,902 0.81 4,564 0.63 1,192 0.16
Georgia 3,574 2,882 0.81 2,260 0.63 1,630 0.46 296 0.08
Guam 42 * * * * * * 0 0.00
Hawaii 451 408 0.91 401 0.89 * * * *
Idaho 589 473 0.80 255 0.43 191 0.32 14 0.02
Illinois 4,786 3,759 0.79 3,108 0.65 2,321 0.48 438 0.09
Indiana 2,502 1,893 0.76 1,443 0.58 992 0.40 228 0.09
Iowa 1,236 917 0.74 587 0.47 469 0.38 92 0.07
Kansas 1,113 881 0.79 658 0.59 404 0.36 174 0.16
Kentucky 1,708 1,297 0.76 892 0.52 465 0.27 230 0.13
Louisiana 1,728 1,212 0.70 949 0.55 620 0.36 136 0.08
Maine 553 486 0.88 343 0.62 154 0.28 10 0.02
Maryland 2,166 1,853 0.86 1,712 0.79 1,594 0.74 509 0.24
Massachusetts 2,550 2,288 0.90 2,111 0.83 2,015 0.79 709 0.28
Michigan 3,841 2,935 0.76 2,442 0.64 1,849 0.48 206 0.05
Minnesota 2,125 1,703 0.80 1,231 0.58 1,081 0.51 257 0.12
Mississippi 1,097 646 0.59 447 0.41 240 0.22 30 0.03
Missouri 2,365 1,781 0.75 1,295 0.55 870 0.37 228 0.10
Montana 409 325 0.79 211 0.51 181 0.44 7 0.02
Nebraska 737 575 0.78 406 0.55 283 0.38 49 0.07
29
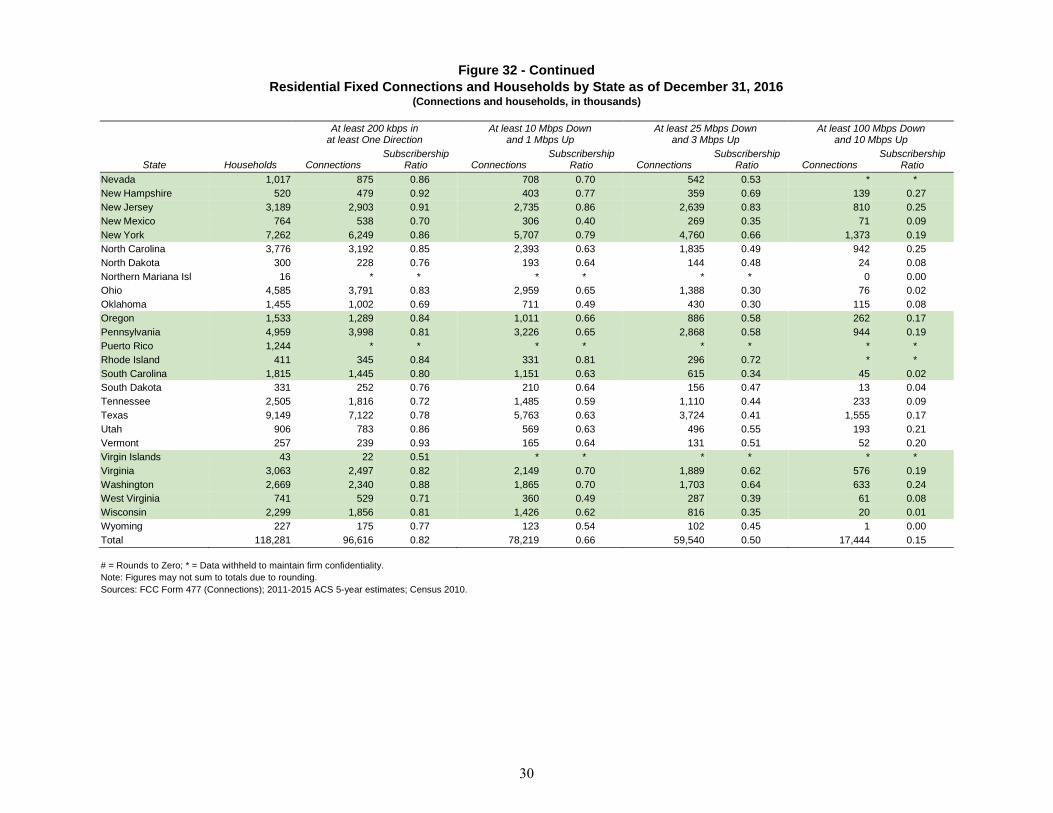
Figure 32 - Continued
Residential Fixed Connections and Households by State as of December 31, 2016 (Connections and households, in thousands)
At least 200 kbps in
at least One Direction At least 10 Mbps Down
and 1 Mbps Up At least 25 Mbps Down
and 3 Mbps Up At least 100 Mbps Down
and 10 Mbps Up
State Households Connections Subscribership
Ratio Connections Subscribership
Ratio Connections Subscribership
Ratio Connections Subscribership
Ratio
Nevada 1,017 875 0.86 708 0.70 542 0.53 * *
New Hampshire 520 479 0.92 403 0.77 359 0.69 139 0.27
New Jersey 3,189 2,903 0.91 2,735 0.86 2,639 0.83 810 0.25
New Mexico 764 538 0.70 306 0.40 269 0.35 71 0.09
New York 7,262 6,249 0.86 5,707 0.79 4,760 0.66 1,373 0.19
North Carolina 3,776 3,192 0.85 2,393 0.63 1,835 0.49 942 0.25
North Dakota 300 228 0.76 193 0.64 144 0.48 24 0.08
Northern Mariana Isl 16 * * * * * * 0 0.00
Ohio 4,585 3,791 0.83 2,959 0.65 1,388 0.30 76 0.02
Oklahoma 1,455 1,002 0.69 711 0.49 430 0.30 115 0.08
Oregon 1,533 1,289 0.84 1,011 0.66 886 0.58 262 0.17
Pennsylvania 4,959 3,998 0.81 3,226 0.65 2,868 0.58 944 0.19
Puerto Rico 1,244 * * * * * * * *
Rhode Island 411 345 0.84 331 0.81 296 0.72 * *
South Carolina 1,815 1,445 0.80 1,151 0.63 615 0.34 45 0.02
South Dakota 331 252 0.76 210 0.64 156 0.47 13 0.04
Tennessee 2,505 1,816 0.72 1,485 0.59 1,110 0.44 233 0.09
Texas 9,149 7,122 0.78 5,763 0.63 3,724 0.41 1,555 0.17
Utah 906 783 0.86 569 0.63 496 0.55 193 0.21
Vermont 257 239 0.93 165 0.64 131 0.51 52 0.20
Virgin Islands 43 22 0.51 * * * * * *
Virginia 3,063 2,497 0.82 2,149 0.70 1,889 0.62 576 0.19
Washington 2,669 2,340 0.88 1,865 0.70 1,703 0.64 633 0.24
West Virginia 741 529 0.71 360 0.49 287 0.39 61 0.08
Wisconsin 2,299 1,856 0.81 1,426 0.62 816 0.35 20 0.01
Wyoming 227 175 0.77 123 0.54 102 0.45 1 0.00
Total 118,281 96,616 0.82 78,219 0.66 59,540 0.50 17,444 0.15
# = Rounds to Zero; * = Data withheld to maintain firm confidentiality.
Note: Figures may not sum to totals due to rounding.
Sources: FCC Form 477 (Connections); 2011-2015 ACS 5-year estimates; Census 2010.
30
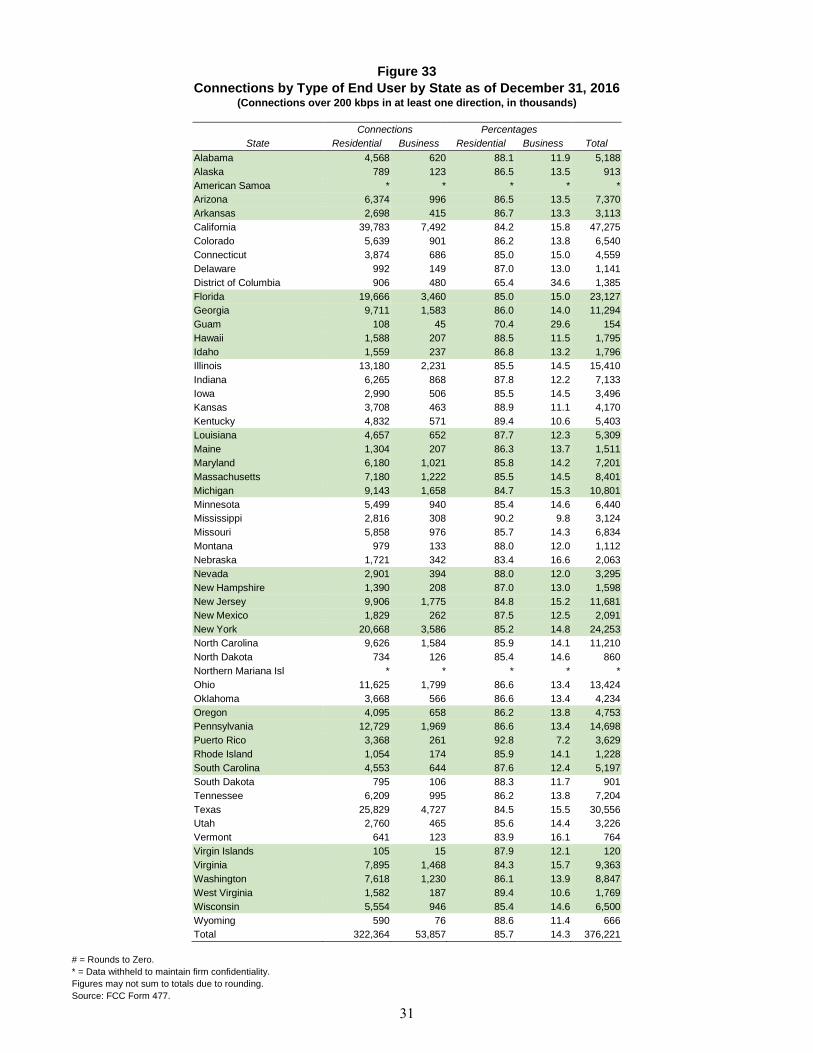
Figure 33
Connections by Type of End User by State as of December 31, 2016 (Connections over 200 kbps in at least one direction, in thousands)
Connections Percentages
State Residential Business Residential Business Total
Alabama 4,568 620 88.1 11.9 5,188
Alaska 789 123 86.5 13.5 913
American Samoa * * * * *
Arizona 6,374 996 86.5 13.5 7,370
Arkansas 2,698 415 86.7 13.3 3,113
California 39,783 7,492 84.2 15.8 47,275
Colorado 5,639 901 86.2 13.8 6,540
Connecticut 3,874 686 85.0 15.0 4,559
Delaware 992 149 87.0 13.0 1,141
District of Columbia 906 480 65.4 34.6 1,385
Florida 19,666 3,460 85.0 15.0 23,127
Georgia 9,711 1,583 86.0 14.0 11,294
Guam 108 45 70.4 29.6 154
Hawaii 1,588 207 88.5 11.5 1,795
Idaho 1,559 237 86.8 13.2 1,796
Illinois 13,180 2,231 85.5 14.5 15,410
Indiana 6,265 868 87.8 12.2 7,133
Iowa 2,990 506 85.5 14.5 3,496
Kansas 3,708 463 88.9 11.1 4,170
Kentucky 4,832 571 89.4 10.6 5,403
Louisiana 4,657 652 87.7 12.3 5,309
Maine 1,304 207 86.3 13.7 1,511
Maryland 6,180 1,021 85.8 14.2 7,201
Massachusetts 7,180 1,222 85.5 14.5 8,401
Michigan 9,143 1,658 84.7 15.3 10,801
Minnesota 5,499 940 85.4 14.6 6,440
Mississippi 2,816 308 90.2 9.8 3,124
Missouri 5,858 976 85.7 14.3 6,834
Montana 979 133 88.0 12.0 1,112
Nebraska 1,721 342 83.4 16.6 2,063
Nevada 2,901 394 88.0 12.0 3,295
New Hampshire 1,390 208 87.0 13.0 1,598
New Jersey 9,906 1,775 84.8 15.2 11,681
New Mexico 1,829 262 87.5 12.5 2,091
New York 20,668 3,586 85.2 14.8 24,253
North Carolina 9,626 1,584 85.9 14.1 11,210
North Dakota 734 126 85.4 14.6 860
Northern Mariana Isl * * * * *
Ohio 11,625 1,799 86.6 13.4 13,424
Oklahoma 3,668 566 86.6 13.4 4,234
Oregon 4,095 658 86.2 13.8 4,753
Pennsylvania 12,729 1,969 86.6 13.4 14,698
Puerto Rico 3,368 261 92.8 7.2 3,629
Rhode Island 1,054 174 85.9 14.1 1,228
South Carolina 4,553 644 87.6 12.4 5,197
South Dakota 795 106 88.3 11.7 901
Tennessee 6,209 995 86.2 13.8 7,204
Texas 25,829 4,727 84.5 15.5 30,556
Utah 2,760 465 85.6 14.4 3,226
Vermont 641 123 83.9 16.1 764
Virgin Islands 105 15 87.9 12.1 120
Virginia 7,895 1,468 84.3 15.7 9,363
Washington 7,618 1,230 86.1 13.9 8,847
West Virginia 1,582 187 89.4 10.6 1,769
Wisconsin 5,554 946 85.4 14.6 6,500
Wyoming 590 76 88.6 11.4 666
Total 322,364 53,857 85.7 14.3 376,221
# = Rounds to Zero.
* = Data withheld to maintain firm confidentiality.
Figures may not sum to totals due to rounding.
Source: FCC Form 477. 31
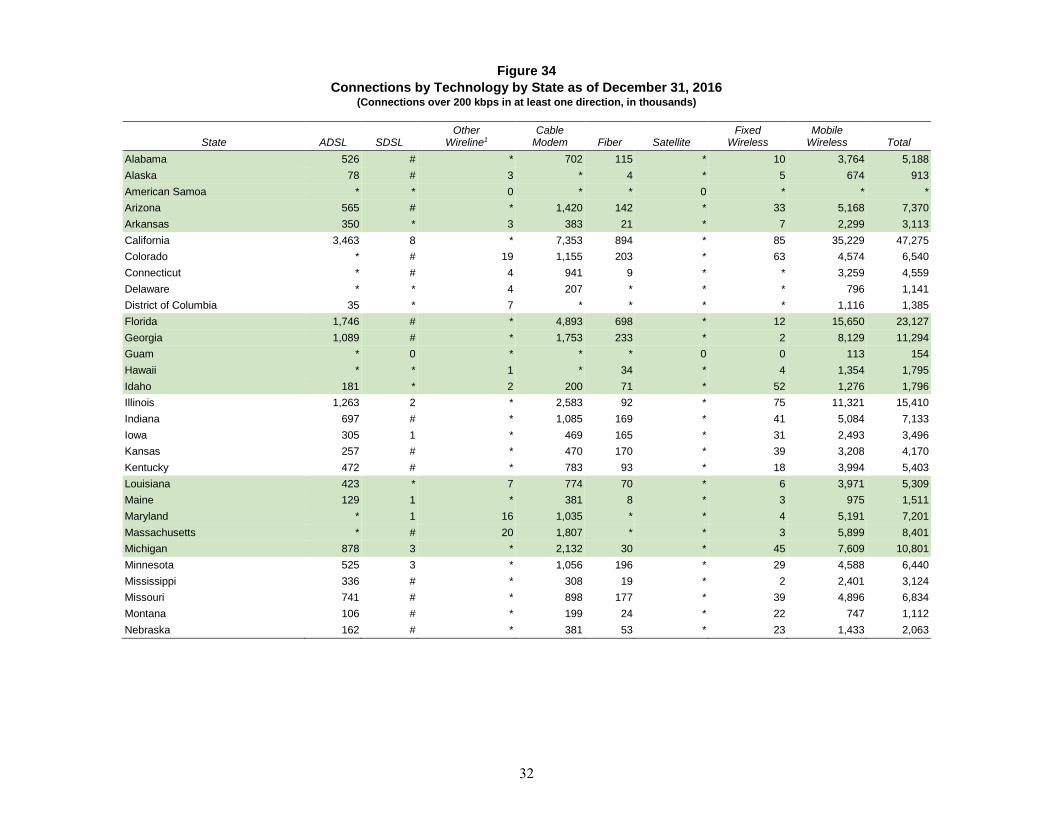
Figure 34
Connections by Technology by State as of December 31, 2016 (Connections over 200 kbps in at least one direction, in thousands)
State ADSL SDSL Other
Wireline1 Cable
Modem Fiber Satellite Fixed
Wireless Mobile
Wireless Total
Alabama 526 # * 702 115 * 10 3,764 5,188
Alaska 78 # 3 * 4 * 5 674 913
American Samoa * * 0 * * 0 * * *
Arizona 565 # * 1,420 142 * 33 5,168 7,370
Arkansas 350 * 3 383 21 * 7 2,299 3,113
California 3,463 8 * 7,353 894 * 85 35,229 47,275
Colorado * # 19 1,155 203 * 63 4,574 6,540
Connecticut * # 4 941 9 * * 3,259 4,559
Delaware * * 4 207 * * * 796 1,141
District of Columbia 35 * 7 * * * * 1,116 1,385
Florida 1,746 # * 4,893 698 * 12 15,650 23,127
Georgia 1,089 # * 1,753 233 * 2 8,129 11,294
Guam * 0 * * * 0 0 113 154
Hawaii * * 1 * 34 * 4 1,354 1,795
Idaho 181 * 2 200 71 * 52 1,276 1,796
Illinois 1,263 2 * 2,583 92 * 75 11,321 15,410
Indiana 697 # * 1,085 169 * 41 5,084 7,133
Iowa 305 1 * 469 165 * 31 2,493 3,496
Kansas 257 # * 470 170 * 39 3,208 4,170
Kentucky 472 # * 783 93 * 18 3,994 5,403
Louisiana 423 * 7 774 70 * 6 3,971 5,309
Maine 129 1 * 381 8 * 3 975 1,511
Maryland * 1 16 1,035 * * 4 5,191 7,201
Massachusetts * # 20 1,807 * * 3 5,899 8,401
Michigan 878 3 * 2,132 30 * 45 7,609 10,801
Minnesota 525 3 * 1,056 196 * 29 4,588 6,440
Mississippi 336 # * 308 19 * 2 2,401 3,124
Missouri 741 # * 898 177 * 39 4,896 6,834
Montana 106 # * 199 24 * 22 747 1,112
Nebraska 162 # * 381 53 * 23 1,433 2,063
32
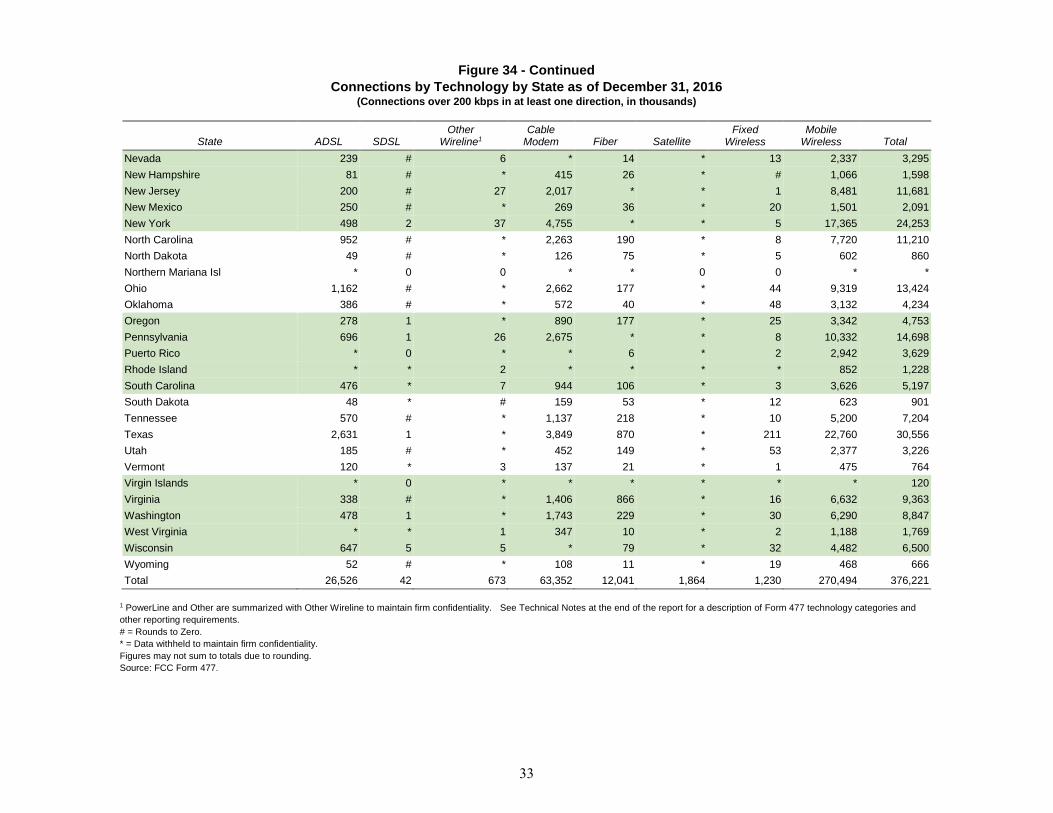
Figure 34 - Continued
Connections by Technology by State as of December 31, 2016 (Connections over 200 kbps in at least one direction, in thousands)
State ADSL SDSL Other
Wireline1 Cable
Modem Fiber Satellite Fixed
Wireless Mobile
Wireless Total
Nevada 239 # 6 * 14 * 13 2,337 3,295
New Hampshire 81 # * 415 26 * # 1,066 1,598
New Jersey 200 # 27 2,017 * * 1 8,481 11,681
New Mexico 250 # * 269 36 * 20 1,501 2,091
New York 498 2 37 4,755 * * 5 17,365 24,253
North Carolina 952 # * 2,263 190 * 8 7,720 11,210
North Dakota 49 # * 126 75 * 5 602 860
Northern Mariana Isl * 0 0 * * 0 0 * *
Ohio 1,162 # * 2,662 177 * 44 9,319 13,424
Oklahoma 386 # * 572 40 * 48 3,132 4,234
Oregon 278 1 * 890 177 * 25 3,342 4,753
Pennsylvania 696 1 26 2,675 * * 8 10,332 14,698
Puerto Rico * 0 * * 6 * 2 2,942 3,629
Rhode Island * * 2 * * * * 852 1,228
South Carolina 476 * 7 944 106 * 3 3,626 5,197
South Dakota 48 * # 159 53 * 12 623 901
Tennessee 570 # * 1,137 218 * 10 5,200 7,204
Texas 2,631 1 * 3,849 870 * 211 22,760 30,556
Utah 185 # * 452 149 * 53 2,377 3,226
Vermont 120 * 3 137 21 * 1 475 764
Virgin Islands * 0 * * * * * * 120
Virginia 338 # * 1,406 866 * 16 6,632 9,363
Washington 478 1 * 1,743 229 * 30 6,290 8,847
West Virginia * * 1 347 10 * 2 1,188 1,769
Wisconsin 647 5 5 * 79 * 32 4,482 6,500
Wyoming 52 # * 108 11 * 19 468 666
Total 26,526 42 673 63,352 12,041 1,864 1,230 270,494 376,221
1 PowerLine and Other are summarized with Other Wireline to maintain firm confidentiality. See Technical Notes at the end of the report for a description of Form 477 technology categories and
other reporting requirements.
# = Rounds to Zero.
* = Data withheld to maintain firm confidentiality.
Figures may not sum to totals due to rounding.
Source: FCC Form 477.
33
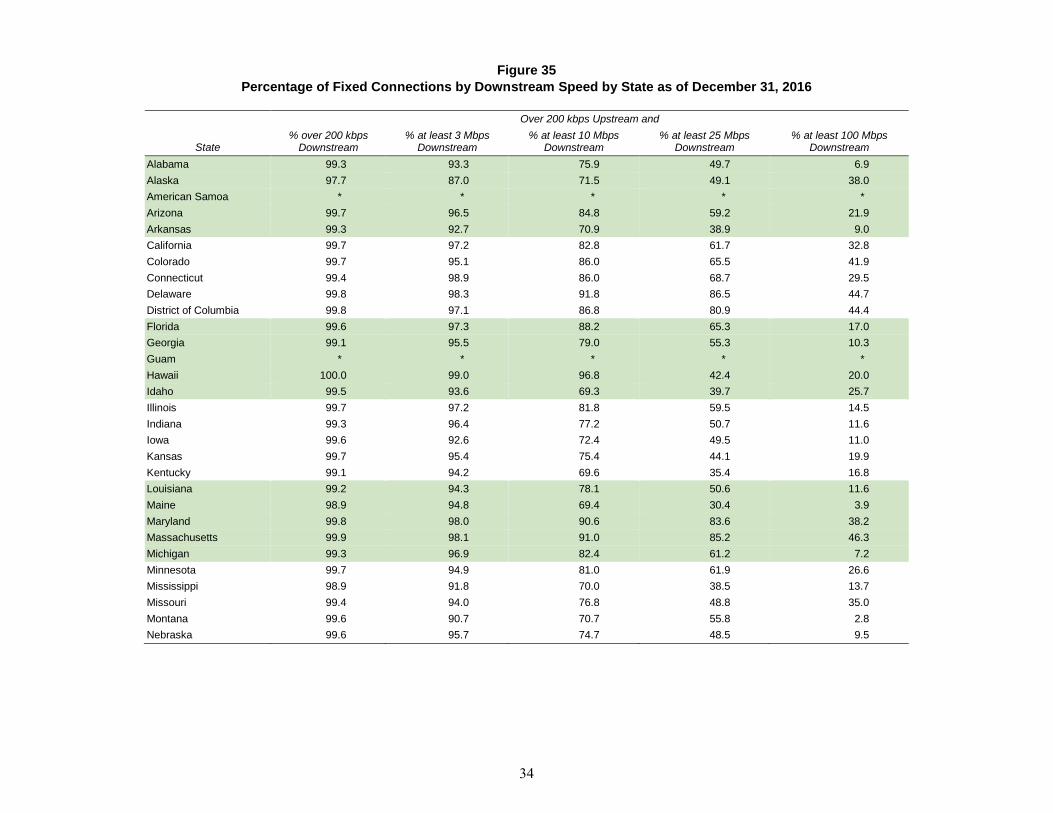
Figure 35
Percentage of Fixed Connections by Downstream Speed by State as of December 31, 2016
Over 200 kbps Upstream and
State % over 200 kbps
Downstream % at least 3 Mbps
Downstream % at least 10 Mbps
Downstream % at least 25 Mbps
Downstream % at least 100 Mbps
Downstream
Alabama 99.3 93.3 75.9 49.7 6.9
Alaska 97.7 87.0 71.5 49.1 38.0
American Samoa * * * * *
Arizona 99.7 96.5 84.8 59.2 21.9
Arkansas 99.3 92.7 70.9 38.9 9.0
California 99.7 97.2 82.8 61.7 32.8
Colorado 99.7 95.1 86.0 65.5 41.9
Connecticut 99.4 98.9 86.0 68.7 29.5
Delaware 99.8 98.3 91.8 86.5 44.7
District of Columbia 99.8 97.1 86.8 80.9 44.4
Florida 99.6 97.3 88.2 65.3 17.0
Georgia 99.1 95.5 79.0 55.3 10.3
Guam * * * * *
Hawaii 100.0 99.0 96.8 42.4 20.0
Idaho 99.5 93.6 69.3 39.7 25.7
Illinois 99.7 97.2 81.8 59.5 14.5
Indiana 99.3 96.4 77.2 50.7 11.6
Iowa 99.6 92.6 72.4 49.5 11.0
Kansas 99.7 95.4 75.4 44.1 19.9
Kentucky 99.1 94.2 69.6 35.4 16.8
Louisiana 99.2 94.3 78.1 50.6 11.6
Maine 98.9 94.8 69.4 30.4 3.9
Maryland 99.8 98.0 90.6 83.6 38.2
Massachusetts 99.9 98.1 91.0 85.2 46.3
Michigan 99.3 96.9 82.4 61.2 7.2
Minnesota 99.7 94.9 81.0 61.9 26.6
Mississippi 98.9 91.8 70.0 38.5 13.7
Missouri 99.4 94.0 76.8 48.8 35.0
Montana 99.6 90.7 70.7 55.8 2.8
Nebraska 99.6 95.7 74.7 48.5 9.5
34
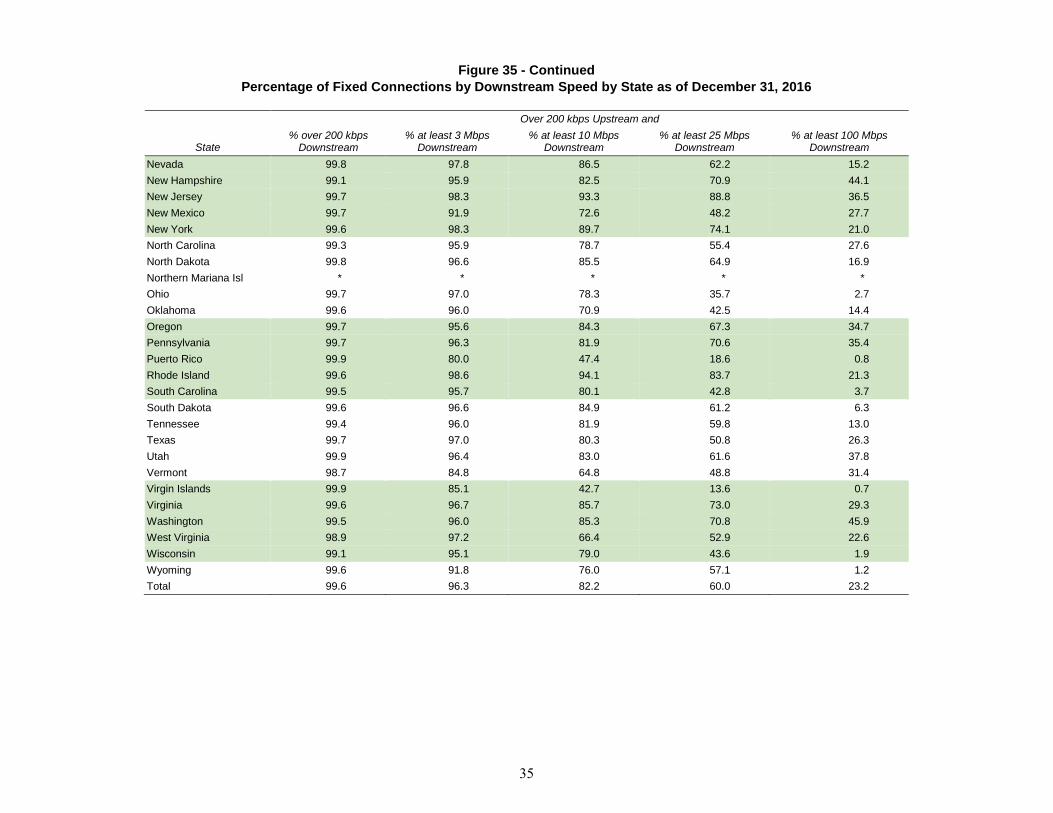
Figure 35 - Continued
Percentage of Fixed Connections by Downstream Speed by State as of December 31, 2016
Over 200 kbps Upstream and
State % over 200 kbps
Downstream % at least 3 Mbps
Downstream % at least 10 Mbps
Downstream % at least 25 Mbps
Downstream % at least 100 Mbps
Downstream
Nevada 99.8 97.8 86.5 62.2 15.2
New Hampshire 99.1 95.9 82.5 70.9 44.1
New Jersey 99.7 98.3 93.3 88.8 36.5
New Mexico 99.7 91.9 72.6 48.2 27.7
New York 99.6 98.3 89.7 74.1 21.0
North Carolina 99.3 95.9 78.7 55.4 27.6
North Dakota 99.8 96.6 85.5 64.9 16.9
Northern Mariana Isl * * * * *
Ohio 99.7 97.0 78.3 35.7 2.7
Oklahoma 99.6 96.0 70.9 42.5 14.4
Oregon 99.7 95.6 84.3 67.3 34.7
Pennsylvania 99.7 96.3 81.9 70.6 35.4
Puerto Rico 99.9 80.0 47.4 18.6 0.8
Rhode Island 99.6 98.6 94.1 83.7 21.3
South Carolina 99.5 95.7 80.1 42.8 3.7
South Dakota 99.6 96.6 84.9 61.2 6.3
Tennessee 99.4 96.0 81.9 59.8 13.0
Texas 99.7 97.0 80.3 50.8 26.3
Utah 99.9 96.4 83.0 61.6 37.8
Vermont 98.7 84.8 64.8 48.8 31.4
Virgin Islands 99.9 85.1 42.7 13.6 0.7
Virginia 99.6 96.7 85.7 73.0 29.3
Washington 99.5 96.0 85.3 70.8 45.9
West Virginia 98.9 97.2 66.4 52.9 22.6
Wisconsin 99.1 95.1 79.0 43.6 1.9
Wyoming 99.6 91.8 76.0 57.1 1.2
Total 99.6 96.3 82.2 60.0 23.2
35
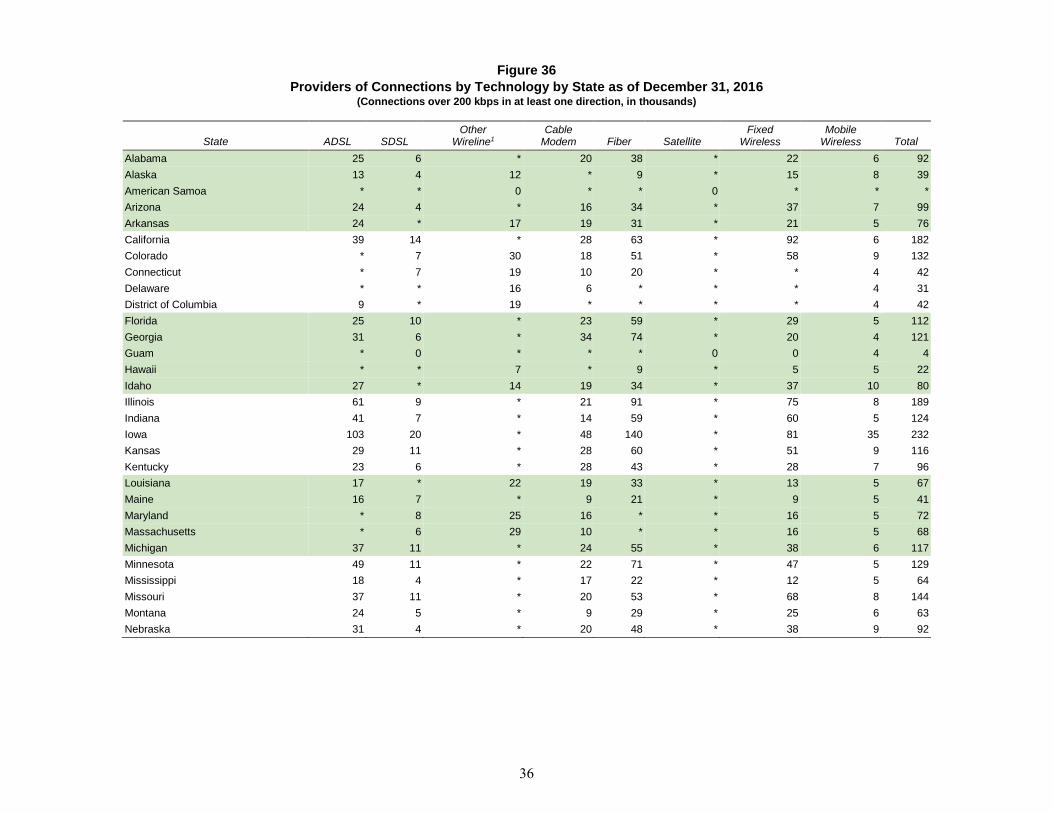
Figure 36
Providers of Connections by Technology by State as of December 31, 2016 (Connections over 200 kbps in at least one direction, in thousands)
State ADSL SDSL Other
Wireline1 Cable
Modem Fiber Satellite Fixed
Wireless Mobile
Wireless Total
Alabama 25 6 * 20 38 * 22 6 92
Alaska 13 4 12 * 9 * 15 8 39
American Samoa * * 0 * * 0 * * *
Arizona 24 4 * 16 34 * 37 7 99
Arkansas 24 * 17 19 31 * 21 5 76
California 39 14 * 28 63 * 92 6 182
Colorado * 7 30 18 51 * 58 9 132
Connecticut * 7 19 10 20 * * 4 42
Delaware * * 16 6 * * * 4 31
District of Columbia 9 * 19 * * * * 4 42
Florida 25 10 * 23 59 * 29 5 112
Georgia 31 6 * 34 74 * 20 4 121
Guam * 0 * * * 0 0 4 4
Hawaii * * 7 * 9 * 5 5 22
Idaho 27 * 14 19 34 * 37 10 80
Illinois 61 9 * 21 91 * 75 8 189
Indiana 41 7 * 14 59 * 60 5 124
Iowa 103 20 * 48 140 * 81 35 232
Kansas 29 11 * 28 60 * 51 9 116
Kentucky 23 6 * 28 43 * 28 7 96
Louisiana 17 * 22 19 33 * 13 5 67
Maine 16 7 * 9 21 * 9 5 41
Maryland * 8 25 16 * * 16 5 72
Massachusetts * 6 29 10 * * 16 5 68
Michigan 37 11 * 24 55 * 38 6 117
Minnesota 49 11 * 22 71 * 47 5 129
Mississippi 18 4 * 17 22 * 12 5 64
Missouri 37 11 * 20 53 * 68 8 144
Montana 24 5 * 9 29 * 25 6 63
Nebraska 31 4 * 20 48 * 38 9 92
36
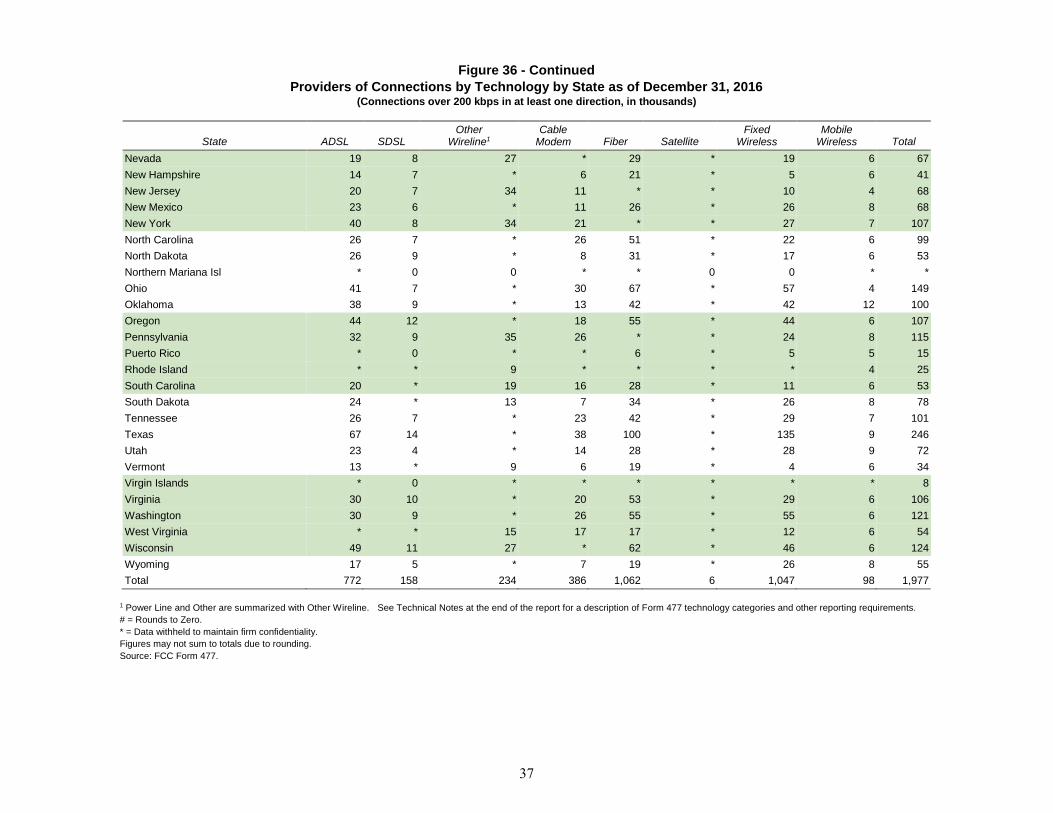
Figure 36 - Continued
Providers of Connections by Technology by State as of December 31, 2016 (Connections over 200 kbps in at least one direction, in thousands)
State ADSL SDSL Other
Wireline1 Cable
Modem Fiber Satellite Fixed
Wireless Mobile
Wireless Total
Nevada 19 8 27 * 29 * 19 6 67
New Hampshire 14 7 * 6 21 * 5 6 41
New Jersey 20 7 34 11 * * 10 4 68
New Mexico 23 6 * 11 26 * 26 8 68
New York 40 8 34 21 * * 27 7 107
North Carolina 26 7 * 26 51 * 22 6 99
North Dakota 26 9 * 8 31 * 17 6 53
Northern Mariana Isl * 0 0 * * 0 0 * *
Ohio 41 7 * 30 67 * 57 4 149
Oklahoma 38 9 * 13 42 * 42 12 100
Oregon 44 12 * 18 55 * 44 6 107
Pennsylvania 32 9 35 26 * * 24 8 115
Puerto Rico * 0 * * 6 * 5 5 15
Rhode Island * * 9 * * * * 4 25
South Carolina 20 * 19 16 28 * 11 6 53
South Dakota 24 * 13 7 34 * 26 8 78
Tennessee 26 7 * 23 42 * 29 7 101
Texas 67 14 * 38 100 * 135 9 246
Utah 23 4 * 14 28 * 28 9 72
Vermont 13 * 9 6 19 * 4 6 34
Virgin Islands * 0 * * * * * * 8
Virginia 30 10 * 20 53 * 29 6 106
Washington 30 9 * 26 55 * 55 6 121
West Virginia * * 15 17 17 * 12 6 54
Wisconsin 49 11 27 * 62 * 46 6 124
Wyoming 17 5 * 7 19 * 26 8 55
Total 772 158 234 386 1,062 6 1,047 98 1,977
1 Power Line and Other are summarized with Other Wireline. See Technical Notes at the end of the report for a description of Form 477 technology categories and other reporting requirements.
# = Rounds to Zero.
* = Data withheld to maintain firm confidentiality.
Figures may not sum to totals due to rounding.
Source: FCC Form 477.
37
SECTION 4
SUMMARY STATISTICS: COUNTIES AND CENSUS TRACTS
Table of Contents
Figure 37 Distribution of Counties by Ratio of Residential Fixed Connections over 200 kbps
in at Least One Direction to County Households as of December 31, 2016 ........... 39
Figure 38 Distribution of Counties by Ratio of Residential Fixed Connections over 200 kbps
in at Least One Direction to County Households by Technology
as of December 31, 2016 ......................................................................................... 40
Figure 39 Distribution of Census Tracts by Ratio of Residential Fixed Connections over 200
kbps in at Least One Direction to Tract Households as of December 31, 2016 ...... 41
Figure 40 Distribution of Census Tracts by Ratio of Residential Fixed Connections over
200 kbps in at Least One Direction to Tract Households by Technology
as of December 31, 2016 ......................................................................................... 42
Figure 41 Percentage of Developed Census Blocks with Residential Fixed Connections by
Technology as of December 31, 2016 ..................................................................... 43
Figure 42 Distribution of Counties by Ratio of Residential Fixed Connections to County
Households by State as of December 31, 2016 ....................................................... 44
Figure 43 Distribution of Census Tracts by Ratio of Residential Fixed Connections to Tract
Households by State as of December 31, 2016 ....................................................... 46
38
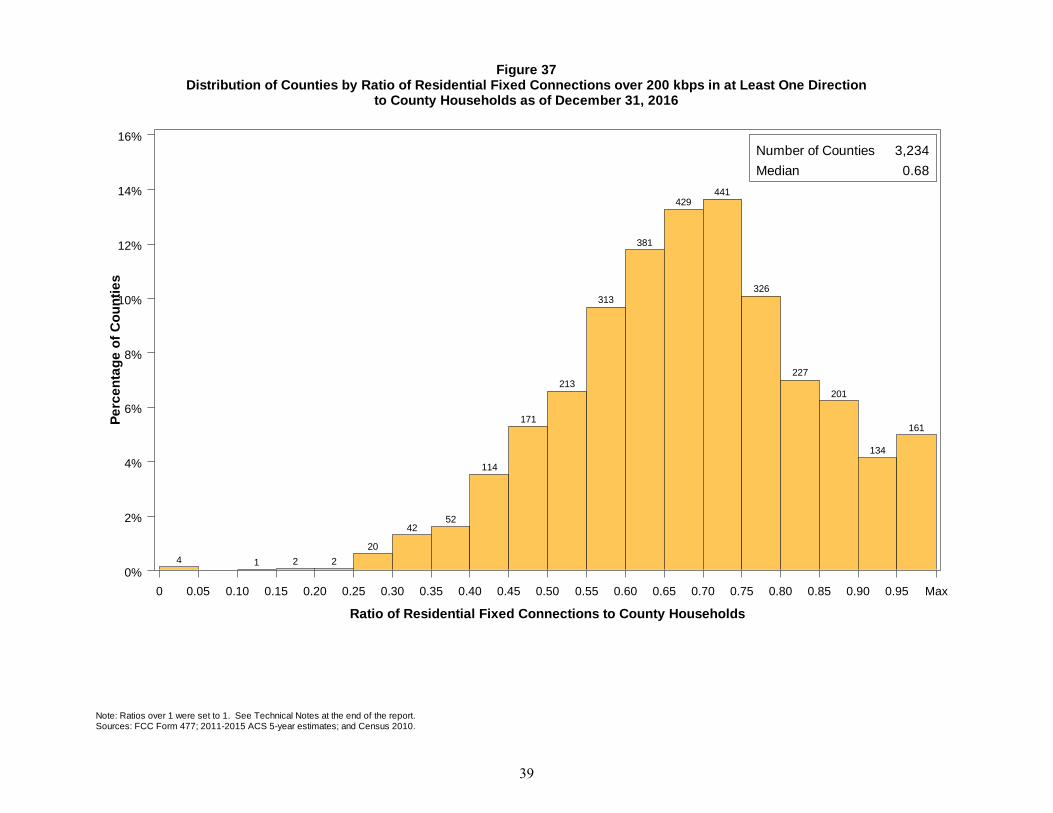
Figure 37Distribution of Counties by Ratio of Residential Fixed Connections over 200 kbps in at Least One Direction
to County Households as of December 31, 2016
Sources: FCC Form 477; 2011-2015 ACS 5-year estimates; and Census 2010.Note: Ratios over 1 were set to 1. See Technical Notes at the end of the report.
0 0.05 0.10 0.15 0.20 0.25 0.30 0.35 0.40 0.45 0.50 0.55 0.60 0.65 0.70 0.75 0.80 0.85 0.90 0.95 Max
0%
2%
4%
6%
8%
10%
12%
14%
16%
Pe
rce
nta
ge
of
Co
un
tie
s
Number of Counties 3,234
Median 0.68
Ratio of Residential Fixed Connections to County Households
4 1 2 2
20
4252
114
171
213
313
381
429441
326
227
201
134
161
39
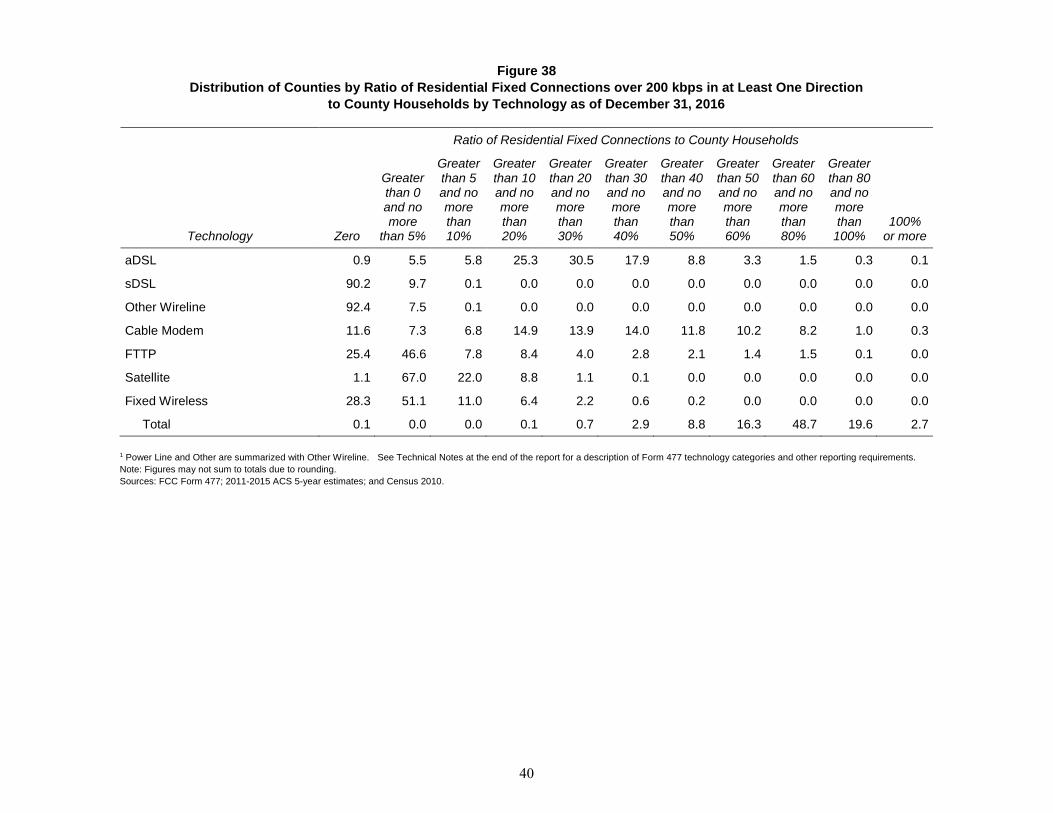
Figure 38
Distribution of Counties by Ratio of Residential Fixed Connections over 200 kbps in at Least One Direction
to County Households by Technology as of December 31, 2016
Ratio of Residential Fixed Connections to County Households
Technology Zero
Greater than 0 and no more
than 5%
Greater than 5 and no more than 10%
Greater than 10 and no more than 20%
Greater than 20 and no more than 30%
Greater than 30 and no more than 40%
Greater than 40 and no more than 50%
Greater than 50 and no more than 60%
Greater than 60 and no more than 80%
Greater than 80 and no more than
100% 100%
or more
aDSL 0.9 5.5 5.8 25.3 30.5 17.9 8.8 3.3 1.5 0.3 0.1
sDSL 90.2 9.7 0.1 0.0 0.0 0.0 0.0 0.0 0.0 0.0 0.0
Other Wireline 92.4 7.5 0.1 0.0 0.0 0.0 0.0 0.0 0.0 0.0 0.0
Cable Modem 11.6 7.3 6.8 14.9 13.9 14.0 11.8 10.2 8.2 1.0 0.3
FTTP 25.4 46.6 7.8 8.4 4.0 2.8 2.1 1.4 1.5 0.1 0.0
Satellite 1.1 67.0 22.0 8.8 1.1 0.1 0.0 0.0 0.0 0.0 0.0
Fixed Wireless 28.3 51.1 11.0 6.4 2.2 0.6 0.2 0.0 0.0 0.0 0.0
Total 0.1 0.0 0.0 0.1 0.7 2.9 8.8 16.3 48.7 19.6 2.7
1 Power Line and Other are summarized with Other Wireline. See Technical Notes at the end of the report for a description of Form 477 technology categories and other reporting requirements.
Note: Figures may not sum to totals due to rounding.
Sources: FCC Form 477; 2011-2015 ACS 5-year estimates; and Census 2010.
40
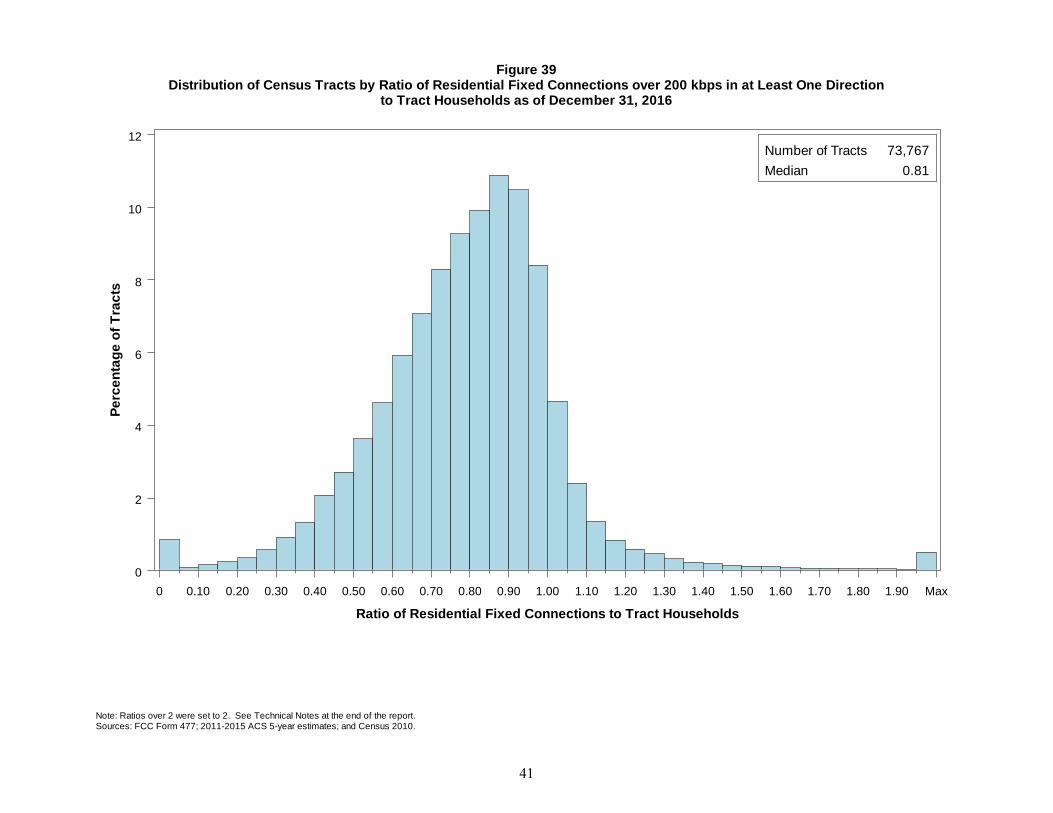
Figure 39Distribution of Census Tracts by Ratio of Residential Fixed Connections over 200 kbps in at Least One Direction
to Tract Households as of December 31, 2016
Sources: FCC Form 477; 2011-2015 ACS 5-year estimates; and Census 2010.Note: Ratios over 2 were set to 2. See Technical Notes at the end of the report.
0 0.10 0.20 0.30 0.40 0.50 0.60 0.70 0.80 0.90 1.00 1.10 1.20 1.30 1.40 1.50 1.60 1.70 1.80 1.90 Max
0
2
4
6
8
10
12
Pe
rce
nta
ge
of
Tra
cts
Number of Tracts 73,767
Median 0.81
Ratio of Residential Fixed Connections to Tract Households
41

Figure 40
Distribution of Census Tracts by Ratio of Residential Fixed Connections over 200 kbps in at Least One Direction
to Tract Households by Technology as of December 31, 2016
Ratio of Residential Fixed Connections to Tract Households
Technology Zero
Greater than 0 and no more
than 5%
Greater than 5 and no more than 10%
Greater than 10 and no more than 20%
Greater than 20 and no more than 30%
Greater than 30 and no more than 40%
Greater than 40 and no more than 50%
Greater than 50 and no more than 60%
Greater than 60 and no more than 80%
Greater than 80 and no more than
100% 100%
or more
aDSL 2.0 18.0 11.9 24.5 20.4 13.1 5.9 2.5 1.3 0.3 0.2
sDSL 98.5 1.4 0.0 0.0 0.0 0.0 0.0 0.0 0.0 0.0 0.0
Other Wireline 98.7 1.1 0.1 0.1 0.0 0.0 0.0 0.0 0.0 0.0 0.0
Cable Modem 4.7 3.1 1.8 4.4 7.7 12.9 17.0 17.9 22.5 6.2 1.8
FTTP 54.4 16.3 4.7 6.8 4.9 4.3 3.5 2.5 2.2 0.3 0.1
Satellite 28.6 62.0 5.1 3.2 0.7 0.2 0.1 0.0 0.0 0.0 0.0
Fixed Wireless 75.6 18.7 2.5 2.0 0.7 0.3 0.1 0.0 0.0 0.0 0.0
Total 0.8 0.1 0.1 0.4 0.9 2.2 4.8 8.2 30.6 39.7 12.2
1 Power Line and Other are summarized with Other Wireline. See Technical Notes at the end of the report for a description of Form 477 technology categories and other reporting requirements.
Note: Figures may not sum to totals due to rounding.
Sources: FCC Form 477; 2011-2015 ACS 5-year estimates; and Census 2010.
42
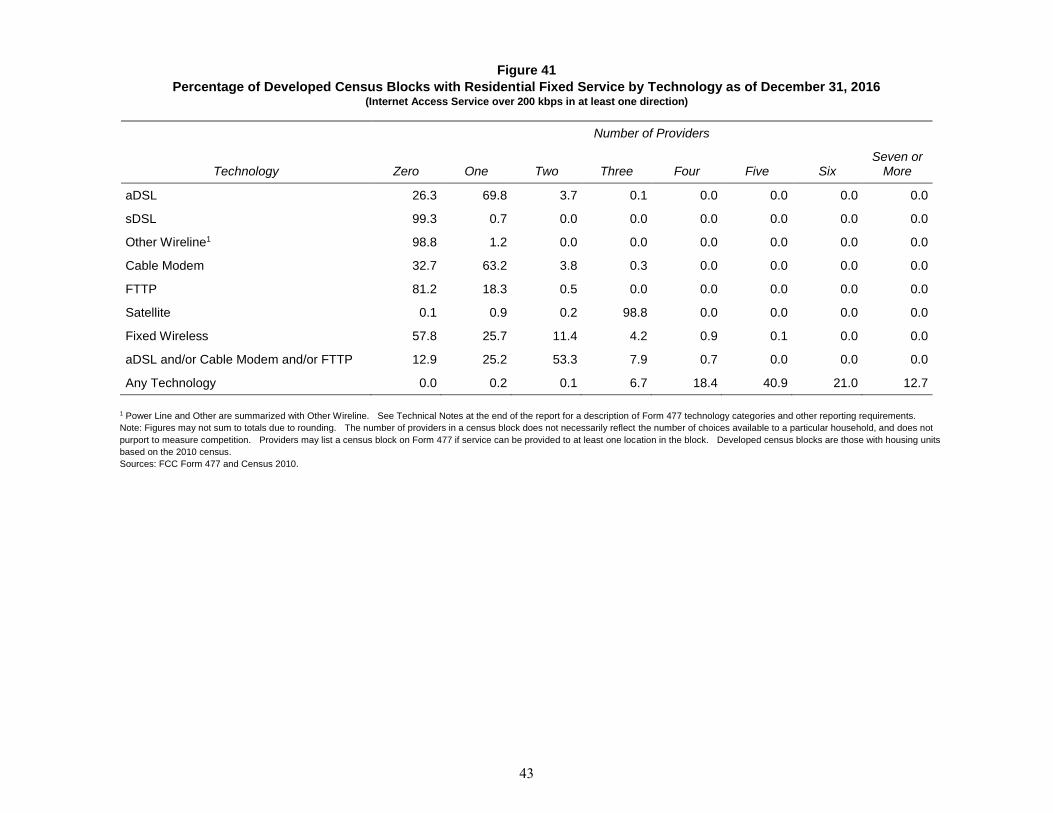
Figure 41
Percentage of Developed Census Blocks with Residential Fixed Service by Technology as of December 31, 2016 (Internet Access Service over 200 kbps in at least one direction)
Number of Providers
Technology Zero One Two Three Four Five Six Seven or
More
aDSL 26.3 69.8 3.7 0.1 0.0 0.0 0.0 0.0
sDSL 99.3 0.7 0.0 0.0 0.0 0.0 0.0 0.0
Other Wireline1 98.8 1.2 0.0 0.0 0.0 0.0 0.0 0.0
Cable Modem 32.7 63.2 3.8 0.3 0.0 0.0 0.0 0.0
FTTP 81.2 18.3 0.5 0.0 0.0 0.0 0.0 0.0
Satellite 0.1 0.9 0.2 98.8 0.0 0.0 0.0 0.0
Fixed Wireless 57.8 25.7 11.4 4.2 0.9 0.1 0.0 0.0
aDSL and/or Cable Modem and/or FTTP 12.9 25.2 53.3 7.9 0.7 0.0 0.0 0.0
Any Technology 0.0 0.2 0.1 6.7 18.4 40.9 21.0 12.7
1 Power Line and Other are summarized with Other Wireline. See Technical Notes at the end of the report for a description of Form 477 technology categories and other reporting requirements.
Note: Figures may not sum to totals due to rounding. The number of providers in a census block does not necessarily reflect the number of choices available to a particular household, and does not
purport to measure competition. Providers may list a census block on Form 477 if service can be provided to at least one location in the block. Developed census blocks are those with housing units
based on the 2010 census.
Sources: FCC Form 477 and Census 2010.
43
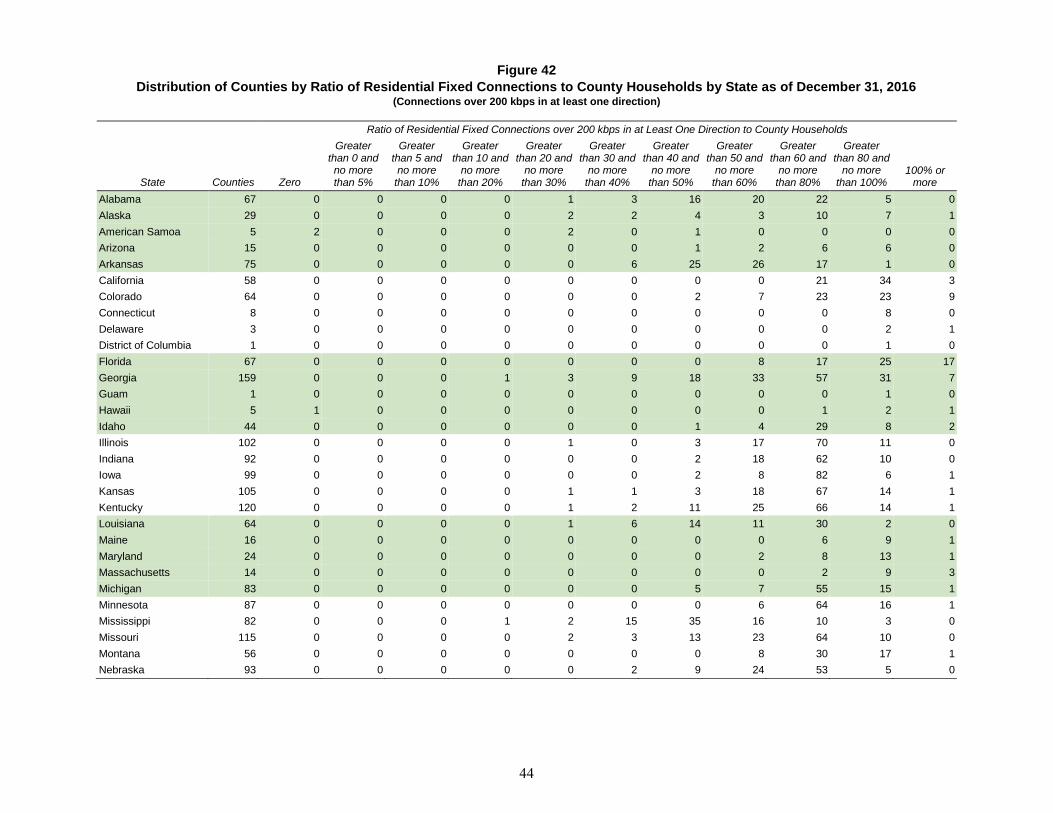
Figure 42
Distribution of Counties by Ratio of Residential Fixed Connections to County Households by State as of December 31, 2016 (Connections over 200 kbps in at least one direction)
Ratio of Residential Fixed Connections over 200 kbps in at Least One Direction to County Households
State Counties Zero
Greater than 0 and no more than 5%
Greater than 5 and no more
than 10%
Greater than 10 and
no more than 20%
Greater than 20 and
no more than 30%
Greater than 30 and
no more than 40%
Greater than 40 and
no more than 50%
Greater than 50 and
no more than 60%
Greater than 60 and
no more than 80%
Greater than 80 and
no more than 100%
100% or more
Alabama 67 0 0 0 0 1 3 16 20 22 5 0
Alaska 29 0 0 0 0 2 2 4 3 10 7 1
American Samoa 5 2 0 0 0 2 0 1 0 0 0 0
Arizona 15 0 0 0 0 0 0 1 2 6 6 0
Arkansas 75 0 0 0 0 0 6 25 26 17 1 0
California 58 0 0 0 0 0 0 0 0 21 34 3
Colorado 64 0 0 0 0 0 0 2 7 23 23 9
Connecticut 8 0 0 0 0 0 0 0 0 0 8 0
Delaware 3 0 0 0 0 0 0 0 0 0 2 1
District of Columbia 1 0 0 0 0 0 0 0 0 0 1 0
Florida 67 0 0 0 0 0 0 0 8 17 25 17
Georgia 159 0 0 0 1 3 9 18 33 57 31 7
Guam 1 0 0 0 0 0 0 0 0 0 1 0
Hawaii 5 1 0 0 0 0 0 0 0 1 2 1
Idaho 44 0 0 0 0 0 0 1 4 29 8 2
Illinois 102 0 0 0 0 1 0 3 17 70 11 0
Indiana 92 0 0 0 0 0 0 2 18 62 10 0
Iowa 99 0 0 0 0 0 0 2 8 82 6 1
Kansas 105 0 0 0 0 1 1 3 18 67 14 1
Kentucky 120 0 0 0 0 1 2 11 25 66 14 1
Louisiana 64 0 0 0 0 1 6 14 11 30 2 0
Maine 16 0 0 0 0 0 0 0 0 6 9 1
Maryland 24 0 0 0 0 0 0 0 2 8 13 1
Massachusetts 14 0 0 0 0 0 0 0 0 2 9 3
Michigan 83 0 0 0 0 0 0 5 7 55 15 1
Minnesota 87 0 0 0 0 0 0 0 6 64 16 1
Mississippi 82 0 0 0 1 2 15 35 16 10 3 0
Missouri 115 0 0 0 0 2 3 13 23 64 10 0
Montana 56 0 0 0 0 0 0 0 8 30 17 1
Nebraska 93 0 0 0 0 0 2 9 24 53 5 0
44
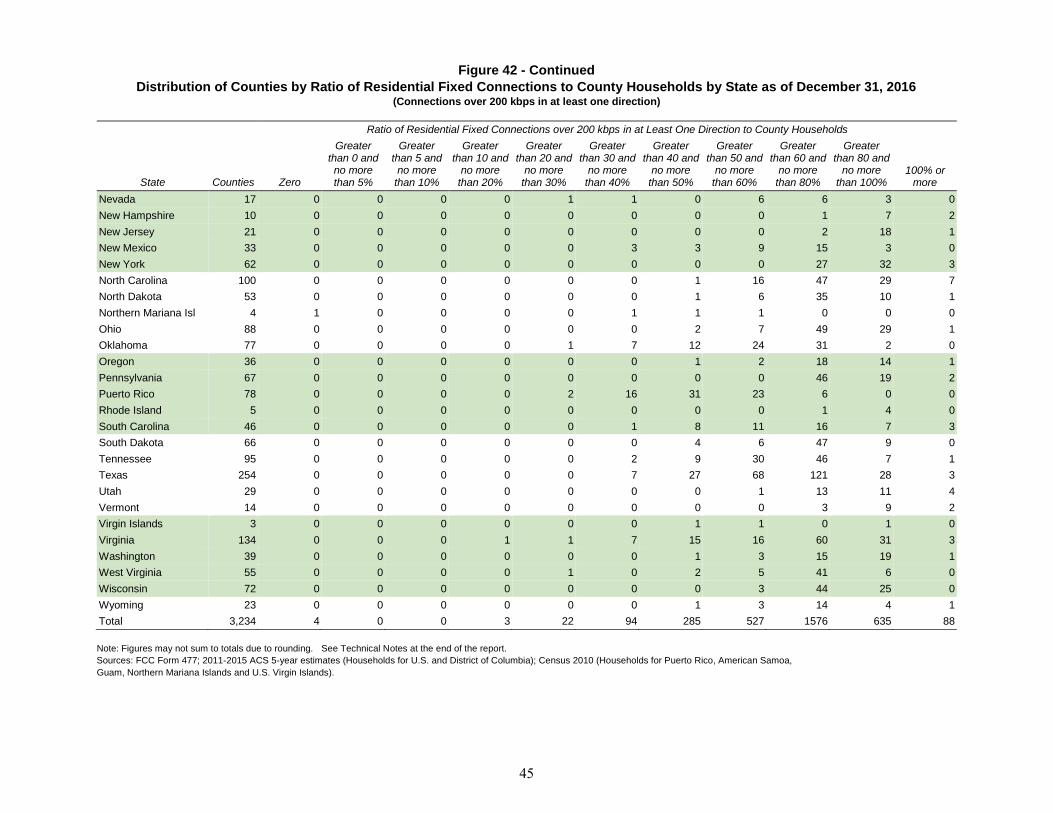
Figure 42 - Continued
Distribution of Counties by Ratio of Residential Fixed Connections to County Households by State as of December 31, 2016 (Connections over 200 kbps in at least one direction)
Ratio of Residential Fixed Connections over 200 kbps in at Least One Direction to County Households
State Counties Zero
Greater than 0 and no more than 5%
Greater than 5 and no more
than 10%
Greater than 10 and
no more than 20%
Greater than 20 and
no more than 30%
Greater than 30 and
no more than 40%
Greater than 40 and
no more than 50%
Greater than 50 and
no more than 60%
Greater than 60 and
no more than 80%
Greater than 80 and
no more than 100%
100% or more
Nevada 17 0 0 0 0 1 1 0 6 6 3 0
New Hampshire 10 0 0 0 0 0 0 0 0 1 7 2
New Jersey 21 0 0 0 0 0 0 0 0 2 18 1
New Mexico 33 0 0 0 0 0 3 3 9 15 3 0
New York 62 0 0 0 0 0 0 0 0 27 32 3
North Carolina 100 0 0 0 0 0 0 1 16 47 29 7
North Dakota 53 0 0 0 0 0 0 1 6 35 10 1
Northern Mariana Isl 4 1 0 0 0 0 1 1 1 0 0 0
Ohio 88 0 0 0 0 0 0 2 7 49 29 1
Oklahoma 77 0 0 0 0 1 7 12 24 31 2 0
Oregon 36 0 0 0 0 0 0 1 2 18 14 1
Pennsylvania 67 0 0 0 0 0 0 0 0 46 19 2
Puerto Rico 78 0 0 0 0 2 16 31 23 6 0 0
Rhode Island 5 0 0 0 0 0 0 0 0 1 4 0
South Carolina 46 0 0 0 0 0 1 8 11 16 7 3
South Dakota 66 0 0 0 0 0 0 4 6 47 9 0
Tennessee 95 0 0 0 0 0 2 9 30 46 7 1
Texas 254 0 0 0 0 0 7 27 68 121 28 3
Utah 29 0 0 0 0 0 0 0 1 13 11 4
Vermont 14 0 0 0 0 0 0 0 0 3 9 2
Virgin Islands 3 0 0 0 0 0 0 1 1 0 1 0
Virginia 134 0 0 0 1 1 7 15 16 60 31 3
Washington 39 0 0 0 0 0 0 1 3 15 19 1
West Virginia 55 0 0 0 0 1 0 2 5 41 6 0
Wisconsin 72 0 0 0 0 0 0 0 3 44 25 0
Wyoming 23 0 0 0 0 0 0 1 3 14 4 1
Total 3,234 4 0 0 3 22 94 285 527 1576 635 88
Note: Figures may not sum to totals due to rounding. See Technical Notes at the end of the report.
Sources: FCC Form 477; 2011-2015 ACS 5-year estimates (Households for U.S. and District of Columbia); Census 2010 (Households for Puerto Rico, American Samoa,
Guam, Northern Mariana Islands and U.S. Virgin Islands).
45
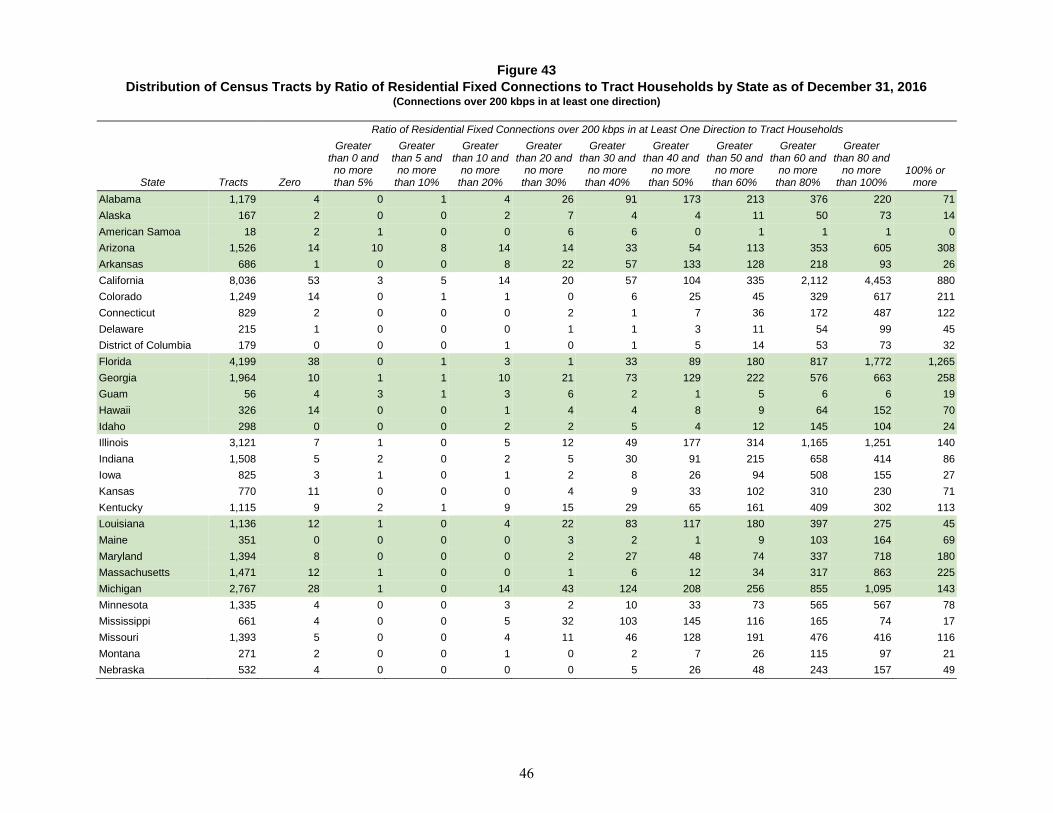
Figure 43
Distribution of Census Tracts by Ratio of Residential Fixed Connections to Tract Households by State as of December 31, 2016 (Connections over 200 kbps in at least one direction)
Ratio of Residential Fixed Connections over 200 kbps in at Least One Direction to Tract Households
State Tracts Zero
Greater than 0 and no more than 5%
Greater than 5 and no more
than 10%
Greater than 10 and
no more than 20%
Greater than 20 and
no more than 30%
Greater than 30 and
no more than 40%
Greater than 40 and
no more than 50%
Greater than 50 and
no more than 60%
Greater than 60 and
no more than 80%
Greater than 80 and
no more than 100%
100% or more
Alabama 1,179 4 0 1 4 26 91 173 213 376 220 71
Alaska 167 2 0 0 2 7 4 4 11 50 73 14
American Samoa 18 2 1 0 0 6 6 0 1 1 1 0
Arizona 1,526 14 10 8 14 14 33 54 113 353 605 308
Arkansas 686 1 0 0 8 22 57 133 128 218 93 26
California 8,036 53 3 5 14 20 57 104 335 2,112 4,453 880
Colorado 1,249 14 0 1 1 0 6 25 45 329 617 211
Connecticut 829 2 0 0 0 2 1 7 36 172 487 122
Delaware 215 1 0 0 0 1 1 3 11 54 99 45
District of Columbia 179 0 0 0 1 0 1 5 14 53 73 32
Florida 4,199 38 0 1 3 1 33 89 180 817 1,772 1,265
Georgia 1,964 10 1 1 10 21 73 129 222 576 663 258
Guam 56 4 3 1 3 6 2 1 5 6 6 19
Hawaii 326 14 0 0 1 4 4 8 9 64 152 70
Idaho 298 0 0 0 2 2 5 4 12 145 104 24
Illinois 3,121 7 1 0 5 12 49 177 314 1,165 1,251 140
Indiana 1,508 5 2 0 2 5 30 91 215 658 414 86
Iowa 825 3 1 0 1 2 8 26 94 508 155 27
Kansas 770 11 0 0 0 4 9 33 102 310 230 71
Kentucky 1,115 9 2 1 9 15 29 65 161 409 302 113
Louisiana 1,136 12 1 0 4 22 83 117 180 397 275 45
Maine 351 0 0 0 0 3 2 1 9 103 164 69
Maryland 1,394 8 0 0 0 2 27 48 74 337 718 180
Massachusetts 1,471 12 1 0 0 1 6 12 34 317 863 225
Michigan 2,767 28 1 0 14 43 124 208 256 855 1,095 143
Minnesota 1,335 4 0 0 3 2 10 33 73 565 567 78
Mississippi 661 4 0 0 5 32 103 145 116 165 74 17
Missouri 1,393 5 0 0 4 11 46 128 191 476 416 116
Montana 271 2 0 0 1 0 2 7 26 115 97 21
Nebraska 532 4 0 0 0 0 5 26 48 243 157 49
46
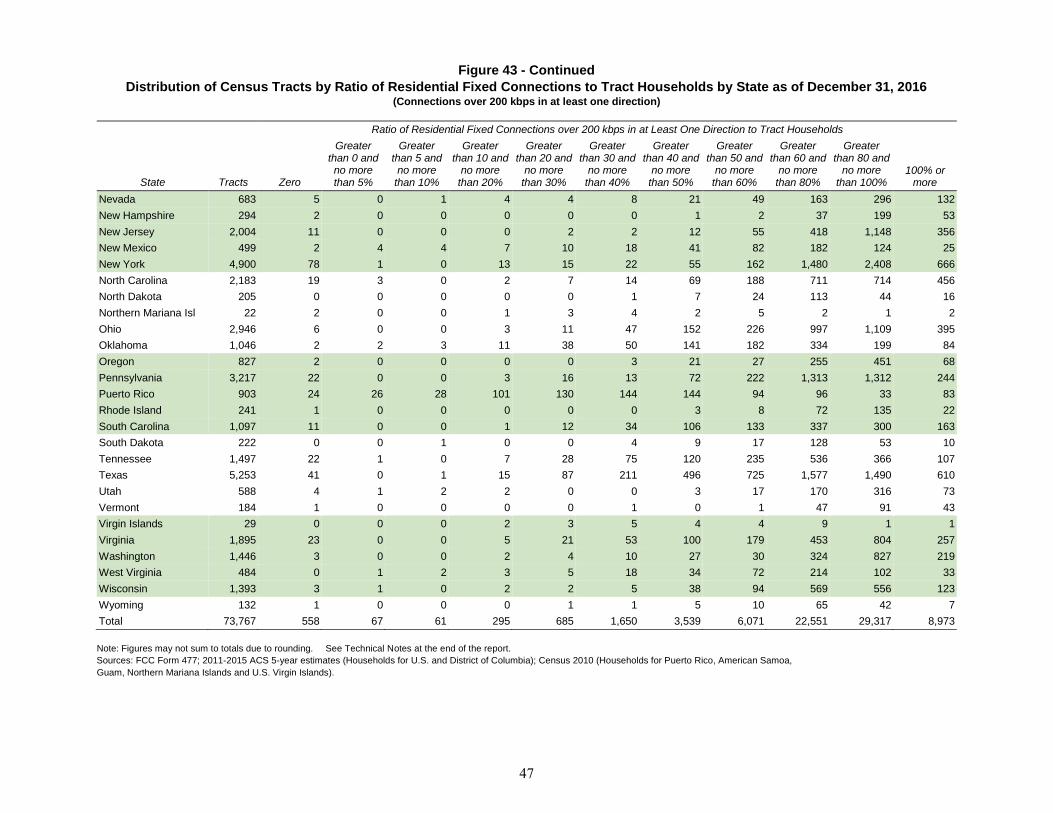
Figure 43 - Continued
Distribution of Census Tracts by Ratio of Residential Fixed Connections to Tract Households by State as of December 31, 2016 (Connections over 200 kbps in at least one direction)
Ratio of Residential Fixed Connections over 200 kbps in at Least One Direction to Tract Households
State Tracts Zero
Greater than 0 and no more than 5%
Greater than 5 and no more
than 10%
Greater than 10 and
no more than 20%
Greater than 20 and
no more than 30%
Greater than 30 and
no more than 40%
Greater than 40 and
no more than 50%
Greater than 50 and
no more than 60%
Greater than 60 and
no more than 80%
Greater than 80 and
no more than 100%
100% or more
Nevada 683 5 0 1 4 4 8 21 49 163 296 132
New Hampshire 294 2 0 0 0 0 0 1 2 37 199 53
New Jersey 2,004 11 0 0 0 2 2 12 55 418 1,148 356
New Mexico 499 2 4 4 7 10 18 41 82 182 124 25
New York 4,900 78 1 0 13 15 22 55 162 1,480 2,408 666
North Carolina 2,183 19 3 0 2 7 14 69 188 711 714 456
North Dakota 205 0 0 0 0 0 1 7 24 113 44 16
Northern Mariana Isl 22 2 0 0 1 3 4 2 5 2 1 2
Ohio 2,946 6 0 0 3 11 47 152 226 997 1,109 395
Oklahoma 1,046 2 2 3 11 38 50 141 182 334 199 84
Oregon 827 2 0 0 0 0 3 21 27 255 451 68
Pennsylvania 3,217 22 0 0 3 16 13 72 222 1,313 1,312 244
Puerto Rico 903 24 26 28 101 130 144 144 94 96 33 83
Rhode Island 241 1 0 0 0 0 0 3 8 72 135 22
South Carolina 1,097 11 0 0 1 12 34 106 133 337 300 163
South Dakota 222 0 0 1 0 0 4 9 17 128 53 10
Tennessee 1,497 22 1 0 7 28 75 120 235 536 366 107
Texas 5,253 41 0 1 15 87 211 496 725 1,577 1,490 610
Utah 588 4 1 2 2 0 0 3 17 170 316 73
Vermont 184 1 0 0 0 0 1 0 1 47 91 43
Virgin Islands 29 0 0 0 2 3 5 4 4 9 1 1
Virginia 1,895 23 0 0 5 21 53 100 179 453 804 257
Washington 1,446 3 0 0 2 4 10 27 30 324 827 219
West Virginia 484 0 1 2 3 5 18 34 72 214 102 33
Wisconsin 1,393 3 1 0 2 2 5 38 94 569 556 123
Wyoming 132 1 0 0 0 1 1 5 10 65 42 7
Total 73,767 558 67 61 295 685 1,650 3,539 6,071 22,551 29,317 8,973
Note: Figures may not sum to totals due to rounding. See Technical Notes at the end of the report.
Sources: FCC Form 477; 2011-2015 ACS 5-year estimates (Households for U.S. and District of Columbia); Census 2010 (Households for Puerto Rico, American Samoa,
Guam, Northern Mariana Islands and U.S. Virgin Islands).
47
SECTION 5
CORRELATED RESULTS: DEMOGRAPHIC MEASURES
Table of Contents
Figure 44 Subscribership Ratio Distributions by Income Deciles as of December 31, 2016 .. 49
Figure 45 Subscribership Ratio Distributions by Density Deciles as of December 31, 2016 .. 50
Figure 46 Subscribership Ratio Distributions by Share of Population with a College Degree
(in Deciles) as of December 31, 2016 ..................................................................... 51
Figure 47 Subscribership Ratio Distributions by Average Age of County Population
(in Deciles) as of December 31, 2016 ..................................................................... 52
Figure 48 Subscribership Ratio Distributions by Share of White Alone (in Deciles) as of
December 31, 2016 .................................................................................................. 53
Figure 49 Subscribership Ratios by Technology and Tract Household Density as of
December 31, 2016 .................................................................................................. 54
Figure 50 Average Subscribership Ratios by Income and Household Density as of
December 31, 2016 .................................................................................................. 55
48
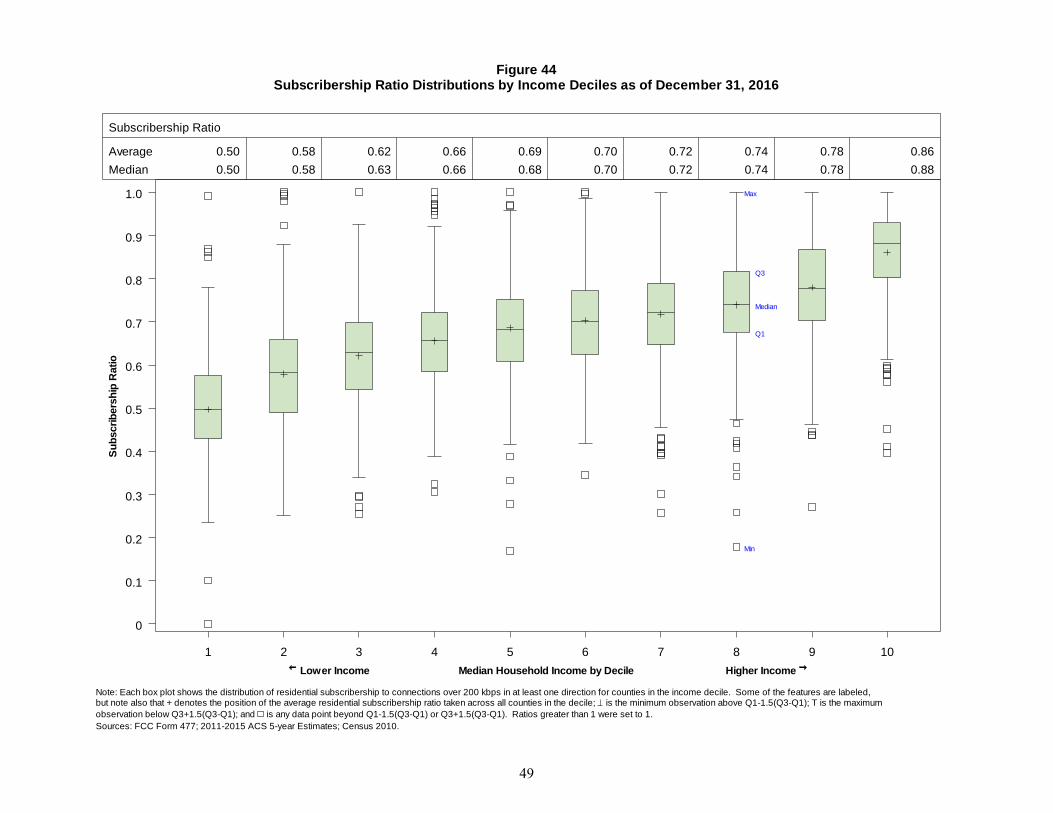
Max
Q1
Q3
Median
Min
Figure 44Subscribership Ratio Distributions by Income Deciles as of December 31, 2016
Sources: FCC Form 477; 2011-2015 ACS 5-year Estimates; Census 2010.
observation below Q3+1.5(Q3-Q1); and is any data point beyond Q1-1.5(Q3-Q1) or Q3+1.5(Q3-Q1). Ratios greater than 1 were set to 1.
but note also that + denotes the position of the average residential subscribership ratio taken across all counties in the decile; is the minimum observation above Q1-1.5(Q3-Q1); T is the maximumNote: Each box plot shows the distribution of residential subscribership to connections over 200 kbps in at least one direction for counties in the income decile. Some of the features are labeled,
1 2 3 4 5 6 7 8 9 10
0
0.1
0.2
0.3
0.4
0.5
0.6
0.7
0.8
0.9
1.0
Su
bscri
bers
hip
Ratio
Lower Income Median Household Income by Decile Higher Income
Subscribership Ratio
Average 0.50
Median 0.50
0.58
0.58
0.62
0.63
0.66
0.66
0.69
0.68
0.70
0.70
0.72
0.72
0.74
0.74
0.78
0.78
0.86
0.88
49
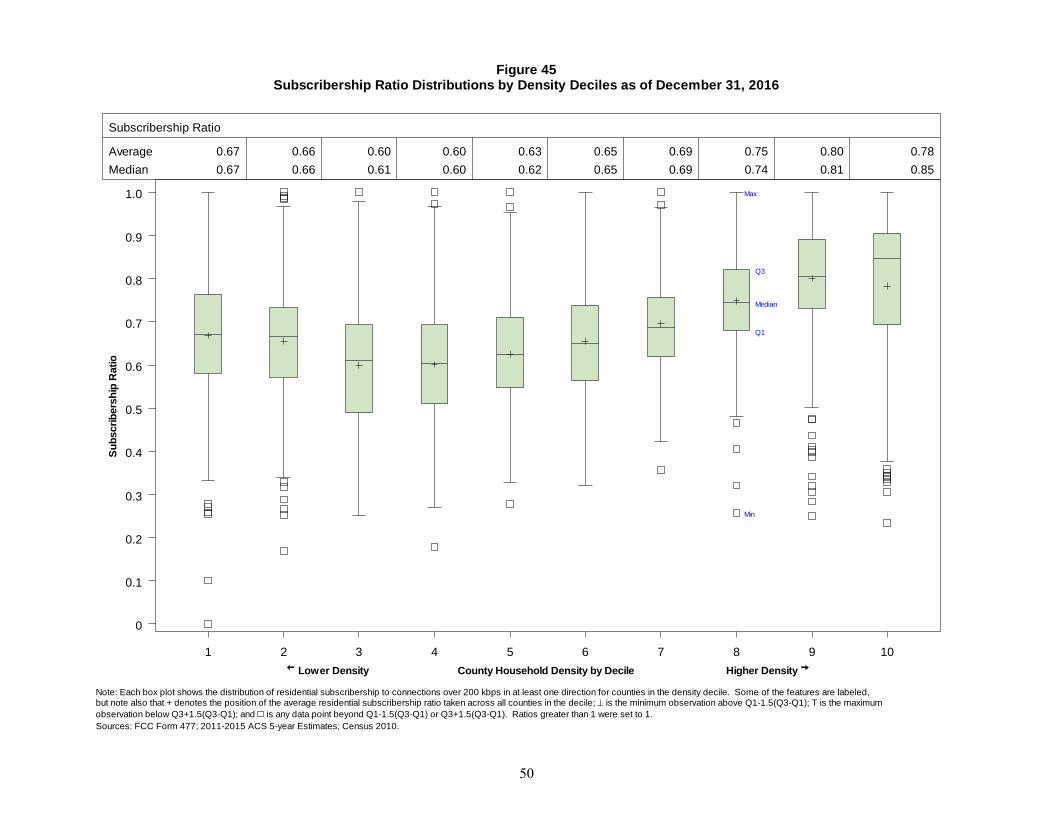
Max
Q1
Q3
Median
Min
Figure 45Subscribership Ratio Distributions by Density Deciles as of December 31, 2016
Sources: FCC Form 477; 2011-2015 ACS 5-year Estimates; Census 2010.
observation below Q3+1.5(Q3-Q1); and is any data point beyond Q1-1.5(Q3-Q1) or Q3+1.5(Q3-Q1). Ratios greater than 1 were set to 1.
but note also that + denotes the position of the average residential subscribership ratio taken across all counties in the decile; is the minimum observation above Q1-1.5(Q3-Q1); T is the maximumNote: Each box plot shows the distribution of residential subscribership to connections over 200 kbps in at least one direction for counties in the density decile. Some of the features are labeled,
1 2 3 4 5 6 7 8 9 10
0
0.1
0.2
0.3
0.4
0.5
0.6
0.7
0.8
0.9
1.0
Su
bscri
bers
hip
Ratio
Lower Density County Household Density by Decile Higher Density
Subscribership Ratio
Average 0.67
Median 0.67
0.66
0.66
0.60
0.61
0.60
0.60
0.63
0.62
0.65
0.65
0.69
0.69
0.75
0.74
0.80
0.81
0.78
0.85
50
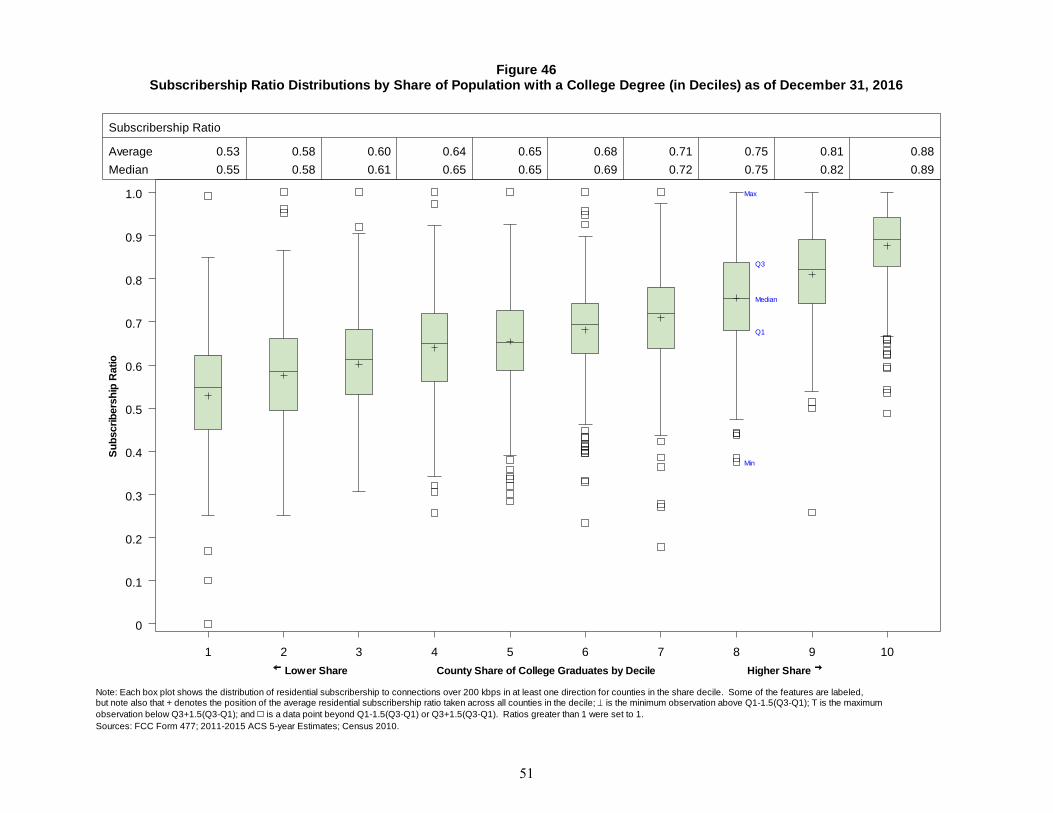
Max
Q1
Q3
Median
Min
Figure 46Subscribership Ratio Distributions by Share of Population with a College Degree (in Deciles) as of December 31, 2016
Sources: FCC Form 477; 2011-2015 ACS 5-year Estimates; Census 2010.
observation below Q3+1.5(Q3-Q1); and is a data point beyond Q1-1.5(Q3-Q1) or Q3+1.5(Q3-Q1). Ratios greater than 1 were set to 1.
but note also that + denotes the position of the average residential subscribership ratio taken across all counties in the decile; is the minimum observation above Q1-1.5(Q3-Q1); T is the maximumNote: Each box plot shows the distribution of residential subscribership to connections over 200 kbps in at least one direction for counties in the share decile. Some of the features are labeled,
1 2 3 4 5 6 7 8 9 10
0
0.1
0.2
0.3
0.4
0.5
0.6
0.7
0.8
0.9
1.0
Su
bscri
bers
hip
Ratio
Lower Share County Share of College Graduates by Decile Higher Share
Subscribership Ratio
Average 0.53
Median 0.55
0.58
0.58
0.60
0.61
0.64
0.65
0.65
0.65
0.68
0.69
0.71
0.72
0.75
0.75
0.81
0.82
0.88
0.89
51
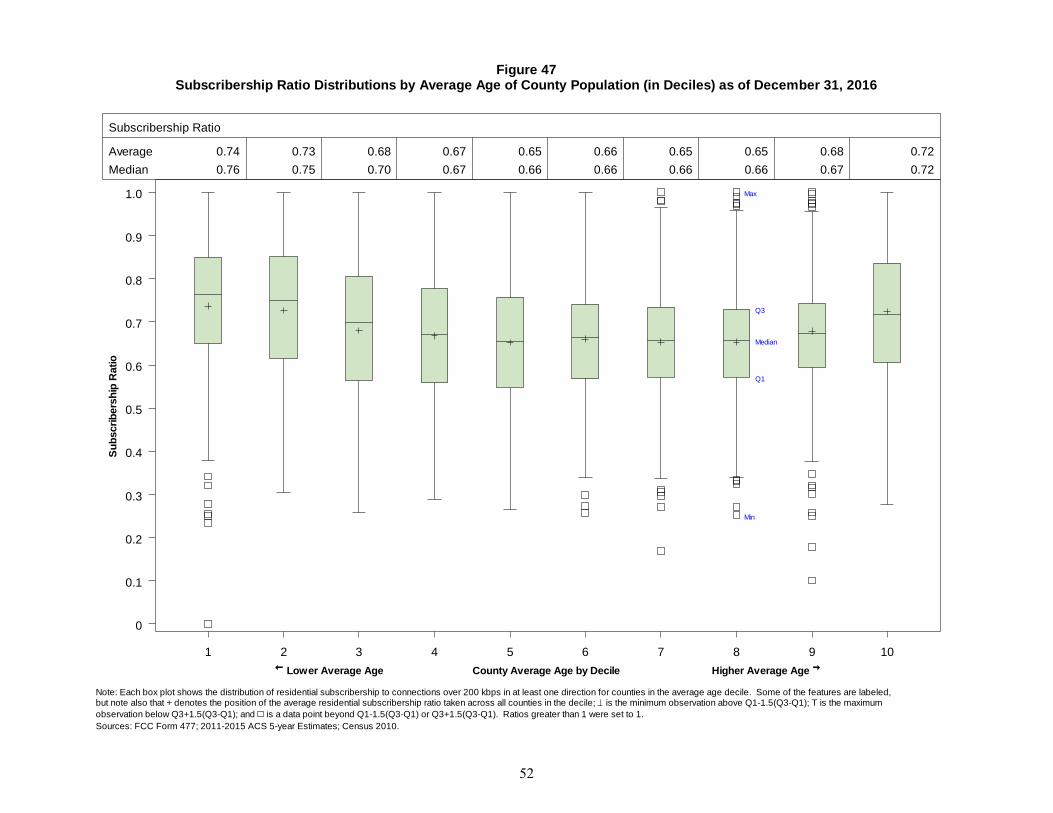
Max
Q1
Q3
Median
Min
Figure 47Subscribership Ratio Distributions by Average Age of County Population (in Deciles) as of December 31, 2016
Sources: FCC Form 477; 2011-2015 ACS 5-year Estimates; Census 2010.
observation below Q3+1.5(Q3-Q1); and is a data point beyond Q1-1.5(Q3-Q1) or Q3+1.5(Q3-Q1). Ratios greater than 1 were set to 1.
but note also that + denotes the position of the average residential subscribership ratio taken across all counties in the decile; is the minimum observation above Q1-1.5(Q3-Q1); T is the maximumNote: Each box plot shows the distribution of residential subscribership to connections over 200 kbps in at least one direction for counties in the average age decile. Some of the features are labeled,
1 2 3 4 5 6 7 8 9 10
0
0.1
0.2
0.3
0.4
0.5
0.6
0.7
0.8
0.9
1.0
Su
bscri
bers
hip
Ratio
Lower Average Age County Average Age by Decile Higher Average Age
Subscribership Ratio
Average 0.74
Median 0.76
0.73
0.75
0.68
0.70
0.67
0.67
0.65
0.66
0.66
0.66
0.65
0.66
0.65
0.66
0.68
0.67
0.72
0.72
52
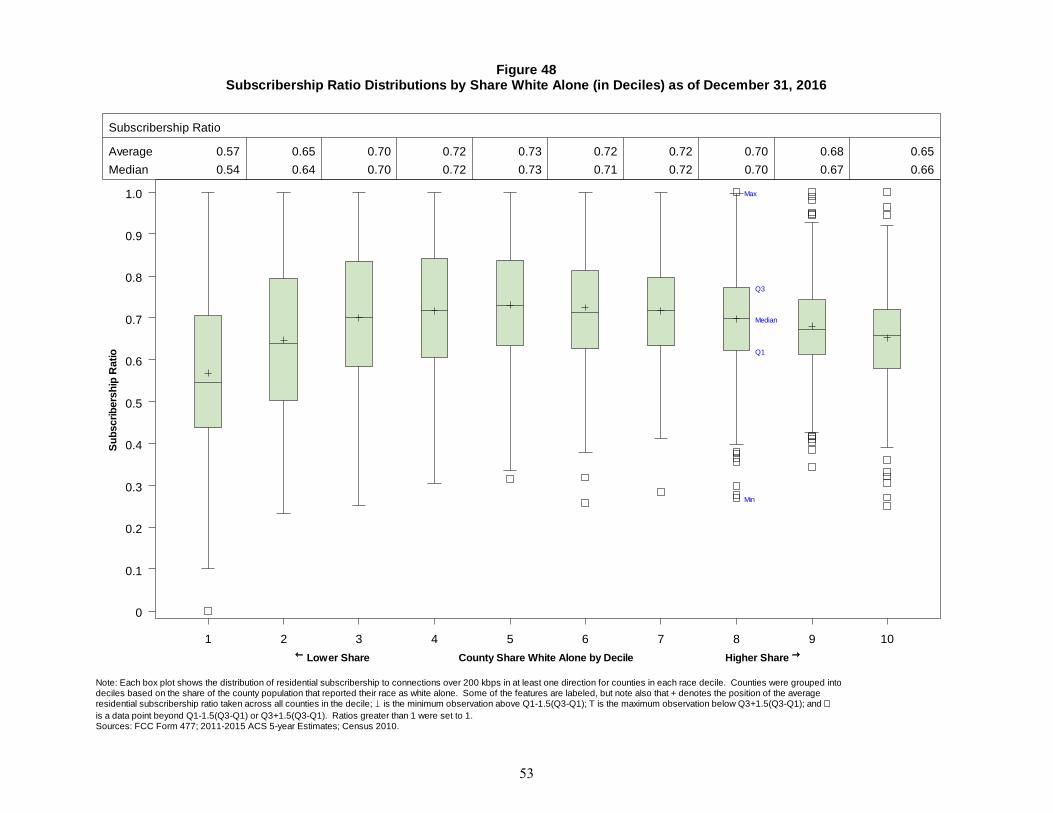
Max
Q1
Q3
Median
Min
Figure 48Subscribership Ratio Distributions by Share White Alone (in Deciles) as of December 31, 2016
Sources: FCC Form 477; 2011-2015 ACS 5-year Estimates; Census 2010.is a data point beyond Q1-1.5(Q3-Q1) or Q3+1.5(Q3-Q1). Ratios greater than 1 were set to 1.
residential subscribership ratio taken across all counties in the decile; is the minimum observation above Q1-1.5(Q3-Q1); T is the maximum observation below Q3+1.5(Q3-Q1); and deciles based on the share of the county population that reported their race as white alone. Some of the features are labeled, but note also that + denotes the position of the averageNote: Each box plot shows the distribution of residential subscribership to connections over 200 kbps in at least one direction for counties in each race decile. Counties were grouped into
1 2 3 4 5 6 7 8 9 10
0
0.1
0.2
0.3
0.4
0.5
0.6
0.7
0.8
0.9
1.0
Su
bscri
bers
hip
Ratio
Lower Share County Share White Alone by Decile Higher Share
Subscribership Ratio
Average 0.57
Median 0.54
0.65
0.64
0.70
0.70
0.72
0.72
0.73
0.73
0.72
0.71
0.72
0.72
0.70
0.70
0.68
0.67
0.65
0.66
53
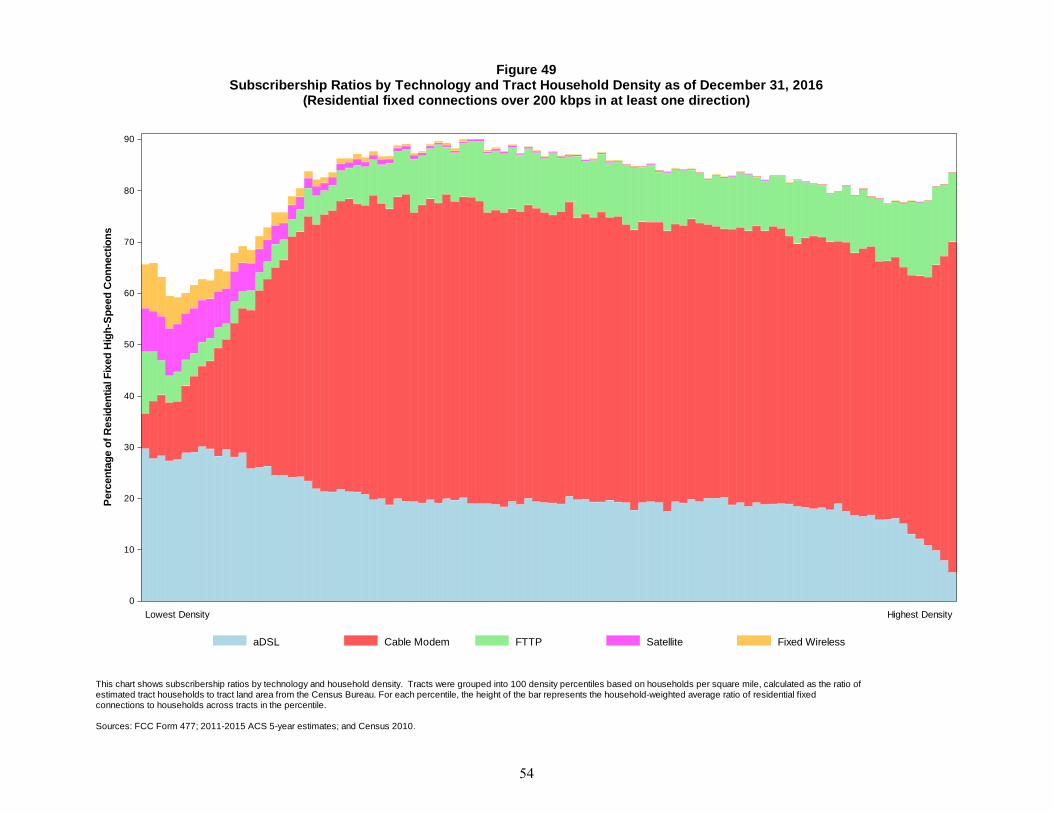
Lowest Density Highest Density
Figure 49Subscribership Ratios by Technology and Tract Household Density as of December 31, 2016
(Residential fixed connections over 200 kbps in at least one direction)
Sources: FCC Form 477; 2011-2015 ACS 5-year estimates; and Census 2010.
connections to households across tracts in the percentile.estimated tract households to tract land area from the Census Bureau. For each percentile, the height of the bar represents the household-weighted average ratio of residential fixedThis chart shows subscribership ratios by technology and household density. Tracts were grouped into 100 density percentiles based on households per square mile, calculated as the ratio of
aDSL Cable Modem FTTP Satellite Fixed Wireless
Perc
en
tag
e o
f R
esid
en
tial F
ixed
Hig
h-S
peed
Co
nn
ectio
ns
0
10
20
30
40
50
60
70
80
90
54
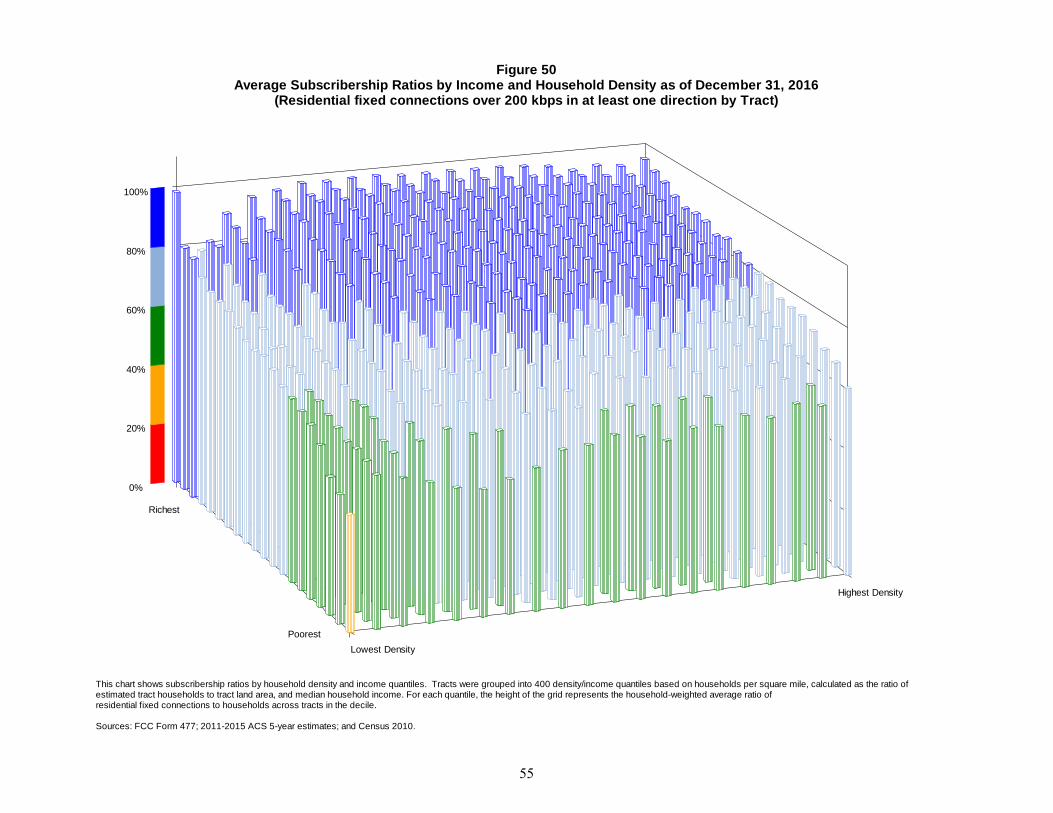
Richest
Poorest
Lowest Density
Highest Density
0%
20%
40%
60%
80%
100%
Figure 50Average Subscribership Ratios by Income and Household Density as of December 31, 2016
(Residential fixed connections over 200 kbps in at least one direction by Tract)
Sources: FCC Form 477; 2011-2015 ACS 5-year estimates; and Census 2010.
residential fixed connections to households across tracts in the decile.estimated tract households to tract land area, and median household income. For each quantile, the height of the grid represents the household-weighted average ratio ofThis chart shows subscribership ratios by household density and income quantiles. Tracts were grouped into 400 density/income quantiles based on households per square mile, calculated as the ratio of
55
Technical Notes
General
The information presented in this report is based on data from FCC Form 477. Through Form 477,
facilities-based broadband providers submit information to the FCC about where they offer and have
subscribers to Internet access services over 200 kilobits per second (kbps) in at least one direction. In
June 2013, the Commission adopted several changes to Form 477.1 Detailed information about those
changes and about the Form 477 reporting requirements in general is available at www.fcc.gov/form477.
Due to technical difficulties in 2014 with the redesigned Form 477 filing interface, the filing deadline for
Form 477 data as of June 30, 2014 was moved to December 11, 2014. Because of that delay, the
Commission staff were not able to perform their typical process of identifying anomalies or errors in the
data, following up with filers, and requesting updates to the data where appropriate – a process which
usually generates a significant number of corrections and hence a more accurate Form 477 data set.
Form 477 collects information about Internet access connections in service to end-user locations that are
advertised to deliver information to and/or from the end user – that is, in at least one direction – at transfer
rates (speeds) above 200 kilobits per second (kbps). Information is collected about the number of
connections by the advertised speeds associated with each product subscribed to in the relevant
geographic area, census tracts for fixed and states for mobile. Fixed providers report connections by the
maximum advertised upload and download speeds, while mobile providers report connections by
minimum advertised upload and download speeds. Fixed connections are further categorized by the
technology employed by the part of the connection that terminates at the end-user location. Wherever a
number of providers is cited in this report, multiple Form 477 filers within a holding company structure
count as one provider.
“End users” are residential, business, institutional, or government entities who use services for their own
purposes and who do not resell such services to other entities. Facilities-based providers report
information about connections they provide directly to their own end-user customers and also connections
that they provide to Internet Service Providers for resale to end users. For Form 477 purposes, the
facilities-based provider of a connection is the entity that owns the portion of the physical facility that
terminates at the end-user location, obtains an unbundled network element (UNE), special access line, or
other leased facility that terminates at the end-user location and provisions/equips it as a connection that
transfers information at rates over 200 kbps in at least one direction, or provisions/equips a wireless
channel that transfers information at rates over 200 kbps in at least one direction to the end-user location
over licensed spectrum or over spectrum that the provider uses on an unlicensed basis.
The mutually exclusive Form 477 technology categories are: asymmetric Digital Subscriber Line (aDSL
in this report), symmetric Digital Subscriber Line (sDSL), other copper wireline, cable modem, optical
carrier / fiber to the end user, satellite, terrestrial fixed wireless (using licensed or unlicensed spectrum),
mobile wireless, and all other (which is included to capture deployment of additional technologies over
time). In the Form 477 data collection, aDSL-based services delivered over fiber-to-the-node architecture
are reported in the aDSL category. The other wireline category comprises T1/DS1, T3/DS3, and other
copper-based connections, not elsewhere categorized, that deliver Internet access service at the end-user
1 Modernizing the FCC Form 477 Data Program, WC Docket No. 11-10, Report and Order, 28 FCC Rcd 9887
(2013). See also High-Speed Services for Internet Access: Status as of December 31, 2014 (March 2016) at 1-2,
available at https://www.fcc.gov/reports-research/reports/internet-access-services-reports/internet-access-services-
reports.
56
location. Ethernet connections delivering Internet access service are reported in the other wireline
category if the connection terminates over copper and in the FTTP category if the connection terminates
over fiber. Connections deployed over hybrid fiber-coax (HFC) architecture are reported in the cable
modem category. Wireless ISPs (WISPs) report in the fixed wireless category if providing service to
dispersed, fixed end-user locations and report in the mobile wireless category if providing a commercial
service that can be received at any location within a service footprint. Wireless local area networks (such
as Wi-Fi hotspots) that only enable local distribution and sharing of a premises connection are not
included, although the shared premises connection is included.
Numbers of connections presented in this report are not adjusted for the number of persons at a single
end-user location who have access to, or who use, the Internet access services delivered over the
connection to that location.
Numbers of residential connections are estimated based on the total connections and percentage-
residential connections information reported on Form 477.
Census tracts
Since the collection of data as of December 31, 2008, facilities-based providers of reportable fixed-
location Internet access connections have been reporting connection counts at the census tract level of
detail. Facilities-based mobile wireless providers report connection counts by state rather than census
tract.
The census tract-level data summarized in this report were collected for tracts in the 2010 decennial
census. For the purposes of this report, there are 73,767 census tracts because we exclude census tracts
delineated specifically to cover large bodies of water.
About 110 of the census tracts have population but no households because the population resides in group
living quarters. For the purpose of estimating residential subscribership rates by census tract, we assume
these census tracts have no reportable residential Internet access service because persons residing in
group quarters would have Internet access over a business connection provided to the operator of the
group quarters. Therefore, these census tracts are included in the “zero” column.
Ratios of residential fixed-location connections to households that exceed 100%
We estimate the share of households with fixed-location connections in individual census tracts by taking
the ratio of the reported number of fixed-location residential service connections to the estimated number
of households. We continue to find “outlier” estimates at or above 100% and to find that the number of
outliers is substantially reduced when estimates are made for individual counties rather than for individual
census tracts.
Possible explanations of ratios at or above 100% include (1) geocoding misallocations of service locations
to census tracts; (2) proper allocation of connections to the county level by some filers, but improper
allocation of all connections to a single tract in the county; (3) possible overestimation of residential
connections in service plans for which the customer base is primarily residential; and (4) connections at
seasonally or occasionally occupied housing units, such as vacation homes, while the household is
counted elsewhere. The numbers of households in census tracts that were used to generate the estimated
ratios are themselves estimates (from Census 2011-2015 ACS 5-year estimates), which could have an
independent effect.
57

Maps showing residential subscribership rates by census tract
The two maps based on estimated Internet access connections over 200 kbps in at least one direction per
1,000 households (that is, estimated household subscribership rates) exclude all connections identified as
business connections and necessarily exclude residential mobile wireless connections (which are reported
for the state but not for individual census tracts).
58
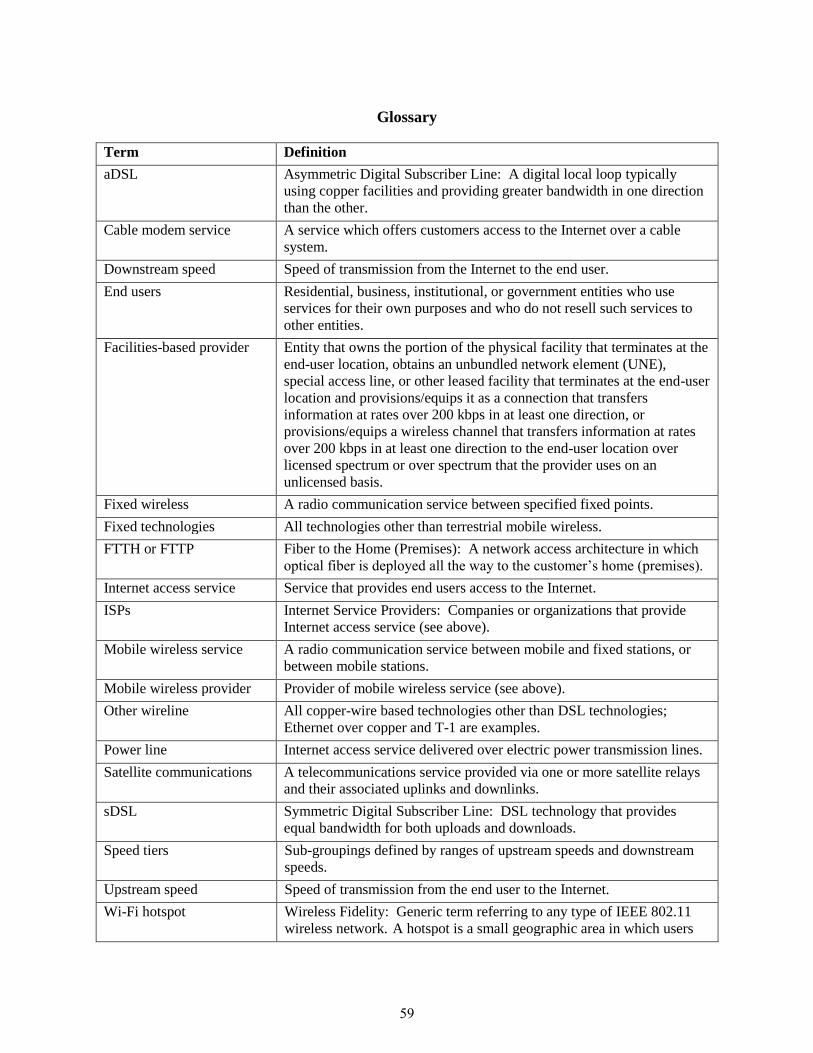
Glossary
Term Definition
aDSL Asymmetric Digital Subscriber Line: A digital local loop typically
using copper facilities and providing greater bandwidth in one direction
than the other.
Cable modem service A service which offers customers access to the Internet over a cable
system.
Downstream speed Speed of transmission from the Internet to the end user.
End users Residential, business, institutional, or government entities who use
services for their own purposes and who do not resell such services to
other entities.
Facilities-based provider Entity that owns the portion of the physical facility that terminates at the
end-user location, obtains an unbundled network element (UNE),
special access line, or other leased facility that terminates at the end-user
location and provisions/equips it as a connection that transfers
information at rates over 200 kbps in at least one direction, or
provisions/equips a wireless channel that transfers information at rates
over 200 kbps in at least one direction to the end-user location over
licensed spectrum or over spectrum that the provider uses on an
unlicensed basis.
Fixed wireless A radio communication service between specified fixed points.
Fixed technologies All technologies other than terrestrial mobile wireless.
FTTH or FTTP Fiber to the Home (Premises): A network access architecture in which
optical fiber is deployed all the way to the customer’s home (premises).
Internet access service Service that provides end users access to the Internet.
ISPs Internet Service Providers: Companies or organizations that provide
Internet access service (see above).
Mobile wireless service A radio communication service between mobile and fixed stations, or
between mobile stations.
Mobile wireless provider Provider of mobile wireless service (see above).
Other wireline All copper-wire based technologies other than DSL technologies;
Ethernet over copper and T-1 are examples.
Power line Internet access service delivered over electric power transmission lines.
Satellite communications A telecommunications service provided via one or more satellite relays
and their associated uplinks and downlinks.
sDSL Symmetric Digital Subscriber Line: DSL technology that provides
equal bandwidth for both uploads and downloads.
Speed tiers Sub-groupings defined by ranges of upstream speeds and downstream
speeds.
Upstream speed Speed of transmission from the end user to the Internet.
Wi-Fi hotspot Wireless Fidelity: Generic term referring to any type of IEEE 802.11
wireless network. A hotspot is a small geographic area in which users
59
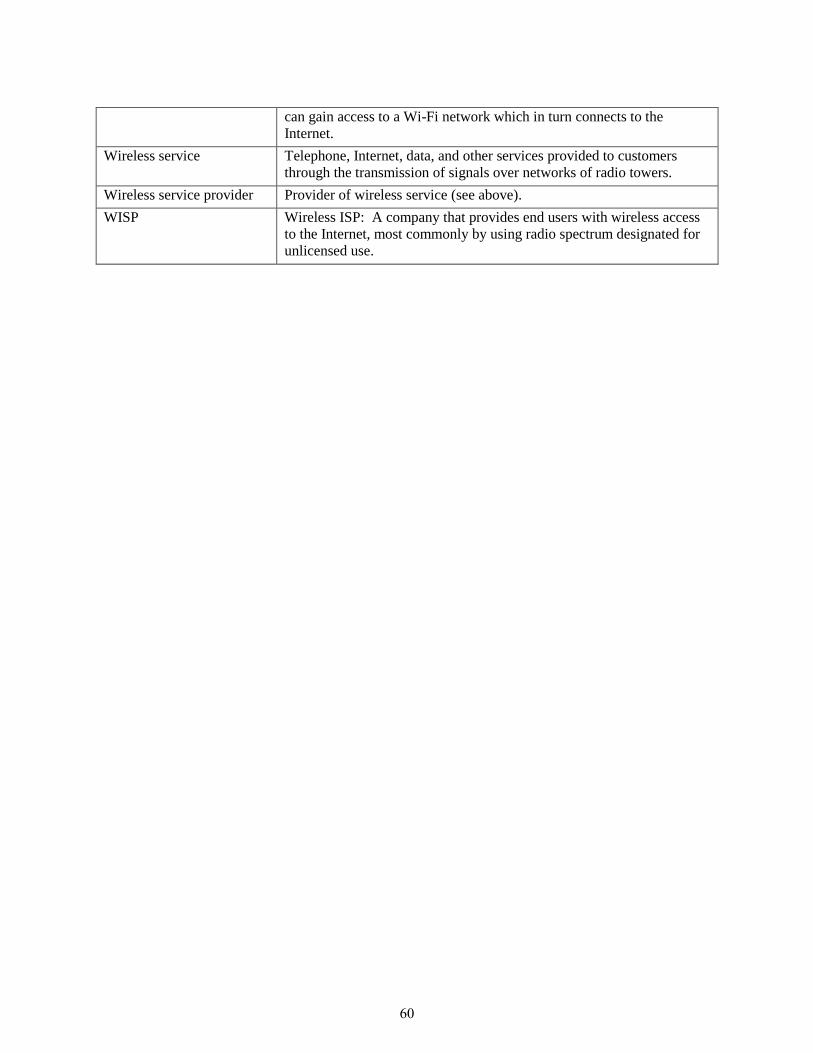
can gain access to a Wi-Fi network which in turn connects to the
Internet.
Wireless service Telephone, Internet, data, and other services provided to customers
through the transmission of signals over networks of radio towers.
Wireless service provider Provider of wireless service (see above).
WISP Wireless ISP: A company that provides end users with wireless access
to the Internet, most commonly by using radio spectrum designated for
unlicensed use.
60
Customer Response
Publication: Internet Access Services: Status as of December 31, 2016
You can help us provide the best possible information to the public by completing this form and returning it
to the Industry Analysis and Technology Division of the FCC's Wireline Competition Bureau.
1. Please check the category that best describes you:
____ press
____ current telecommunications carrier
____ potential telecommunications carrier
____ business customer evaluating vendors/service options
____ consultant, law firm, lobbyist
____ other business customer
____ academic/student
____ residential customer
____ FCC employee
____ other federal government employee
____ state or local government employee
____ Other (please specify)
2. Please rate the report: Excellent Good Satisfactory Poor No opinion
Data accuracy (_) (_) (_) (_) (_)
Data presentation (_) (_) (_) (_) (_)
Timeliness of data (_) (_) (_) (_) (_)
Completeness of data (_) (_) (_) (_) (_)
Text clarity (_) (_) (_) (_) (_)
Completeness of text (_) (_) (_) (_) (_)
3. Overall, how do you Excellent Good Satisfactory Poor No opinion
rate this report? (_) (_) (_) (_) (_)
4. How can this report be improved?
5. May we contact you to discuss possible improvements?
Name:
Telephone #:
To discuss the information in this report, contact: 202-418-0940
or for users of TTY equipment, call 202-418-0484
Fax this response to 202-418-0520 or Mail this response to
FCC/WCB/IATD, Mail Stop 1600 F
Washington, DC 20554 Scan and email to [email protected]
61