
Internet 3.0 and Networking the Next Gen Cloud
14
John Marchetti | (212) 271-3808 | [email protected] Tore Svanberg | (415) 364-7461 | [email protected] Jeremy Kwan | (949) 252-5667 | [email protected] Scott Fessler | (212) 271-3863 | [email protected] James Berents | (212) 271-3831 | [email protected] Stifel Equity Trading Desk | (800) 424-8870 August 16, 2020 Communications Infrastructure and Applied Technologies INDUSTRY UPDATE Internet 3.0 and Networking the Next Gen Cloud Summary The Stifel Internet 3.0 and Networking the Next Gen Cloud explores the market that has emerged for networking equipment, semiconductors, and components in connecting data centers, both internally and externally. The report identifies and analyzes the technology and vendors that enable intraconnections and interconnections, and is a collaborative effort led by Stifel analysts John Marchetti and Tore Svanberg. Through our findings we discuss the market for several incumbent technologies such as 100GbE switching, PAM-4, purpose-built DCI Optical Transport systems, and pluggable coherent optics; as well as estimate the market impact of next-generation solutions such as 400GbE switching and 400ZR. Overall, the data center connectivity market is shaping up to be a major driver for networking vendor revenues globally, and places increased importance on high-speed systems and high-performance silicon that should help solve many of the bandwidth, connectivity, and cost constraints involved in enabling next-gen applications. Key Points . Table of Contents: 1. Data Center Networking Overview – Rise of the Cloud 2. Networking Inside the Data Center 3. Networking Outside the Data Center 4. 400ZR Opportunity (with a Note on 400ZR+) 5. Data Center Networking Vendor Matrix All relevant disclosures and certifications appear on pages 12 - 14 of this report. Stifel does and seeks to do business with companies covered in its research reports. As a result, investors should be aware that the firm may have a conflict of interest that could affect the objectivity of this report. Investors should consider this report as only a single factor in making their investment decision.
Transcript of Internet 3.0 and Networking the Next Gen Cloud

John Marchetti | (212) 271-3808 | [email protected] Svanberg | (415) 364-7461 | [email protected] Kwan | (949) 252-5667 | [email protected] Fessler | (212) 271-3863 | [email protected] Berents | (212) 271-3831 | [email protected] Equity Trading Desk | (800) 424-8870
August 16, 2020
Communications Infrastructure and AppliedTechnologies
INDUSTRY UPDATE
Internet 3.0 and Networking the Next Gen Cloud SummaryThe Stifel Internet 3.0 and Networking the Next Gen Cloud explores the market that has emerged for networking equipment, semiconductors,and components in connecting data centers, both internally and externally. The report identifies and analyzes the technology and vendors thatenable intraconnections and interconnections, and is a collaborative effort led by Stifel analysts John Marchetti and Tore Svanberg. Throughour findings we discuss the market for several incumbent technologies such as 100GbE switching, PAM-4, purpose-built DCI Optical Transportsystems, and pluggable coherent optics; as well as estimate the market impact of next-generation solutions such as 400GbE switching and400ZR. Overall, the data center connectivity market is shaping up to be a major driver for networking vendor revenues globally, and placesincreased importance on high-speed systems and high-performance silicon that should help solve many of the bandwidth, connectivity, andcost constraints involved in enabling next-gen applications.
Key Points
.
Table of Contents:1. Data Center Networking Overview – Rise of the Cloud2. Networking Inside the Data Center3. Networking Outside the Data Center4. 400ZR Opportunity (with a Note on 400ZR+)5. Data Center Networking Vendor Matrix
All relevant disclosures and certifications appear on pages 12 - 14 of this report.
Stifel does and seeks to do business with companies covered in its research reports. As a result, investors should be aware thatthe firm may have a conflict of interest that could affect the objectivity of this report. Investors should consider this report asonly a single factor in making their investment decision.

Data Center Networking Overview – Rise of the Cloud
The increase in the internet-connected population, new data-intensive applications and technologies, mobile video demand, and the
growth of internet-based work (being further accelerated by COVID) have led to a rapid rise in global bandwidth demand. Managing all of
this traffic is a growing, and increasingly, interconnected ecosystem of global data centers. It is estimated that as of 1H20 there were over
12,500 data centers globally including 541 hyperscale data centers, predominately based in the United States.1 Global bandwidth growth
has consistently averaged ~30% annually, but as a result of data and workloads increasingly being pushed to the core and the need for
data duplication for safe storage, it is estimated that only 14% of traffic goes to the end user (North-South traffic) while the remaining 86%
remains within the data center network (East-West traffic).2
Exhibit 1: Hyperscale Data Centers by Geography, 2Q20
Source: Synergy Research Group
The combination of rapid global bandwidth growth and the increasing trend of offloading workloads from on premise to disaggregated
public data centers (the cloud) is requiring robust server expansion and upgrade cycles by leading cloud companies worldwide
(hyperscalers) in order to meet the increased demand. In order to manage all of this data, leading data center operators must frequently
upgrade their servers, which they do every 3 – 4 years depending on the operator, though both AWS and Azure have recently extended
the useful life of their server architecture to 4 years to capitalize on technological improvements and to reduce cost. Interconnecting these
server stacks are layers of switches (either proprietary or disaggregated “white box” switches) with networking capabilities powered by a
combination of high performance proprietary or open software and either proprietary or 3rd
party “merchant” silicon. In 2017, data center
operators began the server upgrade cycle from 10G to 25G, which necessitated the switching upgrade cycle from 40G to 100G. The next
major server upgrade cycle from 25G to 50G began in late 2019, and began to accelerate in 2020, setting the stage for the ramp of the
100G to 400G switching upgrade cycle in 2021.
Exhibit 2: Data Center Switching Architectures
Source: Arista Networks
1 Omdia: Global Data Center Analyzer 2020; Synergy Research: Hyperscale Data Center Count Reaches 541 in Mid-2020, Another 176 in the Pipeline
2 Cisco Global Cloud Index: Forecast and Methodology, 2015 – 2020
End of Row or “Spine”
Switching Layer
Top of Rack or “Leaf”
Switching Layer
Industry Update
August 16, 2020
2

Networking Inside the Data Center To meet bandwidth demand today, hyperscalers and large enterprise data center operators are still deploying 100G switches. 100G data
center switching is dominated by Arista (ANET) and Cisco (CSCO), who combined control ~45% of the $2.1 billion hyperscale market
and closer to 50% of the $5.3 billion 100G data center Ethernet switching market, which is inclusive of tier-2 cloud and large enterprise
data centers as well.3 Arista and Cisco compete versus other North American vendors such as Juniper (JNPR), as well as versus
“white box” vendors whose product is largely deployed by AWS (Amazon Web Services) and Google Cloud. Chinese switch vendors
such as Huawei and H3C primarily compete in the Chinese hyperscale market where foreign competition is limited.
Exhibit 3: Hyperscale Switching Market Share by Vendor
Source: IDC Datacenter Networks Qview, 2019Q4 Release
With bandwidth needs continuing to grow at a double-digit rate, hyperscalers and other large enterprise data center operators will need to
upgrade their switching capacity to new 400G switches. With a 4x capacity per-port increase, 400G will allow data center operators to
relieve bandwidth bottlenecks in their networks and continue to rapidly scale. The 400G upgrade cycle is dependent on upgraded server
infrastructure and ready supply of cost-effective 400G optics to interconnect the switches. Outside of a few early shipments, most
hyperscalers have not begun to adopt 400G switching as they are waiting for volume availability and favorable pricing of 400G optics.
Current expectations are for 400G optics to reach volume, and smaller form factor 400ZR pluggable optics to reach market late 2020 /
early 2021, setting the stage for the 400G switching upgrade cycle to begin in 2021. We expect the 400G switching market to be more
competitive than 100G as several additional vendors have launched, or are launching, 400G compared to 100G where Arista dominated
the early stages of the market. In addition to Arista, Cisco, and Juniper, other vendors with 400G offerings include Dell (DELL),
Mellanox (NVDA), and Nokia (NOK).
Exhibit 4: Ethernet Market Forecast by Speed
Source: Dell’Oro January 2020 – Long Term Ethernet Switch Forecast
3 IDC: Ethernet Switch Market Share 2019
“white box” vendors
Industry Update
August 16, 2020
3

Whereas 100G and below data center switches historically used Non-Return-to-Zero (NRZ) encoding in their switching silicon, 400G data
center switches today use Four-Level Pulse Amplitude Modulation (PAM-4) to increase their switching capacity. To understand the
problem that PAM-4 solves, we look at the limitations of the previous NRZ modulation scheme. With NRZ, data is transmitted by taking a
binary pattern (1’s and 0’s) and modulating the voltage (amplitude) at fixed levels, with the lower voltage representing a “0” and the higher
voltage representing a “1.” Data transmission speed (the number of 1’s and 0’s that can be transmitted in a given timeframe) is limited by
bandwidth, partly due to the physical limitations of the transmission media, such as copper. PAM-4 solves this challenge by modulating
the signal along four pulse levels (vs. the two levels in NRZ, 0 and 1), thus carrying double the bit-rate of NRZ at the same bandwidth
(Exhibit 5).
Exhibit 5: PAM-4 vs. NRZ Modulation Exhibit 6: PAM-4 Optical Module – Simplified Block Diagram
Source: ElectronicDesign Source: Stifel
PAM-4 based silicon is used inside the data center to power both the switching hardware and the optical interconnects. Switching
vendors either utilize proprietary silicon, such as Cisco now utilizing their Silicon One platform, or merchant silicon from leading switch
chip vendors such as Broadcom (AVGO), Barefoot Networks (now part of Intel (INTC)), and Marvell (MRVL). Having internal silicon as
a switch vendor may help the vendor be first to market with their next generation of switches, but adoption of higher speed switching
solutions will always be gated by complementary optics which typically have a longer development timeline. While internal silicon
capabilities will help the switching vendor address the increasing demand for a disaggregated offering by being able to sell switch, silicon,
and software individually, merchant suppliers have the advantage of amortizing increasingly large silicon development costs (including
deep submicron tapeouts) over a potentially larger number of customers and/or units than might be economical for “captive” (internal)
suppliers, especially for those with lower market shares. Other merchant silicon advantages include potentially faster-time-to-market, and
possibly better performance.
Optical networking silicon vendors have invested significant R&D resources into developing a PAM-4 digital signal processor (DSP) that
enables data transmission at high bandwidths. Of these companies, the three silicon vendors who have emerged as the leaders in the
PAM-4 silicon market are: (1) Inphi (IPHI) as the key technology leader and the only supplier shipping in volume today (at 200G), (2)
MaxLinear (MXL) as the current number two and new market entrant, in our view (including being first to ship a 400G PAM-4 DSP with
an integrated driver); and (3) Broadcom as the third vendor, as well as being a key player in the switching silicon market.
It should also be noted that while DSP-based PAM-4 solutions will likely comprise the vast majority of port shipments, several silicon
suppliers have also recently offered analog-based solutions as a lower-cost alternative for very short reach (<2km) applications. The
benefits of such a solution are substantial cost savings from eliminating an expensive and power-hungry DSP. However, this solution is
only feasible at very short distances before issues begin to significantly impact the integrity of the data being transmitted (low signal to
noise ratio). As a result, we expect the analog-based PAM-4 market to remain relatively small, especially initially as we expect
hyperscalers to prefer the high-performance solution. Nonetheless, Semtech Corporation (SMTC) and MACOM Technology Solutions
(MTSI) founded a Multi-Source Agreement (MSA) to help drive adoption of the analog sub-segment, with Maxim Integrated Products
(MXIM) also joining the effort.
Finally, while the DSP remains one of the most critical elements of a PAM-4 optical module, other key semiconductor components
include: (1) the clock and data recovery (CDR; the dark blue boxes in Exhibit 6); (2) the laser driver and (3) transimpedance amplifiers
(TIAs), all of which have a long history in the long-haul/metro telecom markets (see light blue blocks in Exhibit 6). In the case of CDRs
specifically, we would highlight that although these devices are typically found in long-haul and high performance metro networks, they
have been needed in data center applications. But as 100G optical transceivers began to proliferate inside the data centers, NRZ-based
CDRs (4x25G) became increasingly necessary, as well as cost-effective and power/space efficient. With 200G and 400G deployments
rapidly emerging, higher-speed CDRs will likewise see increasing usage. In fact, we note the analog-based PAM-4 solutions described
above are essentially very high performance CDRs with additional PAM-4 functionality built-in.
Industry Update
August 16, 2020
4

Networking Outside the Data Center
The global data center interconnect (DCI) market was worth $4.1 billion in 2019 and is expected to grow at a 6.4% CAGR to nearly $6
billion by 2025.4 Networking between data centers is almost entirely achieved through the optical transport network (OTN), though switch-
to-switch direct detect pluggable optics, such as Inphi’s 100G PAM-4 ColorZ used exclusively by Microsoft Azure, is a separate $60
million market; notably, however, Inphi’s 400ZR solution (ColorZ II) will not be exclusive to Microsoft. 100G PAM-4 DCI connections cover
short reach campus/intra-region distances of no more than 80km, with the vast majority of Microsoft’s PAM-4 ColorZ deployments at less
than 50km. As (Exhibit 7) appears to show, 0-40km appears to be the “sweet spot” for 100G PAM-4 DCI, with 60km the effective limit.
Exhibit 7: Microsoft PAM-4 DCI Distance Distribution (km)
Source: Journal of Optical Communications and Networking – Vol. 10, No. 10 / Oct. 2019
DCI is generally segmented by distance: subsea, long-haul, and metro. Subsea and long-haul links are typically point-to-point and span
several hundred to thousands of kilometers. Metro networks can be further broken down into metro access networks which are typically
point-to-point, intra-network connections spanning 2km to ~100km, and more complex metro regional networks that are typically point-to-
multi point (mesh), inter-network connections spanning 100km – 600km. Metro networks represent roughly 56% of the global DCI market.
The subsea segment, however, is expected to grow the fastest through 2025 at a 13.2% CAGR as data centers continue to be built
globally and deploy additional international interconnections to reduce latency (Exhibit 8).
Exhibit 8: Data Center Interconnect (DCI) by Distance
Source: Omdia – Global Data Center Interconnect Forecast: 2019 – 2025
The $4.1 billion OTN DCI equipment market represented roughly 25% of the total $16.2 billion OTN market in 2019. OTN DCI equipment
is currently dominated by Ciena (CIEN), particularly ex-China. Huawei is the second largest vendor globally, though primarily active in
China, while Infinera (INFN) is emerging as a key contender behind the top two. We forecast that Infinera will become the second
largest ex-China DCI share leader over time as we expect that recent struggles at Nokia are likely to continue and present additional
share gain opportunity for western vendors, particularly in the European market. Infinera, meanwhile, has been shipping 600G
equipment (powered by Acacia’s (ACIA) coherent DSP) and is set to launch their higher margin 800G product (in-house DSP) later this
4 Omdia: Global Data Center Interconnect & Purpose-Built DCI Forecast 2019 – 2025
$354 million $745 million (13.2% CAGR)
$2.3 billion $3.3 billion (6.3% CAGR)
$1.4 billion $1.9 billion (4.4% CAGR)
2019 2025
Industry Update
August 16, 2020
5

year. A successful 800G launch by Infinera would make them one of only three companies, along with Ciena and Huawei, with in-house
800G OTN capabilities. Furthermore, aversion to Huawei equipment as a result of global political frictions advantageously positions both
Ciena and Infinera to win additional share, especially in the European market, in our opinion (Exhibit 9).
Exhibit 9: Global Terrestrial OTN DCI Market Share 2019 EMEA Terrestrial OTN DCI Market Share 2019
Source: Omdia – Market Share Spreadsheet: 4Q19 and 2019 DCI
Note: Market share graphs do not include $354m subsea market where high capacity links (600G/800G) dominate
Just as intra-data center communications require 400G speeds to ensure optimal capacity as servers are upgraded and bandwidth
grows, in order to add the necessary capacity between the growing network of global data centers operators will be required to upgrade
their OTN DCI networks to 600G and 800G capacities. It is estimated that by 2024 the total OTN market (DCI + telco market) will
approach $18 billion with nearly 30% of total shipments at 800G, which means the potential TAM for 800G alone is larger than the entire
DCI market today.5 Upgrading to higher capacity 600G and 800G optical systems is especially important over long distance connections
where fiber is scarce, as it is very expensive to deploy additional long-haul and subsea fiber lines. Besides maximizing cost-per-bit with
higher speeds, the modulation format of coherent optical systems is also ideal for transmitting signals over disparate fiber lines of varying
quality, allowing operators to more fully utilize high fixed cost fiber deployments.
Whereas intra-data center connections primarily utilize PAM-4 modulation, DCI networks almost entirely use coherent DSP technology.
Coherent DSP’s have a more advanced modulation scheme versus PAM-4, allowing for optical signals to travel over longer distances
and with superior spectral efficiency. Coherent modulation alters the laser light’s amplitude, phase, and polarization through techniques
such as 8 and 16 quadrature amplitude modulation (QAM) as well as quadrature phase shift keying (QPSK), which improves the signal
spacing and allows for a higher optical signal to noise ratio (OSNR) over longer distances. Coherent platforms have additional features
such as variable baud rate (aka symbol rate) for tunable speeds.
The added modulation capabilities in the DSP and stricter laser requirements of coherent optics (need a narrow linewidth, tunable laser
for DWDM over long distances) are complex and the DSP requires more energy to operate, making coherent systems more expensive
versus intra-data center optical technologies. The more complex optics, higher capacities (400G, 600G, 800G), modular DSP capabilities,
and need for additional equipment to convert digital client side signals into an aggregated optical line side signal over a single DWDM
fiber output makes optical transport platforms expensive and comparatively large, though platform footprint has downsized in recent
years with the launch of purpose-built DCI equipment (aka “pizza boxes”) such as Ciena’s Waveserver and Infinera’s Groove family of
products. Purpose-built DCI products accounted for $1.4 billion, or 34%, of the global DCI market in 2019 but are expected to grow to $3
billion by 2025, a CAGR of nearly 14%.6 These systems are predominately deployed by hyperscalers in North America, where ICP’s have
a disproportionately large DCI share relative to other geographies, but will likely increasingly be deployed in other geographies. The
purpose-built DCI market is currently dominated by Ciena with ~41% share globally followed by Infinera with ~19% share.7
Over long distances and complex metro regional DCI networks, operators require the features of optical platforms. However, expensive
platform based optics can be inefficient over short, point-to-point DCI links that do not require maximum optical capacity and in areas
5 Dell’Oro Group: Optical Transport Five Year Forecast Report: 2020 – 2024
6 Omdia: Global Data Center Interconnect & Purpose-Built DCI Forecast Report 2019 – 2025
7 Omdia: Market Share Spreadsheet – 1Q20 ON Global
Industry Update
August 16, 2020
6
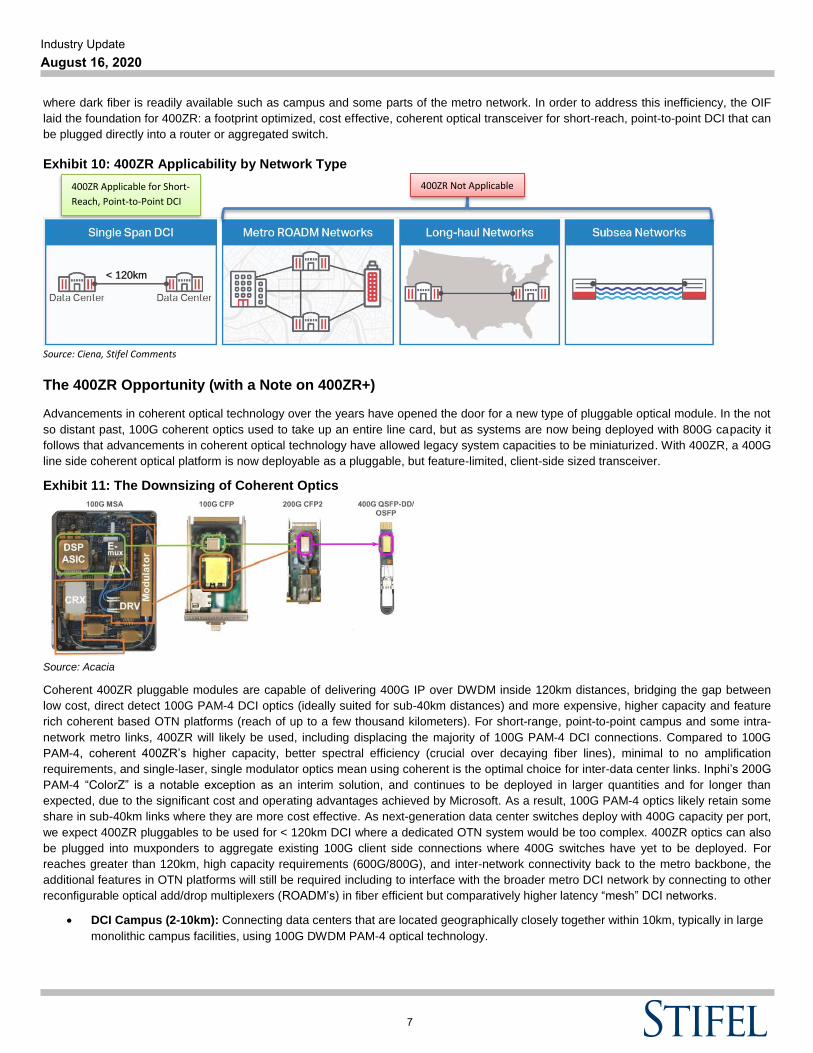
where dark fiber is readily available such as campus and some parts of the metro network. In order to address this inefficiency, the OIF
laid the foundation for 400ZR: a footprint optimized, cost effective, coherent optical transceiver for short-reach, point-to-point DCI that can
be plugged directly into a router or aggregated switch.
Exhibit 10: 400ZR Applicability by Network Type
Source: Ciena, Stifel Comments
The 400ZR Opportunity (with a Note on 400ZR+)
Advancements in coherent optical technology over the years have opened the door for a new type of pluggable optical module. In the not
so distant past, 100G coherent optics used to take up an entire line card, but as systems are now being deployed with 800G capacity it
follows that advancements in coherent optical technology have allowed legacy system capacities to be miniaturized. With 400ZR, a 400G
line side coherent optical platform is now deployable as a pluggable, but feature-limited, client-side sized transceiver.
Exhibit 11: The Downsizing of Coherent Optics
Source: Acacia
Coherent 400ZR pluggable modules are capable of delivering 400G IP over DWDM inside 120km distances, bridging the gap between
low cost, direct detect 100G PAM-4 DCI optics (ideally suited for sub-40km distances) and more expensive, higher capacity and feature
rich coherent based OTN platforms (reach of up to a few thousand kilometers). For short-range, point-to-point campus and some intra-
network metro links, 400ZR will likely be used, including displacing the majority of 100G PAM-4 DCI connections. Compared to 100G
PAM-4, coherent 400ZR’s higher capacity, better spectral efficiency (crucial over decaying fiber lines), minimal to no amplification
requirements, and single-laser, single modulator optics mean using coherent is the optimal choice for inter-data center links. Inphi’s 200G
PAM-4 “ColorZ” is a notable exception as an interim solution, and continues to be deployed in larger quantities and for longer than
expected, due to the significant cost and operating advantages achieved by Microsoft. As a result, 100G PAM-4 optics likely retain some
share in sub-40km links where they are more cost effective. As next-generation data center switches deploy with 400G capacity per port,
we expect 400ZR pluggables to be used for < 120km DCI where a dedicated OTN system would be too complex. 400ZR optics can also
be plugged into muxponders to aggregate existing 100G client side connections where 400G switches have yet to be deployed. For
reaches greater than 120km, high capacity requirements (600G/800G), and inter-network connectivity back to the metro backbone, the
additional features in OTN platforms will still be required including to interface with the broader metro DCI network by connecting to other
reconfigurable optical add/drop multiplexers (ROADM’s) in fiber efficient but comparatively higher latency “mesh” DCI networks.
DCI Campus (2-10km): Connecting data centers that are located geographically closely together within 10km, typically in large
monolithic campus facilities, using 100G DWDM PAM-4 optical technology.
400ZR Applicable for Short-
Reach, Point-to-Point DCI
400ZR Not Applicable
< 120km
Industry Update
August 16, 2020
7

DCI Edge (10-100km): Connecting multiple, regionally distant data centers within 80km/100km of each other, using high-
density, low-power, and low latency DWDM links, such as 100G DWDM PAM-4 (< 80km) and 400ZR coherent (up to 120km).
Exhibit 12: 400ZR Optical Module Plugging into a 400G Switch
Source: Arista Networks
Note: OSFP Line System (LS) Module provides amplification in a pluggable form-factor, OSFP-LS supplied by II-VI
Acacia, Ciena, Inphi, and others have plans to meaningfully participate in the 400ZR market. Following their acquisition of Elenion,
Nokia also expects to launch a 400ZR portfolio in 4Q20. Acacia, Inphi, Ciena and Nokia all offer or plan to offer both a merchant 400ZR
coherent DSP (7nm) and full solution DSP + photonic integrated circuit (PIC). Optical component suppliers such as II-VI (IIVI),
Lumentum (LITE) and NeoPhotonics (NPTN) will utilize the merchant 7nm coherent silicon from these providers with their in-house
Indium Phosphide (InP) based coherent PIC’s across the 400ZR lineup, which will run the gamut of CFP2-DCO, OSFP, and QSFP-DD
form factors. The coherent PIC has become even more critical in the pluggable 400ZR form factor in order to help compensate for the
lower power DSP. As an example of the full solution, Inphi’s 400ZR product, ColorZ II, builds upon their original ColorZ offering (100G
PAM-4) deployed by Microsoft and is designed to serve the “DCI Edge”. Utilizing silicon photonics and featuring a coherent PIC with an
integrated low power DSP and forward error correction (FEC), IPHI’s 400ZR ColorZ II puts 400G into a QSFP-DD form-factor pluggable
transceiver for < 120km links. In terms of performance, 400ZR ColorZ II DWDM transmission over DCI links at < 120km enables 14.4T of
capacity per rack, vs. 3.6T at < 80km in 100G PAM-4 ColorZ.
Keeping in mind, IPHI’s implementation of ColorZ II represents the second generation DCI connectivity technology, stemming from its
first generation 100G PAM-4 solution, known as ColorZ. Initially, ColorZ DWDM transmission provided DC hyperscalers, such as
Microsoft, with significant scale, based on a distributed network architecture (as shown in Exhibit 14), which connected multiple data
center campuses within a region, through regional network gateways, also known as RNGs. This offers several important advantages to
the hyperscaler: (1) the ability to scale quickly in smaller, more efficient increments based on near-term demand needs (vs. building out a
massive, but under-utilized facility especially in the early stages of service); (2) the ability to easily scale beyond a single campus by
simply connecting a new DC to an existing RNG; and (3) regional resiliency, given the geographic dispersion of network capacity over a
wider region, which would safeguard against a catastrophic failure at a single DC campus. Moreover, the direct plug-in design of Inphi’s
ColorZ solution further simplified both deployment and operational control of the systems, resulting in lower overall total cost of
ownership.
Industry Update
August 16, 2020
8

Exhibit 13: Microsoft’s Current Regional Architecture
Source: Journal of Optical Communications and Networking – Vol. 10, No. 10 / Oct. 2019, Stifel Comments
The 400ZR market opportunity in today’s DCI networks is therefore limited to the current 100G PAM-4 DCI market, plus additional short-
reach DCI opportunities that compete with some existing purpose-built, compact “pizza box” DCI platforms. Data provided by Microsoft
shows that 4% of their long-haul, or coherent, routes are under 200km (Exhibit 14). However, given that they are the predominant user
of 100G PAM-4 DCI, it is fair to assume that the average operator currently uses a larger percentage of coherent OTN systems for sub-
200km DCI. Assuming on average that sub-200km coherent links have a 12% share of the $4.1 billion global OTN DCI market would
result in a 400ZR market overlap of ~$490 million, plus the existing 100G PAM-4 DCI market of $45 million (or 75% of the total $60
million market that is over 10km, see Exhibit 7) results in a current 400ZR DCI TAM of no more than $535 million. A $500 million 400ZR
TAM estimate is in-line with what participants in the industry currently expect.
Exhibit 14: Microsoft Long-Haul Length Distribution (km)
Source: Journal of Optical Communications and Networking – Vol. 10, No. 10 / Oct. 2019
The longer term market for 400ZR, however, is not limited to the current DCI market as the small footprint, low cost and particularly low
latency features of 400ZR should prove advantageous in connecting the burgeoning industry of edge data centers, particularly as latency
sensitive 5G applications ramp. The principles of 400ZR should also help coherent optics capture additional share in MSO’s access
networks which require low cost, point-to-point links and are dominated today by low cost but low speed direct detect solutions.
Expanding beyond the relatively limited existing DCI opportunity will be key for 400ZR vendors to recoup their investments as the 400ZR
market looks to become commoditized. Additional opportunities likely lie in 400ZR+, a not yet standardized but catch all term generally
describing multi-speed (variable baud rate) and longer range versions of 400ZR.
A Note on 400ZR+
In fact, 400ZR+ could be used to describe an “extended reach” of 400ZR, up to 500km – 2000km, compared to the ~120km limit for
400ZR. With an expanded reach, 400ZR+ could potentially cover 92% of MSFTs’ long-haul, routes under 2000km (as shown in Exhibit
PAM4 400ZR Links (Footprint and Cost)
OTN Platform Links (Capacity and Reach)
Industry Update
August 16, 2020
9

14 above), compared to 4% coverage for 400ZR, underscoring the potential opportunity for 400ZR+ as a straightforward extension of the
current DCI use case for 400ZR. Furthermore, the same non-DCI use cases that could see 400ZR deployment over the longer term (e.g.,
5G and cable access described above), are even more applicable for 400ZR+ given the extended reach and multi-speed operation it
encompasses. Whereas 400ZR is designed to serve the “DCI Edge”, 400ZR+ will target the “DCI region” including metro and even
regional long haul applications. Indeed, the vast majority of metro regions in Europe and a significant number of those in the U.S., could
be potentially connected using 400ZR+ with the performance benefits afford by a coherent optical system but in a more cost-optimized
solution.
As an example of the potential market opportunity, we estimate the 400ZR/ZR+ SAM for DSPs could reach ~$400mn by 2023, with the
400ZR+ market comprising the large majority of that figure given the higher ASPs and longer reach of 400ZR+. From a unit shipment
perspective, we note Inphi has roughly forecasted demand to be at least an order of magnitude higher than its current ColorZ demand
(hundreds of thousands of units annually vs. tens of thousands of units for ColorZ). While Inphi was first to sample its 7nm “Canopus”
400G coherent DSP (November 2019), Acacia has also recently begun sampling its family of 400G pluggable optical modules based on
its 7nm “Greylock” coherent DSP (March 2020), both aimed at 400ZR/ZR+ applications. Importantly, we note these two companies are
the only merchant silicon suppliers with 400ZR DSPs in the market today (although Acacia is currently in the process of being acquired
by Cisco).
Exhibit 15: Data Center Networking Vendor Matrix
Data Center Networking Ticker Stifel Market Cap. C2021E C2021E C2021E C2021E High Speed Intra-DC Silicon Intra-DC Optics Inter-DC Inter-DC Silicon Inter-DC Optical 400ZR Silicon 400ZR
Vendor List ($ USD) Rating (Mil.) Rev (M)** Rev Growth EPS ** EPS Growth 100G+ Switching (Switch / PHY PAM4) (Datacom) Optical System (Coherent) Components (7nm Coherent) Optics
Arista ^ ANET HOLD $16,168 $2,575 13.5% $9.57 7.0% X
Dell EMC DELL NC $15,194 $91,802 1.8% $6.49 10.6% X
H3C* - - - - - - - X
Juniper JNPR SU $8,234 $4,542 3.2% $1.78 14.8% X X
Mellanox (Nvidia) NVDA SU $284,474 $16,978 18.1% $9.75 22.2% X X X
Innovium* - - - - - - - X
Marvell ^^ MRVL BUY $22,334 $3,260 11.2% $1.16 36.5% X
MaxLinear ^^ MXL BUY $1,889 $681 62.1% $1.52 192.3% X
Broadcom AVGO NC $131,844 $25,251 5.9% $24.38 11.2% X X
Intel INTC SU $207,929 $73,784 -1.8% $5.04 -0.2% X X
Applied Optoelectronics AAOI NC $302 $340 26.1% $0.13 NA X
Cambridge Industries Group 603083-SHG NC $936 $723 30.0% $0.14 75.0% X
Hisense Broadband* - - - - - - - X
Innolight* - - - - - - - X
Source Photonics* - - - - - - - X
Inphi ^^ IPHI BUY $5,922 $794 16.8% $3.67 11.6% X X X
MACOM ^^ MTSI HOLD $2,568 $596 6.6% $2.13 60.2% X X
Accelink 002281-SHE NC $3,074 $1,037 21.0% $0.12 33.3% X X
Molex* - - - - - - - X X
O-Net 877-HK NC $669 $451 24.7% $0.04 100.0% X X
Sumitomo Electric 5802-JP NC $9,755 $28,405 4.9% $0.79 54.9% X X
II-VI IIVI NC $4,794 $3,150 16.6% $2.97 8.8% X X X
Lumentum ^ LITE BUY $6,984 $1,969 15.1% $6.76 17.2% X X X
Cisco CSCO SU $179,448 $49,091 0.3% $3.18 0.6% X X X X
ZTE ZTCOY NC $2,153 $16,812 14.8% $0.21 23.5% X X
Huawei* - - - - - - - X X X
Nokia NOK NC $28,269 $27,379 3.4% $0.36 24.1% X X X X X
ADVA ADV-ETR NC $457 $700 5.5% $0.48 41.2% X
Ribbon-ECI RBBN NC $693 $900 9.2% $0.44 46.7% X
NEC 6701-JP NC $14,148 $28,631 0.9% $3.60 16.1% X X
Fujitsu FJTSY NC $27,738 $35,678 1.2% $8.06 9.5% X X X
Infinera ^ INFN BUY $1,497 $1,477 8.5% $0.22 NA X X
Ciena ^ CIEN BUY $9,179 $4,026 7.6% $3.30 8.7% X X X X
NEL (NTT Subsidiary) NTTYY NC $96,903 $110,939 0.7% $2.34 2.2% X X X
Acacia (Cisco) ACIA NC $2,857 $628 14.6% $2.42 1.7% X X X X
NeoPhotonics NPTN NC $408 $429 6.0% $0.55 1.9% X X
Source: Stifel, FactSet Research Systems, Prices and Estimates as of 8/14/20
* = Private company
** = Consensus estimate if stock not covered by Stifel
%FQL-E-ERROR, parse error, unexpected ID, expecting '=' or '(' or ';'
^^ = Covered by Tore Svanberg
X = Huawei silicon does not use coherent modulation
X = Nokia launched switching portfolio in July 2020 (Apple only customer so far)
ABC = Italicized symbols are ADR's
Intr
a-D
ata
Ce
nte
rIn
ter-
Dat
a C
en
ter
Mix
ed
Industry Update
August 16, 2020
10

Exhibit 16: Datacom and Telecom Optical Components Market Share, TTM 1Q20
Source: Omdia – Market Share Spreadsheet & Analysis: 1Q20 Optical Components
Note: Many telecom optical components are not used for DCI. Key telecom vendors with significant DCI exposure include:
o Lumentum, II-VI, NeoPhotonics, Acacia
Industry Update
August 16, 2020
11

Important Disclosures and CertificationsWe, John Marchetti and Tore Svanberg, certify that our respective views expressed in this research report accurately reflect ourrespective personal views about the subject securities or issuers; and we, John Marchetti and Tore Svanberg, certify that nopart of our compensation was, is, or will be directly or indirectly related to the specific recommendations or views containedin this research report. Our European Policy for Managing Research Conflicts of Interest is available at www.stifel.com/institutional/ImportantDisclosuresFor applicable current disclosures for all covered companies please visit the Research Page at www.stifel.com or write to the Stifel ResearchDepartment at the following address.US ResearchStifel Research DepartmentStifel, Nicolaus & Company, Inc.One South Street16th FloorBaltimore, MD 21202The equity research analyst(s) responsible for the preparation of this report receive(s) compensation based on various factors, includingStifel's overall revenue, which includes investment banking revenue.Our investment rating system is three tiered, defined as follows:
BUY -We expect a total return of greater than 10% over the next 12 months with total return equal to the percentage price change plusdividend yield.
HOLD -We expect a total return between -5% and 10% over the next 12 months with total return equal to the percentage price changeplus dividend yield.
SELL -We expect a total return below -5% over the next 12 months with total return equal to the percentage price change plus dividend yield.
Occasionally, we use the ancillary rating of SUSPENDED (SU) to indicate a long-term suspension in rating and/or target price, and/orcoverage due to applicable regulations or Stifel policies. Alternatively, SUSPENDED may indicate the analyst is unable to determine a"reasonable basis" for rating/target price or estimates due to lack of publicly available information or the inability to quantify the publiclyavailable information provided by the company and it is unknown when the outlook will be clarified. SUSPENDED may also be used whenan analyst has left the firm.
Of the securities we rate, 51% are rated Buy, 34% are rated Hold, 2% are rated Sell and 13% are rated Suspended.Within the last 12 months, Stifel or an affiliate has provided investment banking services for 20%, 6%, 0% and 7% of the companies whoseshares are rated Buy, Hold, Sell and Suspended, respectively.
Within the last 12 months, Stifel or an affiliate has provided material services for 37%, 19%, 38% and 15% of the companies whose sharesare rated Buy, Hold, Sell and Suspended, respectively.
Additional Disclosures
Please visit the Research Page at www.stifel.com for the current research disclosures and respective target price methodology applicableto the companies mentioned in this publication that are within Stifel's coverage universe. For a discussion of risks to target price includingbasis of valuation or methodology please see our stand-alone company reports and notes for all stocks.
The information contained herein has been prepared from sources believed to be reliable but is not guaranteed by us and is not a completesummary or statement of all available data, nor is it considered an offer to buy or sell any securities referred to herein. Opinions expressed aresubject to change without notice and do not take into account the particular investment objectives, financial situation or needs of individualinvestors. Employees of Stifel, or its affiliates may, at times, release written or oral commentary, technical analysis or trading strategiesthat differ from the opinions expressed within. Stifel or any of its affiliates may have positions in the securities mentioned and may makepurchases or sales of such securities from time to time in the open market or otherwise and may sell to or buy from customers such securitieson a principal basis; such transactions may be contrary to recommendations in this report. Past performance should not and cannot beviewed as an indicator of future performance.
As a multi-disciplined financial services firm, Stifel regularly seeks investment banking assignments and compensation from issuers forservices including, but not limited to, acting as an underwriter in an offering or financial advisor in a merger or acquisition, or serving as aplacement agent in private transactions.
Affiliate Disclosures
References to “Stifel” (collectively ”Stifel”) refer to SFC and other associated affiliated subsidiaries including (i) Stifel, Nicolaus & Company,Incorporated (“SNC”); (ii) Keefe, Bruyette & Woods, Incorporated (“KBWI’’), which are both U.S. broker-dealers registered with the UnitedStates Securities and Exchange Commission (“SEC”) and members of the Financial Industry National Regulatory Authority (“FINRA”),
Industry Update
August 16, 2020
12

respectively; (iii) Stifel Nicolaus Europe Limited (“SNEL”), which is authorised and regulated by the United Kingdom Financial ConductAuthority (“FCA”) (FRN 190412) and is a member of the London Stock Exchange and also trades under the name Keefe, Bruyette & WoodsEurope (“KBW Europe”); (iv) our MainFirst affiliates (collectively “MAINFIRST’’): MainFirst Bank AG, which is regulated by the GermanFederal Financial Services Authority (Bundesanstalt für Finanzdienstleistungsaufsicht; “BaFin”), MainFirst Schweiz AG, which is regulatedby the Eidgenössische Finanzmarktaufsicht (“FINMA”), and MainFirst Securities US Inc. which is a U.S. broker-dealer registered with theSEC and member of FINRA; and (v) Stifel Nicolaus Canada, Incorporated. (“Stifel Canada”), which is authorised and regulated by InvestmentIndustry Regulatory Organization of Canada (“IIROC”), and also trades under the names “Stifel GMP” and/or “Stifel First Energy”.
Registration of non-US Analysts: Any non-US research analyst employed by SNEL contributing to this report is not registered/qualifiedas a research analyst with FINRA and is not an associated person of the US broker-dealer and therefore may not be subject to FINRA Rule2241 restrictions on communications with a subject company, public appearances, and trading securities held by a research analyst account.
Global Research Notes: Stifel Global Research (Cross-Border Research) notes are intended for use only by Institutional or ProfessionalClients. Research analysts contributing content to these reports are subject to different regulatory requirements based on the jurisdiction inwhich they operate. Clients seeking additional information should contact the Stifel entity through which they conduct business.
MAINFIRST Sponsored research:
At MAINFIRST, analysts may produce issuer paid research ('sponsored research'). This research is produced by analysts in accordance withlocal regulatory requirements relating to such research. In certain jurisdictions, this issuer paid research may be deemed to be independentresearch albeit not produced to the same conflicts of interest standards required by all jurisdictions for independent research. Where researchhas been paid for by an issuer, this will be clearly labelled. Please see our European Policy for Managing Research Conflicts of Interestfor additional information.
Country Specific and Jurisdictional Disclosures
United States: Research produced and distributed by SNEL is distributed by SNEL to "Major US Institutional Investors" as defined in Rule15a-6 under the US Securities Exchange Act of 1934, as amended. SNC may also distribute research prepared by SNEL directly to USclients, including US clients that are not Major US Institutional Investors. In these instances, SNC accepts responsibility for the content.SNEL is a non-US broker-dealer and accordingly, any transaction by a US client in the securities discussed in the document must be effectedby SNC. US clients wishing to place an order should contact their SNC representative.
UK and European Economic Area (EEA): This report is distributed in the EEA by SNEL, which is authorized and regulated in the UnitedKingdom by the FCA. In these instances, SNEL accepts responsibility for the content. Research produced by SNEL is not intended for useby and should not be made available to non-professional clients.
The complete preceding 12-month recommendations history related to recommendation(s) in this research report is available at https://stifel2.bluematrix.com/sellside/MAR.action
Brunei: This document has not been delivered to, registered with or approved by the Brunei Darussalam Registrar of Companies, Registrarof International Business Companies, the Brunei Darussalam Ministry of Finance or the Autoriti Monetari Brunei Darussalam. This documentand the information contained within will not be registered with any relevant Brunei Authorities under the relevant securities laws of BruneiDarussalam. The interests in the document have not been and will not be offered, transferred, delivered or sold in or from any part of BruneiDarussalam. This document and the information contained within is strictly private and confidential and is being distributed to a limitednumber of accredited investors, expert investors and institutional investors under the Securities Markets Order, 2013 ("Relevant Persons")upon their request and confirmation that they fully understand that neither the document nor the information contained within have beenapproved or licensed by or registered with the Brunei Darussalam Registrar of Companies, Registrar of International Business Companies,the Brunei Darussalam Ministry of Finance, the Autoriti Monetari Brunei Darussalam or any other relevant governmental agencies withinBrunei Darussalam. This document and the information contained within must not be acted on or relied on by persons who are not RelevantPersons. Any investment or investment activity to which the document or information contained within is only available to, and will be engagedin only with Relevant Persons.
Canadian Distribution: Research produced by SNEL is distributed in Canada by SNC in reliance on the international dealer exemption.This material is intended for use only by professional or institutional investors. None of the investments or investment services mentioned ordescribed herein is available to other persons or to anyone in Canada who is not a "permitted client" as defined under applicable Canadiansecurities law.
Republic of South Africa: Research produced by SNEL is distributed by SNEL to "Clients" as defined in FSCA FAIS Notice 20 of 2018(the "FAIS Notice") issued by the Financial Services Conduct Authority. Research distributed by SNEL is pursuant to an exemption from thelicensing requirements under Section 7(1) of the Financial Advisory and Intermediary Services Act, 2002.
In jurisdictions where Stifel is not already licensed or registered to trade securities, transactions will only be affected in accordance withlocal securities legislation which will vary from jurisdiction to jurisdiction and may require that a transaction is carried out in accordancewith applicable exemptions from registration and licensing requirements. Non-US customers wishing to effect transactions should contact a
Industry Update
August 16, 2020
13

representative of the Stifel entity in their regional jurisdiction except where governing law permits otherwise. US customers wishing to effecttransactions should contact their US salesperson.
The recommendation contained in this report was produced at 16 August 2020 19:03EDT and disseminated at 16 August 2020 19:03EDT.Additional Information Is Available Upon Request
© 2020 Stifel. This report is produced for the use of Stifel customers and may not be reproduced, re-distributed or passed to any otherperson or published in whole or in part for any purpose without the prior consent of Stifel. Stifel, Nicolaus & Company, Incorporated, OneSouth Street, Baltimore, MD 21202.
Industry Update
August 16, 2020
14