Internationalisation of financial supervision The European ...
Upload
ai565ai565Category
view
50download
2description

Internationalisation of European SMEs
European CommissionEnterprise and Industry

Internationalisation of European SMEs
F ina l Report

EIM Business & Policy Research PO Box 7001, 2701 AA Zoetermeer, The Netherlands
This publication was financed under the Competitiveness and Innovation Framework Programme which aims to encourage the competitiveness of European enterprises. Published by Entrepreneurship Unit Directorate-General for Enterprise and Industry European Commission B-1049 Brussels [email protected] www.ec.europa.eu/enterprise/e_i/index_en.htm LEGAL NOTICE Neither the European Commission nor any person acting on its behalf may be held responsible for the use to which information contained in this publication may be put, nor for any errors which may appear despite careful preparation and checking. This publication does not necessarily reflect the view or the position of the European Commission. © European Union, 2010 Reproduction is authorised, provided the source is acknowledged, save where otherwise stated. For use/reproduction of third-party copyright material specified as such permission must be obtained from the copyright holder(s). Cover picture © Fotolia - Franck Boston

3
Contents
Executive Summary Internationalisation of European SMEs 5
1 Introduction 11
1.1 The objectives of the study 11 1.2 The SME survey 11 1.3 General characteristics of enterprises sampled 13 1.4 Structure of the report 14
2 Overview internationalisation of European SMEs 15
2.1 General picture 15 2.2 Details by country 23 2.3 Internationalisation by sector 26 2.4 Comparisons with USA and Japan 28
3 Partner countries of European SMEs 33
3.1 Exporting 33 3.2 Importing 35 3.3 Foreign direct investments 38 3.4 Technological cooperation with foreign enterprises 38 3.5 Subcontracting 39 3.6 Comparisons with USA and Japan 39
4 Relationship between international activities and other enterprises characteristics 41
4.1 Introduction 41 4.2 Size of country in terms of area and population 41 4.3 Distance to land borders 43 4.4 E-commerce 44 4.5 Entry modes of internationalisation 46 4.6 Link between internationalisation and innovation 47 4.7 Effect on performance of enterprise 54
5 Perceived barriers for internationalisation 57
5.1 Introduction 57 5.2 Internal barriers 58 5.3 External barriers 59 5.4 Comparisons with USA and Japan 62
6 Support programmes 63
6.1 Introduction 63 6.2 Use and perceived effect of existing support measures by SMEs 64
7 Conclusions and Policy Recommendations 69
7.1 Economic welfare gains from internationalisation 69 7.2 The role of public support for internationalisation 70 7.3 Policy recommendations and policy examples from Member States 71

4
Annexes
I Set up of the survey 77 II Overview of questionnaire and routing 89 III World regions distinguished 93 IV Probit regression explaining export and import 95 V Selected examples of policy measures 99 VI Literature and web sources 121

5
Executive Summary Internationalisation of European SMEs
A. Background
The results of the last two EU commissioned studies on internationalisation of SMEs: the 2003 Observatory of European SMEs study “Internationalisation of SMEs”1 and the Flash Eurobarometer 196 “Observatory of European SMEs” of 20072 seemed to portray substantially different pictures on the degree of internationali-sation of European SMEs. The goal of this study is to provide an updated and com-prehensive overview of the level of internationalisation of European SMEs and de-rive conclusions and recommendations from it. In this study internationalisation refers not only to exports but to all activities that put SMEs into a meaningful business relationship with a foreign partner: exports, imports, foreign direct in-vestment, international subcontracting and international technical co-operation. The data and conclusions of this study are based on a survey of 9,480 SMEs in 33 European countries during Spring 2009.
B. Key results of the Survey
B1. On the situation and drivers to internationalisation
A considerable number of European SMEs are engaged in international ac-tivit ies yet only a small percentage is involved in international isation be-yond the Internal Market.
The two most common modes of international isation are exports and im-ports:
25% of SMEs within the EU27 export, of which about 50% also go beyond the Internal Market (13%).
29% of SMEs within the EU27 import, again 50% import from countries outside the Internal Market (14%).
In addition: 7% of SMEs within the EU27 are involved in technological co-operation with a
foreign partner. 7% are a subcontractor to a foreign partner. 7% have foreign subcontractors 2% of SMEs are active in foreign direct investment.
There is a direct l ink between the level of international isation and size of the company
The larger the company, the more it tends to internationalise. This applies to any single mode of internationalisation. For exports 24% of micro, 38% of small and 53% of medium-sized SMEs are active, for imports the respective percentages are 28%, 39% and 55%.
1http://ec.europa.eu/enterprise/enterprise_policy/analysis/doc/smes_observatory_2003_report4_en.pdf
2 http://ec.europa.eu/public_opinion/flash/fl196_en.pdf

6
The smaller the country, the more its SMEs are international ised, but the SME’s proximity to a national border does not have much effect on its level of international isation
There is a negative correlation between the size of the SME's home country popu-lation and its level of international activity. Countries such as Estonia, Denmark, Sweden, the Czech Republic and Slovenia have a much higher percentage of ex-porters than the EU average of 25%. Germany, France and UK score below aver-age. SMEs located close to a border show much higher activity rates with their cross border regions but this is not followed by being more internationally active in gen-eral.
Trade, manufacturing, transport and communication and research are the most international ised sectors
This study analysed 26 separate sectors. The highest percentage of international-ised SMEs is found in wholesale trade, mining, manufacturing and sale of motor vehicles. Within services, the sector 'research' scores very highly. Sectors of activ-ity with the highest share of exporting SMEs are mining (58%), manufacturing (56%), wholesale trade (54%), research (54%), sales of motor vehicles (53%), renting (39%) and transport and communication (39%).
Exporting and importing activit ies increase in intensity by age of enter-prise
The percentages of SMEs that are exporting gradually increases from just over 15% for enterprises up to 4 years of age to nearly 30% for enterprises that have existed for 25 years or more.
Most often SMEs start international activit ies by importing
If SMEs are both importing and exporting, they start with import twice as often (39%) as starting with exports (18%). 42% started with imports and exports in the same year.
Not many of the international ly inactive SMEs are planning to start in-ternational activit ies in the foreseeable future
Few non-internationalised companies show any intention to start international op-erations. Only about 4% of all SMEs have concrete plans to start such activities.
Partner countries are mostly other EU countries. Except for imports from China, relations with BRIC countries are general ly underdeveloped
Whereas three quarters of all exporting SMEs are oriented towards markets in other EU Member States, emerging markets such as Brazil, Russia, India and China (BRIC) are only served by 7% to 10% of exporting SMEs. Only in transport and communication is this percentage much higher. Also for imports, most SMEs (86% of importers) focus on other EU Member States, but here also China is quite impor-tant (27%).

7
Companies involved in E-commerce are more internationally active
Having the possibility to sell products or services online is positively correlated with being active in export or import markets (also when controlled for other ef-fects such as size of firm). The conclusion would be that the Internet has made it easier for SMEs of all sizes to overcome some of the barriers to internationalisa-tion. In fact the relationship between certain barriers and the size of firm has weakened because of the Internet.
Barriers for international isation as perceived by SMEs
The most important barriers, as reported by SMEs, are: Internal barriers: price of their own product or service and the high cost of in-
ternationalisation. External barriers: lack of capital, lack of adequate information, and lack of ade-
quate public support and the costs of or difficulties with paperwork associated with transport.
Lack of capital and lack of adequate public support score even higher with refer-ence to EU-EEA markets than with reference to third markets. This might be re-lated to the fact that generally somewhat larger and more experienced SMEs are active in third markets. Both barriers are more important the smaller the SME is.
Awareness of public support programmes among SMEs is low
SMEs are generally not well aware of the existence of public support programmes for internationalisation that could be used by their firm. The percentages that are aware range from 15% for micro enterprises to 27% for medium sized enterprises, and from only 10% for enterprises that are not internationally active to 22% for SMEs with international activities. By sector: 20% to 25% of SMEs in wholesale and manufacturing are aware of support programmes, whereas for retail, transport and personal services this is only 10% to 13%. Step one in adequately supporting SMEs to access international markets opportuni-ties, is to raise the rather low awareness of business support programmes among SME.
Also use of public support is rather low
Only a small number of the SMEs actually use public support measures. Financial support is, in 2009, used more by the larger SMEs: micro 10%, small 13% and medium-sized 16% of enterprises with international activities. Non-financial sup-port is used more by the smallest firms: micro 10%, small 8% and medium-sized enterprises 6%. By country the differences are very large. A very high percentage of SMEs in Aus-tria (47%) and Turkey (32%) reported using financial support whereas in countries such as Portugal, Denmark, the Netherlands, FYROM and Iceland this is 1% or less. The use of non-financial support is highest in Slovenia (23%), Cyprus (19%) and Latvia (16%), but only between 2% and 10% in 10 countries, and below 2% in 15 of the 33 countries.

8
B2. On the effect of internationalisation on business performance
Being international ly active strongly relates to higher turnover growth
There is a positive correlation between being internationally active and reporting high turnover growth. More than 50% of SMEs that invest abroad and SMEs that are involved in international subcontracting, report increasing turnover from 2007-2008, whereas for all SMEs this is about 35%.
SMEs that are international ly active report higher employment growth
SMEs that are internationally active generally report higher employment growth from 2007 to 2008 than non-active SMEs, for example: Exporters’ employment growth 7%, non exporters 3%. Importers employment growth 8%, non importers 2%. SMEs both importing and exporting 10% employment growth; others 3%. SMEs with FDI employment growth 2007-2008 16%, others 4%.
The relationship between internationalisation and innovation is strong
26% of internationally active SMEs introduced products or services that were new for their sector in their country, for other SMEs this is only 8%. These internation-ally active SMEs are also more active with process innovations that are new for their sector in their country (11% vs 3% for the SMEs without international activi-ties).
C. Recommendations for SME Policy Support
Awareness and use of public support programmes need to be promoted much more vigorously
For SMEs that use the support provided, the effect of public support is relatively important. But SMEs are generally not well aware of the existence of public sup-port programmes for internationalisation and the level of use of these instruments is very limited: less than 10% of the internationally active SMEs use them.
Easier access to support measures for micro firms
The smallest (micro) SMEs are the ones that need and would benefit most from support programmes yet paradoxically they are the ones that are least aware and are the lowest users. This is particularly relevant in the case of financial support, especially considering that lack of capital figures prominently among the barriers reported in the survey. Therefore efforts should be made to improve the access of especially micro and small SMEs to existing public financial support mechanisms. Support programmes, financial and otherwise, must be more specific in their tar-gets and objectives and include monitoring tools.

9
Support innovation to spur international isation
The results of the study confirm that there is a strong link between activities on international markets and different forms of innovation. These findings on the link between innovation and internationalisation do suggest - even if the direction of the casual effect is not always clear3 - that it is a good thing to design and present policy support measures aimed at stimulating innovation and internationalisation in conjunction. It might also be considered to merge the agencies that are imple-menting these two types of policies.
Not only focus on export, also on import
The survey shows that import is an important activity for SMEs, not only in its own right (sourcing inputs to remain competitive) but also as a stepping stone to broader internationalisation. However, most public support programmes still focus on exporting.
Foster e-commerce
E-commerce activity is positively correlated with being active in export or import markets. The Internet has already made it easier for SMEs of all sizes to overcome some of the barriers to internationalisation. Actions by policy makers to facilitate a continuing growth of e-commerce may further strengthen this effect such as ac-ceptance of electronic signatures.
Cooperation between MS in col lecting market information
Lack of information is a crucial barrier for doing international business and might be due to a market failure. The costs that have to be incurred to address this gap could be substantially reduced by ensuring that the amount of 'double work' within the EU is further reduced. Efficiency gains could be obtained by organising, at EU level, the collection and analysis of information on market developments and the legal and institutional en-vironment in foreign markets. This would allow local agencies to focus on being an efficient interface with their national business community.
3 Actually the survey suggested casual effects in both directions, for example experience on interna-tional markets contributing through learning effects to innovation.


11
1 Introduction
This first chapter sketches briefly the survey which serves as the basis of the study, the set-up of the survey used and the data originating from the sample of SMEs across 33 countries in Europe on which the subsequent chapters are based. More details are provided in Annex I, II and III.
1.1 The objectives of the study The goal of this study4 on internationalisation of SMEs is to contribute to a better understanding of the level and structure of internationalisation of European SMEs. This study analyses the various modes of internationalisation, timing and sequence of (entry) modes and SME size, sectoral and geographical variations. The use and effectiveness of public support as perceived by SMEs and the possi-ble synergies between internationalisation and other growth areas such as inno-vation at firm level were also considered. To this end an in-depth survey was carried out to obtain a clear view of the cur-rent state of internationalisation of SMEs in 33 European countries. The modes of internationalisation considered are direct exports, direct imports, foreign direct investment, subcontracting and international technical co-operation. This report presents an overview of the information collected, analyses major findings and presents conclusions and recommendations on policy measures to support enterprises in their internationalisation efforts. The dataset containing the raw data originating from 9480 extended SME interviews is also available to allow additional analyses.
1.2 The SME survey
Number of SMEs, countries and size-classes
This report is mainly based on the results from a survey among SMEs in 33 European countries and aims to describe and analyse the variance in incidence of various forms of international business activities among SMEs in various coun-tries, size classes and sectors of activity. The survey covered the 27 EU Member States and 6 non-EU countries: Croatia, Iceland, Liechtenstein, FYROM5, Norway and Turkey.
Disproportional stratif ied sample and weighing
A proportional, random sample of European SMEs would result in a large number of responses from micro retail enterprises in large economies such as Italy, but hardly any information on medium-sized manufacturing in Estonia (because their number is very limited). In order to obtain conclusions for groups of enterprises at different levels, e.g. manufacturing SMEs or SMEs in smaller economies, these categories of firms are over-sampled to guarantee a sufficient number of obser-vations in such classes.
4 The study was commissioned by DG Enterprise and Industry of the European Commission and implemented by EIM Business & Policy Research in the Netherlands.
5 Former Yugoslav Republic of Macedonia.

12
The disproportional stratified sample plan considered three dimensions: 33 European countries as mentioned above; 3 SME size classes: micro enterprises (1-9 occupied persons), small (10-49)
and medium-sized enterprises (50-249); 26 sectors of activity (see Annex I, Table 20). By using a disproportional stratified sample it is guaranteed that within each country, information is obtained from a reasonable spread of respondents among size classes and sectors of activity. The sample features approximately equal numbers of interviews per size class. In Europe about 92% of all SMEs are micro enterprises and a proportional sample would not have provided sufficient num-bers of small or medium sized companies to extract conclusions on these groups. Because the sample is not proportional to the distribution of the European enter-prise population, all findings and conclusions are based on weighted results tak-ing the actual distribution of the 24 million SMEs in these 33 countries by size class, sector of industry and country into account.
Levels of confidence obtained
The results presented in this report are based on a large scale survey of 9,480 firms. The sample size is sufficiently large to guarantee a 95% confidence level within a 10% range for most results6. A more detailed account of the sample plan, weighting, levels of confidence ob-tained, etc. is provided in Annex I. An overview of the questionnaire and routing (showing how many respondents answering each question) is shown in Annex II.
Comparing results from different surveys
The survey reported in this report with 9480 responding SMEs across 33 coun-tries in Europe certainly contains relevant findings at a reasonable level of confi-dence, and allows studying a range of potentially interesting relationships. How-ever one should always be careful when comparing absolute levels taken from this or other studies because: Percentage of exporting SMEs may include enterprises without employees, or
exclude such enterprises. The percentage of SMEs that export, either based on SMEs that report their
export turnover vs the percentage of all SMEs that report exports in at least one of the previous 3 years.
The share of export in the turnover of SMEs, either based on only exporting SMEs or also including SMEs without any exports.
6 Statistical theory shows for dichotomous variables that if sample errors are not to exceed ± 10% for a finding of 50% at a confidence level of 95%, a total sample size of about 100 is needed for the sub- group for which one formulates an inference. Hence a statement like '50% of medium-sized enterprises in Romania are aware of existing export support measures' would imply - as there are about 100 respondents from medium-sized enterprises in Romania - that it is 95% certain that the real value in the enterprise population will be between 40 and 60%. However if we state that only 2% of European SMEs are active in foreign direct investments, it is - considering variation due to sampling only - 95% sure that the actual percentage is between 1.7% and 2.3% because all 9480 SMEs answered this question. For variables of a different type (numerical variables), a similar reasoning applies.

13
Fieldwork period
The actual fieldwork was carried out in January-April 2009. Seasonally adjusted data show that export to and import from non-EU countries (extra-EU27 trade) increased up to July 2008, thereafter exports as well as imports decreased, but as imports slowed down more the trade balance improved7. For internationally active SMEs this period was not 'business as usual' and this might have affected their responses. This should also be taken into account when interpreting the re-sults of the study.
1.3 General characteristics of enterprises sampled Responses from the survey reveal some information on the profile of the respon-dents8.
Legal form and posit ion of respondents within SMEs
Nearly all responses relate to independent SMEs (97%). The remaining enter-prises have less than 50% ownership by other enterprises. The responding 9480 individuals have the following position (unweighted): gen-eral manager (2858), owner (2501), other member of management team (2287), accountant (1180), international business manager (295), export manager (190), family member (169). Of the respondents 6462 were male and 3017 fe-male.
Distribution by country and size class
Table 21 in Annex 1 shows the distribution of the completed interviews among the 33 countries and the three size classes. The number of completed interviews per country ranges from 118 in Iceland to 623 in Italy. By legal status, nearly all responding SMEs belong to one of four types: sole pro-prietor (n=1246); private limited enterprise (n=5575), public limited enterprise (n=1326) and partnership (n= 1245)9.
Sector of activity
The aim was to obtain at least 150 respondents from each of the 26 sectors of activity distinguished in the sample plan. The figures in Section 2.3 Internation-alisation by sector show all manufacturing sub-sectors combined, but one should note that this classification is still rather detailed. Sub-sectors such as mining (n=142), electricity (n=141), or research (n=141) have a small number of ob-servations, so the detailed figures by 17 sub-sectors in Section 2.3 should be treated with care. Therefore a more aggregated classification has also been developed that has (unweighted) sufficient numbers of observations in each class ranging from 477
7 In June 2009 the EU27 estimated extra-EU27 trade balance had remarkably improved compared to one year earlier: -4.3 billion euro compared to -19.3 billion euro in June 2008. Also the trade balance for the EURO area showed an improvement: +4.6 billion euro compared to zero for June 2008. Eurostat Newsrelease, euroindicators, 119/2009, 17 August 2009. See: http://www.eurostat.eu/.
8 Unlike other chapters, all numbers in this section are unweighted numbers of completed inter-views.
9 Category others: 88.

14
in transport and communication and 638 in wholesale trade to 2383 in manufac-turing. This classification is used in Chapter 2 and is also used in describing the partner countries for European SMEs in exporting and importing in Chapter 3.
Age of enterprise
Unweighted, 1651 (17%) of the responding SMEs are relatively young (less than 10 years); 4409 are established for 10 to 24 years, the remainder have been in existence for more than 25 years.
1.4 Structure of the report The report consists of seven chapters: The introduction in Chapter 1. Chapter 2 provides a detailed account of the incidence of internationalisation
by country, sector and SME size. The international markets of European SMEs are described in Chapter 3. Chapter 4 studies the link between internationalisation and several other phe-
nomena: the size of the country in which the SME is located; the distance of the SME to the nearest land border and entry modes of internationalisation ('do enterprises generally start with exporting, or does importing come first?'). The association between internationalisation and the use of e-commerce, product and process innovation and the performance of the enter-prise is also analysed.
Barriers to internationalisation and government support to foster further in-ternationalisation are discussed in Chapters 5 and 6 respectively.
Finally conclusions and policy issues are presented in Chapter 7. Chapters 2, 3 and 5 include a brief section comparing results of Europe with Ja-pan and the United States of America. There are 6 annexes: set up of the survey; overview of questionnaire and rout-ing; world regions distinguished; Probit regression explaining export and import; a number of policy examples described and literature used.

15
2 Overview internationalisation of European SMEs
Chapter 2 provides an overview of the different modes of internationalisation dis-tinguished in this study: exporting, importing, foreign direct investments (FDI), international technical cooperation and subcontracting. More than 40% of European SMEs are involved in some form of international re-lationship. The percentages vary from nearly 30% of SMEs that import to only 2% of SMEs having foreign direct investments. Only 4% of SMEs have plans to become internationally active in the coming years.
2.1 General picture
2.1.1 Different modes of international isation
The following modes of internationalisation have been studied for the period 2006-2008: importing; exporting; foreign direct investments (having establish-ments abroad); technological cooperation with enterprises abroad; acting as subcontractor for a foreign main contractor and having foreign subcontractors.
Figure 1 Percentage of European SMEs involved in international business activities, hav-
ing concrete plans to start such activities or none at all. For various modes of
internationalisation, all 33 countries
30%
26%
8%
8%
7%
2%
3%
4%
4%
4%
3%
4%
68%
71%
89%
89%
90%
94%
0% 10% 20% 30% 40% 50% 60% 70% 80% 90% 100%
Import
Export
Tech. Coop.
Being subcontr.
Having subcontr.
FDI
Active 2006 - 2008 Plans to start None Source: Survey 2009, Internationalisation of European SMEs EIM/GDCC (N=9480).
The overall situation as resulting from the present survey is shown in Figure 1. More than 25% of European SMEs are involved in exporting or importing, whereas in the other modes less than 10% are active. However, only half of them were active outside the Internal Market in the period 2006-2008. This applies to exports, imports and subcontracting, the three modes for which data allowed this distinction to be made (See Figure 2).

16
Figure 2 Percentage of SMEs in EU27 involved in international business activities
beyond the Internal Market
14%
13%
2%
86%
87%
98%
0% 10% 20% 30% 40% 50% 60% 70% 80% 90% 100%
Import
Export
Sub-contracting
Active Extra Internal Market 2006-2008 Not active
Source: Survey 2009, Internationalisation of European SMEs EIM/GDCC (N=9480).
Figure 3 shows the differences between the 27 EU Member States and the other 6 European countries included in the survey: Croatia; Iceland; Liechtenstein; FY-ROM; Norway and Turkey. The percentage of SMEs reporting international activi-ties is higher in the non-EU countries. Figure 3 shows that combining all 6 modes of internationalisation studied, this includes 44% of all SMEs within the EU and 49% of SMEs in the six non-EU Member States covered.
Figure 3 Incidence of import and export and other modes of internationalisation (per-
centage of SMEs, EU Member States and non-EU-members*)
25%
44%
33%
45%
20%
17%
38%
16%
29%
49%
16%
28%
0% 10% 20% 30% 40% 50% 60%
Exports
Imports
Export and import
Export and/or import
DFI, coop. and/or subcontr.relationships
Any international activity
EU27 Non EU-members
Note (*): Non EU- Members refers exclusively to the countries considered in this survey:
Croatia, Iceland, Liechtenstein, FYROM, Norway and Turkey.
Source: Survey 2009, Internationalisation of European SMEs EIM/GDCC (N=9480).
By creating mutually exclusive categories (e.g. enterprises only exporting) one can see that importing and exporting very often coincide within the same enter-prises. Of all enterprises that either import or export, more than 40% are active with both modes as shown in Figure 4.

17
Figure 4 Percentage of SMEs with direct exports and/or imports in 2006-2008
13%
16%
10%
61%
Only import
Import and export
Only export
No import and no export
Source: Survey 2009, Internationalisation of European SMEs EIM/GDCC (N=9480).
To provide a bit more detail about the incidence of each mode of internationali-sation the survey findings are analysed subsequently in sub-sections focusing on size of firm, sector, country group and age of firm.
2.1.2 Size of f irm
The percentage of SMEs that is involved in international activities is closely re-lated to the size of the firm (in terms of number of workers). Table 1 shows that for each mode of internationalisation the percentage of SMEs increases by firm size10.
Table 1 Percentage of SMEs with international business activities in 2006-2008, by en-
terprise size
Mode of internationalisation Micro Small Medium-sized Total
Percentage of all SMEs
SME with direct exports 24% 38% 53% 26%
SME with direct imports 28% 39% 55% 29%
SME has invested abroad 2% 6% 16% 2%
SME with technological cooperation with enter-
prises abroad 7% 12% 22% 7%
SME has been a subcontractor to a foreign main
contractor 7% 11% 17% 8%
SME had foreign subcontractors 7% 12% 16% 7%
SMEs with at least one of these 6 international
activities 43% 58% 73% 44%
Total N, unweighted 3253 3260 2967 9480
Source: Survey 2009, Internationalisation of European SMEs EIM/GDCC (N=9480).
10 –Amongst other sources, empirical work by the Belgium National Bank notes that the degree of internationalisation strongly depends on the number of employees of the firm: Muûls, M, M. Pisu (2007): Imports and Exports at the Level of the Firm: Evidence from Belgium, working paper re-search, National Bank of Belgium. P. 40.

18
The relationship of each mode of internationalisation to size class is quite pro-nounced: The share exporting; importing or active in subcontracting is at least twice as
high for medium-sized enterprises as for micro enterprises. Medium-sized enterprises are three times more active in technical cooperation
than micro enterprises. For FDI there is really a large difference, by size class micro 2%, small 6%
and medium-sized 16%. Figure 5 depicts the overall relationship between 'being involved in any form of internationalisation' (defined as SMEs either exporting, importing, investing abroad, cooperating internationally, or having international subcontractor rela-tionships) and size of firm.
Figure 5 Percentage of internationalised (*) SMEs in 2006-2008 by size of firm
43%
58%
73%
44%
0%
10%
20%
30%
40%
50%
60%
70%
80%
Micro Small Medium Total
Note (*): Internationalised SMEs are defined as SMEs either exporting, importing, investing
abroad, cooperating internationally, or active in international subcontracting.
Source: Survey 2009, Internationalisation of European SMEs EIM/GDCC (N=9480).
It has been questioned whether the size class effect described is not due to a sector effect. Micro enterprises might only have a lower export orientation be-cause many micro enterprises are retailers. To this end we estimated two Probit models describing the chance that an SME is involved in export or import. In these models several explanatory variables are included implying that for exam-ple the effect of size is corrected (controlled) for other effects such as the sector effect described above. The models run showed that also in this multivariate ap-proach the effect of size (and other variables) remains significant. See Annex IV for a brief discussion of the results of the two Probit models.
2.1.3 Sector
Figure 6 shows that manufacturing and wholesale trade have a very high share of exporting SMEs (just above 50%). In personal services and the construction industry this is 11% or lower11. Also for importing, manufacturing and wholesale trade are the most important, but here wholesale trade scores much higher than manufacturing as shown in Figure 7.
11 Also here the Probit model presented in Annex IV indicates that this effect remains significant when corrected (controlled) for other variables.

19
Figure 6 Percentage of SMEs with export in 2006-2008 by sector
7%
11%
25%
54%
56%
39%
19%
0% 10% 20% 30% 40% 50% 60%
Construction
Personal services
Business services
Retail trade
Transport and communication
Wholesale trade
Manufacturing
Source: Survey 2009, Internationalisation of European SMEs EIM/GDCC (N=9480).
Figure 7 Percentage of SMEs with import in 2006-2008 by sector
12%
71%
15%
16%
26%
39%
49%
0% 10% 20% 30% 40% 50% 60% 70% 80%
Construction
Personal services
Business services
Transport and communication
Retail trade
Manufacturing
Wholesale trade
Source: Survey 2009, Internationalisation of European SMEs EIM/GDCC (N=9480).
For foreign direct investment similar scores are found for manufacturing, whole-sale trade, transport and communication and business services (all 3% to 4%). Construction and personal services again show the lowest score (less than 1%). The percentage of SMEs with international technical cooperation is between 5 and 10% for most sectors. Business services scores the highest with nearly 12% and retail trade the lowest with some 3%. With regard to subcontracting - for most sectors between 5% and 10% - trans-port and communication score a lot higher: over 20% of SMEs in this sector acted as a subcontractor to foreign firms, and also more than 20% had foreign subcontractors. To summarise these findings by main sector groups we list the sectors with the highest percentages for each mode of internationalisation: Import: wholesale. Export: wholesale and manufacturing. FDI: business services. Technical cooperation: business services. Subcontractor to foreign firm: transport and communication. Having foreign subcontractors: transport and communication.

20
Therefore, when studying internationalisation of SMEs and considering policy measures it might be worthwhile to distinguish between the modes of interna-tionalisation and sectors of industry.
2.1.4 By country group
In Table 2 a distinction is made between the 27 EU Member States and the 6 non-EU countries. The table shows that for all modes of internationalisation dis-tinguished, the incidence is somewhat higher in the non-EU countries. With re-gard to 'being a subcontractor to a foreign main contractor' the difference is really substantial; it is almost twice as high in non-EU countries (13% vs 7%). This latter effect might be related to relatively low wage unit costs in several of the non-EU countries considered, e.g. Turkey.
Table 2 Percentage of SMEs with international business activities in 2006-2008, by
country group
Mode of internationalisation EU Non-EU Total
Percentage of all SMEs
SME with direct exports 25% 28% 26%
SME with direct imports 29% 33% 29%
SME invested abroad 2% 3% 2%
SME with technological cooperation with enterprises abroad 7% 9% 7%
SME has been a subcontractor to a foreign main contractor 7% 13% 8%
SME had foreign subcontractors 7% 7% 7%
SMEs with at least one of these 6 international activities 44% 49% 44%
Total N, unweighted 8332 1148 9480
Source: Survey 2009, Internationalisation of European SMEs EIM/GDCC (N=9480).
The overall result is that in the EU Member States some 44% of SMEs report at least one form of international activities, whereas in the non-EU Member States this is 49%.
2.1.5 Age of f irm
Figure 8 shows that the percentage of SMEs importing and exporting steadily in-creases with the age of the firm. Although differences are not very large they are statistically significant. However with regard to the other forms of internationali-sation such a regular pattern could not be established as shown in Figure 9. For the four modes portrayed in Figure 9, i.e. foreign investments, technological cooperation, being a subcontractor or having a foreign subcontractor, enterprises that are between 5 to 9 years old show the highest incidence. Here differences are somewhat larger and also statistically significant. Enterprises that are older are less involved. Interestingly older enterprises are however relatively much more involved in export and import (as shown in Figure 8).

21
Figure 8 Percentage of SMEs with imports and exports in 2006-2008 by age of firm
29%
25% 25%
34%
17%
22%
27% 28%
0%
5%
10%
15%
20%
25%
30%
35%
40%
0 to 4 years 5 to 9 years 10 to 24 years More than 25 years
Exports in 2006-2008 Imports in 2006-2008
Source: Survey 2009, Internationalisation of European SMEs EIM/GDCC (N=9480).
Figure 9 Percentage of SMEs engaged in four types of international business activities in
2006-2008, by age of firm
4%
2% 2%
7%
8% 8%
6%6%
14%
8%
5%
6%
2%
7%7%
10%
0%
2%
4%
6%
8%
10%
12%
14%
16%
0 to 4 years 5 to 9 years 10 to 24 years More than 25 years
Enterprise invested abroad in 2006-2008
Enterprise had any technological cooperation with enterprises abroad
Enterprise has been a subcontractor to a foreign main contractor in 2006-2008
Enterprise had foreign subcontractors in 2006-2008
Source: Survey 2009, Internationalisation of European SMEs EIM/GDCC (N=9480).
2.1.6 FDI
The total number of SMEs that invest abroad is rather limited, i.e. about 2%. This still amounts to about 500 000 SMEs in Europe. However numbers in the sample are too small to allow detailed analysis. At an overall level some main characteristics are presented in Figure 10 and Figure 11. Figure 10 shows that most foreign establishments are subsidiaries (42%), but considerable numbers are just branch offices (not separate legal entity) or joint ventures. Figure 11 presents the function that these foreign establishments have, there are four main categories: representative office, sales office, local production and 'other'. Only 2% have mainly offices used for sourcing inputs. Most of the 2% of all SMEs that did invest abroad limit themselves to one coun-try (71%).

22
Figure 10 Legal form of foreign establishment (percentages)
42%
20%
22%
16%
Foreign subsidiary
Branch
Joint venture
Do not know/no answer
Source: Survey 2009, Internationalisation of European SMEs EIM/GDCC (this subgroup N=698).
Figure 11 Type of activities carried out by foreign establishment (percentages)
17%
28%
2%
28%
22%
3%
Representative office only
Sales office only
Buying office only
Local production
Other
Do not know/no answer
Source: Survey 2009, Internationalisation of European SMEs EIM/GDCC (this subgroup N=698).
The Observatory of European SME 200712 established that only a very small number of EU SMEs have subsidiaries or joint ventures abroad (5%). The main reason for SMEs to invest abroad, derived from this Flash Eurobarometer Survey, is the geographic proximity as supplier to other enterprises. Figure 12 provides 7 main reasons. One third of the responding SME answer 'do not know'.
12 European Commission and the Gallup Organisation 2007. Flash Eurobarometer 196 - Observa-tory of European SMEs, Analytical report.

23
Figure 12 Main reason for having foreign subsidiaries/joint ventures abroad, percentage of
SMEs with subsidiaries/joint ventures abroad
12%
11%
5%
5%
17%
32%
8%
9%
0% 5% 10% 15% 20% 25% 30% 35%
Proximity to final customers
Proximity as a supplier to a global enterprise
Lower total labour costs
Lower taxes
Less administrative and regulatory burdens
Export regulations
Access to finance
DK/NA
Source: European Commission and the Gallup Organisation 2007. Flash Eurobarometer 196 -
Observatory of European SMEs, Analytical report, p. 60.
2.2 Details by country There is a negative correlation between the size of the SME's home country population and its level of international activity. Countries such as Estonia, Den-mark, Sweden, Czech Republic and Slovenia have a much higher percentage of exporters than the EU average of 25%. France, Germany and UK score below av-erage. In this section the six modes of internationalisation are considered by country. The 27 EU Member States are shown individually13 and are indicated by the two letter ISO code14. In the following four figures the results for all Member States are presented. In each figure the EU average - that was shown in Figure 3 - is indicated by a red line, so: Figure 13: exporting: 25%; Figure 14: importing, EU average: 29%; Figure 15: FDI, technical cooperation, subcontracting relationships: 17%; Figure 16: one or more of all 6 forms of internationalisation: 44%. The six largest EU economies, i.e. France, Germany, Italy, Poland, Spain and the United Kingdom represent over 70% of all SMEs of EU2715. Figure 13 shows that
13 It should be noted that the estimates are not very robust for all Member States. Table 21 in Annex I shows that for large Member States the number of completed interviews is more than 600, however for a few countries such as Iceland (=118) and Cyprus (n=125) the number of completed interviews is only moderate. Given 622 observations for Germany, the finding in the sample that 14% of all SMEs in Germany import, means that we can be 95% sure that the ac-tual number for all SMEs in Germany will be between 11 and 17% (confidence interval, ± 3%). In Cyprus however there are only 125 interviews completed, hence the finding for Cyprus of 67% SMEs importing results in a confidence interval of 59% - 75% at a confidence level of 95% (± 8%). As a result of this some results might be questioned, e.g. those for Greece in Figure 14. (See Figure 45 in Annex I for confidence intervals).
14 http://www.iso.org/iso/english_country_names_and_code_elements.
15 European Commission, First Section of the Annual Report on EU Small and Medium-sized Enter-prises, Zoetermeer, January 12, 2009 prepared by EIM for DG Enterprise and Industry of the European Commission and available at: http://ec.europa.eu/enterprise/entrepreneurship/craft/ sme_perf_review/doc_08/spr08_annual_report.pdf.

24
of these six large EU economies, four countries i.e. Germany, France, Spain, and the United Kingdom have a lower than average percentage of SMEs exporting.
Figure 13 Percentage of SMEs with direct export in 2006-2008 by country
0%
10%
20%
30%
40%
50%
60%
EE DK SE CZ SI EL BE NL PT LT MT PL NonEU
SK IT LU ES LV IE UK BG DE FR RO HU AT FI CY
EU average 25%
Source: Survey 2009, Internationalisation of European SMEs EIM/GDCC (N=9480).
The percentage of SMEs that do export is not necessarily a direct indication for the contribution of SMEs to the countries' export and economic prosperity. If a country has a well established export infrastructure with specialised international trading houses catering efficiently for foreign markets, many SMEs could be flourishing by producing for foreign markets and be contributing to total value added in the country without themselves directly delivering and invoicing to for-eign customers. In addition also SMEs operating as subcontractors to (often lar-ger) domestic firms that do export their products, contribute to the GDP and in-directly to the export performance of the country.
Figure 14 Percentage of SMEs with direct imports in 2006-2008 by country*)
0%
10%
20%
30%
40%
50%
60%
70%
80%
MT EL CY EE BG LT SI LU HU PT SE SK BE NL IE RO LV NonEU
ES PL DK FI CZ AT IT UK FR DE
EU average 29%
Note (*): As noted in footnote 13, results for Greece may have to be taken cautiously as there
were only 69 completed interviews with micro enterprises. Among these, 17 out of 19 Greek micro firms in retailing report to import. This contrasts with the results of a national survey by The Profile of Greek SMEs, December 2008, Hellenic Organization of Small and Medium Sized Enterprises and Handicraft, EOMMEX that reports that about 2 out of 10 mi-cro firms import.
Source: Survey 2009, Internationalisation of European SMEs EIM/GDCC (N=9480).

25
Figure 14 shows that nearly all of the six large economies also score below the EU average with regard to imports; Spain being the one exception. The share of internationally active SMEs is higher in smaller economies, either measured in terms of area or in terms of population as further analysed in Chap-ter 4. Annex IV presents a Probit regression analysis to explain the chance that an SME is involved in import or export by a range of characteristics simultane-ously, including size of home country.
Figure 15 Percentage of SMEs with FDI, technical cooperation and/or foreign subcontrac-
tor relationships in 2006-2008 by country
0%
10%
20%
30%
40%
50%
60%
LU SE SK DK EE LV BG FI CZ BE LT RO MT EL NL SI NonEU
IE HU CY DE PT UK AT FR PL ES IT
EU average 17%
Source: Survey 2009, Internationalisation of European SMEs EIM/GDCC (N=9480).
Figure 15 portrays the situation with SMEs being involved in foreign direct in-vestments (FDI) technical cooperation and/or foreign subcontractor relation-ships. The position of Luxembourg is unchallenged, but the relatively high per-centages of SMEs with foreign investments in all Scandinavian and Baltic states is noticeable (all 30 to 40%, Sweden even higher). Other Member States where high scores are reported are Belgium, Bulgaria and the Czech Republic and espe-cially Slovakia with just above 40%. Figure 16 summarizes the previous results as it shows the percentage of SMEs that state to be active in any of these six forms of international activities (ex-porting, importing, investing abroad, cooperating internationally, or having in-ternational subcontractor relationships). The top six Member States are: Greece; Malta; Estonia; Cyprus; Luxembourg and Bulgaria. Relatively low scores are re-corded for: Germany; France; Italy; Austria and the United Kingdom. So Austria and four of the six large European economies show the lowest scores; the score of Spain is equal to the European average, Poland a bit higher.
Figure 16 Percentage of internationalised SMEs (any of 6 modes) in 2006-2008 by country
0%
10%
20%
30%
40%
50%
60%
70%
80%
90%
EL MT EE CY LU BG LT SE SI BE LV SK DK CZ NL PT NonEU
IE PL HU RO FI ES UK IT AT FR DE
EU average 44%
Source: Survey 2009, Internationalisation of European SMEs EIM/GDCC (N=9480).
26
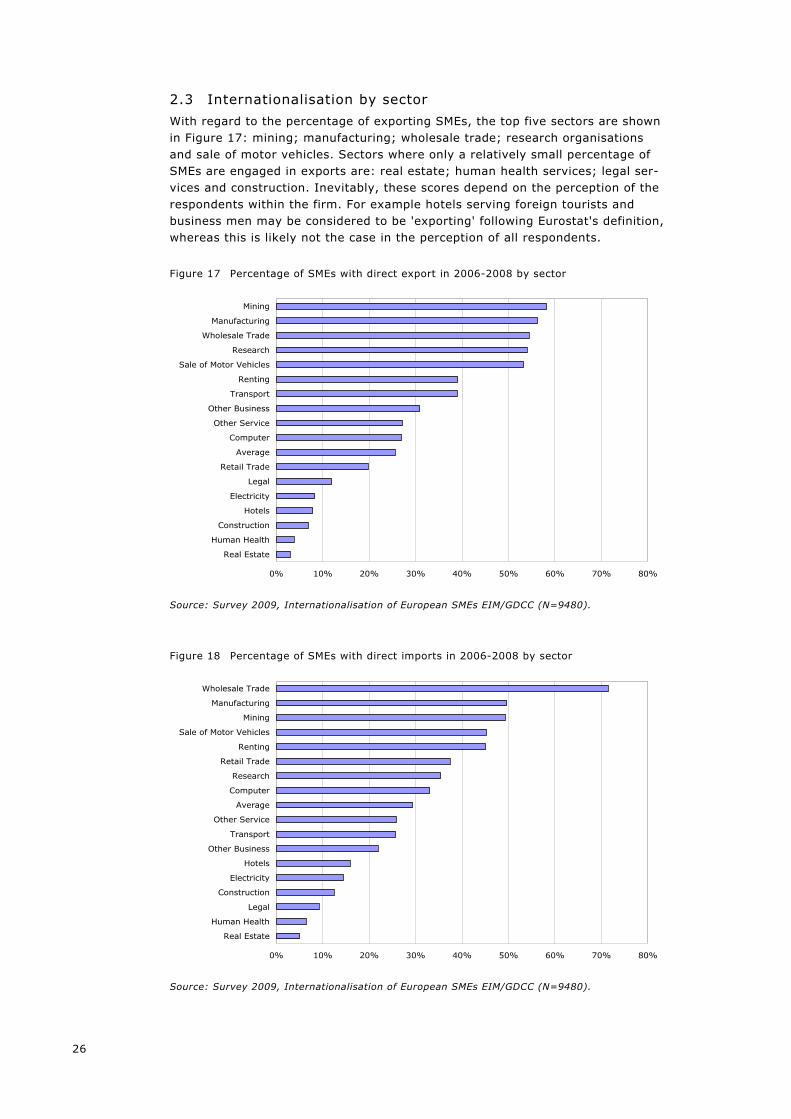
2.3 Internationalisation by sector With regard to the percentage of exporting SMEs, the top five sectors are shown in Figure 17: mining; manufacturing; wholesale trade; research organisations and sale of motor vehicles. Sectors where only a relatively small percentage of SMEs are engaged in exports are: real estate; human health services; legal ser-vices and construction. Inevitably, these scores depend on the perception of the respondents within the firm. For example hotels serving foreign tourists and business men may be considered to be 'exporting' following Eurostat's definition, whereas this is likely not the case in the perception of all respondents.
Figure 17 Percentage of SMEs with direct export in 2006-2008 by sector
0% 10% 20% 30% 40% 50% 60% 70% 80%
Mining
Manufacturing
Wholesale Trade
Research
Sale of Motor Vehicles
Renting
Transport
Other Business
Other Service
Computer
Average
Retail Trade
Legal
Electricity
Hotels
Construction
Human Health
Real Estate
Source: Survey 2009, Internationalisation of European SMEs EIM/GDCC (N=9480).
Figure 18 Percentage of SMEs with direct imports in 2006-2008 by sector
0% 10% 20% 30% 40% 50% 60% 70% 80%
Wholesale Trade
Manufacturing
Mining
Sale of Motor Vehicles
Renting
Retail Trade
Research
Computer
Average
Other Service
Transport
Other Business
Hotels
Electricity
Construction
Legal
Human Health
Real Estate
Source: Survey 2009, Internationalisation of European SMEs EIM/GDCC (N=9480).

27
As expected, wholesale trade is the sector with the highest percentage of import-ing SMEs by far. The second position is for mining and manufacturing. Next are sale of motor vehicles and renting activities. Real estate, human health and legal services score lowest (Figure 18).
Figure 19 shows that the combination FDI, technical cooperation and/or foreign subcontractor relationships in 2006-2008, results especially in high scores with: research; transport; other business services; sale of motor vehicles and whole-sale trade. The lowest percentages are reported for: human health services; re-tail trade and hotels.
Figure 19 Percentage of SMEs with FDI, technical cooperation and/or foreign subcontrac-
tor relationships in 2006-2008 by sector
0% 10% 20% 30% 40% 50% 60% 70% 80%
Research
Transport
Other Business
Sale of Motor Vehicles
Wholesale Trade
Renting
Mining
Computer
Manufacturing
Electricity
Average
Real Estate
Legal
Construction
Other Service
Hotels
Retail Trade
Human Health
Source: Survey 2009, Internationalisation of European SMEs EIM/GDCC (N=9480).
The overall picture (Figure 20), incorporating all modes of internationalisation, shows the highest scores in: wholesale trade; mining; manufacturing; research and sale of motor vehicles. The only sector distinguished that report a really low participation in any form of international business activities is human health ser-vices.

28
Figure 20 Percentage of internationalised (*) SMEs in 2006-2008 by sector
0% 10% 20% 30% 40% 50% 60% 70% 80%
Wholesale Trade
Mining
Manufacturing
Research
Sale of Motor Vehicles
Transport
Renting
Computer
Other Business
Retail Trade
Average
Other Service
Electricity
Legal
Construction
Real Estate
Hotels
Human Health
Note (*): Internationalised SMEs are defined as SMEs either exporting, importing, investing
abroad, cooperating internationally, or active in international subcontracting.
Source: Survey 2009, Internationalisation of European SMEs EIM/GDCC (N=9480).
2.4 Comparisons with USA and Japan Although the relationship between internationalisation and size of SME are iden-tical in the EU, USA and Japan, the level of international activity of EU SMEs is considerably higher. This is largely explained by the intra-EU trade that makes up the largest share of the overall international business activities of European SMEs.
2.4.1 USA16
According to the National Small Business Poll17: 13% percent of small-business owners report that they have had foreign sales
in the past three years. This figure jumps to 39% if only manufacturers are considered.
Foreign sales constitute a modest percentage of total sales among those who do sell outside the country. 71% of all small exporters have foreign sales comprising 5% or less of their total sales.
Most exporters simply take orders from abroad rather than vigorously market-ing their products or services. Just 12% of exporting manufacturers regularly
16 To identify comparable data we have been in contact with a researcher from the Kaufman Foun-dation working in this area. The general idea is that international trade gets much less focus in the USA. in studying small business developments than in Europe.
17 Volume 4, Issue 1 2004 (ISSN - 1534-83260). The National Small Business Poll is a series of regularly published survey reports based on data collected from national samples of small-business employers. The Poll is designed to address small-business-oriented topics about which little is known but interest is high. The series is published by The National Federation of Inde-pendent Business (NFIB), an advocacy organization representing small and independent busi-nesses founded in 1943. Report available at: http://www.411sbfacts.com/sbpoll.php?POLLID=0005&KT_back=1.

29
market outside the USA, 18% market intermittently. Firm size matters. Manu-facturers with 20 or more employees are more likely to market regularly and sell outside the USA than manufacturers with 10 to 19 employees, followed by the smallest firms (1-9 employees).
The Small & Medium-Sized Exporting Companies: Statistical Overview 2007 based on data of the US Commerce Department's Exporter Database (EDB) and referring only to goods18, reports that exports have doubled over the period 1992-2007 to reach nearly 260 000 enterprises. This is 97% of all exporting US firms. The Kauffman Firm Survey19 is a panel study among some 5000 new businesses founded in 2004 and tracked over their early years of operation by the Ewing Marion Kauffman Foundation shows that young firms are serving predominantly local or regional markets, while some 13 percent of firms had some international sales. High-tech firms were much more likely to have broader markets for their products and services. The Small Business Economy: a Report to the President of the Small Business Administration 2008 provides information from which the percentages of enter-prises by size class that are engaged in export could be derived. In Figure 21 this information is compared to the data of our European survey. To do this we have developed a size class definition for EU27 that is in line with the definition used in the SBA report.
Figure 21 Percentage of exporting firms by size class for USA (2002) and EU27 (2006-08)
1% 2% 2% 2% 3% 4% 5%8%
11%15%
25%
41%
14%
24%29%
38%42%
58%
23%
%
10%
20%
30%
40%
50%
60%
0 employees
1-4 employees
5 up to 9employees
10 up to 19employees
20 up to 99employees
100 up to 249employees
250+employees
USA EU27 extra trade only EU27 all export Source: US Small Business Administration, The Small Business Economy: a Report to the Presi-
dent, Washington, 2008 (p. 78 information based on Survey Business Owners 2002
from US Census Bureau), respectively Survey 2009, Internationalisation of European
SMEs EIM/GDCC (N=9480).
As expected the figures for the USA are significant lower than for Europe. For the very large US economy- although US trade is an important part of global trade - international trade is relatively unimportant. Instead of comparing national USA export with national export of countries in Europe one might compare national
18 http://ita.doc.gov/td/industry/otea/sme_2007/SME_index_2007.htm. Additional information on the EDB can be obtained by viewing the US Census Bureau's Profile of US Exporting Companies, 2006-2007. It is important to note that the US definition of SMEs includes companies up to 500 employees.
19 http://www.kauffman.org/uploadedFiles/kfs_fourth_040709.pdf.

30
US external trade with only the percentage of SMEs in EU27 that are engaged in extra Internal Market trade as has been done in Figure 21 The situation in Europe is a combination of 'having a Single Market since 1993' and still defining trade from one Member State to the other as export. In 2003 it could be concluded that trade between Member States increased - relative to GDP - by 4 percentage points in the first decade of the Single Market20. At pre-sent there might still be a situation that should be considered as being posi-tioned somewhere halfway between trade between independent nation states and trading between states within the USA. This should be taken into account when comparing trade figures of EU and USA as done in Figure 21.
2.4.2 Japan21
According to the 2008 White Paper on Small and Medium Enterprises in Japan22, Japanese SMEs depend much more on private consumption and public capital formation than large enterprises, whereas large enterprises are more dependent on private sector fixed capital formation and exports23. Using an SME definition of enterprises with 300 or fewer employees, the report analyses the trends of import and export values for typical SME products. Whereas for Japan as a whole imports and exports are growing in such a way that the positive trade balance of the country is increasing, the 'typical SME products' show an increasing import surplus. Looking at the value of shipments for the period 1997-2005 it appears that most of the economic sectors show a severe decrease. For four sectors this is more than minus 40%: textile mill products, furniture and fixtures, lumber and wood products, apparel and other finished products made from fabrics and similar ma-terials. In total 15 sectors show a decrease over this period and only four report a positive development: iron and steel; transportation equipment; non-ferrous materials and chemical products. The overall situation for Japan is a steady increase in imports and exports up to about 2002, with a very steep increase thereafter. Over the period 2002-2007 imports increased 74%, exports increased 62% (measured in Yen). Figure 22 shows that the percentage of Japanese enterprises exporting by size class has a very similar structure as that of Europe: the larger the firm, the more SMEs are engaged in export24. Compared to total exports in EU27, the percentage of SMEs active in exporting are much lower in Japan, because in the European survey export includes intra-EU trade.
20 Copenhagen Economics 2003. The Internal market and the relevant geographical market, the impact of the completion of the Single Market Programme on the definition of the geographical Market, Executive summary of a study commissioned by DG Enterprise and Industry of the European Commission, Copenhagen.
21 Contact was made eiththe Organization for Small & Medium Enterprises and Regional Innovation Japan (SMRJ)to obtain data on Japanese SMEs. SMRJ was formed in 2004 through a merging of Japan Small and Medium Enterprise Corporation (JASMEC), Japan Regional Development Corpo-ration (JRDC), and Industrial Structure Improvement Fund (ISIF).
22 By the Japan Small Business Research Institute (JSBRI), available as PDF file at: http://www.chusho.meti.go.jp/sme_english/whitepaper/whitepaper.html.
23 JSBRI, part I, section 2, page 13, figure 1-1-18.
24 Chapter 4 SMEs' responses to globalisation' based on a questionnaire survey, JSBRI, part II, chapter 4, section 2, page 116.

31
To enhance the comparability, Figure 22 also contains: The figures of a European large island economy, e.g. the United Kingdom, ab-
solute levels are lower than in Europe as a whole, but still higher than in Ja-pan.
The figures of SMEs in EU27 that are exporting beyond the Internal Market, this suggests that one of the explanatory factors for the lower levels in Japan is the European Single Market.
Both in Japan and in Europe the percentage of exporting SMEs is especially high in manufacturing and in wholesale trade25.
Figure 22 Comparing percentage of exporting SMEs by size class in terms of number of
workers for Japan and EU27 (only enterprises up to 250 employees)
9%
15%
30%
13%
25%
41%
25%
42%
19%
32%
58%
46%
0%
10%
20%
30%
40%
50%
60%
70%
Up to 20 employees 21 up to 100 employees 101 up to 300 employees(up to 250 for Europe)
Japan EU27 extra Internal Market trade EU27 all export UK only
Source: Questionnaire Survey on the situation of the Business Environment in Globalisation,
Nomura Research Institute, Japan December 2007 (N=±1900); and Survey 2009, Inter-
nationalisation of European SMEs EIM/GDCC (N=9480).
Figure 23 Comparing percentage of SMEs with FDI by size class in terms of number of
workers for Japan and EU27 (only enterprises up to 250 employees)
0%2%
11%
2%
7%
22%
2%
6%
19%
0%
5%
10%
15%
20%
25%
Up to 20 employees 21 up to 100 employees 101 up to 300 employees(up to 250 for Europe)
Japan EU27 UK only
Source: Questionnaire Survey on the situation of the Business Environment in Globalisation,
Nomura Research Institute, Japan December 2007 (N=±1900) and Survey 2009, Inter-
nationalisation of European SMEs EIM/GDCC (N=9480).
25 JSBRI, part II, chapter 4, section 2, page 116-117 and figure 2-4-7.

32
Figure 23 shows that the pattern for FDI is similar as for exports: the share of SMEs involved is increasing by size of enterprise and the absolute levels are much higher in Europe than in Japan. In the EU27 still 2% of enterprises up to 20 workers invest abroad, in Japan this is only 0.3%26. We have again included figures for the United Kingdom separately to suggest that the factor 'being a large island economy' explains at least partly why levels in Japan are so much lower than in Europe as a whole.
26 JSBRI, part II, chapter 4, section 3, page 125, figure 2-4-21.

33
3 Partner countries of European SMEs
This chapter presents the major partner countries for European SMEs: export markets, the countries from which they import and the countries that are impor-tant with regard to FDI. Partner countries are mostly other EU countries. Rela-tions with emerging markets such as Brazil, Russia, India and China (BRIC) are - except for China- generally still underdeveloped. Whereas 76% of all exporting SMEs are oriented towards markets in other EU Member States, BRIC countries are only served by 7% to 10% of exporting SMEs. Only in transport and commu-nication is this percentage much higher. Also for imports, most SMEs (86%) fo-cus on other EU Member States, but here China is quite important (27%).
3.1 Exporting The SMEs that indicated to be exporting have been asked from which of 15 re-gions they are importing (described in detail in Annex III). One of the alterna-tives distinguished, cross border regions, defined in the survey as areas located in another EU or EFTA Member State within a distance of some 50 km to 100 km from the land border with the country where the enterprise is located. Table 3 shows that cross border regions are, for exporting, more important for SMEs from the EU Member States (both EU15 and EU12) than for non-EU coun-tries. Non-EU countries in Europe are more important as target markets for the 'old' 15 Member States (EU15) than for the new Member States (EU12) or the non-EU countries.
Table 3 Major world regions for exporting for EU15, EU12 and non-EU countries (per-
centage of exporters, as more answers could be given, columns do not total)
Export regions EU15 EU12 non-EU Total
Cross border regions 49% 46% 35% 47%
Other European Union 76% 83% 57% 76%
Russia 12% 7% 2% 10%
Other European countries 30% 20% 24% 27%
Middle East 17% 3% 16% 14%
North Africa 19% 1% 3% 14%
Other Africa 14% 1% 7% 11%
Japan 8% 1% 10% 7%
China 11% 3% 8% 9%
India 9% 0% 4% 7%
Other Asia 9% 2% 12% 8%
North America 21% 3% 12% 17%
Brazil 9% 1% 1% 7%
Other South and Central America 12% 3% 5% 10%
Australia/New Zealand 10% 0% 3% 8%
Total 100% 100% 100% 100%
Total N, unweighted 1957 1129 447 3533
Source: Survey 2009, Internationalisation of European SMEs EIM/GDCC (N=9480).
Regions as Middle East, Africa, Japan, China, India, other Asia, South and Cen-tral America and Australia and New Zealand are all rather important for SMEs in the old 15 Member States, but not (yet) for the 12 new Member States. Only Ja-

34
pan and other Asia are more important for the non-EU countries than for the EU Member States as export market. Table 4 shows that cross border regions, other EU and other Europe are rela-tively important for manufacturing and transport and communication sectors. The percentage of SMEs from transport and communication is two to three times higher for most regions than for other sectors, e.g. China 30% vs 9%, South America 33% vs 10%. The construction sector shows a higher than average in-volvement in regions such as China, other Europe and especially other Africa.
Table 4 Major world regions for exporting by sector (as more answers could be given,
columns do not total)
Export regions
Manu-
fact-
uring
Con-
struc-
tion
Whole-
sale
trade
Retail
trade
Trans-
port &
comm.
Busi-
ness
services
Per-
sonal
services Total
Cross border regions 52% 48% 48% 39% 55% 47% 44% 47%
Other European Union 81% 62% 72% 66% 85% 82% 77% 76%
Russia 12% 6% 6% 7% 31% 9% 3% 10%
Other European countries 35% 34% 30% 22% 44% 17% 19% 27%
Middle East 14% 9% 13% 5% 30% 12% 29% 14%
North Africa 17% 8% 14% 10% 28% 11% 11% 14%
Other Africa 10% 21% 7% 13% 27% 7% 7% 11%
Japan 7% 9% 2% 1% 25% 5% 13% 7%
China 12% 13% 9% 2% 30% 5% 6% 9%
India 11% 1% 1% 1% 27% 5% 6% 7%
Other Asia 9% 5% 4% 3% 28% 7% 4% 8%
North America 23% 9% 6% 9% 38% 21% 16% 17%
Brazil 6% 2% 7% 2% 29% 7% 3% 7%
Other South and Central
America 10% 1% 3% 12% 33% 6% 4% 10%
Australia/New Zealand 12% 2% 4% 3% 26% 5% 4% 8%
Total 100% 100% 100% 100% 100% 100% 100% 100%
Total N, unweighted 1484 148 363 459 157 651 271 3533
Source: Survey 2009, Internationalisation of European SMEs EIM/GDCC (N=9480).
Table 5 once more illustrates that because of 'multiple answer categories' care needs to be taken when percentages in one column are compared with the per-centage for the same region in another column. If one closely looks at Table 5 it appears that micro enterprises report export to a much smaller number of re-gions than larger enterprises. This can be demonstrated by summing the per-centages per column: Micro 260%; Small 333% and Medium-sized 449%. This can be interpreted as micro enterprises report on average export to 2.6 of the 15 regions etc. Hence the 14% for North Africa with micro and with small en-terprises provide a slightly different signal: North Africa is relatively more impor-tant for micro than for small enterprises.

35
Table 5 Major world regions for exporting by size class
Export regions Micro Small Medium Total
Cross border regions 45% 60% 62% 47%
Other European Union 75% 81% 90% 76%
Russia 9% 17% 27% 10%
Other European countries 27% 31% 42% 27%
Middle East 13% 17% 28% 14%
North Africa 14% 14% 21% 14%
Other Africa 11% 12% 23% 11%
Japan 6% 12% 18% 7%
China 9% 13% 18% 9%
India 6% 10% 17% 7%
Other Asia 7% 12% 18% 8%
North America 16% 22% 30% 17%
Brazil 7% 10% 17% 7%
Other South and Central America 9% 11% 20% 10%
Australia/New Zealand 7% 11% 19% 8%
Total 100% 100% 100% 100%
Total N, unweighted 862 1261 1410 3533
Source: Survey 2009, Internationalisation of European SMEs EIM/GDCC (N=9480).
3.2 Importing The partner countries for importing are studied using the same 15 global regions as with exporting. Table 6 shows that cross border trade seems to be more de-veloped in the 15 old EU Member States. For the six non-EU countries surveyed, i.e. Croatia; Iceland; Liechtenstein; FYROM; Norway and Turkey, the Internal Market is a very important place to buy. The important role for China as a sup-plier to European SMEs is confirmed by the results obtained. For EU-15 the per-centage is twice as high as for EU-12. For the non-EU countries included in the survey, Japan is a much more important source of imports than for the EU Mem-ber States. Also with North America and India the scores of the three groups dis-tinguished are quite different. India is especially important for the 15 old EU Member States, North America for the 15 old EU Member States and the non-EU countries.

36
Table 6 Fifteen regions in the world from which imports are sourced; percentage of im-
porting SMEs from EU15, EU12 and non-EU countries (as more answers could be
given, columns do not total)
Countries in 3 groups
Region from which imports originate EU15 EU12 Non-EU Total
Cross border regions 44% 25% 23% 38%
Other European Union 84% 93% 86% 86%
Russia 2% 4% 1% 2%
Other European countries 14% 13% 18% 14%
Middle East 5% 2% 3% 5%
North Africa 4% 1% 0% 3%
Other Africa 5% 1% 1% 4%
Japan 7% 2% 14% 7%
China 31% 15% 25% 27%
India 11% 2% 8% 9%
Other Asia 9% 8% 8% 9%
North America 21% 12% 27% 19%
Brazil 7% 2% 5% 6%
Other South and Central America 5% 2% 1% 4%
Australia/New Zealand 2% 1% 3% 2%
Total 100% 100% 100% 100%
Total N, unweighted 2128 1524 573 4225
Source: Survey 2009, Internationalisation of European SMEs EIM/GDCC (N=9480).
We have also looked into the same issue for the six largest national EU econo-mies separately. It was shown that the percentage of SMEs that import from cross border regions is relatively low in Italy, Spain and UK and above average in Germany and France. In Poland it is remarkably low (18%). About twice as many SMEs in France and Germany import from non-EU countries in Europe than aver-age. Twice as many SMEs in Spain import from Japan than SMEs in any of the other large economies. Countries with more importers than average from China are Spain, France and Italy. For the UK North America is very important (30% vs EU average of 19%). Brazil, Spain and France have the highest share of import-ing SMEs (about twice the EU average). From Table 7 it can be seen that with regard to import, the cross border regions are relatively important for the transport and communication sector, but also for the wholesale sector. Russia is relatively important for the transport and com-munication sector. The retail sector acquires relatively more from European mar-kets. Japan is very important for SMEs in the transport and communication sec-tor. The score for China is by far the highest among SMEs in the wholesale sec-tor: as much as 41% of importing wholesale traders purchase products from China.

37
Table 7 Fifteen regions in the world from which imports are sourced by seven main sec-
tors of activity (as more answers could be given, columns do not total)
Manu-
fac-
turing
Con-
struc-
tion
Whole-
sale
trade
Retail
trade
Trans-
port &
comm.
Busi-
ness
services
Per-
sonal
services Total
Cross border regions 35% 40% 44% 38% 49% 37% 29% 38%
Other European Union 85% 82% 87% 91% 88% 80% 84% 86%
Russia 2% 0% 2% 2% 11% 2% 3% 2%
Other European countries 16% 17% 22% 7% 35% 13% 7% 14%
Middle East 4% 0% 8% 2% 9% 6% 4% 5%
North Africa 2% 3% 8% 0% 10% 3% 0% 3%
Other Africa 4% 5% 4% 5% 6% 2% 1% 4%
Japan 2% 2% 9% 6% 24% 5% 8% 7%
China 28% 22% 41% 19% 37% 28% 13% 27%
India 16% 5% 14% 3% 19% 5% 3% 9%
Other Asia 12% 11% 16% 4% 14% 6% 1% 9%
North America 21% 16% 19% 12% 33% 32% 18% 19%
Brazil 3% 5% 7% 7% 6% 9% 2% 6%
Other South and Central America 4% 4% 7% 2% 6% 6% 1% 4%
Australia/New Zealand 3% 0% 1% 1% 6% 6% 2% 2%
Total 100% 100% 100% 100% 100% 100% 100% 100%
Total N, unweighted 1473 253 505 829 145 640 380 4225
Source: Survey 2009, Internationalisation of European SMEs EIM/GDCC (N=9480).
Table 8 Fifteen regions in the world from which imports are sourced by size of enter-
prise
Micro Small Medium Total
Cross border regions 37% 47% 47% 38%
Other European Union 86% 85% 87% 86%
Russia 2% 4% 6% 2%
Other European countries 14% 18% 23% 14%
Middle East 4% 7% 10% 5%
North Africa 3% 2% 5% 3%
Other Africa 4% 2% 5% 4%
Japan 6% 9% 8% 7%
China 27% 25% 29% 27%
India 8% 11% 14% 9%
Other Asia 8% 14% 16% 9%
North America 20% 16% 23% 19%
Brazil 6% 3% 5% 6%
Other South and Central America 4% 4% 5% 4%
Australia/New Zealand 2% 3% 5% 2%
Total 100% 100% 100% 100%
Total N, unweighted 804 1059 950 2813
Source: Survey 2009, Internationalisation of European SMEs EIM/GDCC (N=9480).
Table 8 again shows clearly - as mentioned with regard to Table 5 - that because of multiple answer categories care needs to be taken when percentages in one column are compared with the percentage for the same region in another col-umn. Micro enterprises on average import from 2.3 of the 15 regions, small en-

38
terprises from 2.5 and medium-sized enterprises from 2.9 regions. For border regions, the difference between 37% for micro and 47% for medium-sized enter-prises is not significant at all (in both cases cross border make up 16% of all re-gions mentioned).
The main differences between size classes that emerge or remain after this cor-rection are: the European Union is more important and European countries out-side EU are less important for smaller SMEs; China, USA and Brazil are relatively important for micro enterprises and India and other Asia are less important for micro firms.
3.3 Foreign direct investments The number of SMEs that invest abroad is very much related to the size of the enterprise. Of all micro enterprises only 2% invested abroad in the period 2006-2008, whereas this is 6% for small and 16% for medium-sized enterprises (aver-age still 2% for all SMEs). This implies that we have only 773 unweighted re-spondents in the overall survey of 9480 SMEs that can provide information on the specific countries in which they invest. On average, the SMEs that do invest have 2.2 foreign partner countries. For micro and small enterprises this is almost 2 countries on average and for medium-sized enterprises 2.4 countries. In total 97 different countries were mentioned by these respondents. Weighted results show a different top 4 - mentioned by about 5 to 7% of all respondents (unweighted 773 enterprises) for each size class: For micro enterprises: Bulgaria, Latvia, Saudi Arabia and Tunisia; For small enterprises: Germany, Poland, UK and China; For medium-sized countries: USA, China, Poland and France. This results in an overall top-4 for all SMEs of China, Germany, Bulgaria and Lat-via.
3.4 Technological cooperation with foreign enterprises 7% of the SMEs in the 33 countries surveyed have technological cooperation with enterprises abroad: micro 7%; small enterprises 12% and medium-sized enter-prises 22%. Germany is by far the country most mentioned, i.e. by 18% of these enterprises. The top-10 of countries is shown in Table 9.
Table 9 The top-10 of countries that SMEs have technical cooperation with
Rank Country %
1 Germany 18%
2 United States 8%
3 France 7%
4 United Kingdom 7%
5 Austria 6%
6 Netherlands 6%
7 Italy 5%
8 Switzerland 4%
9 Spain 4%
10 China 3%
Source: Survey 2009, Internationalisation of European SMEs EIM/GDCC (N=9480).

39
3.5 Subcontracting About 7% of European SMEs have been a subcontractor to a foreign main con-tractor in 2006-2008. The percentage of SMEs that acted as a main contractor for foreign subcontractors is the same (7%)27. Table 10 shows the partner coun-tries for international subcontracting for EU countries and non-EU countries. Table 11 show results by size class.
Table 10 Location of partners in subcontracting relations, by EU and non-EU countries,
(more answers possible)
Location of partners in subcontracting
relationships
For SMEs in EU
Member States
For SMEs in non-EU
countries Total
Own country 92% 74% 91%
EU or EEA Member State 24% 41% 25%
Countries outside the EU/EEA 9% 20% 10%
Total N, unweighted 2530 283 2813
Source: Survey 2009, Internationalisation of European SMEs EIM/GDCC (N=9480).
Table 11 shows that for the EU Member States the larger the SME, the more ar-eas are mentioned: 1.2 for micro enterprises, 1.3 for small and 1.5 for medium-sized enterprises. Larger SMEs much more often have subcontracting relation-ships outside their own country and outside the EU-EEA.
Table 11 Location of partners in subcontracting relations, for EU Member States by size
class (more answers possible)
Location of partners in subcontracting relationships Micro Small Medium-sized Total
Own country 91% 85% 79% 91%
EU or EEA Member State 24% 35% 49% 25%
Countries outside the EU/EEA 9% 14% 20% 10%
Unweighted N 804 1059 950 2813
Source: Survey 2009, Internationalisation of European SMEs EIM/GDCC (N=9480).
3.6 Comparisons with USA and Japan In the USA neighbouring countries are also generally important for SMEs that are internationally active. However in the USA the number of enterprises that export to China is growing especially fast. In 2007 eight times more SMEs exported to China than in 199228. Also Japanese SMEs tend to focus on neighbouring economies for future overseas expansion especially if these are fast developing countries. Vietnam; India; China and Thailand are very important29.
27 EU SMEs and Subcontracting, report by IKEI Spain and EIM The Netherlands commissioned by European Commission, DG Enterprise and Industry, forthcoming.
28 http://ita.doc.gov/td/industry/otea/sme_2007/SME_index_2007.htm
29 JSBRI, Part II, Chapter 4, Section 4, page 133, figure 2-4-36

40
For Japan - as mentioned in Section 2.4.2 - exports increased 62% over the pe-riod 2002-2007 and imports increased 74% in Japan (measured in Yen). Both the increase in imports and in exports is especially triggered by developments in Asia. But still Western Europe contributed 8 percentage points of the 62% export growth in 2002-2007. Also in outward foreign direct investments the share to Europe is considerable, over one third of all FDI in 2006 was destined for Europe.

41
4 Relationship between international activities and other enterprises characteristics
Firstly this chapter analyses the effect of SME characteristics on the probability that these firms are involved in international trade. The location in either small or large economies does matter, the smaller the country the more international-ised are the SMEs. The proximity to national land borders is important for activi-ties in cross border regions, however no sizeable effect on onward internationali-sation could be established. Commercial use of the World Wide Web is associated with being more internationally active. In addition it has been established that generally SMEs start with importing and that export often follows. Finally a detailed analysis is presented of the relationship between internationali-sation and other aspects of the business performance of the enterprises. It is shown that internationally active SMEs are more innovative and report higher employment and turnover growth.
4.1 Introduction In this chapter the relationship between international activities and other busi-ness characteristics is investigated. Two types of characteristics have been dis-tinguished. Firstly, the basic characteristics of the SME, independent from having interna-tional activities but possibly affecting international activities, such as the size of the country in which the SME is located. Secondly, characteristics that on the one hand might influence the chance that an SME has international business activities, but that may also be influenced themselves by the international business activities of the firm. Innovation is a classic example. In as much as correlation between being internationally active and carrying out product or process innovation has often been established in the literature, the debate on the causal relationship is on-going. However in policy circles the idea is that fostering innovation will also positively influence interna-tionalisation and the other way around. Hence in several Member States the sup-port for internationalisation and innovation are being more and more integrated. Several issues are covered in the second half of this chapter that might have such a mutual relationship: use of e-commerce; entry modes of internationalisa-tion; the link with innovation and performance of the enterprise.
4.2 Size of country in terms of area and population
The average SME buys and sells its products and services over a relatively short distance. For many SMEs in large countries the closest border is further away than 50 km. For many SMEs in small countries their main market area, a circle with a radius of 50 km, covers part of the neighbouring country. So, it is likely that relatively more SMEs are engaged in international trade in smaller countries than in large countries.

42
The relationship between the size of the country and the chance that an SME im-ports or exports is analysed by using a classification of countries by size30, i.e. up to 50 000 km2; 100 000 km2; 300 000 km2; 500 000 km2 and up to 800 000 km2. Figure 24 reconfirms the general idea that on average relatively more SMEs are engaged in international trade in smaller countries. Both with regard to import and export these results are significant in a statistical sense.
Figure 24 Percentage of exporting and importing SMEs by size of country (km2)
0%
5%
10%
15%
20%
25%
30%
35%
40%
45%
Up to50000 km2
50000 < 100000 km2
100000 < 300000 km2
300000 < 500000 km2
500000 < 800000 km2
Exports in 2006-2008 Imports in 2006-2008
Source: Survey 2009, Internationalisation of European SMEs EIM/GDCC (N=9480).
Based on the same source we also developed a classification based on the num-ber of inhabitants in each of the 33 countries: countries up to 2 million of inhabi-tants; 5 m.; 10 m.; 20 m.; 50 m. and up to 83 million.
Figure 25 Percentage SMEs, exporting, importing and investing abroad by size of country (population)
0%
10%
20%
30%
40%
50%
60%
70%
Up to 2 million 2 up to 5 million 5 up to 10million
10 up to 20million
20 up to 50million
50 up to 83million
Exports in 2006-2008 Imports in 2006-2008 Invested abroad in 2006-2008
Source: Survey 2009, Internationalisation of European SMEs EIM/GDCC (N=9480).
Figure 25 shows that using the size of the population as a proxy for the size of the national economy, also result in 'smaller economies' having a higher share of internationally active SMEs. Here the reasons are related to the size of the home market.
30 Source: http://europa.eu/abc/european_countries/index_en.htm.

43
The negative correlation between population size and internationalisation is es-pecially regular in the case of the percentage of SMEs with FDI. However, for all three modes the negative association is statistically significant.
4.3 Distance to land borders
The correlation between the distance of the location of an SME from the national (land) border and the chance that SMEs was analysed as well. The initial results of this analysis show a rather modest effect (see Figure 26 for the percentages of importing and exporting SMEs). Only for distances of more than 150 km the share of SMEs that are engaged in importing and exporting is somewhat lower. Still the association with distance to borders and being involved in international trade is statistically significant.
Figure 26 Percentage of exporting and importing SMEs, by distance to land borders*
0%
5%
10%
15%
20%
25%
30%
35%
40%
Up to 50 50 - 149 km 150 km or more
Exports in 2006-2008 Imports in 2006-2008
Note (*): For countries without land borders, i.e. large or small island economies (Ireland, UK,
Iceland, Malta and Cyprus), the average percentage of SMEs (n=1200) with imports is
25% and for exports 20%.
Source: Survey 2009, Internationalisation of European SMEs EIM/GDCC (N=9480).
Checks have been carried out to see how closely import and export to cross bor-der regions is related to the distance between the location of the SME engaged in international trade and a national land border. Figure 27 shows that this rela-tionship is rather strong, especially for export. The closer the exporters are lo-cated to a national border the higher the percentage of exporting SMEs that are serving cross the border regions; if closer than 50 km from the border the per-centage is nearly twice as high as with exporters that are located more than 150 km away from the border. This could indicate 'a stepping stone theory': SMEs located near land borders are more involved in 'cross-border trade' which would lead them to be more active in more distant markets. Yet Table 12 shows that even for 'other European Union' and 'other European countries' there is no such pattern. SMEs located closer to a land border are not more involved in exports to other regions (such as Russia, Middle East, China and Japan). This implies that 'a stepping stone' theory is not supported by the facts.

44
Figure 27 Percentage of exporters having export to cross border regions, by distance be-
tween location of exporter and national land border
53%
51%
32%
69%
39%
46%
0% 10% 20% 30% 40% 50% 60% 70% 80%
Up to 50 km
50 - 149 km
150 km or more
Export Import
Source: Survey 2009, Internationalisation of European SMEs EIM/GDCC (N=9480).
Table 12 Percentage of exporters having export to specific markets, by distance between
location of exporter and national land border
Export regions Up to 50 km 50-149 km 150 km or more Total
Cross border regions 69% 53% 39% 47%
Other European Union 76% 79% 73% 76%
Other European countries 23% 30% 29% 27%
Total 100% 100% 100% 100%
Total N, unweighted 3202 2701 2261 8167
Source: Survey 2009, Internationalisation of European SMEs EIM/GDCC (N=9480).
With regard to import, similar observations can be made: The closer to the bor-der the higher the percentage of importers that import from cross border re-gions. For other markets in the EU the effect is much smaller. It has also been established that importers located near a land border are not importing more frequently from other regions of the world. So with regard to import 'the step-ping stone' theory also needs to be rejected.
4.4 E-commerce
Overall 65% of all SMEs surveyed report to have its own website. The figure ranges from 63% for micro enterprises, 80% for small enterprises to 90% for medium-sized enterprise. Generally similar figures are found for all Member States, but there is some variation. For the six large economies, the average fig-ure for Italy is relatively low at 57% but for Germany it is as high as 82%. By sector, more variation is found. Construction (47%); retail trade (55%) and transport and communication (59%) score below average, whereas business ser-vices (71%); wholesale trade (73%); manufacturing (74%) and personal ser-vices (74%) score above average.

45
Figure 28 shows the use SME give to their enterprise’s website. The figures in the chart refer only to the 65% of all enterprises that indeed have a website31. There are three important messages in Figure 28. Most websites are used for spreading general information on the enterprise. The percentage of SMEs using their website for e-commerce is more moder-
ate: 28% can receive orders on line and 14% have websites that allow com-pleting the entire transaction including payments on line.
The difference by size class is really small. For most uses there is only small size-class effect: larger enterprises score just a bit higher.
Figure 28 Percentage of SMEs using various forms of e-commerce, by enterprise size
(percentage of SMEs with own website)
1% 1%
11%
30%
1% 2%8%
1% 1%7%
82%
59%
27%
14%
85%
65%
15%
88%
66%
27%
15%
0%
10%
20%
30%
40%
50%
60%
70%
80%
90%
100%
Information onfirm on line
All productsshown on-line
Orders can beplaced on line
Orders & pay-ments on line
Only businesson line
Other forms ofe-commerce
No e-commerce
activities
Micro Small Medium Source: Survey 2009, Internationalisation of European SMEs EIM/GDCC (N=9480).
The relevant issue is whether there is a major difference between enterprises that are internationally active and those that only trade on domestic markets.
Figure 29 Percentage of SMEs using various forms of e-commerce, by internationalisation
status (percentage of SMEs with own website)
1% 1%
39%
3% 1%0% 1%
84%
63%
30%
15%
8%
79%
62%
12%6%
80%
55%
24%14%
14%
0%
10%
20%
30%
40%
50%
60%
70%
80%
90%
100%
Information onfirm on line
All productsshown on-line
Orders can beplaced on line
Orders & pay-ments on line
Only businesson line
Other forms ofe-commerce
No e-commerce
activities
International active Plans to become inter. active Nor active, nor plans
Source: Survey 2009, Internationalisation of European SMEs EIM/GDCC (N=9480).
31 So 80% in this chart refers to just over 50% of all SMEs.

46
First, of all internationally active SMEs 75% have their own website, for SMEs with only plans to be active internationally this is 51% and for those only domes-tically active 57%. Figure 29 shows that there is not much difference in the use of various forms of e-commerce between enterprises that are internationally active, only making plans to become active or those not (yet) internationally active. The Probit analysis presented in Annex IV confirms that having the possibility to sell products or services on line is positively correlated with being active in ex-port or import markets when controlled for other effects such as size of firm. The conclusion would be that the Internet has made it easier for SMEs of all sizes to overcome some of the barriers to internationalisation. In fact the relationship be-tween several barriers and the size of firm has weakened because of the Inter-net.
4.5 Entry modes of internationalisation Table 13 presents both weighted and unweighted results on exports, imports and FDI. The weighted results should be used to assess the occurrence of the various modes of internationalisation with European SMEs.32. Table 13 shows that the 40% of SMEs that are active in importing, exporting and/or FDI can be divided in three main groups: only importing and exporting 15%; only importing 13% and only exporting 9%. This 40% is lower than the overall 44% of SMEs that are engaged in any form of international activity as presented in Figure 3 because here international cooperation and specific sub-contractor relationships are not included.
Table 13 Unweighted number and weighted percentage of SMEs with various international
business activities in 2006-2008
Frequency Percent
Mode of internationalisation Not weighted Weighted
Only import 1470 13%
Only export 830 9%
Only FDI 160 1%
Only import and export 2300 15%
Only import and FDI 74 -
Only export and FDI 90 -
Import and export and FDI 449 1%
No import, or export, or FDI 4107 60%
Total 9480 100%
Note: - denotes less than 0.5%.
Source: Survey 2009, Internationalisation of European SMEs EIM/GDCC (N=9480).
32 The unweighted frequencies are presented to show which combinations can be further explored in the remaining part of this chapter. There are for example sufficient observations to study whether enterprises that only export and import first tend to start with exporting or with import-ing (n=2300). However the number of observations of enterprises that are only active in import-ing and FDI is rather limited (n=74).

47
All enterprises that reported that they were engaged in importing, exporting and foreign direct investments (FDI) have been asked in which year they started with each mode of internationalisation. The average start year across all enterprises: importing 1994 exporting 1995 having foreign subcontractors 1998 acting as subcontractor to foreign firm 1999 technical cooperation 2000 foreign direct investment 2003 For the 2300 enterprises that are both importing and exporting (see Table 13) it has been checked when they started with import and export (weighted percent-ages): 39% started first with importing; 18% started first with exporting and 42% started with import and export in the same year. This is an interesting result, as import is not always considered to be a serious step in the internationalisation process of firms. Many support measures are fo-cused on supporting the first attempts to export. It seems however that through importing, enterprises can learn how to work in the international market, with international clients, other cultures and languages. These experiences are very useful when it comes to export opportunities; the next step to exporting is then easier to make. Only about 2% of all surveyed European SMEs are investing abroad. Half of these enterprises are also engaged in import and/or export and nearly all of them started with importing and/or exporting before starting with investments.
4.6 Link between internationalisation and innovation SMEs can innovate by introducing new products or services to the market that they either develop themselves or not. Another way for SMEs to innovate is by introducing process innovations. In this section we will analyse in the link be-tween such innovation activities and internationalisation33. The results confirm that internationally active firms introduce product/service and process innovations more often than non-internationally active firms. Almost half of the internationally active firms introduced new products or services in the past three years (overall average only 32%) and in the same period almost one third introduced process innovations (overall average 22%). 60% of the interna-tionally active SMEs that introduced new products or services developed these new products or services by themselves. It is confirmed that a firm's new product or service development may both be necessary to enter foreign markets as well as be a consequence of a firm's for-eign market activities. The latter effect provides support for the "learning-by-internationalisation" hypothesis which so far received little support in the litera-ture based on econometric analysis. In particular foreign investors need both in-novations to build competitive advantage in foreign markets and innovate as a consequence of their involvement in foreign markets. Interestingly, the most
33 In the Probit analysis presented in Annex IV four innovation variables are included that prove to be positively and significantly correlated with export and import by SMEs, even after controlling for variables such as size class or sector.
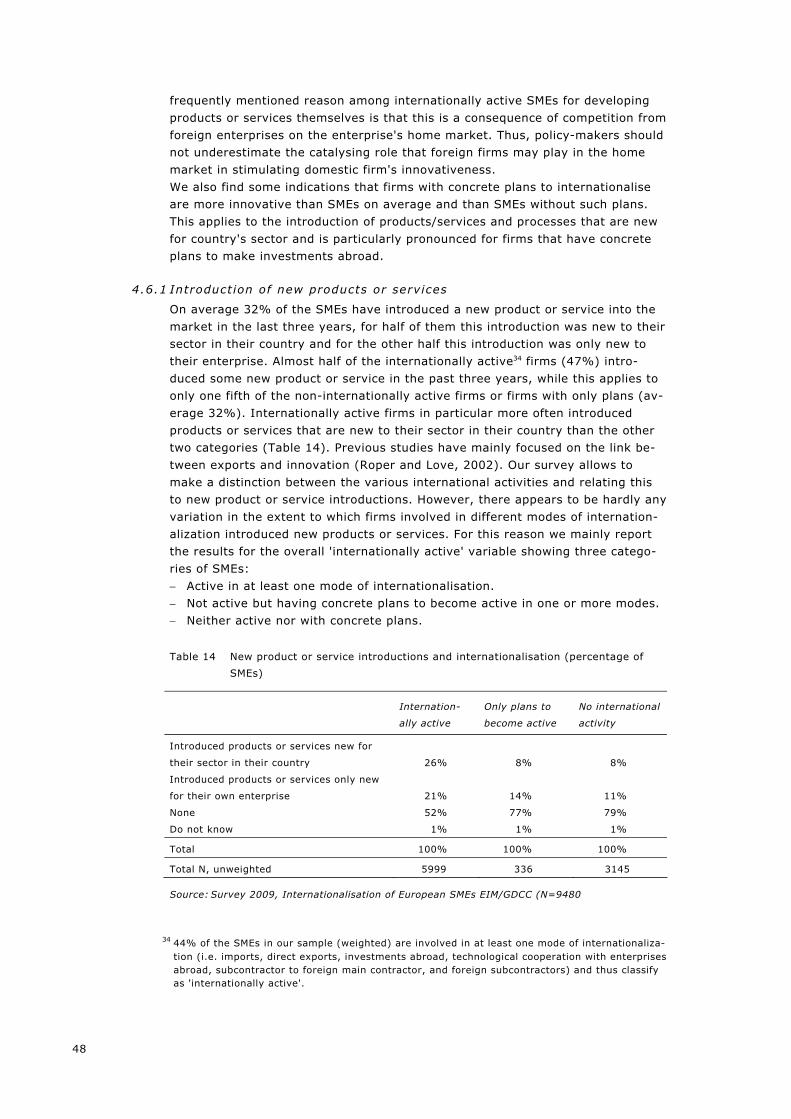
48
frequently mentioned reason among internationally active SMEs for developing products or services themselves is that this is a consequence of competition from foreign enterprises on the enterprise's home market. Thus, policy-makers should not underestimate the catalysing role that foreign firms may play in the home market in stimulating domestic firm's innovativeness. We also find some indications that firms with concrete plans to internationalise are more innovative than SMEs on average and than SMEs without such plans. This applies to the introduction of products/services and processes that are new for country's sector and is particularly pronounced for firms that have concrete plans to make investments abroad.
4.6.1 Introduction of new products or services
On average 32% of the SMEs have introduced a new product or service into the market in the last three years, for half of them this introduction was new to their sector in their country and for the other half this introduction was only new to their enterprise. Almost half of the internationally active34 firms (47%) intro-duced some new product or service in the past three years, while this applies to only one fifth of the non-internationally active firms or firms with only plans (av-erage 32%). Internationally active firms in particular more often introduced products or services that are new to their sector in their country than the other two categories (Table 14). Previous studies have mainly focused on the link be-tween exports and innovation (Roper and Love, 2002). Our survey allows to make a distinction between the various international activities and relating this to new product or service introductions. However, there appears to be hardly any variation in the extent to which firms involved in different modes of internation-alization introduced new products or services. For this reason we mainly report the results for the overall 'internationally active' variable showing three catego-ries of SMEs: Active in at least one mode of internationalisation. Not active but having concrete plans to become active in one or more modes. Neither active nor with concrete plans.
Table 14 New product or service introductions and internationalisation (percentage of
SMEs)
Internation-
ally active
Only plans to
become active
No international
activity
Introduced products or services new for
their sector in their country 26% 8% 8%
Introduced products or services only new
for their own enterprise 21% 14% 11%
None 52% 77% 79%
Do not know 1% 1% 1%
Total 100% 100% 100%
Total N, unweighted 5999 336 3145
Source: Survey 2009, Internationalisation of European SMEs EIM/GDCC (N=9480
34 44% of the SMEs in our sample (weighted) are involved in at least one mode of internationaliza-tion (i.e. imports, direct exports, investments abroad, technological cooperation with enterprises abroad, subcontractor to foreign main contractor, and foreign subcontractors) and thus classify as 'internationally active'.

49
On average 61% of the SMEs with new product or service introductions devel-oped the new products or services by themselves. Non-internationally active firms developed the new products or service themselves at a slightly higher rate than the internationally active firms (63% for SMEs without any international ac-tivity, 73% for those with concrete plans to become active). Focussing on SMEs that developed the new products and services themselves, there are two remarkable results when looking at the different modes of interna-tionalization (see Table 15).
Table 15 Percentage of SMEs that developed the new product or service themselves, by
mode of internationalisation
Active in this mode
Yes No
Import 53% 68%
Direct export 63% 59%
Investing abroad 74% 60%
Technological cooperation with enterprise abroad 64% 60%
Subcontractor to foreign main contractor 62% 61%
Having foreign subcontractors 63% 61%
All SMEs 61%
Source: Survey 2009, Internationalisation of European SMEs EIM/GDCC (N=9480), only with
subcontracting the number of observations are somewhat lower i.e. about 750.
First, it appears that importing firms less often developed the products them-selves than non-importers (53% versus 68%). Possibly this is explained by the fact that importers may often purchase or adopt new products or services from abroad. Second, and to the contrary, firms with foreign investments much more often develop the new products/services themselves than firms without invest-ments abroad (76% versus 60%). Foreign investors may have a strong inclina-tion to develop new products or services by themselves to avoid that knowledge spills over to other enterprises in the foreign markets in which they are located. In relation to firms that have concrete plans to start international activities (see Figure 30), it appears that those with concrete plans to internationalise intro-duced products or services that are new for their sector in their country more of-ten than firms without plans to internationalise. This is in particular true for firms that plan to invest abroad (33% vs 15%). However, when looking at introductions that are new to the enterprise most firms with plans to internationalise score close to the overall average (16%). Firms with plans to import score substantially below this average (9%). When it comes to introductions that are only new to the enterprise there are no differ-ences between those with concrete plans to invest abroad and those without such plans; and only a minor difference between those with concrete plans to become a subcontractor to foreign firms and those without such plans.
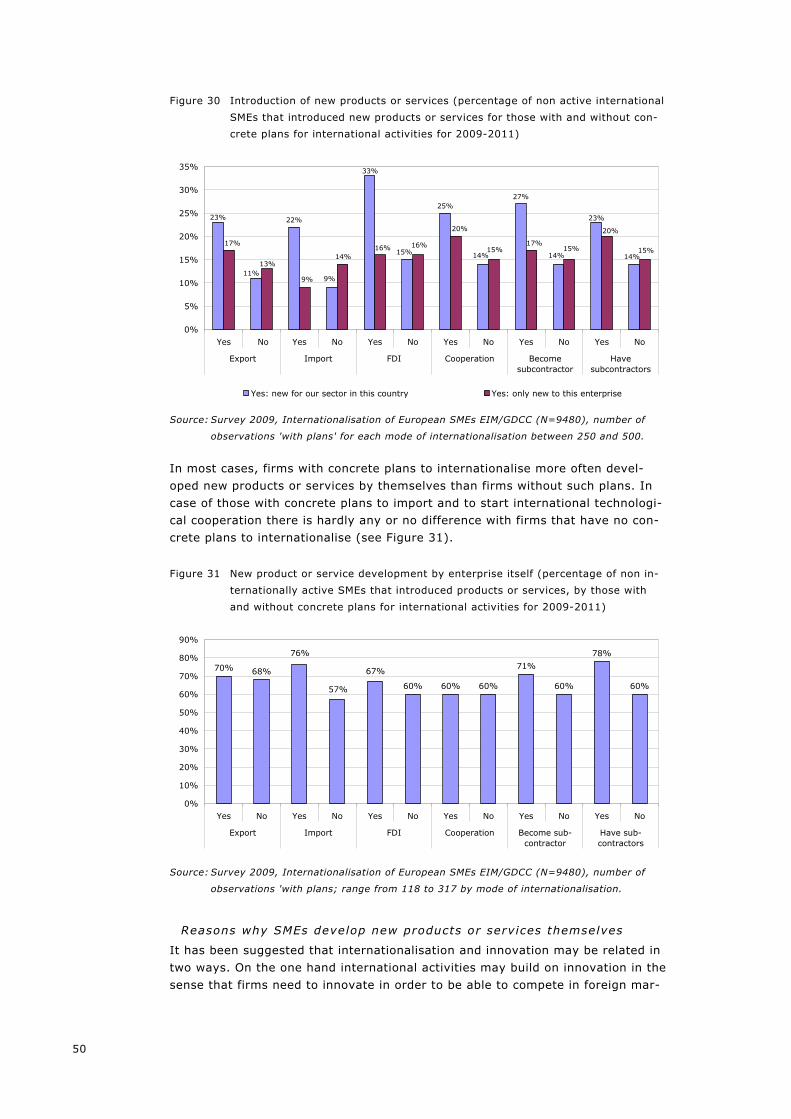
50
Figure 30 Introduction of new products or services (percentage of non active international
SMEs that introduced new products or services for those with and without con-
crete plans for international activities for 2009-2011)
22%
25%27%
14%
23%
14%14%15%
33%
9%11%
23%
15%
20%
15%17%
15%
20%
16%16%14%
9%
13%
17%
0%
5%
10%
15%
20%
25%
30%
35%
Yes No Yes No Yes No Yes No Yes No Yes No
Export Import FDI Cooperation Becomesubcontractor
Havesubcontractors
Yes: new for our sector in this country Yes: only new to this enterprise
Source: Survey 2009, Internationalisation of European SMEs EIM/GDCC (N=9480), number of
observations 'with plans' for each mode of internationalisation between 250 and 500.
In most cases, firms with concrete plans to internationalise more often devel-oped new products or services by themselves than firms without such plans. In case of those with concrete plans to import and to start international technologi-cal cooperation there is hardly any or no difference with firms that have no con-crete plans to internationalise (see Figure 31).
Figure 31 New product or service development by enterprise itself (percentage of non in-
ternationally active SMEs that introduced products or services, by those with
and without concrete plans for international activities for 2009-2011)
70% 68%
60% 60% 60%
71%
60%
78%
60%
67%
57%
76%
0%
10%
20%
30%
40%
50%
60%
70%
80%
90%
Yes No Yes No Yes No Yes No Yes No Yes No
Export Import FDI Cooperation Become sub-contractor
Have sub-contractors
Source: Survey 2009, Internationalisation of European SMEs EIM/GDCC (N=9480), number of
observations 'with plans; range from 118 to 317 by mode of internationalisation.
Reasons why SMEs develop new products or services themselves
It has been suggested that internationalisation and innovation may be related in two ways. On the one hand international activities may build on innovation in the sense that firms need to innovate in order to be able to compete in foreign mar-

51
kets (Karagozoglu and Lindell, 1998; Roper and Love, 2002). On the other hand internationalisation may lead to innovation as a result of so called "learning-by-export/internationalisation" effects (Branstetter, 2006; Chuang, 1998). Such learning effects can occur e.g. because foreign market activities provide firms with access to knowledge and technologies that are not available in the domestic market. Previous studies have mainly used econometric analysis to study the link between innovation and internationalisation (Hessels, 2008; Lachenmaier and Wöβmann, 2006; Roper and Love, 2002; Wakelin, 1998). Based on such studies, it is clear that there is a link between innovation and internationalisation (at least for exports on which most studies focus), however it is often difficult to disentangle directions of causality35. In addition, innovation may also be a consequence of foreign competition. For-eign competitors may motivate domestic SMEs to innovate, e.g., to deal effec-tively with foreign competition but also because technological or foreign market spill over effects may take place from foreign firms to SMEs. SMEs increasingly encounter foreign competition in their home markets. Therefore in the survey it was also asked whether the new product or service development was a conse-quence of competition from foreign companies on the enterprise's home market. On average 32% of the SMEs that developed products or services by themselves indicate that such innovations were necessary for entering foreign markets. Table 16 shows that internationally active firms score above this average (37%), while non-internationally active firms score below this average (19%36). But the highest score is found with the small group of enterprises that have concrete plans to become active (60%, unweighted n = 126). When making a distinction between the different modes of internationalisation (not reported in the table) firms that invested abroad (45%, unweighted n=528) and firms with technologi-cal cooperation abroad (42%) indicate that the innovation was necessary for for-eign market access. While overall firms with international activities more often indicate that they developed new products or services themselves to access new foreign markets than firms with no such activities, there are only small differ-ences between firms with foreign subcontractors and firms with no foreign sub-contractors. 22% of the SMEs that developed products or services by themselves indicate that this was a consequence of activities in foreign markets. It is no surprise that firms with recent international activities more often indicate that this was the case than firms with no such activities. When looking at the different modes of internationalisation (not reported in the table) it appears that in particular firms that invested abroad (53%) and to a lesser extent firms that are a subcontractor to a foreign main contractor (43%) are most often triggered to innovate by for-eign market activities. Thus, among the different activities foreign investments
35 Studies that have been able to deal satisfactorily with causality problems have found support for the hypothesis that innovation leads to internationalisation. However, so far little support has been found for the "learning-by-internationalisation" effect. As a means to deal with the issue of direction of causality between internationalisation and innovation we have asked managers of SMEs to self-assess whether innovation was necessary for them in order to be able to enter for-eign markets or whether innovation occurred as a consequence of their international activities.
36 The distinction between internationally active or not active is made for the reference period 2006-2008, enterprises that were not internationally active may have had international activities before, made efforts to become active or have just recently in 2009 become active.

52
and being a subcontractor to foreign firms seem to be the most important routes for "learning by internationalisation". Finally, for 35% of the SMEs the development of new products and services by themselves was a consequence of foreign competition in their home market. Again, firms with international activities more often indicate this to be the case, in particular firms that are subcontractor to a foreign main contractor (53%). The only exception are firms that invested abroad, they do not differ from firms with no foreign investment activities (both 35%).
Table 16 Reasons for developing new products or services by itself and international ac-
tivities (percentage of SMEs that introduced new products or services, more
than one answer possible)
Internationally
active
Only plans to
become active
No international
activity
Necessary to access new markets in
other countries 37% 59% 19%
Consequence of our activities in foreign
markets 30% 9% 7%
Consequence of competition from foreign
companies on enterprise's home market 44% 20% 19%
Total N, unweighted 3248 126 725
Source: Survey 2009, Internationalisation of European SMEs EIM/GDCC (N=9480).
Figure 32 Reasons for developing new products/services by itself and concrete plans for
international activities in the near future (2009-2011)
54%
65%
21%
51%
35%
20%
29%
43%
60%
52% 53%
44%
56%
48%
38%
46%
38%
48%
0%
10%
20%
30%
40%
50%
60%
70%
Export Import FDI Coop. Becomesubcontractor
Havesubcontractor
Necessary to access new markets in other countriesConsequence of our activities in foreign marketsConsequence of competition of foreign companies on enterprise’s home market
Source: Survey 2009, Internationalisation of European SMEs EIM/GDCC (N=9480).
Figure 32 shows the reasons why firms with concrete plans to internationalise developed new products or services by themselves. These three reasons all score much lower with firms without any concrete plans. It appears that firms that have concrete plans to invest abroad and - to a lesser extent- firms that have concrete plans to start direct exports and imports developed new products or service themselves because this is needed to access foreign markets.

53
Furthermore, firms with concrete plans to invest abroad indicate more often than firms with concrete plans for other international activities that the development of new products or services was a consequence of foreign market activities. Also, firms with plans for international activities indicate much more often than firms with no such plans that the development of new products or services was the consequence of foreign competition in the home market.
4.6.2 Process innovation
On average 22% of SMEs introduced some process innovation in the last three years. For 7% this innovation was new for the sector in their country, for 15% the innovation was only new for their enterprise. Table 17 reveals that SMEs with international activities score a little above these averages while the reverse is true for non-internationally active firms and those with plans only. While on av-erage firms with international activities more often introduced process innova-tions that are new to the sector, a distinction into the different modes of interna-tionalisation (not reported in the table) reveals that this is not the case for firms that are subcontractors to a foreign main contractors. Furthermore, for all the different modes of internationalisation it is found that firms with international ac-tivities more often introduced process innovations that are new to the enterprise than those with no international activities, this is in particular true for firms that have technological cooperation with enterprises abroad (28%) and for firms with foreign subcontractors (26%).
Table 17 Process innovations and internationalisation
Internationally
active
Only plans to
become active
No international
activity
Yes: new for our sector in this country 11% 5% 3%
Yes: only new to this enterprise 19% 13% 11%
No 68% 79% 85%
Do not know 2% 2% 1%
Total N, unweighted 5999 336 3145
Source: Survey 2009, Internationalisation of European SMEs EIM/GDCC (N=9480).
When looking at firms that have concrete plans to start international activities as displayed in Figure 33, it appears that those with concrete plans to international-ise have more often introduced process innovations that are new to the sector in their country. However, when looking at introductions that are new to the enter-prise there are hardly any differences between those with concrete plans for in-ternational activities and firms with no such plans. One exception is that those with concrete plans to start imports have a less often introduced process innovations than those without concrete plans to import.

54
Figure 33 Process innovations and concrete plans for international activities in 2009-2011
21%
15%
12%13%
15%
5%
19%
6%5%
6%
15%
24%
4%
14%
4%
11%
14%15%14%
17%
14%15%15%
8%
0%
5%
10%
15%
20%
25%
Yes No Yes No Yes No Yes No Yes No Yes No
Export Import FDI Cooperation Become sub-contractor
Have sub-contractors
Yes: new for our sector in this country Yes: only new to this enterprise
Source: Survey 2009, Internationalisation of European SMEs EIM/GDCC (N=9480), number of
observations 'with plans' for each mode of internationalisation between 250 and 500.
4.7 Effect on performance of enterprise Economic research is not really conclusive with regard to the correlation between being internationally active and enterprise performance, for example in terms of growth. Therefore it is interesting to see what can be derived from this survey37. Entry modes may vary considerably with respect to benefits and costs (Anderson and Gatignon, 1986). But the potential merits of exporting at the firm level are well reported in the literature, e.g. exports may lead to sales growth, employ-ment growth and to improved financial performance (Zahra, Neubaum and Huse, 1997; Daniels and Bracker, 1989)38. Weighted results of our survey show that for over two thirds of all SMEs em-ployment in 2008 was equal to that in 2007 (69%), 14% of all SMEs recorded an increase and 15% a decrease (less than 3% of the respondents did not report the employment in 2007).
37 The survey was carried out in early 2009. EUROSTAT reports a relatively steady growth in em-ployment in EU27 over 2007 and in the first quarter of 2008 (2008-Q1). Employment growth was close to zero in 2008-Q2 and reached negative figures in 2008-Q3 and 2008-Q4. Really se-rious shrinking employment was reported for the first quarter of 2009. As a consequence the seasonally adjusted unemployment series as reported in Eurostat newsrelease euroindicators 112/2009 of 31 July 2009, show that unemployment after being steady around 9% for some years decreased to about 6.7% in the period from 2005-Q2 to 2008-Q1, to start again rapidly increasing in 2008-Q2 to reach again almost 9% unemployment at the end of 2009-Q2.
38 In the economics literature it is considered a stylized fact that exporters perform better than non-exporters (Bernard and Jensen, 1999). However there is some debate about whether better firms become exporters or whether firms also become better through exporting (or both) (Greenaway, Girma and Kneller, 2004). The current body of research seems to mainly support that the best firms self-select into exporting, while there is more limited support for the fact that firms perform better through exporting (Lopéz, 2005). Furthermore, while a positive link between export and firm performance is well established, little is known about the link between other modes of internationalisation and firm performance.

55
Overall the SMEs interviewed reported an employment growth from 2007 to 2008 of almost 4%39. The following statistically significant differences (at 99% level) were obtained: Exporting SMEs 7% employment growth versus SMEs without export 3%. Importing SMEs 8% employment growth versus SMEs without import 2%. SMEs with FDI 16% employment growth versus SMEs without FDI 4%. Comparing groups of SMEs that are involved in several modes of internationali-sation with those that are not, brings about even larger differences: SMEs both importing and exporting 10% employment growth; others 3%; SMEs that are active in all modes (import, export, FDI, technical cooperation
and subcontracting) 6% employment growth versus others 2%. Combining all, both active in one of these internationalisation modes and those SMEs that have concrete plans to become active, we arrive at an employment growth of 7% versus only 1% for those SMEs without any actual or planned in-ternational activities. Enterprises were also asked to report the development of their turnover in 2008 compared to 2007 in five classes. The overall results are presented in Table 18.
Table 18 Turnover of 2008 compared to turnover of 2007
Percentage of SMEs
Decreased quite a lot (> 20%) 10%
Decreased (5 to 20%) 21%
More or less stable (between -5% and 5%) 28%
Increased (5 to 20%) 24%
Increased quite a lot (> 20%) 8%
Do not know/no answer 8%
Total 100%
Source: Survey 2009, Internationalisation of European SMEs EIM/GDCC (N=9480).
Figure 34 shows that the positive association between being internationally ac-tive and reporting high turnover growth is especially large for SMEs that invest abroad, SMEs that are subcontractors of a foreign enterprise and SMEs that have foreign subcontractors. For these categories the percentage of enterprises re-porting that turnover increased quite a lot from 2007 to 2008 is about 20%, against an average of only 8%.
39 Obviously only those SMEs that still existed early 2009 were interviewed, so those that went out of business are missing, resulting in some overestimation of employment growth. The survey re-sults provide a possibility to analyze the link between internationalisation and firm growth for a large number of countries, and to consider other modes of internationalisation than exporting. However, the survey results are not very suitable to analyse the direction of causality between internationalisation and firm growth.

56
If we consider all reported turnover increases then enterprises that invested abroad and that had technological cooperation in the reference years 2006-2008 show especially positive results: increased and increased a lot, together more than 50% compared to the average of 33%40.
Figure 34 Change in turnover 2007-2008 of European SMEs by mode of internationalisa-
tion in the period 2006-2008
10%
9%
7%
7%
8%
10%
10%
23%
22%
17%
18%
25%
22%
21%
24%
24%
15%
19%
17%
21%
28%
26%
27%
33%
36%
27%
25%
24%
13%
14%
19%
15%
19%
18%
8%
0% 10% 20% 30% 40% 50% 60% 70% 80% 90% 100%
Exports
Imports
Invested abroad
Technological cooperationwith enterprises abroad
Subcontractor to a foreignfirm
Having foreignsubcontractors
Total
Decreased quite a lot (> 20%) Decreased (5 to 20%)More or less stable (between -5% and 5%) Increased (5 to 20%)Increased quite a lot (> 20%)
Source: Survey 2009, Internationalisation of European SMEs EIM/GDCC (N=9480).
40 In the White Paper on SMEs in Japan that was discussed in Chapter 4, the link between interna-tional operations and labour productivity was examined. It is concluded from empirical data that (i) the higher the level of labour productivity, the wider is an enterprises' sales territory (rang-ing from within own city to foreign markets) and (ii) For wholesale trade and manufacturing it was found that enterprises with a high level of labour productivity have a higher percentage of direct exports. Whereas a positive correlation between exporting and labour productivity is es-tablished for SMEs, JSBRI is not able to give an indication on the direction of the casual effect JSBRI, part II, chapter 1, section 3, page 34, figures 2-1-21 and 2-1-22.

57
5 Perceived barriers for internationalisation
This chapter analyses the barriers that SMEs perceive with regard to interna-tional business activities, whether by those firms that are already active or by those firms that have concrete plans to become active. A distinction is made be-tween internal barriers related to the capabilities of the firm and external barri-ers related to the business environment. The two types of barriers are closely re-lated: the bigger the enterprise's resources the easier it is to deal with external barriers. The barriers perceived as most relevant are: price of own products, lack of capital and information, high cost of internationalisation and inadequate public support.
5.1 Introduction
We have seen in Chapter 5 that internationalisation can result in various merits at firm-level which may eventually translate into improved economic perform-ance at national and European level. However sometimes international transac-tions do not take place because firms are not able to overcome the barriers as-sociated with internationalisation. SMEs may for example be kept from interna-tionalising due to a lack of financial and human capital resources and because they are vulnerable to conditions and changes in the external environment (Knight, 2000; Jarillo, 1989). Also when SMEs have taken the decision to inter-nationalise they may still be vulnerable to constraints during the internationalisa-tion process. Therefore, it is important to gain insight in the type of barriers that SMEs may encounter either before or during internationalisation. This makes it possible to target support to the specific needs of SMEs. Enterprises that are not yet active in the international market may underesti-mate some barriers and overestimate others. Because of these differences in perception of barriers between firms with little experience and firms with more international business experience, due consideration needs to be given to the in-ternational experience of firms when designing and developing business support services. It is important to mention that all information on barriers resulting from the sur-vey that is reported in the remainder of this chapter actually refers to the per-ception of barriers as expressed by SMEs themselves not necessarily to actual barriers. Still, perceived barriers are important as they may cause SMEs to re-frain from entering foreign markets, while in reality the barriers are less impor-tant than perceived a priori. Information and awareness campaigns may play a useful role in such situations, just as creating opportunities for starters on inter-national markets to learn from experienced entrepreneurs41.
41 For example an export club organised by Chambers of Commerce.

58
5.2 Internal barriers
Internal barriers are related to the characteristics of the enterprise itself, e.g. lack of capabilities. Average scores - for internationally active SMEs only - are shown in Figure 35 by size of firm on a scale ranging from 1 'not at all important' to 5 'very important'. About 5% state that they have no barriers at all and another 6% (ranging from 3% on language barriers to 12% on high cost of internationalisation) answer that they don't know how important their barriers are.
Figure 35 Importance of internal barriers for internationalisation, by size class of SMEs,
average score on scale 1 (not important) to 5 (very much important), for inter-
nationally active SMEs only
2,8
2,8
2,4
2,4
2,4
2,2
2,5
2,5
2,3
2,5
2,2
2,3
2,7
2,5
2,2
2,4
2,1
2,5
2,8
3,02,9
2,0 2,2 2,4 2,6 2,8 3,0 3,2
Price of firm's products
High cost of internalisation
Quality of firm's products
Qualified personnel
Specifications of firm'sproducts
Language
Other barriers
Micro Small Medium
Source: Survey 2009, Internationalisation of European SMEs EIM/GDCC (N=9480).
The most important barrier in the perception of SMEs is price of the products or services of the enterprise. This of course relates to the general price level in the home market and the level of efficiency of the firms; so specific internationalisa-tion support measures are not likely to address this. However integrating meas-ures aimed at increasing the efficiency of firms, either by combining internation-alisation and innovation policy or by stimulating efficient sourcing of inputs, per-haps by direct imports, may prove effective. The second most important barrier is the high cost of internationalisation. Here a range of support measures may be relevant such as making information on in-ternational markets easily accessible for SMEs or subsidizing trade missions to facilitating participation in foreign trade fairs. For internal barriers the differences by size class are generally quite small. Only in the case of 'qualified personnel' there is a distinct size class pattern: the smaller the enterprise the more important is this barrier ('lack of sufficiently qualified personnel'). There are differences between SMEs already involved in international activities and those SMEs that are not yet internationally active but are making concrete plans to start. Figure 36 clearly shows that all the barriers listed are much more important in the perception of SMEs that only have plans to become internationally active

59
than for those SMEs that are already active42. On the scale from 1 (not important at all) to 5 (very important), the absolute difference is on average 0.50 point, or - considering the average scores - more than 20% higher for SMEs that are not yet internationally active but have concrete plans to start than for SMEs already having international activities.
Figure 36 Importance of internal barriers for internationalisation, average score on scale 1
(not important) to 5 (very important), for SMEs that are active and SMEs that
have plans to become internationally active
2,8
2,8
2,4
2,4
2,4
2,2
2,5
3,1
3,1
3,1
2,9
3,1
2,9
3,1
2,0 2,2 2,4 2,6 2,8 3,0 3,2
Price of products
High cost of internalisation
Quality of products
Qualified personnel
Specifications of products
Language
Other barriers
Having international activities Only plans for international activities
Source: Survey 2009, Internationalisation of European SMEs EIM/GDCC (N=9480).
The significant gap between the importance attributed to many barriers by en-terprises already active in international markets and those enterprises that have only plans to enter these markets indicates a further need for information and awareness rising among interested enterprises. Some barriers might be per-ceived to be higher than supported by the experience of other SMEs.
5.3 External barriers For SMEs as a whole the difference between the importance of these external barriers in EU-EEA markets and on third markets is presented in Figure 37. Lack of capital and lack of adequate public support score even higher with reference to EU-EEA markets than to extra EU-EEA markets. This might be related to the fact that generically somewhat larger and more experienced SMEs are active in third markets.
42 The number of SMEs in the survey that have no international activities but concrete plans to start in the near future is relatively small (n=336). Consequently results by size class are not very robust. However these results suggest that small enterprises, i.e. those with 10-49 em-ployed people have a somewhat different perception of problems compared to micro and me-dium-sized enterprises. With language, and with specification and price of their products or ser-vices the score is somewhat lower, whereas for quality of own products and high cost of interna-tionalisation the scores are much higher.

60
Figure 37 Barriers related to the business environment for the enterprises in EU-EEA mar-
kets and non-EU-EEA markets (percentage of SMEs that state important)
54%
36%
30%
23%
23%
44%
40%
44%
36%
35%
14%
47%
44%
9%
20%
26%
39%
18%
29%
28%
0% 10% 20% 30% 40% 50% 60%
Lack of capital
Lack of adequate publicsupport
Lack of adequateinformation
Costs or difficult paper workfor transport
Other laws and regulationsin foreign countries
Tarrifs or other tradebarriers in foreign market
Cultural differences (incl.business culture)
Tarrifs or other tradebarriers in home country
Other external barries
No external barriers
Important on EU-EEA markets Important on non EU-EEA markets
Source: Survey 2009, Internationalisation of European SMEs EIM/GDCC (N=9480).
As with internal barriers, the differences by size class are fairly small for most external barriers in EU-EEA markets. Figure 38 shows two major exceptions: other laws and regulations in foreign countries are perceived to be more impor-tant by the larger SMEs and lack of capital is especially high with micro enter-prises. The perceptions of SMEs that only have plans to enter international markets have been compared to those of SMEs that are already active. For most external issues with regard to EU-EEA markets the SMEs with plans only feel that the fol-lowing issues are more important: lack of adequate information; cost of difficult paperwork and cultural differences. Lack of adequate public support and other laws and regulations are only slightly higher with SMEs with plans only. Finally tariffs and other trade barriers score even lower with SMEs with plans only. Figure 39 shows that also with regard to third markets the differences by size class are fairly small. The same two exceptions apply: other laws and regulations in foreign countries score higher with larger SMEs, lack of capital is more impor-tant for micro firms. In conjunction, Figure 38 and Figure 39 show that the patterns for EU-EEA and non-EU-EEA markets are rather similar, although tariff and other trade barriers in foreign markets, other laws and regulations in foreign countries, tariffs or other trade barriers in home country and cultural differences score somewhat lower with regard to EU-EEA markets.

61
Figure 38 Barriers related to the business environment for the enterprises in EU-EEA mar-
kets, by size class (percentage of SMEs that state important)
0% 10% 20% 30% 40% 50% 60%
Lack of capital
Lack of adequate public support
Lack of adequate information
Costs or difficult paper work for transport
Other laws and regulations in foreign countries
Tarrifs or other trade barriers in foreign market
Cultural differences (incl. business culture)
Tarrifs or other trade barriers in home country
Other external barries
No external barriers
Micro Small Medium
Source: Survey 2009, Internationalisation of European SMEs EIM/GDCC (N=9480).
Figure 39 Barriers related to the business environment for the enterprises on non-EU-EEA
markets, by size class (percentage of SMEs that state important)
0% 10% 20% 30% 40% 50% 60%
Lack of adequate information
Lack of capital
Lack of adequate public support
Costs or difficult paper work for transport
Other laws and regulations in foreign countries
Tarrifs or other trade barriers in foreign market
Tarrifs or other trade barriers in home country
Cultural differences (incl. business culture)
Other external barries
No external barriers
Micro Small Medium
Source: Survey 2009, Internationalisation of European SMEs EIM/GDCC (N=9480).
With regard to non-EU-EEA markets, SMEs with plans tend to attach a higher value to external barriers in comparison to active SMEs. However tariffs and other trade barriers and other laws and regulations score much lower with SMEs with plans only.

62
5.4 Comparisons with USA and Japan
5.4.1 USA
According to The National Small Business Poll43, the most frequent problem limit-ing small manufacturers from increasing foreign sales is difficulty locating sales prospects and finding a reliable foreign representative to help. Few exporting manufacturers rely upon government programmes for export sales assistance. Considering several organisations 23% have used public support designed to promote exports.
5.4.2 Japan
The most important barrier reported by Japanese SMEs that plan to start export-ing is identifying or 'securing' outstanding partner enterprises, linked to the SME's limited management resources. This barrier is faced by 57% of SMEs that want to start exporting44 and by 24% of SMEs already exporting. Among the top three barriers for Japanese SMEs is dealing with local business customs, practices etc. (22% among exporting Japa-nese SMEs, 34% among Japanese 'planners'). A similar issue covered in the sur-vey in Europe, cultural difference (business culture) scores just over 20% among SMEs in Europe. Lack of adequate information is important for nearly 44% of the SMEs in Europe, this issue is probably (also) covering, to a large extend, issues described in the Japanese survey as ascertain the needs of local enterprises and residents abroad (18% for active SMEs, as much as 42% for 'planners' among Japanese SMEs).
43 Volume 4, Issue 1 2004 (ISSN - 1534-83260), based on data collected from national samples of small-business employers. Report available at: http://www.411sbfacts.com/sbpoll.php?POLLID=0005&KT_back=1.
44 JSBRI, part II, chapter 4, section 2, page 119-121 and figure 2-4-13 [1] and [2].

63
6 Support programmes
This chapter focuses on awareness and use of public programmes that might support SMEs in getting access to foreign markets. Two important policy conclu-sions have emerged: (i) Whereas smaller firms are at least as exposed to barri-ers as larger firms - in most cases even more - larger enterprises are more aware of the support measures and use these support measures more often. (ii) The vast majority or internationally active enterprises state that they do not use public support measures.
6.1 Introduction In the past decades policy makers have become increasingly aware that interna-tionalisation is more than only exports, and consequently support measures have been broadened towards other forms of internationalisation. However, a recent analysis45 of European policy measures states that more than 70% of the inter-nationalisation programmes are still focusing on exports. The recent OECD study Removing barriers to SME Access to international mar-kets shows that most programmes in OECD countries focus on access to mar-kets, i.e. gaining initial access to individual markets by, for example, providing market information, market analysis or organising trade fairs. A small part of the support programmes (9%) focus on the removal of interna-tional trade barriers and improving the business environment of the home mar-ket. Improvements in the domestic taxation system and providing a good R&D environment are examples of business environment programmes46. Chapter 2 of this report showed that 44% of the SMEs are active in the interna-tional market. Although the share of SMEs with direct import (29%) is slightly higher than SMEs with direct export (26%), the government programmes are mainly focused on export support. The Member Economy Policymaker Survey of the OECD shows, that 72% of the support programmes focus on export and 22% of the support programmes on several international activities, including export. Only 7% of the support programmes are not focused on export. An explanation for this strong focus on export might be the belief of policy makers that the na-tional economy benefits more from export than from import47. Local researchers in the 33 countries concerned48 have identified over 180 exam-ples of policy instruments to foster internationalisation of SMEs. From this long list a set of potentially good practices from a range of countries has been se-lected and described in more detail in Annex V.
45 EC (2008), Supporting the internationalisation of SMEs. Good practice selection, DG Enterprise and Industry, Luxembourg.
46 Source: OECD (2008) Removing barriers to SME Access to international markets, p. 38.
47 OECD (2008), Removing Barriers to SME Access to International Markets, p.40.
48 Partners of EIM in the European Network for Social and Economic Research (ENSR), see: http://www.ensr.eu.

64
6.2 Use and perceived effect of existing support measures by SMEs
All respondents - also those representing SMEs without any international activi-ties - were asked whether they are aware of any public support programmes for internationalisation that could be used by their own enterprise, whether financial or other support instruments (See Figure 40).
Figure 40 Awareness of public support programmes for internationalisation that could be
used by the enterprise, by size class and by internationalisation status
15%
20%
27%
10%
17%
22%
0% 5% 10% 15% 20% 25% 30%
Micro
Small
Medium
No activity and no plans
Only plans to become active
International active
Source: Survey 2009, Internationalisation of European SMEs EIM/GDCC (N=9480).
The overall European average is only 16%. Figure 40 shows that awareness clearly increases by size class: micro 15%, small 20% and 27% for medium-sized enterprises. In addition the awareness has been calculated for three groups of enterprises also shown in Figure 4049: SMEs without any international activities and no concrete plans to start; SMEs without international activities, but having concrete plans to become
engaged in importing, exporting, FDI, technological cooperation with enter-prises abroad, or international sub-contracting;
SMEs already having international activities. This analysis shows that the more the enterprise is oriented towards undertaking international activities, the higher the awareness. But even in the case of enter-prises with international activities, only 22% of the respondents are aware. The percentage of internationally active SMEs actually having used such support programmes during the last 3 years is substantially smaller as shown in Figure 41. For financial support measures the overall European average is 9%, for other type of support only 6%. Again there is a rather strong relationship with size, for micro enterprises the percentage of users of financial support is only 8% and for other support measures it is 6%, whereas for medium-sized enterprises it is 21% for financial support and 10% for other support.
49 In order to have an idea about the reliability of these estimates for the population it is impor-tant to know that in absolute, unweighted numbers the sample of 9480 observations is distrib-uted in 3145 SMEs with no plans or activities; 336 SMEs without activities but with concrete plans and 5999 SMEs that have international activities. So the findings with regard to the 'only plans' category have wider confidence intervals and cannot be sub-divided into sub-groups such as sector or country.
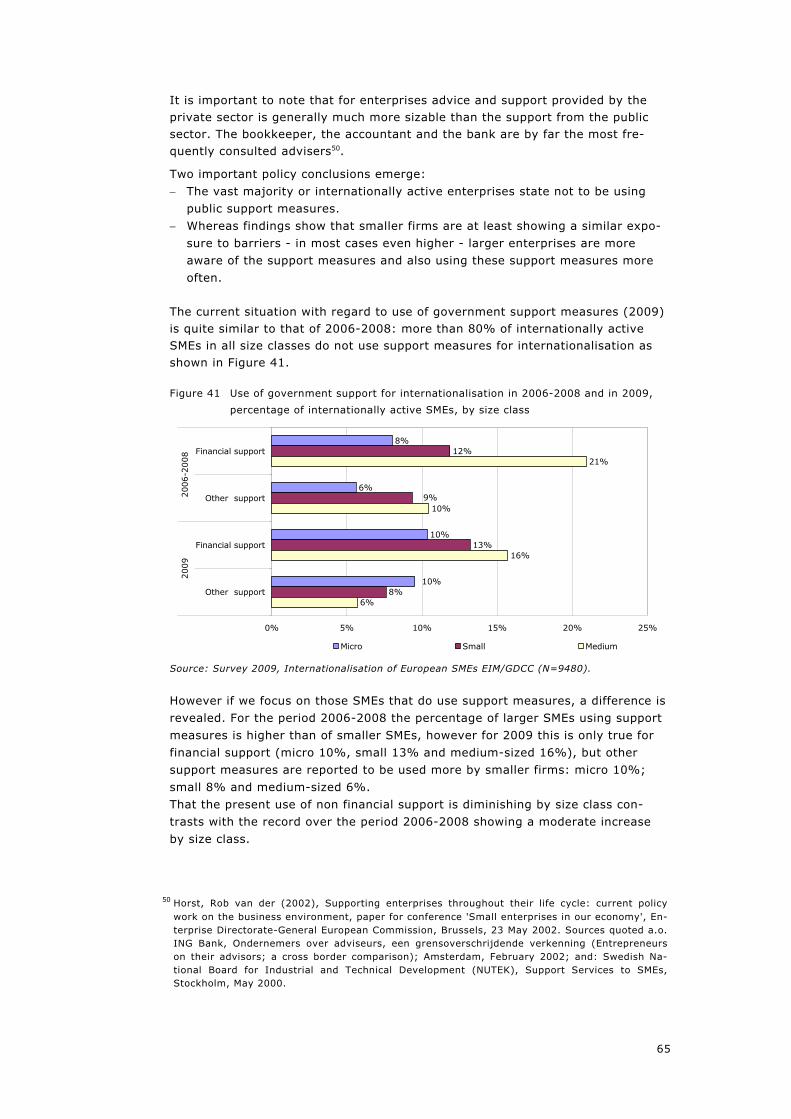
65
It is important to note that for enterprises advice and support provided by the private sector is generally much more sizable than the support from the public sector. The bookkeeper, the accountant and the bank are by far the most fre-quently consulted advisers50.
Two important policy conclusions emerge: The vast majority or internationally active enterprises state not to be using
public support measures. Whereas findings show that smaller firms are at least showing a similar expo-
sure to barriers - in most cases even higher - larger enterprises are more aware of the support measures and also using these support measures more often.
The current situation with regard to use of government support measures (2009) is quite similar to that of 2006-2008: more than 80% of internationally active SMEs in all size classes do not use support measures for internationalisation as shown in Figure 41.
Figure 41 Use of government support for internationalisation in 2006-2008 and in 2009,
percentage of internationally active SMEs, by size class
8%
6%
10%
12%
13%
8%
21%
10%
16%
6%
10%
9%
0% 5% 10% 15% 20% 25%
Financial support
Other support
Financial support
Other support
2006
-200
820
09
Micro Small Medium
Source: Survey 2009, Internationalisation of European SMEs EIM/GDCC (N=9480).
However if we focus on those SMEs that do use support measures, a difference is revealed. For the period 2006-2008 the percentage of larger SMEs using support measures is higher than of smaller SMEs, however for 2009 this is only true for financial support (micro 10%, small 13% and medium-sized 16%), but other support measures are reported to be used more by smaller firms: micro 10%; small 8% and medium-sized 6%. That the present use of non financial support is diminishing by size class con-trasts with the record over the period 2006-2008 showing a moderate increase by size class.
50 Horst, Rob van der (2002), Supporting enterprises throughout their life cycle: current policy work on the business environment, paper for conference 'Small enterprises in our economy', En-terprise Directorate-General European Commission, Brussels, 23 May 2002. Sources quoted a.o. ING Bank, Ondernemers over adviseurs, een grensoverschrijdende verkenning (Entrepreneurs on their advisors; a cross border comparison); Amsterdam, February 2002; and: Swedish Na-tional Board for Industrial and Technical Development (NUTEK), Support Services to SMEs, Stockholm, May 2000.
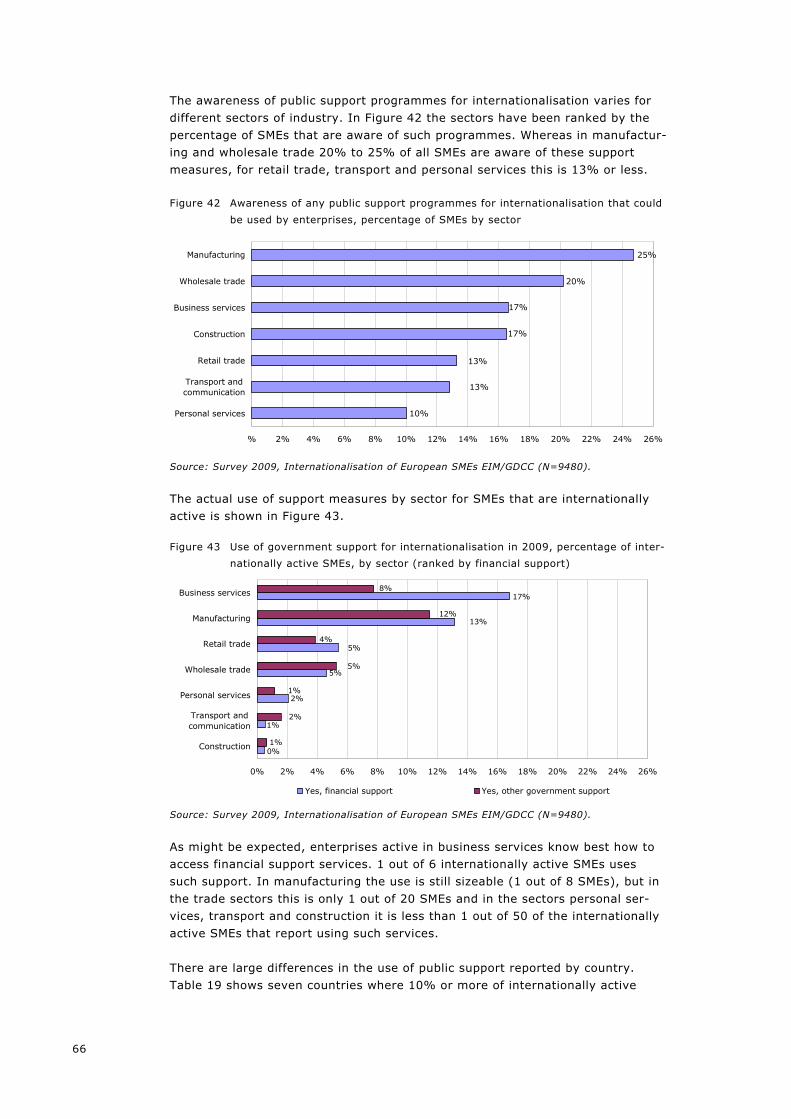
66
The awareness of public support programmes for internationalisation varies for different sectors of industry. In Figure 42 the sectors have been ranked by the percentage of SMEs that are aware of such programmes. Whereas in manufactur-ing and wholesale trade 20% to 25% of all SMEs are aware of these support measures, for retail trade, transport and personal services this is 13% or less.
Figure 42 Awareness of any public support programmes for internationalisation that could
be used by enterprises, percentage of SMEs by sector
10%
20%
25%
17%
17%
13%
13%
% 2% 4% 6% 8% 10% 12% 14% 16% 18% 20% 22% 24% 26%
Personal services
Transport andcommunication
Retail trade
Construction
Business services
Wholesale trade
Manufacturing
Source: Survey 2009, Internationalisation of European SMEs EIM/GDCC (N=9480).
The actual use of support measures by sector for SMEs that are internationally active is shown in Figure 43.
Figure 43 Use of government support for internationalisation in 2009, percentage of inter-
nationally active SMEs, by sector (ranked by financial support)
2%
5%
1%
17%
13%
5%
0%
1%
8%
12%
4%
5%
1%
2%
0% 2% 4% 6% 8% 10% 12% 14% 16% 18% 20% 22% 24% 26%
Construction
Transport andcommunication
Personal services
Wholesale trade
Retail trade
Manufacturing
Business services
Yes, financial support Yes, other government support
Source: Survey 2009, Internationalisation of European SMEs EIM/GDCC (N=9480).
As might be expected, enterprises active in business services know best how to access financial support services. 1 out of 6 internationally active SMEs uses such support. In manufacturing the use is still sizeable (1 out of 8 SMEs), but in the trade sectors this is only 1 out of 20 SMEs and in the sectors personal ser-vices, transport and construction it is less than 1 out of 50 of the internationally active SMEs that report using such services. There are large differences in the use of public support reported by country. Table 19 shows seven countries where 10% or more of internationally active

67
SMEs use some kind of financial support, in Austria and Turkey this is even re-ported by 47% and 32% of respondents respectively. At the other end of the scale, there are nine countries where this is 2% or lees. For non financial support there are 8 countries where it is 10% or higher and 15 countries where 1% of less of internationally active SMEs report using support measures.
Table 19 Use of financial and non financial public support for internationalisation in 2009,
percentage of internationally active SMEs, by country
Rank Financial support Rank Non-financial support
1 Austria 47% 1 Slovenia 23%
2 Turkey 32% 2 Cyprus 19%
3 Greece 17% 3 Latvia 16%
4 Latvia 17% 4 Lithuania 12%
5 Norway 14% 5 Luxembourg 11%
6 Germany 14% 6 Italy 11%
7 Spain 10% 7 Norway 11%
8 Italy 9% 8 Greece 11%
9 Slovakia 9% 9 France 9%
10 France 7% 10 Spain 9%
11 Romania 6% 11 Germany 7%
12 Hungary 5% 12 Denmark 5%
13 Sweden 5% 13 United Kingdom 5%
14 Cyprus 5% 14 Ireland 4%
15 United Kingdom 5% 15 Austria 3%
16 Slovenia 4% 16 Poland 3%
17 Luxembourg 4% 17 FYROM 2%
18 Liechtenstein 4% 18 Finland 2%
19 Belgium 4% 19 Belgium 1%
20 Finland 3% 20 Slovakia 1%
21 Estonia 3% 21 Netherlands 0%
22 Lithuania 3% 22 Estonia 0%
23 Poland 3% 23 Malta 0%
24 Ireland 3% 24 Croatia 0%
25 Malta 2% 25 Portugal 0%
26 Bulgaria 2% 26 Sweden 0%
27 Croatia 2% 27 Czech Republic 0%
28 Czech Republic 2% 28 Bulgaria 0%
29 Portugal 1% 29 Hungary 0%
30 Denmark 1% 30 Iceland 0%
31 Netherlands 1% 31 Liechtenstein 0%
32 FYROM 0% 32 Romania 0%
33 Iceland 0% 33 Turkey 0%
Source: Survey 2009, Internationalisation of European SMEs EIM/GDCC (N=9480).
Figure 44 shows the effect of using such government instruments on the interna-tionalisation of these firms as perceived by the respondents. By size class 8% to 22% of the SMEs (average 11%) state that they would not have internationalised without such support. Some 20% state that they have internationalised earlier because of support and 35% report more international business because of the support measures. It should be noted that these figures cannot be simply added because respondents could provide more than one answer (on average 1.7 an-swers). Further analysis showed that a really positive effect - in policy terms - is obtained by about half of all participating SMEs (55% of SMEs mention at least one of the four concrete positive effects).

68
The large group of 37% that state 'support welcome but it only facilitated opera-tions' signals a substantial dead-weight loss effect. These SMEs used the instru-ments and welcomed the support, but admit that it merely facilitated operations without resulting necessarily in more or earlier international activities. However the group that states that there is no effect or 'do not know/no answer' is to-gether only 10%.
Figure 44 Effect of government support on internationalisation business of enterprise, by
size of enterprise51
25%
6%
22%
32%
35%
14%
48%
36%
17%
35%
8%
29%
40%
38%
14%
41%
37%
22%
19%
17%
12%
0% 10% 20% 30% 40% 50%
Would not have internationalised without support
Internationalised earlier because of support
More international business because of support
Support welcome, but only facilitated operations
Better insight in possibilities on foreign markets
Other effect
No effect at all
Micro Small Medium
Source: Survey 2009, Internationalisation of European SMEs EIM/GDCC (N=9480).
51 Unweighted only 384 SMEs of the 6335 'internationalised SMEs' indicate to have used govern-ment support in 2006-2008. Presently only 336 SMEs are using such support, because the large overlap between the two groups only 417 remain to answer about the effect of the support.

69
7 Conclusions and Policy Recommendations
This chapter presents policy recommendations to support international activities of SMEs based on the evidence gathered in this study. We will argue that: There are economic welfare gains from increasing the number of internation-
ally active SMEs. That public support can play a role in promoting greater internationalisation of
SMEs. That there is a need to investigate carefully whether the support measures
suggested do address a market failure and not directly compete with private support offered adequately in the market place.
That provisions should be put in place to allow proper monitoring and evalua-tion of support measures.
The chapter concludes with the presentation of specific policy recommendations accompanied by relevant examples.
7.1 Economic welfare gains from internationalisation The large scale survey implemented for this study showed a strong correlation between SMEs being internationally active and better than average business per-formance scores. Although part of this effect will be due to 'self-selection' in the sense that SMEs with better performance are more likely to be active interna-tionally, it is very likely that there is also a direct, positive effect on the per-formance of enterprises that become internationally active. This will also have an effect on the performance of the national and European economy. In addition there will be indirect effects, for example, on learning and innovation. Overall economic welfare gains from internationalisation make it worthwhile to see to what extent policy makers could and should further support internationalisation of SMEs. Firstly, the survey showed that internationally active SMEs reported a much higher employment growth from 2007 to 2008 than other SMEs: Importing SMEs 8% employment growth versus SMEs without import 2%; Exporting SMEs 7% employment growth52 versus SMEs without export 3%; SMEs with FDI 16% employment growth versus SMEs without FDI 4%. Combining all, either being active in one of the internationalisation modes or having concrete plans to become active, international SMEs report an employ-ment growth of 7% versus only 1% for SMEs without any actual or concrete plans for international activities. Secondly, the development of turnover in 2008 compared to 2007 shows a posi-tive correlation between being internationally active and high turnover growth. The effect is especially large for: SMEs that invest abroad; SMEs that are subcontractors of a foreign enterprise; SMEs that have foreign subcontractors. Of these three categories about 20% reported that their turnover had increased 'quite a lot' from 2007 to 2008, for the average SME in the survey this is only 8%. Considering the categories 'turnover increased' and 'turnover increased
52 SMEs that are both importing and exporting reported a higher employment growth of 10%.

70
quite a lot' together shows that the enterprises that invested abroad and those that had technological cooperation in the reference years 2006-2008 show high scores: more than 50% compared to 33% for the average.(25% reported an in-crease, 8% reported a major increase). Thirdly, the survey results confirm the strong correlation between internationali-sation and innovation.
7.2 The role of public support for internationalisation SMEs play an important role in the European economy. The previous section demonstrates that there is a direct relation between more international SMEs and more growth and jobs. Internationalised SMEs show better performance, i.e.: are more competitive, than non-internationalised SMEs. Internationalisation supports business sustainability in the long term. This effect is further compounded by the fact that, at company level, internationalisation and innovation go hand in hand, one reinforcing the other. This may already point to the need to combine both aspects when designing government support. The survey has shown that public support can indeed play a role in the promo-tion of greater internationalisation. 11% of SMEs that are using public support measures admit that they wouldn't have internationalised without it. In total 55% of internally active SMEs mention at least one of the four positive options: no internationalisation without the support, earlier internationalisation, more in-ternationalisation or better insight in possibilities on foreign markets53. Also pub-lic support may provide a valuable contribution by addressing those problems that are perceived as the main barrier to internationalisation: access to informa-tion and access to financial support. Yet it is important to note that not all public support is equally effective. As a precondition public support must target areas where there is a market failure54 and no undue competition to private service providers. It must also establish clear quantitative objectives and targets, establish a monitoring tool and assess its results. This to guarantee that support arrives at the intended recipients, ob-tain the required results and avoids waste of public resources (assure that the "dead weight loss" effect discussed in Section 6.2 is not too large).
53 not necessarily followed by more international business activities.
54 Market failure is a situation in which a set of conditions is in place that results in less than opti-mum market outcomes. In an optimum situation (Pareto optimality) there is no increase of wel-fare for any of the market players possible without a similar or even larger loss for some of the other players. Market failure can take many different forms such as positive externalities, asymmetric information, etc. The need to look at market failures and the need to consider care-fully the relationship between private and public provision is also discussed in the Commission staff working Paper Creating top-class business support services’ (SEC(2001), 1937). The paper lists classic market failures involving public goods, information asymmetries and imperfect ap-propriation of returns. Also the publication 'Supporting the Internationalisation of SMEs' contains a section that focuses on the rationale of public support stressing the need to look into addition-ality (Supporting the Internationalisation of SMEs', final report of the Expert Group, DG Enter-prise and Industry, December 2007, Section 5.1).

71
7.3 Policy recommendations and policy examples from Member States
7.3.1 Improve awareness
Recommendation 1: Major awareness campaigns are important. Companies must be made aware of the benefits of internationalisation and be provided with more and easier access to public support. It is important to present a compre-hensive view of the different support measures available and to provide tailor-made support services, for example: Information and counselling campaigns aimed at SMEs that are potentially in-
ternational traders should be strengthened. Pay attention to misconceptions about barriers. The type of support offered might need to be adapted according to the stage
of international development of the firm. The survey showed that awareness about support programmes among SMEs is quite low. Figure 40 showed that only 10% of SMEs that are not yet active on in-ternational markets and only 22% of internationally active SMEs are aware of such policy instruments. Also the use of support instruments is very limited: less than 10% of the internationally active SMEs use the instruments. While accord-ing to the interviewees that do use the support provided, the effect of public support is relatively important as shown in Figure 44 . About 50% of the users report a positive effect in policy terms, i.e. would not have internationalised without the support, internationalised earlier or had more international business because of the support received. The survey indicated large differences in perception of barriers for international business activities between SMEs that are internationally active and those who only have plans to start internationalisation (See Figure 36 ). Those with con-crete plans to start see more barriers than internationally active SMEs. There may be two reasons for this: (a) misconceptions and/or (b) SMEs that have dif-ferent characteristics and are active on different markets may indeed face differ-ent and more barriers. Still, proper information and counselling55 may take away part of those misconceptions. Example: the Dutch programme Prepare2start56 is addressing SMEs with less than 100 employed persons57, with little or no international experience, and wishing to make a first start in exporting to a foreign market, or to start export to a new foreign market. The idea of making a plan to enter a new export market is actively promoted using chambers of commerce, trade associations etc. If the plan made by the entrepreneur in cooperation with a subsidised international business advisor is approved a range of services incorporated in the plan can be subsidised up to 50%, e.g. foreign market research, participation in trade fairs, legal advice etc. (See more detailed description in Annex V).
55 The Scientific Council for Government Policy (WRR) in the Netherlands argues that the transac-tion costs perspective provides a justification for government support in this field. WRR (2003), Nederland handelsland: het perspectief van de transactiekosten (The Netherlands, a trading na-tion: the transaction costs perspective), reports to the government no. 66, WRR Den Haag.
56 Until October 2007 this measure was called PSB = Programme Starters in foreign markets.
57 Of all PSB-users 70% employ less than 10 people.

72
7.3.2 Focus on micro and small SMEs
Recommendation 2: Governments must improve the access of micro and small SMEs to existing public financial support mechanisms and to relevant information sources. Figure 37 showed that lack of capital does figure prominently among the results from our survey58. This bottleneck appears in almost any enterprise survey. Figure 38 showed that the barrier is more important for the smaller SMEs, whereas Figure 40 clearly showed that the larger the SME the more it is aware of public support programmes. Figure 41 even showed that financial support is gen-erally more used the larger the SME. From the 180 good policy practices identified in all countries for this study (See Annex V for a selection of examples) 5% are aimed at providing capital and an-other 6% at providing guarantees for financing risks. Example: The web page www.internationaalondernemen.nl initiated by the Netherlands Ministry of Economic Affairs and a number of trade promotion or-ganisations provides easy access to relevant information for micro enterprises. This website presents information oriented towards doing international business e.g. finance. Special products like export credit insurance, international credit ratings, factoring, venture capital, payment habits, leasing and road-maps are introduced and explained. Seemingly heterogeneous products are homogenised, i.e. grouped together and presented in a simple and user-friendly way and com-pared with regard to terms and pricing. Products and services from both the pri-vate financial sector and the state, the EU and multilateral institutions are pre-sented. Example: First Flight is an Irish policy instrument that assists first-time Irish exporting SMEs to target major export markets such as the UK. First time ex-porting SMEs face issues like knowing who their customers are, understanding their needs, identifying the most appropriate routes to market, determining their competitive advantage and establishing the financial resources required to suc-cessfully enter foreign markets. First Fight is a multi-step information provision, self-assessment, mentoring and training process designed to help SMEs in ap-proaching new export markets. Through the First Flight initiative, managers can develop awareness of areas of strength and risk for their enterprise in exporting as well as be supported in taking action to prepare to enter a new export market. In Annex V the First Flight Asia variant is described.
7.3.3 Combine innovation and international isation
Recommendation 3: The findings on the link between innovation and interna-tionalisation do suggest - even if the direction of the casual effect is not always clear59 - that it is a good thing to design and present policy support measures aimed at stimulating innovation and internationalisation in conjunction as both issues are policy objectives in their own right. Public bodies should consider a unified approach to both issues including merging the implementing agencies into a single body.
58 As mentioned in the introduction, the timing of the survey - interviews done in January to April 2009 - will have had a considerable effect on this type of issues because of the international credit crunch.
59 Actually the survey suggested casual effects in both directions, for example experience on inter-national markets contributing through learning effects to innovation.

73
The results in Section 4.6 confirm that there is a strong link between activities on international markets and different forms of innovation. Internationally active firms more often introduce product, service and process innovations and 60% of the internationally active SMEs developed these new products or services by themselves. The survey results confirm that firms see innovation both as being necessary to enter foreign markets and as a consequence of foreign market activities ("learn-ing-by-internationalisation"). In addition, competition from foreign enterprises on home markets is a main driver for innovation. The survey results also show a correlation between having concrete plans to in-ternationalise and innovation. Example: Innovation Packages (Denmark). Participants get access to a 50% dis-count when using the business advisors and a professional network of the Danish Innovation Centres in Silicon Valley, Shanghai or Munich. The centres aim to act as spearheads in the hot spots of the global economy. It is difficult for SMEs to gain a foothold in the globally, most innovative environments due to the fierce competition that exists in these regions. The centres assist promising firms in realising their international potential by fulfilling a number of tasks in relation to the Innovation Packages, like partner search and broadening of networks, facili-tating contact with potential investors, help in getting access to technology and knowledge, evaluation of business plans and feedback from the centres' Review Boards. See Annex V for a more elaborated description.
7.3.4 Not only export, also import
Recommendation 4: Policy instruments for international business should not only be aimed at potential exporters but also at importers. Import is at least as important as export, however the focus of policy instru-ments is generally on export. Export does indeed bring in 'foreign currency', but for many economic sectors efficient access to required inputs is a very important factor in staying (internationally) competitive. In addition Section 4.5 showed that SMEs most often start their internationalisation process with imports and later go into export markets. So supporting importers, will also result in promot-ing more exporters. Example: Marketplace Baltic Region. The Swedish Trade Council was assigned by the Swedish government to establish Marketplace Baltic Region in order to promote and facilitate trade within the Baltic region. The Association of Swedish Chambers of Commerce and Industry was in turn subcontracted to assist in fa-cilitating Swedish imports from the Baltic Sea region. In order to meet the objec-tive, this Association set up a cost-free help desk to provide qualified advice, market information and answer direct questions related to Swedish import rules and procedures. In addition, the help desk facilitated business enquires either via direct matchmaking (if possible), providing lists of Swedish importers, or via a tailor-made database - Chamber Trade - where traders could register and post business proposals as well as search for potential trade partners. The second pil-lar of the Marketplace Baltic Region, which was managed by the Swedish Trade Council, provided support primarily to Swedish SMEs that wanted to establish a business presence in the Baltic Sea region.

74
This was executed by providing business advice as well as hands-on assistance by the Council’s regional offices in the partner countries60.
7.3.5 E-commerce
Recommendation 5: Policies must be developed to support greater use of the Internet by SMEs and especially of e-commerce as this lowers barriers for inter-nationalisation for smaller companies. The Probit analysis presented in Annex IV confirms that having the possibility to sell products or services on line is positively correlated with being active on ex-port or import markets when controlled for other effects such as size of firm or sector. The conclusion would be that the Internet has already made it easier for SMEs of all sizes to overcome some of the barriers to internationalisation. Public bodies may support this process not just by developing specific programmes but also by fostering the development and use of electronic signatures. Example: PIPEnet (Spain) provides a personalised counselling and support ser-vice to those enterprises participating in the PIPE programme (described in An-nex V, section 17) and that are interested in using new technologies and ICT in their international business models61. The measure has been developed and is run by the Spanish Institute for Foreign Trade (ICEX) with the financial backing of the European Commission. It provides a strategic plan to the companies struc-tured through meetings with the company carried out by a consultancy service. Basically, the support from PIPENET is structured around two main phases: 1 In the first phase, the external consultant has three face-to-face meetings
with the enterprise, in addition to constant on-line communications. The first meeting is intended to identify the working processes of the enterprise (to identify those areas and processes where ICT can help the internationali-sation and competitiveness of the enterprise), including the analysis of the main target countries of the enterprise, the degree of penetration of ICT in these target countries and the identification of other Internet based busi-ness models developed by competitors so to benchmark and identify best practices. Then, a second meeting is held for developing the main Internet-based operations having in mind six main elements, this is, the target pub-lic, the products, the prices, distribution issues, promotion and personality (image and design to be transmitted in the web page).
Finally, in a third meeting, the main results obtained by the external consult-ant are presented and discussed with the enterprise. In this phase, PIPE en-terprises participating in PIPENET only pay 20% of the cost of the customised consultancy service and ICEX funds the remaining cost (80%), up to a total of € 6 000 (so the enterprise only pays € 1,200 ).
2 In the second phase of the project a free technical assistance to the enter-prise is provided in the next 12 months to the participating companies (in terms of consultancy services for the actual implementation of the project).
60 Source: Supporting the internationalisation of SMEs. Good practice selection, Brochure DG En-terprise and Industry (p. 41). Additional information: www.chambertrade.com and www.balticsea.swedishtrade.se/english/index.asp
61 Source: Supporting the internationalisation of SMEs. Good practice selection, Brochure DG En-terprise and Industry (p. 29).

75
The target group of the measure consists of SMEs in all sectors, services in-cluded, from all regions within Spain that export less than 30% of their turnover. In the first two years that PIPEnet has been running, around 1 500 companies had completed the initial consultancy meeting with an expert and more than 300 had completed the full consultancy programme. Additional information: www.portalpipe.com.
7.3.6 Improve effic iency in col lecting market information
Recommendation 6: Presently internationalisation promotion agencies in many Member States are acquiring and analysing large amounts of information on mar-ket developments and the legal and institutional environment in a range of for-eign markets. Efficiency gains could be obtained by ensuring that the amount of 'double work' is reduced. A lot could be gained62by organising the collection and analysis of this information at the EU level and local agencies focussing on being an efficient interface with their national business community. Figure 35 showed that high cost of internationalisation is the second most impor-tant barrier63. This is a barrier that is to some extent a 'fact of life'. However over the last decades we have seen major decreases in several areas such as costs of communication and transport. Public policy may also contribute to re-ducing some of the other cost elements. For example trade policy resulting in trade liberalisation, reducing tariffs and quotas and other barriers to trade (obligatory technical standards or difficult paperwork for transport64). But also, by providing access to relevant information, public policy may be in-strumental in achieving major efficiency gains by bringing transaction costs down. Lack of information is a crucial barrier for doing international business as shown in Figure 37 and Figure 38, this might be due to a market failure. About 30% of all policy practices identified in all countries are about providing informa-tion.
62 Since the 1950's the Chief Executives of national organisations responsible for promoting ex-ports from, and investments to, European countries have already been meeting annually to dis-cuss topics of common interest. 31 organisations from 28 countries (as of Sept. 1996) now take part in the European Trade Promotion Organisation (ETPO) and there is also a Working Group on Information Processing, ETPO-WGIP (Source: http://wko.at/aw/etpo/index.htm; 1/11/2009).
63 The highest barrier mentioned is the high price of the own product or service.
64 The survey showed this to be a relatively important barrier in the perception of SMEs (Figure 37 and Figure 38).


77
ANNEX I Set up of the survey
Foreword
There is a range of different estimates of the percentage of European SMEs that are involved in international business activities. Many factors play a role in ex-plaining these differences. To mention only a few: Coverage of sectors; Including or excluding enterprises without employees, which is a very sub-
stantial part of the number of enterprises in Europe; The definition used, e.g. 'any exports over the last three years', 'exporting at
least 10% of their total turnover', 'presently exporting', 'reporting the amount of exports over the last year', etc.
Potential biases, for example because more dynamic outward looking enter-prises are more likely to answer questions on internationalisation (selection bias);
This can be illustrated with findings from different German and Dutch studies. IfM Bonn published a major study on internationalisation of SMEs in 200765. This study concluded - based on an IfM survey of 530 SMEs and other German sur-veys - that approx. 12% of German enterprises export. Also data compiled by the Federal Statistical Office based on VAT registrations on request by IfM Bonn for 2006 show that 11.2% of SMEs export (vs 11.4% for all German compa-nies)66. According to the results of the KfW-Mittelstandspanel (SME panel)67 however, the share of exporting SMEs is approx. 20%. Differences might, among others, be due to issues such as (i) enterprises that realise relatively low export sales (i.e. below the official threshold) are not covered by the official statistics and (ii) en-terprises that realise export turnover only from private persons in the EU (i.e. no sales to foreign companies) are not covered by the official statistics. So it is quite likely that the group of exporting SMEs not covered by the official statistics in Germany ("8%") only realise low export sales, but they will still answer 'yes' when asked in a survey whether they are involved in export. We do not want to suggest that such variation in findings is in any way particular for Germany. EIM also published different figures for the Netherlands when re-viewing internationalisation of Dutch SMEs68. Calculations of EIM based on ERBO (Regional Survey of Netherlands Chamber of Commerce) and production statis-
65 Die Bedeutung der außenwirtschaftlichen Aktivitäten für den deutschen Mittelstand (The Signifi-cance of Internationalisation Activities for German SME), a study conducted on behalf of the Federal Ministry of Economic Affairs and Technology by Das Institut für Mittelstandsforschung (IfM) Bonn in cooperation with the Volkswirtschaftliche Institut für Mittelstand und Handwerk an der Universität Göttingen (ifh), Bonn 2007.
66 http://www.ifm-bonn.org/assets/documents/Kennzahlen_Auslandsaktivitaeten_und_Export_ 2004-2006.pdf.
67 MittelstandsMonitor 2007, Den Aufschwung festigen - Beschäftigung und Investitionen weiter vorantreiben Jährlicher Bericht zu Konjunktur- und Strukturfragen kleiner und mittlerer Unter-nehmen, published jointly by KfW, Creditreform, IfM Bonn, RWI and ZEW (http://www.ifm-bonn.org/assets/documents/Mimo-2007.pdf).
68 Review: Internationalisation of Dutch SMEs, EIM June 2009 (source; EIM based on ERBO (Neth-erlands Chamber of Commerce), Production statistics and National Accounts (Statistics Nether-lands).

78
tics and national accounts of Statistics Netherlands show a percentage of export-ing SMEs of nearly 10% (slightly lower for micro enterprises and about 33% for medium-sized enterprises). However data from EIM's SME Policy Panel 2004 quoted in the same publication, show that about 18% of micro enterprises and 33% of medium-sized enterprises report exports. The conclusion can only be that survey results should be used carefully with due consideration to issues such as research population covered and definitions used.
Introduction
The survey "Internationalisation of European SMEs" was designed by EIM Busi-ness & Policy Research in the context of this Study. The actual fieldwork was im-plemented by GDCC in Rotterdam, the Netherlands. The main objective was to collect information on the current state of internation-alisation of SMEs in 33 European countries. This annex describes the set up of the survey and the level of confidence that is associated with the findings in the following sub sections: Fieldwork and questionnaire Disproportional stratified sample Weighing sample results Response overview Levels of confidence obtained.
Fieldwork and questionnaire
After developing the questionnaire and the sample plan, a series of pilot inter-views were held. The actual fieldwork started in January 2009 and the fieldwork was ended when the number of completed interviews reached 9,480 on Friday 17 April 2009. The questionnaire was developed in English and translated into 26 other lan-guages to allow interviewing enterprises in the 33 countries by native speakers in all the languages required, e.g. also Russian in the Baltic States. The overall average interview duration was around 16 minutes. For an overview of topics covered please see Annex II.
Disproportional stratif ied sample
Only about 1% of all SMEs in Europe are medium-sized enterprises, most are mi-cro enterprises (92%). If we would take a random sample of some 9000 enter-prises without stratification, one would expect to realize only 90 interviews with medium -sized enterprises in all 33 countries and sectors of industry. This would clearly not be enough to reach conclusions for medium-sized enterprises by it-self. This indicates the need for using a disproportional stratified sample. The stratification plan was developed along three dimensions: size of enterprise, sector of industry and country. The total number of strata distinguished was: 3 (size classes) * 26 (sectors) * 33 (countries) = 2574.

79
The aim was to obtain about equal numbers of observations in each of the three size classes in order to allow inferences by size class within the large economies and clusters of other countries69. From each of the three size classes a similar number of completed interviews were obtained: Micro enterprises, i.e. having 1-9 employees (N=3253); Small enterprises, i.e. having 10-49 employees (N=3260); Medium-sized enterprises, i.e. having 50-249 employees (n=2967). Also for each of the 33 countries covered (27 EU Member States, Iceland, Nor-way, Liechtenstein, Turkey, FYROM and Croatia) targets have been set. The dis-tribution has been decided after considering the level at which the European Commission would like to arrive at inferences: 600 observations for each of the 6 largest economies (total 3600 observa-
tions); 300 observations for Romania and Bulgaria (total 600 observations); 201 observations for 25 other countries (25 * 201 = 5025 observations). So in total 3600+600+5025= 9225 observations. In total there are 8332 interviews completed in EU27 and 1148 in non-EU coun-tries. Thirdly targets have been set related to sectors of industry. The overall aim was to obtain at least 150 completed interviews in each of 26 sectors at European level: 1. Mining 2. Manufacturing - Food 3. Manufacturing - Textiles 4. Manufacturing - Wood 5. Manufacturing - Publishing 6. Manufacturing - Chemicals 7. Manufacturing - Metal 8. Manufacturing - Machinery 9. Manufacturing - Motor Vehicles 10. Manufacturing - Miscellaneous Manufacturing 11. Electricity 12. Construction 13. Sale of Motor Vehicles 14. Wholesale Trade 15. Retail Trade 16. Hotels 17. Transport 18. Real Estate 19. Renting 20. Computer
69 It should be noted that although a completed interview was obtained from a large number of micro enterprises across Europe (n=3253), within this group of micro enterprises the smallest enterprises are under-represented. Of enterprises with 1, 2, 3, 4 or 5 employees between 420 and 460 each were included in the survey, from enterprises with 6, 7, 8 or 9 employees between 190 and 330 enterprises were included. In reality the distribution is more skewed. So whereas the entire group of micro enterprises was re-weighted to represent about 92% of all SMEs, within the group of micro enterprises the somewhat larger enterprises are over-represented. This will contribute to some overestimation of the incidence of internationalisation in SMEs in general.
80
21. Research 22. Legal 23. Other Business 24. Human Health 25. Veterinary Health 26. Other Services In addition targets have been set for each of the 26 surveyed sectors within each country to make sure that for example: Results per country are based on a reasonable spread among sectors; Results per sector are based on a reasonable spread among countries. This implies that quotas were set for all cells defined by sector, size class and industry simultaneously. The disproportional stratified sample was used to have sufficient numbers of in-terviews to allow reporting at for example: Sector of activity (finally 25 distinguished) at the European level70; Size class for each of the major six economies in Europe separately and clus-
ters of other countries. Within the strata enterprises were randomly selected.
Weighing sample results
To allow presenting percentage distributions that truly represent the situation in Europe, the results have been weighted using the actual distribution of the Euro-pean SMEs by size class, sector and Member State. Weighing is done to correct for over and under sampling that occurs because of the non proportional stratified sampling. As an illustration only, suppose a population of SMEs is distributed by size as fol-lows: micro (90%); small (8%) and medium-sized enterprises (2%). A dispro-portional stratified sample might consist for example of 30% micro, 40% small and 30% medium size enterprises. Micro enterprises are clearly under-represented. A weight of 3 is needed to have these 30% of the sample represent 90% of the population. Medium-sized enterprises on the other hand are over-represented; a weight of 2/30 (0.07) needs to be used to have this 30% in the sample represent 2% in the population. For developing such weights and to determine the number of enterprises that are represented by the survey results, an estimate of the number of enterprises in EU27 is required. Recently the European Commission published such information in the framework of the SME Performance Review71. However, in the SME Per-formance Review, the 'total enterprise sector' refers to the non-financial business economy as defined by EUROSTAT. This implies that three sections of the Statis-tical Classification of the Economic Activities in the European Community (NACE
70 As mentioned in Section 2.3 and 3.3, veterinary services has eventually been included in the category other services because not enough observations for a reliable inference were obtained (sector with lowest number of observations, n=90).
71 The database for the performance review has been developed by EIM and is published at: http://ec.europa.eu/enterprise/entrepreneurship/craft/sme_perf_review/spr_main_en.htm.

81
Rev 1.1) are not incorporated: J - Financial intermediation; N - Health and social work and O - Other community, social and personal service activities. For developing the weighting scheme - in line with the sample used for this study - the total number of enterprises has been estimated by combining: The number of enterprises as recently published in the framework of the SME
Performance Review; Estimates for the three sections lacking, i.e. sections J, N and O. These esti-
mates are based on The SMEs sector in Europe prepared for the European Commission by EIM in 2003 in the framework of the Observatory of European SMEs (Report 2003/7: SMEs in Europe 2003, available at website DG Enterprise: http://ec.europa.eu/enterprise/enterprise_policy/analysis/doc/smes_observatory_2003_report7_en.pdf).
The total number of enterprises in the sectors covered by the survey is: 18 mil-lion in EU15; 4.5 million in EU12 (so in total 22.5 million in EU27) and 1.9 million in the non-EU countries bringing the overall total to 24.3 million enterprises. This information on the structure of the enterprise sector in EU27 by sector, size class and country (in terms of number of enterprises) was used for weighing. The general formula applied (to each cell defined by country, sector and size class): Weight = (PopulationSize/TotalPopulationSize)/(SampleSize/TotalSampleSize). Or in other words the share of each of the 2574 cells distinguished (3*26*33) in the population of enterprises divided by the share of the same cell in the sample obtained (one cell is for example: small enterprises in manufacturing in France). So this formula was applied to all 2574 cells distinguished by combining the three strata used in the sample plan: The three size classes (micro, small and medium-sized enterprises); The 26 sectors of industry distinguished in sampling; The 33 countries (27 EU Member States, Iceland, Norway, Liechtenstein, Tur-
key, FYROM and Croatia). (so 3 * 26 * 33 = 2574 cells) In all 33 countries we started off with sample addresses acquired from two list brokers Kompass and Dunn & Bradstreet72. In case insufficient addresses were available for certain specific quota (i.e. specific sectors sometimes within a spe-cific size class e.g. veterinarians with more than 10 employees!) additional ad-dresses were acquired from other sources. So the main reason for having used multiple sample sources is the fact that not all quotas could be covered by one sample supplier alone. The size and complexity of the quota structure made mul-tiple sources necessary. Kompass, for instance, has no sample available for retail trade and services. Nei-ther was a Kompass sample available for Cyprus and Estonia. These and other quotas were covered by Dunn & Bradstreet. Certain very specific sector/size combinations could not be covered by list brokers at all, e.g. veterinarians with
72 All acquired addresses from list brokers have been "de-doubled" against each other to avoid any respondent being called twice.

82
more than 10 employees. Here the internal database kept at GDCC (IDB Interna-tional Data Base) and a rather extensive desk research programme was carried out to collect additional addresses. To resume, sample sources used were: Kompass (list broker), main source D&B (list broker) IDB (internal database) Desk research. The detailed numbers of completed interviews are shown: By sector in Table 20; By country (cluster) and size class in Table 21; By country and phase of questionnaire completed in Table 22 (phase 1 refers
to more general questions, phase 2 refers to questions focusing on interna-tional business operations and these questions were only answered by those SMEs that either are already engaged in or have concrete plans to start inter-national business operations).
Table 20 Number of interviews completed by sector of industry
Sector Micro Small Medium Total
1 Mining 33 48 61 142
2 Manufacturing:
2.1 Food 71 101 96 268
2.2 Textiles 72 81 82 235
2.3 Wood 56 78 80 214
2.4 Publishing 65 80 64 209
2.5 Chemicals 38 97 95 230
2.6 Metal 49 116 137 302
2.7 Machinery 56 94 109 259
2.8 Motor vehicles 42 60 60 162
2.9 Miscellaneous manufacturing 58 66 97 221
3 Electricity 50 43 48 141
4 Construction 298 358 195 851
5 Sale of Motor Vehicles 133 146 102 381
6 Wholesale Trade 224 207 207 638
7 Retail Trade 461 296 389 1,146
8 Hotels 150 143 247 540
9 Transport 128 216 133 477
10 Real Estate 172 86 88 346
11 Renting 38 73 65 176
12 Computer 148 125 53 326
13 Research 46 58 37 141
14 Legal 273 166 164 603
15 Other Business 307 250 98 655
16 Human Health 106 114 130 350
17 Veterinary 38 30 22 90
18 Other Service 141 128 108 377
Total N, unweighted 3,253 3,260 2,967 9,480
Source: Survey 2009, Internationalisation of European SMEs EIM/GDCC (N=9480).

83
Table 21 Number of interviews completed by country (cluster) and size class
Cluster 1 Micro Small Medium Total
Italy 214 209 200 623
Germany 210 210 202 622
Spain 210 210 201 621
France 210 210 200 620
United Kingdom 210 209 193 612
Poland 209 210 209 628
Cluster total 1263 1258 1205 3726
Cluster 2 Micro Small Medium Total
Finland 67 67 44 178
Norway 73 68 33 174
Denmark 72 67 58 197
Sweden 90 84 49 223
Iceland 34 52 32 118
Cluster total 336 338 216 890
Cluster 3 Micro Small Medium Total
Belgium 67 68 86 221
Netherlands 102 101 100 303
Luxemburg 76 69 46 191
Cluster total 245 238 232 715
Cluster 4 Micro Small Medium Total
Czech Republic 65 70 75 210
Slovakia 72 73 55 200
Slovenia 74 71 75 220
Hungary 67 70 69 206
Cluster total 278 284 274 836
Cluster 5 Micro Small Medium Total
Romania 113 104 100 317
Bulgaria 84 107 102 293
Cluster total 197 211 202 610
Cluster 6 Micro Small Medium Total
Austria 64 70 99 233
Croatia 80 75 65 220
Cyprus 52 49 24 125
Estonia 76 70 75 221
Greece 69 84 90 243
Ireland 70 72 39 181
Latvia 75 75 75 225
Liechtenstein 75 49 11 135
Lithuania 75 76 74 225
FYROM 67 75 59 201
Malta 63 62 39 164
Portugal 68 74 88 230
Turkey 100 100 100 300
Cluster total 934 931 838 2,703
Total N, unweighted 3,253 3,260 2,967 9,480
Source: Survey 2009, Internationalisation of European SMEs EIM/GDCC (N=9480).

84
Table 22 Number of interviews by country and phase of questionnaire completed
Country Phase 1 Phase 1+2 Total
1 Austria 85 148 233
2 Belgium 54 167 221
3 Bulgaria 68 225 293
4 Croatia 52 168 220
5 Cyprus 19 106 125
6 Czech Republic 63 147 210
7 Denmark 50 147 197
8 Estonia 37 184 221
9 Finland 65 113 178
10 France 295 325 620
11 Germany 319 303 622
12 Greece 49 194 243
13 Hungary 78 128 206
14 Iceland 6 112 118
15 Ireland 64 117 181
16 Italy 260 363 623
17 Latvia 43 182 225
18 Liechtenstein 80 55 135
19 Lithuania 44 181 225
20 Luxembourg 35 156 191
21 Malta 19 145 164
22 Netherlands 99 204 303
23 Norway 58 116 174
24 Poland 206 422 628
25 Portugal 61 169 230
26 Romania 94 223 317
27 Slovakia 60 140 200
28 Slovenia 62 158 220
29 Spain 256 365 621
30 Sweden 66 157 223
31 Turkey 77 223 300
32 FYROM 44 157 201
33 United Kingdom 277 335 612
Total N, unweighted 3,145 6,335 9,480
Incidence 33% 67% 100%
Source: Survey 2009, Internationalisation of European SMEs EIM/GDCC (N=9480).
Response overview
For 137 361 enterprises, attempts were made to contact a spokesperson within the enterprise: 10% could not be reached (wrong number, etc.); 55% of the sample records were still being processed when the survey was
closed (i.e. scheduled to be redialled after busy tone, person not available, etc.);
35% (or 48,803 enterprises) were actually spoken to.
This group of 48,803 can be further classified as follows: 24% refusal to participate (11,758); 43% not belonging to target group (20,931); 14% interview aborted due to full quota for that group (6,631); 19% completed interview (9,480).

85
It should be noted that some of the enterprises that refused to participate would have been filtered out later because information provided would indicate that they are too large, belong to the wrong sector, are no independent enterprises etc. Hence the conclusion that more enterprises refused than participated cannot be derived from these figures as the 9480 enterprises that actually completed the interview remained after 'passing' these filter questions.
Levels of confidence obtained
One important question when considering the results of the survey as presented in the main chapters of this report is whether these results are significant. In English, 'significant' has two completely independent meanings: Significant in the sense of important and relevant in making decisions on sup-
port policies to support the internationalisation of European SMEs. Significant in the statistical sense. Here significant means that a finding from
the sample survey is probably also true for the research population as a whole. Answering this question implies considering potential biases in imple-menting the survey and considering the sample size and the size of sub-samples for which conclusions are derived.
Here we focus on the statistical meaning of the term in relation to the sample size. Significance or confidence levels show how likely it is that a result is due to variation by chance. Or in other words: if the survey results show that 10% of the sample have a specific characteristics, the question is whether this result is due to chance or due to the fact that indeed for the research population as a whole the correct figure is about 10%. The size of the sample was determined by considering the need to report on di-chotomous variables73 at the level of various subgroups in the sample with rea-sonable accuracy and confidence. Statistical theory shows, for dichotomous vari-ables, that if sample errors are not to exceed 10% for a finding of 50% at a confidence level of 95%, a sample size of about 100 is needed for that (sub-) group for which one formulate an inference (See highlighted row in Table 23). Hence, a statement like '50% of medium-sized enterprises in France are aware of existing export support measures' implies - assuming 100 respondents of this sub-group are answering the question - that it is 95% certain that the real value in the enterprise population will be between 40 and 60%74. Estimates at the country or size class level separately - i.e. not considering me-dium-sized enterprises in France, but all medium-sized enterprises in the EU, or enterprises of all sizes in France - are of course much more precise at the same level of confidence, as there are much more respondents at these levels.
73 Dichotomous variables are variables that categorize data into two groups such as exporting company versus non-exporting company.
74 For variables of a different type (numerical variables), a similar reasoning applies.

86
Table 23 Confidence intervals at confidence levels of 95% and 99% for statements base
on either 50%* or 10% of that sample having a particular characteristic
At 95% confidence level At 99% confidence level
% of sample with characteristic % of sample with characteristic
Sample size 50/50% 10/90% 50/50% 10/90%
40 15 9 20 12
60 13 8 17 10
80 11 7 14 9
100 10 6 13 8
150 8 5 11 6
200 7 4 9 5
250 6 4 9 5
400 5 3 6 4
600 4 3 5 3
800 3 2 5 3
1000 3 2 4 2
1250 3 2 4 2
1500 3 2 3 2
1750 2 1 3 2
2000 2 1 3 2
4000 2 1 2 1
8000 1 1 1 1
* The figures in this column are comparable to the margin of error as reported by Gallup in the
Technical and Evaluation report for the large scale enterprise survey implemented in the
framework of the European Observatory of SMEs (Flash Eurobarometer 196 - The Gallup Or-
ganisation).
Source: EIM, based a.o. on Survey Research Methods, Floyd J. Fowler, Applied Social research
Methods series, Volume 1, Sage publications, Beverly Hills, 1984 and sample size calcu-
lator of Creative Research Systems at: http://www.surveysystem.com/sscalc.htm.
For reading Table 23 the following notes are relevant: The confidence interval is the plus-or-minus figure usually reported in survey
results (here 6). The confidence level tells you how sure you can be. It is expressed as a per-
centage and represents how often - if you repeat the survey many times - the true percentage of the population lies within the confidence interval.
When you put the confidence level and the confidence interval together, you can say that you are 95% sure that the true percentage of enterprises having a specific characteristic (based on a finding of 10% in a sample of 100 export-ing) in the entire relevant population of enterprises is between 4% (10 - 6) and 16% (10 + 6).
To allow reaching sufficiently reliable inferences for the different sub-groups to be distinguished it was decided to aim at over 9200 completed interviews in or-der to obtain, for example, a sufficient numbers of completed interviews for each size class within the largest 6 EU Member States. Table 23 aims to assist in answering the question: 'how reliable are statements based on different sample sizes?'. The table specifies the confidence ranges for variability due to sampling both at the 95% and the 99% confidence level. The most common level used is 95%; this means that the finding has a 95% chance of being true.

87
The relationship between confidence intervals and sample size can also be seen in a chart as Figure 45.
Figure 45 Confidence intervals (red area) 'around' a sample finding of 10%, at 95% confi-
dence level for various sample sizes.
1
2
4
5
5
6
6
7
7
8
19
15
13
11
10
9
8
7
6
4
0% 2% 4% 6% 8% 10% 12% 14% 16% 18% 20%
Sample
40
60
80
100
120
150
200
250
500
1000
Source: Calculations EIM (see also Table 23), based a.o. on Survey Research Methods, Floyd J.
Fowler, Applied Social research Methods series, Volume 1, Sage publications, Beverly
Hills, 1984 and sample size calculator of Creative Research Systems at:
http://www.surveysystem.com/sscalc.htm.


89
ANNEX II Overview of questionnaire and routing
Question Description Routing (respondents) N
Q1 Enterprise is an independent private enterprise or a subsidiary of
another enterprise
All 9480
Q2 Position of respondent within enterprise All 9480
Q3 Gender of respondent All 9480
Sector Sector in 26 categories All 9480
Q6 Present legal status of enterprise All 9480
Q7 Number of employees, 2008 All 9480
Q8 Number of employees, 2007 All, 215 missing 9265
Q9 Number of years in operation before 2009 All 9480
Q10 Enterprise has own website All 9480
Q11 Form of e-commerce used by enterprise All those who have own website
(Q10=yes)
7373
Q12 Awareness of any public support programmes for internationali-
sation that could be used by enterprise
All 9480
Q13 Enterprise quoted name of organization or programme All those who are aware of public
support programmes (Q12=yes)
2103
Q14 Distance to nearest country border of enterprise 1200 answer 'non applicable'
because country has no land
borders: Cyprus, Iceland, Ire-
land, Malta and UK
9480
Q15A1 Enterprise had any own imports in 2006-2008 All 9480
Q15A2 Number of years ago enterprise started importing All those with own imports
(Q15A1=yes)
4293
Q15A3 Enterprise has concrete plans to start own imports in 2009-2011 All those without own imports
(Q15A1=no)
5120
Q15B1 Enterprise had any direct exports in 2006-2008 All 9480
Q15B2 Number of years ago enterprise started exporting All those with direct exports
(Q15B1=yes)
3669
Q15B3 Enterprise has concrete plans to start direct exports in 2009-
2011
All those without direct exports
(Q15B1=no)
5760
Q15C1 Enterprise invested abroad in 2006-2008 All 9480
Q15C2 Number of years ago enterprise started investing abroad All those who invested abroad
(Q15C1=yes)
773
Q15C3 Enterprise has concrete plans to start investing abroad in 2009-
2011
All those who not invested
abroad (Q15C1=no)
8632
Q15D1 Enterprise had any technological cooperation with enterprises
abroad
All 9480
Q15D2 Number of years ago enterprise started technological coopera-
tion with enterprises abroad
All those with technical coopera-
tion with enterprise abroad
(Q15D1=yes)
1580
Q15D3 Enterprise has concrete plans to start technological cooperation
in 2009-2011
All those without technical coop-
eration with enterprise abroad
(Q15D1=no)
7783

90
Question Description Routing (respondents) N
Q15E1 Enterprise has been a subcontractor to a foreign main contractor
in 2006-2008
All 9480
Q15E2 Number of years ago enterprise had first subcontractor relation-
ship with a foreign main contractor
All those subcontractor to for-
eign firm in 2006 -2008.
(Q15E1=yes)
1283
Q15E3 Enterprise has concrete plans to become subcontractor to
foreign firms in 2009-2011
All those not subcontractor to
foreign firm in 2006-2008.
(Q15E1=yes)
810
6
Q15F1 Enterprise had foreign subcontractors in 2006-2008 All 9480
Q15F2 Number of years ago enterprise had its first foreign subcontrac-
tor
All those with foreign subcon-
tractor in 2006-08. (Q15F1=yes)
1322
Q15F3 Enterprise has concrete plans to start having foreign subcontrac-
tors in 2009-2011
All those without foreign subcon-
tractor in 2006-08. (Q15F1=no)
8051
Q16-Q19 Estimated turnover of enterprise in Euros in 2008 All - some coding problems with
this question
?
Q20 Change of turnover 2008 compared with 2007 All 9480
Q21 Enterprise introduced any new product or service on the market
in the last 3 years
All 9480
Q22 Enterprise developed new products or service by itself All those who stated yes with
Q21 (new for firm or for sector)
4099
Q23_1 Developing new product or service self was necessary to access
new markets in other countries
All those who stated yes with
Q21 (new for firm or for sector)
4099
Q23_2 Developing new product or service self was a consequence of
our activities in foreign markets
All those who stated yes with
Q21 (new for firm or for sector)
4099
Q23_3 Developing new product or service self was a consequence of
competition of foreign companies on enterprise's home market
All those who stated yes with
Q21 (new for firm of for sector)
4099
Q23B Enterprise introduced any process innovation in the last 3 years All 9480
Q24 Enterprise is engaged in any sub-contracting relationship All 9480
Q25A Role of enterprise in subcontractor relationship All those who stated yes with
Q24 (n=2813), however with no
answer in Q24 (n=6579) have
been added in Q25A as 'none' to
present a complete overview
9392
Q25B Number of outsourcing firms enterprise has as clients All those who stated to be sub-
contractor (n=935) plus 'both'
(n=1119) with Q25A
2054
Q25C Number of subcontractors enterprise has as outsourcing firm All those who stated to be out-
sourcer (n=722) or 'both'
(n=1119) with Q25A
1841
Q26 Location of partner firms All those who stated yes with
Q24
2813
End Questionnaire Part 1

91
Questionnaire Part 2 For 'international SMEs' only.
Only for respondents for which at least one item of Q15A1, Q15B1, Q15C1, Q15D1, Q15E1 or Q15F1 is posi-
tive (having international activity) or Q15A3, Q15B3, Q15C3, Q15D3, Q15E3 or Q15F3 is positive (serious
plans to start international activity), n= 6335 (All2). In addition the following routing applies,
Question Description Routing (respondents) N
Q27 Enterprise used government support to internationalise in
2006-2008
All those aware of support
programmes (Q12=yes; n=
1681; 3 additional missing))
1678
Q28 Enterprise uses government support to internationalise in
2009
All those aware of support
programmes (Q12=yes, n=
1681; 3 additional missing)
1678
Q29 Effect of government support on internationalisation busi-
ness of enterprise
All those using support pro-
grammes, either financial or
other, either in 2006-2008
or in 2009 (Q27 and Q28)
417
Q30 Percentage of import to total costs of purchasing inputs of
enterprise in the period 2006-2008
All those with own imports
(Q15A1=yes)
4293
Q31 Import regions 2008 All those with own imports
(Q15A1=yes)
4293
Q34 Percentage of exports to total turnover for enterprise in
2008
All those with direct exports
(Q15AB=yes)
3669
Q35 Export regions 2009 All those with direct exports
(Q15AB=yes)
3669
Q38A Number of foreign countries enterprise invested in during
the period 2006-2008
All those with own imports
(Q15C1=yes)
773
Q38B Top three countries enterprise invested in during 2006-
2008
All those with own imports
(Q15C1=yes)
773
Q39 Legal form of enterprise's foreign establishment All those with own imports
(Q15C1=yes, n= 773; 75
additional missing)
698
Q40 Type of activities that are done in or from the establish-
ment abroad
All those with own imports
(Q15C1=yes, n= 773; 75
additional missing)
698
Q41 Top three countries for technological cooperation All those technological coop-
eration (Q15D1=yes)
1580
Q42A Percentage of exports that consists of subcontracting to
enterprises abroad
All those acting as subcon-
tractor to foreign firm
(Q15E1=yes)
1283
Q42B Number of foreign countries in which enterprise has sub-
contractors
All those acting as subcon-
tractor to foreign firm
(Q15E1=yes)
1283
Q43 Top three countries enterprise in which main contractors
are located
All those acting as subcon-
tractor to foreign firm
(Q15E1=yes)
1283
Q44 Percentage of total costs of purchasing inputs consisting of
subcontracting in 2008
All those with foreign sub-
contractor (Q15F1=yes)
1322
Q45 Top three countries enterprise in which subcontractors are
located
All those with foreign sub-
contractor (Q15F1=yes)
1322

92
Question Description Routing (respondents) N
Q46_0 Presence of internal barriers All 2 6335
Q46_1 Importance of language barriers All 2 6335
Q46_2 Importance of lack of sufficiently qualified personnel All 2 6335
Q46_3 Importance of quality of enterprise's products and/or ser-
vices
All 2 6335
Q46_4 Importance of specifications of enterprise's products and/or
services
All 2 6335
Q46_5 Importance of price of enterprise's products and/or services All 2 6335
Q46_6 Importance of high cost of the internalisation process All 2 6335
Q46_7 Importance of other barriers related to the enterprise All 2 6335
Q47A External barriers with EU-EFTA countries All 2 6335
Q47B External barriers with non-EU-EFTA countries All 2 6335

93
ANNEX III World regions distinguished
Answers Explanation for interviewers only 1. Cross border
regions Areas located in another EU or EFTA Member State within a distance of 50 km to 100 km from the land border with the country where the enterprise is located.
2. Other European Union (EU-27) or EEA
EU-27: Austria, Belgium, Bulgaria, Cyprus, Czech Rep., Denmark, Es-tonia, Finland, France, Germany, Greece, Hungary, Ireland, It-aly, Latvia, Lithuania, Luxembourg, Malta, Netherlands, Po-land, Portugal, Romania, Slovakia, Slovenia, Spain, Sweden, UK.
EEA: Iceland; Liechtenstein; Norway. 3. Russia -
4. Other European countries
Albania, Belarus, Bosnia and Herzegovina, Croatia, FYROM (Mace-donia), Kosovo, Moldova, Montenegro; Serbia, Switzerland, Ukraine.
5. Middle East Bahrain, Cyprus, Iraq, Israel, Jordan, Kuwait, Lebanon, Oman, Pales-tine Territories, Qatar, Saudi Arabia, Syria, Turkey, United Arab Emir-ates, Yemen.
6. North Africa Mediterranean sea countries: Algeria, Egypt, Libya, Morocco, Tunisia. 7. Other Africa Angola, Benin, Botswana, Burkina Faso, Burundi, Cameroon, Cape
Verde, Central African Republic, Chad, Comoros, Congo (Brazzaville), Congo DR (Zaire), Cote d'Ivoire, Djibouti Eritrea, Equatorial Guinea, Ethiopia, Gabon, Gambia, Ghana, Guinea, Guinea Bissau, Kenya, Le-sotho, Liberia, Madagascar, Malawi, Mali, Mauritania, Mauritius, Mo-zambique, Namibia, Niger, Nigeria, Reunion, Rwanda, Sao Tome & Principe, Senegal, Seychelles, Sierra Leone, Somalia, South Africa, Sudan, Swaziland, Tanzania, Togo, Uganda, Western Sahara, Zambia, Zimbabwe.
8. Japan - 9. China People's Republic of China incl. Hong Kong and Macau. 10. India - 11. Other Asia Afghanistan, Bangladesh, Bhutan, Brunei, Cambodia, East Timor, In-
dia, Indonesia, Iran, Kazakhstan, Kirghizstan, Laos, Malaysia, Mal-dives, Mongolia, Myanmar, Nepal, North Korea, Pakistan, Philippines, Singapore, South Korea, Sri Lanka, Tadzhikistan, Taiwan, Thailand, Turkmenistan, Uzbekistan, Vietnam.
12. North America Canada, Mexico, USA (NAFTA countries). 13. Brazil 14. Other South and
Central America Central: Belize, Costa Rica, El Salvador, Guatemala, Honduras,
Nicaragua, Panama. Caribbean: Antigua & Barbuda, Aruba, Bahamas, Barbados, Cayman
Islands, Cuba, Dominica, Dominican rep., Grenada, Guade-loupe, Haiti, Jamaica, Martinique, Puerto Rico, St Kits & Nevis, St Lucia, Trinidad & Tobago, Virgin Islands.
South: Argentina, Bolivia, Chile, Colombia, Ecuador, French Guy-ana, Guyana, Paraguay, Peru, Suriname, Uruguay, Vene-zuela.
15. Australia/ New Zealand
Incl. Oceania.
Source: Questionnaire Survey EIM/GDCC 2009.


95
ANNEX IV Probit regression explaining export and import
This report presents a lot of findings from the survey, but predominantly using descriptive statistics only. This has been done to present the major findings for the questions that were judged to be relevant. However the data collected from 9480 independent SMEs in 33 European countries permit a wealth of additional analysis to investigate particular points of interest. Such analysis is beyond the scope of this report, but the data are being made available for such analysis. Just to illustrate the possibilities, this annex presents one example: explaining the chance that an SME is engaged in exporting or importing, by using a Probit analysis. This annex has three sections: 1 Briefly describing the Probit analysis and its output; 2 Discussing the results of the Probit analysis; 3 Assessing the importance for the material presented in this report.
1. The Probit analysis and its output
A Probit model75 is a particular variant of a regression model in which the vari-able to be explained is not a continuous variable76 but rather a binary variable like an SME being an exporter or not. The probability that an SME is indeed ex-porting is explained in the Probit model that we present here by the following in-dependent or explanatory variables: Population The size of the population of the country in which the SME is located. Sector A series of dummy variables indicating to which of seven sectors the SMEs
belongs: 1. Manufacturing; 2. Construction; 3. Wholesale trade; 4. Retail trade; 5. Transport & communication; 6. Business services; and 7. Personal services. The models uses 6 dummies and treats sector 2 (construction) as the default sector (point of reference).
Size class Again dummies are used to indicate whether the SME belongs to the class of small enterprises (yes/no) or the medium size class (yes/no), the group of micro enterprises being the default size class.
BuyOnline A variable indicating whether the SME has a website that allows customers to place orders on line (and/or) finalise the entire transaction including payments on-line.
ProductInn1 A variable that indicates whether the SME has introduced new products or services on the market in the last 3 years that are new for the sector in the country concerned.
ProductInn2 A variable that indicates whether the SME has introduced new products or services in the last 3 years on the market that are only new for the enter-prise itself.
ProcesInn1 A variable that indicates whether the SME has introduced any process inno-vation in the last 3 years (new for the sector in the country concerned).
ProcesInn2 A variable that indicates whether the SME has introduced any process inno-vation in the last 3 years (only new for the enterprise itself).
75 A Probit analysis is used to estimate the effects of one or more independent variables on a di-chotomous dependent variable. The dependent variable (e.g. exporting or not exporting) is as-sumed to have probability P for the event of interest (in this case, exporting). In the case of our example, it measures the relationship between independent variables (characteristics of SMEs) and the chance of an SME being involved in exporting.
76 Like monthly income or age.

96
Table 24 and Table 25 below show the results of two similar models, respectively explaining export and import of SMEs (Binary variable indicating whether the SME reports to be active in 2006-2008 in this field). The tables consist of the fol-lowing columns: 1. Name of the explanatory variable as listed above. 2. Coefficient, indicating the degree to which the chance that the variable
being explained assumes the value 'true' is correlated with the explana-tory variable: a negative value implies that there is a negative correlation: if an SME belongs to the construction sector the chance is considerably lower that the SME is engaged in export or import.)
3. Std. Err.: The standard error of the estimate is a measure of the accuracy of predictions; if the standard error is large compared to the coefficient the coefficient estimate is not reliable.
4. Z statistic: the coefficient divided by the standard error. 5. P> |Z|, this column indicates the chance that such Z value (the test sta-
tistic) is obtained by chance, which is the case when the two variables considered are statistically independent. If this chance is higher than 5% one generally concludes that the null hypothesis of independency cannot be rejected, which implies that the coefficient is not significant (not really different from zero).
6 & 7 The 95% confidence interval indicates the range for the coefficient; it is for 95% certain that the coefficient indeed has a values indicated by the range.
Table 24 Model to explain incidence exporting of SME* (Probit regression)
Explanatory variables Coef. Std. Err. z P>z 95% confidence interval
Population -0.005 0.001 -7.5 0.000 -0.006 -0.003
Sector
- Manufacturing 1.420 0.072 19.7 0.000 1.279 1.561
- Wholesale trade 1.456 0.074 19.6 0.000 1.310 1.601
- Retail trade 0.775 0.066 11.8 0.000 0.646 0.903
- Transport & comm. 1.120 0.082 13.6 0.000 0.959 1.282
- Business services 0.502 0.066 7.6 0.000 0.372 0.632
- Personal services 0.169 0.073 2.3 0.021 0.025 0.313
Size class
- Small enterprises 0.220 0.061 3.6 0.000 0.100 0.340
- Medium-sized ent. 0.397 0.147 2.7 0.007 0.108 0.686
BuyOnline 0.200 0.037 5.5 0.000 0.128 0.272
Innovation
- ProductInn1 0.609 0.043 14.1 0.000 0.524 0.693
- ProductInn2 0.438 0.042 10.4 0.000 0.356 0.521
- ProcessInn1 0.349 0.060 5.8 0.000 0.231 0.468
- ProcessInn2 0.336 0.042 8.0 0.000 0.253 0.418
Constant -1.535 0.063 -24.3 0.000 -1.659 -1.411
Number of observa-
tions in regression 9262
LR chi2(14) 1901.36
Prob > chi2 0
Pseudo R2 0.18
Log likelihood = -4310.32
Note (*): Dependant variable: SME exports in 2006-2008.
Source: Survey 2009, Internationalisation of European SMEs EIM/GDCC (N=9480).

97
Table 25 Model to explain incidence of importing of SME* (Probit regression)
Explanatory variables Coefficient Std. Err. z P>z 95% confidence interval
Population -0.013 0.001 -21.2 0.000 -0.015 -0.012
Sector
- Manufacturing 0.947 0.067 14.2 0.000 0.816 1.077
- Wholesale trade 1.677 0.072 23.3 0.000 1.536 1.818
- Retail trade 0.865 0.058 14.9 0.000 0.751 0.978
- Transport & comm. 0.344 0.081 4.3 0.000 0.186 0.502
- Business services 0.016 0.061 0.3 0.791 -0.103 0.135
- Personal services 0.073 0.066 1.1 0.269 -0.056 0.202
Size class
- Small enterprises 0.201 0.062 3.2 0.001 0.080 0.323
- Medium-sized ent. 0.469 0.149 3.2 0.002 0.177 0.761
BuyOnline 0.247 0.037 6.7 0.000 0.175 0.320
Innovation
- ProductInn1 0.773 0.044 17.6 0.000 0.687 0.859
- ProductInn2 0.475 0.042 11.2 0.000 0.392 0.558
- ProcessInn1 0.366 0.063 5.9 0.000 0.244 0.489
- ProcessInn2 0.349 0.043 8.2 0.000 0.266 0.433
Constant -0.901 0.055 -16.3 0.000 -1.010 -0.793
Number of observa-
tions in regression 9262
LR chi2(14) 2638.74
Prob > chi2 0
Pseudo R2 0.2354
Log likelihood = -4285.14
Note (*): Dependant variable: SME imports in 2006-2008.
Source: Survey 2009, Internationalisation of European SMEs EIM/GDCC (N=9480).
2. Conclusions
From these two tables several conclusions can be derived, such as for example: The probability that an individual SME exports or imports increases with size
of firm. The smaller the home market (proxy: population of country) the higher the
probability that an individual SME exports or imports. The effect is very small but significant77.
Especially SMEs in wholesale and manufacturing are active in exporting and importing.
Belonging to the sector business or personal services does not contribute sig-nificantly to the chance that the SME is importing, in other words the chance is not significant different from the chance for enterprises in construction.
Controlling for differences in size and sector, SMEs that are actively involved in product innovation and process innovation are more likely to export and import than (otherwise comparable) SMEs that are not so innovative.
77 If both size of country in terms of area (km2) and in terms of population are used as explana-tory variables in the model, area is not significant (area and population are strongly correlated).

98
3. Assessing the importance for this study
The main advantage of an analysis as presented here is that several characteris-tics of the firm are taken into consideration simultaneously. In the main text of the report it was, for example, shown that the larger the SME, the more chance that it is engaged in exporting. However only exporting and size of enterprise were considered. This does not rule out that actually another variable explains the effects shown. For example: because many micro enterprises are active in retail, construction and personal services and many manufacturing firms are relatively large; the finding that a higher percentage from medium size enter-prises is exporting than from micro enterprises (see for example Table 1 in Chapter 2) might actually only be a sector effect as manufacturing firms are more involved in exporting than retailers, construction firms or firms in personal services. The tables presented in this annex show that when controlling for sector, size class is still a significant factor in explaining the incidence of export. Similar rea-soning applies to many issues presented in this report, e. g: the relation between internationalisation and: Size of firm; Sector; Size of country; E-commerce; Innovation.

99
ANNEX V Selected examples of policy measures
In this annex examples of policy support measures fostering internationalisation of SMEs are presented: 1 Austria: East-West-Fund 2 Austria: "Go-International" 3 Czech Republic: Czech Export Bank 4 Czech Republic: Czech Trade Promotion Agency 5 Denmark: Born Global 6 Denmark: Innovation Packages 7 France: International Voluntary Service in Company (V.I.E.) 8 Germany: German Centres for Industry and Trade 9 Germany: IHK-Company Pool Programme ("IHK-Firmenpools") 10 Ireland: First Flight Asia 11 Lithuania: Innovation Relay Centre (Since 2008 Enterprise Europe Network) 12 Netherlands: Prepare2start 13 Slovakia: Enterprise Europe Network 14 Slovakia: Export-Import Bank of the Slovak Republic (Eximbanka) 15 Slovakia: Slovak Investment and Trade Development Agency 16 Slovenia: Export Window (Izvozno okno) 17 Spain: Plan for Initiating in International Activities (PIPE)

100
1. Austria: East-West-Fund
The objective of the East-West-Fund (Ost-West-Fonds) is the safeguarding of larger internationalisation projects (e.g. the establishment of foreign subsidiar-ies/joint-ventures, the acquisition of enterprises or parts of enterprises or the extension of existing participations abroad). To help SMEs in limiting economic risks abroad, support is provided in the form of direct guarantees, financing guarantees as well as financing guarantees with risk sharing for projects starting from € 730,000.-. Direct guarantees: The East-West-Fund guarantees the funds employed by the
enterprise (maximum 50%) for a period of approx. 5 years in the event of project failure abroad.
Financing guarantees: The Fund guarantees the domestic bank of the entre-preneur the partial repayment (maximum 90%) of the loan amount borrowed for an internationalisation project for a period of 7 to 10 years. In the event of insolvency on the part of the borrower, the bank can take advantage of this guarantee.
Financing guarantees with risk sharing: This is a combination of a direct guar-antee and a financing guarantee - the Fund secures the Austrian enterprise in transactions made abroad, but also guarantees bank loans taken out for refi-nancing of the internationalisation project.
The costs for the SMEs are: one-off processing fee of 0.5% of the project volume plus semi-annually 0.5% of the guaranteed volume (for direct guarantees) semi-annually 0.3% guarantee fee of the guaranteed credit amount (for financing guarantees) plus semi-annually 0.2% in the case of risk sharing. The East-West-Fund exists since 1989 and is embedded into the framework of the Austrian Business Promotion Agency (Austria Wirtschaftsservice GesmbH; AWS) that is a financing institute of the federal government; the Fund is fi-nanced from the fees charged and government budget. Due to the current eco-nomic crisis, the overall liability limit has been raised from € 727 million to € 1.5 billion for 2009 and 2010. The target group of the East-West-Fund are Austrian SMEs (larger enterprises receive assistance at market conditions) of all sectors except agriculture, bank-ing/financial institutions, insurance and real estate or sensible sectors according to the Community Law on State Aid. The East-West-Fund is promoted via infor-mation events, commercial banks and selected newspapers. Awareness among SME/visibility is fairly high and accessibility/application procedures are quite easy (via the web page of the AWS or via commercial banks). Enterprises benefit from support by the East-West-Fund in many ways: risk-sharing between East-West-Fund, enterprise and bank; substitution for lacking collateral; benefits with regard to Basel II; favourable credit conditions; mobili-sation of debt capital; consulting regarding project and financing structures; bet-ter access to refinancing possibilities with favourable conditions (e.g. as offered by the OeKB; a specialised exports bank) as well as procurement of financing partners. In 2008, 21 enterprises with a total investment volume of € 437 million (guaran-tee volume of € 87 million) could be supported. The number of enterprises sup-ported as well as the volume has risen compared to 2007. As the vast majority

101
of the projects that are handled would not be realisable without the support of the East-West-Fund, the effect of the Fund on mobilising more enterprises to be active in international markets can be rated as high. Moreover, as the guaran-tees are also charged, in general, only enterprises that really need such a guar-antee apply for it. With an average net rate of failure of 4% (where the guaran-tee becomes effective), the efficiency of the Fund can be assessed as high. Web site: http://www.awsg.at/portal/cCardDatabase.php?dgn=29&dse=5&dsi=32 Publications: Directives of the East-West-Fund (only available in German): http://www.awsg.at/portal/media/304.pdf Annual Reports of the AWS (only available in German): http://www.awsg.at/portal/index.php?x=738&n=716
2. Austria; "Go-International"
"Go-International" in total bundles 35 support programmes and is structured around the 5 main pillars "Export Motivation", "Focus on Industries", "Business of International Technology", "Competitiveness through Education" as well as "In-crease of Service Exports and Support for Acquisition of International Projects". This comprehensive initiative has been devised to ensure Austrian competitive-ness and eliminate specific structural weaknesses of Austrian foreign trade. "Go-International" aims at providing effective support in market access and market development, developing intelligent strategies in respect to international busi-ness entry, focussing on human resources and know-how as well as improving framework conditions. Various types of support are provided, ranging from the provision of information, consultancy, training, guided trips to promising mar-kets, networking and establishing contacts, actual support in the target market (local guidance) to financial support. For example, within the support area "Focus on Industries", that is particularly relevant for smaller firms, Go-International facilitates a support-programme which focuses on 15 industrial sectors in 43 countries (service features: market reports, "Key Accountants" abroad, events in Austria and the target markets). In addition the initiative offers support for the participation in international trade fairs, participation at scientific congresses, export co-operations, incoming mis-sions, and consulting. The target group of "Go-International" are all enterprises that intend to establish export relationships for the first time, or to open up new markets abroad. There is a particular focus on SMEs (within Europe). "Go-International" is operated by the Foreign Trade Department (AWO) of the Austrian Federal Economic Chamber (WKO) in co-operation with the Federal Min-istry of Economy, Family and Youth (BMWFJ) with shared financing. The initiative was - in a slightly different form with fewer support measures - originally been initiated in January 2004. Due to its success (very high use of the measures in terms of number of enterprises), the initiative has been widened and prolonged several times, lately from April 2009 until March 2011. Along with the prolonga-tions, the budgets for "Go-International" have also continuously been raised; for 2009 and 2010 a total budget of € 25 million (thereof € 19 million from the WKO) is available for each year.

102
The visibility of the initiative among the target group is rated as high; promotion is effected via the web site, through media co-operations (radio spots, adver-tisements in selected newspapers) and at specific information events within Aus-tria. "Go-International" also operates a service hotline where companies can ob-tain information from experts directly. A rapid decision-making process and the support of the approx. 100 Economic Chamber offices world wide in 73 countries ensure effective delivery of support. The internationalisation initiative "Go-International" contributes to the strength-ening of the competitiveness of the Austrian economy. Due to the efforts of the initiative "Go-International", which supports Austrian firms in improving interna-tional competitiveness, the export of services - at present still quite small - might gain importance (see also IHS 2006; "Evaluation of the Austrian National Reform Programme; p. 15). More recent evaluation data are not available. Web site: www.Go-International.at (only in German); (www.advantageaustria.org for re-ferral outside Austria) Publications: Information booklet on "Go-International" (only available in German): http://www.go-international.at/go-international/foerderprogramme/go-int_info-Broschuere.pdf Evaluation of the Austrian National Reform Programme: http://www.pakte.at/attach/Evaluation_NRP_2007.pdf Wirschaftsbericht Österreich 2008 (only available in German): http://www.bmwfj.gv.at/NR/rdonlyres/10B73A18-98E4-4453-AA55-4EC6B2181452/0/wb2008.pdf
3. Czech Republic: Czech Export Bank
Czech Export Bank (CEB) is a specialised banking institution, directly and indi-rectly state-owned, for the state support of exports. It was set up in 1995 and is one of the pillars of the government's pro-export policy system. The CEB mission is to provide state support for exports through the provision and financing of ex-port credits and other services connected with exporting. CEB thus supplements the services offered by the domestic banking system by financing export opera-tions that require long-term financing at interest rates and in volumes that are not available to exporters on the banking market under the current domestic conditions. This allows Czech exporters to compete in international markets un-der conditions comparable to those enjoyed by their main foreign competitors. The recipients of supported financing may be an exporter (i.e. a legal entity with registered offices in the Czech Republic), or its foreign customers. A manufac-turer producing for export or a Czech subject investing abroad may also receive some types of credits. The exporter's domestic bank or the importer's foreign bank may also be involved in these transactions. All CEB activities are fully com-pliant with World Trade Organization (WTO) rules, the applicable recommenda-tions of the Organisation for Economic Co-operation and Development (OECD) and European Union directives. In 2008, CEB signed contracts totalling CZK 20.5 billion (EUR 820 mil), which is approximately 6% more than in 2007. Overall loans during 2008 compared with the end of 2007 rose dramatically from CZK 23.8 billion (EUR 952 mil) to CZK 32.3 billion (EUR 1292 mil). During 2008 itself, CEB provided resources to ex-porters within the scope of credit draw-downs in a total of CZK 16.4 billion (EUR 650 mil), which represents a CZK 2.7 billion (EUR 105 mil) increase compared with the previous year. The bank's total assets reached almost CZK 42.5 billion (EUR 1750 mil), representing an annual growth of 24%.

103
In accordance with exporter requirements and shareholder expectations, the bank primarily finances expansion of Czech firms in markets outside the EU, which to date represent only 15% of Czech exports. Russia, other countries of the Commonwealth of Independent States, Vietnam, China and other Asian coun-tries still make up the largest part of the credit portfolio. Czech exporters are becoming more and more interested in the markets in the Balkans, South Africa and Latin America and the bank is also prepared to assist them in cooperation with international financial institutions and the commercial sector. Particularly in the second half of the year, the bank began to prepare for greater attention be-ing paid to these markets by those exporters who have to date operated only in mature economies. With the growing competition for exporters, financing also becomes more complicated and challenging. Financing of SMEs is a big challenge for CEB. It provides supported financing products and related export financing services to the entire spectrum of Czech exporters, regardless of their size. In relation to CEB, small and medium entre-preneurs (SMEs) appear in two roles: firstly, as the sub-suppliers of end produc-tion exporters financed by CEB; and secondly, as independent final exporters. In the role of sub-supplier, their financing comprises export production financing; SMEs that are final exporters mainly utilise short-term export financing, often combined with export production financing. The portfolio of credits provided in respect of SME export financing grew to 3.8% of the overall credit portfolio year-on-year compared with 2007. Absolute growth was from CZK 879 million (EUR 35.16 mil) to CZK 1,215 million (EUR 48.6 mil). All bank activities are regularly evaluated and published in Annual Reports. Czech Export Bank Vodičkova 34 P.O. Box 870 111 21 Prague 1 Czech Republic Web: www.ceb.cz Tel: +420 222 841 100, Fax: +420 224 226 162, e-mail: [email protected]
4. Czech Republic: Czech Trade Promotion Agency
The Czech Trade Promotion Agency/CzechTrade was established by the Ministry of Industry and Trade of the Czech Republic in May 1997. CzechTrade's main objective is to promote international trade and cooperation between Czech and foreign companies. CzechTrade's professional information, assistance and consulting services accompany Czech exporters to foreign mar-kets, and the agency is a contact partner for firms entering the Czech market, seeking interesting and reliable business partners and suppliers. It operates 30 representative offices in 26 countries worldwide. The network of the CzechTrade's foreign offices provides on-the-spot practical assistance to Czech exporters abroad, and represents unique contribution to the promotion of the Czech exports. The services of the agency in the Czech Republic are available in 13 regional of-fices created in cooperation with the network of Czech Chambers of Commerce. As for the network of regional offices, CzechTrade is on a par with the top export promotion agencies of the EU countries.

104
Services of the Czech Trade Promotion Agency include mainly Supplier Search, Czech industrial partner search and business visits. These services are rendered free of charge. Through Supplier Search CzechTrade can help SMEs find new suppliers of goods and services based in the Czech Republic. This service is especially useful for buyers of consumer products, managers responsible for sourcing materials and industrial products and for manufacturing/packaging/handling/environmental technologies, purchasing managers involved in identifying suppliers of compo-nents/parts/assemblies and business development managers engaged in soft-ware, telecommunications and biotechnology. In Czech Industrial Partner Search (CIPAS), CzechTrade find Czech partners suit-able for long-term industrial cooperation through its foreign offices. CIPAS is an excellent service for any company thinking about setting up product develop-ment, manufacturing and other industrial partnership activities in the Czech Re-public, developing a long-term and profitable business relationship, expanding into Central and Eastern Europe (and into neighbouring West European countries as well), finding business contacts and learning more about business opportuni-ties. Key advantages of CIPAS include access to specially selected Czech compa-nies and experienced match-making services based on local knowledge. CIPAS covers all the following areas of activity such as assembly and manufacture of customers' products in the Czech Republic, partial relocation of manufacturing, R&D, co-operation in R&D and manufacturing, licensing of production in the Czech Republic, supply of services from the Czech Republic, software develop-ment and supply, joint venture and acquisition of shares in a Czech company, and rent or purchase of industrial/warehousing premises. The service of business visits is rendered by CzechTrade in cooperation with the Supplier Search and CIPAS. CzechTrade assists with the organisation of negotia-tions with selected Czech companies. This service represents a follow-up to the Supplier Search and CIPAS. If a customer would find suitable partners in the list of prospective suppliers that had been sent to him by the CzechTrade specialists, CzechTrade will assist with the organisation of negotiations in offices of the se-lected companies or on the premises of the CzechTrade Head Office, Prague. CzechTrade is financed from the state budget and partly from some paid ser-vices. Total revenue in 2007 was 260 mil CZK (EUR 10.2 mil), including 237 mil CZK (EUR 9.3 mil) of the state contribution. The number of companies using the services of CzechTrade is steadily increasing. In 2007, there were 718 clients of foreign offices (FO), and FO received 1 222 paid orders. There were 1015 clients that used paid services of CzechTrade and 339 reported successful export business cases at a total value of 3 385 mil CZK (EUR 133 mil). The quality of the measure in terms of process (visibility, accessibility, ease of process, etc.) is regularly tested through surveys. Achieved results are regularly published in Annual Reports.
CzechTrade/Czech Trade Promotion Agency Dittrichova 21 128 01 Prague 28 Czech Republic http://www.czechtrade.cz

105
5. Denmark: Born Global
The measure "Born Global" was established in 2004. It is an ongoing initiative that is part of a package of measures offered by the Trade Council of Denmark, which, among other initiatives, also encompasses the measure "Born Creative" that targets firms from creative industries. Born Global consists of several ele-ments from which SMEs can benefit: Individual counselling offered by the Trade Council of Denmark (part of the
Foreign Ministry) in relation to export preparation. A customised action plan is developed for each firm, which aims at optimising the competitiveness of firms in the international marketplace.
Export start gives firms the opportunity to receive assistance in relation to a number of specific tasks, e.g. market surveys, partner search, advertising, and competitor analyses.
Additionally, support for sector specific promotion campaigns and conferences is also included as part of the measure. Counselling is provided by consultants specialised in either IT, communication technologies, electronics & games, health, or energy & environment. Firms work-ing within one of these sectors can make use of the initiative, if they have a maximum of 50 employees and a turnover of less than 50 million DKK. The main aim of the programme is to assist SMEs for whom the Danish market quickly becomes too small. Internationalisation may be both a necessity and a significant challenge for these firms, who need assistance due to their limited size. Export preparation is free for participating firms, while export start is sub-sidised by the Trade Council of Denmark so that firms only have to pay 50% of the hourly charge, which is currently 780 DKK. The activities offered as part of the Born Global programme are also available for firms that do not live up to criteria described above, but no financial support is offered in this case. Overall, 1,277 firms made use of export preparation from 2004 to 2008 while 3,607 firms used export start during the same period. Ap-proximately 15-20% of these firms are part of the Born Global measure. The yearly cost of the support is 19.9 million DKK (=€ 2.67 million) - this figure does however also include help for SMEs, which do not qualify for Born Global support, and firms, which are part of the Born Creative measure. The quality of the measure is considered to be very high. Firms receive counsel-ling tailored to their needs if they qualify for the measure. Most importantly, the measure also makes use of the Danish embassies. This has proven to be of sig-nificant importance due to the local knowledge and language abilities that is held by the staff of the Danish representations abroad. Additionally, something as ba-sic as the ability to write letters on official writing paper with the Danish crown in the letterhead makes it easier for Danish firms to establish contacts in foreign countries. The positive effects are confirmed by an evaluation (February 2008) showing that firms, which have received export preparation assistance, have on average increased their export by 36%. The corresponding figure for Born Global firms is 332%, which is first of all likely to be due to their high economic poten-tial, and secondly due to the limited size of the firms. http://www.um.dk/da/menu/Eksportraadgivning/Vitilbyder/Eksportforberedelse+til+de+globale/?wbc_purpose=Basic&WBCMODE=Presenta%2cPresenta%2cPresentationUnpublished

106
6. Denmark: Innovation Packages
The programme "Innovation Packages" was established in December 2007. It is an ongoing initiative managed by the Trade Council of Denmark, which gives participants access to a 50% discount when using the business advisors and pro-fessional network of the Danish Innovation Centres in Silicon Valley, Shanghai or Munich. The first of these (Silicon Valley) was founded in 2006. The yearly cost of the centres is 10 million DKK equivalent to € 1.34 million, which is financed though the Danish government's so called Globalisation Funds. The centres aim to act as spearheads in the hot spots of the global economy. It can often be diffi-cult for SMEs to gain a foothold in the globally, most innovative environments due to the fierce competition that exists in these regions. The centres assist promising firms in realising their international potential by fulfilling a number of tasks in relation to the Innovation Packages: Assistance concerning partner search and broadening of networks for Danish
firms and knowledge environments Facilitation of contact between firms and potential investors Aid in searching for technology and knowledge Support relating to establishment of new departments, e.g. evaluation of
business plans and feedback from the centres' Review Boards Firms from high-tech sectors such as ICT, life science, clean-tech and design are preferred. The measure is available for firms with a maximum of 50 employees and a turnover of less than 50 million DKK. Subsidiaries of firms, which do not live up to these conditions, are excluded from the measure. Each Innovation Package consists of 25 hours of counselling targeting a specific market. A firm can apply for up to eight packages, yet a maximum of four pack-ages can be issued for each market. The measure is subsidised by the Trade Council of Denmark so that firms only have to pay 50% of the hourly charge, which is currently 780 DKK. Approximately 50 firms purchase Innovation Packages per year. This number is considered to be unsatisfying - there is a lack of knowledge of Innovation Pack-ages among the types of firms, who will find them relevant. The Trade Council of Denmark is now focusing on promoting the measure in the Danish innovation en-vironments by marketing it through e.g. newsletters of industrial organisations. At this point, it is too early to evaluate the effect of the Innovation Packages. As mentioned above, the first packages were sold in December 2007, and the measure did not gain momentum before 2008. Additionally, the initiative sup-ports firms in the pre-internationalisation phase i.e. there is a time gap between providing the assistance and the actual internationalisation of the SMEs. A thor-ough evaluation of the innovation centres is planned for spring 2010, and it is very likely that the Innovation Packages will be included in this evaluation. http://www.um.dk/da/menu/Eksportraadgivning/Vitilbyder/Innovation/
7. France: International Voluntary Service in Company (V.I.E)
The International Voluntary Service in companies was established by the law of March 14th, 2000, and allows French companies to entrust to a young person, until 28 years, a professional mission abroad during a flexible period from 6 to 24 months, renewable once. On December 31st, 2007, 5 436 volunteers were in post for 1 199 companies. Since the beginning of the service in 2001, approxi-mately 16 345 V.I.E have realized a mission. Any type of mission can be en-trusted to the volunteers. Commercial or technical, the company decides on the mission: control of management/finance, business international/sales, mechani-cal, electronics, computing/telecommunications. Automotive, banking, energy, construction and trade-distribution are the main areas to use V.I.E.

107
The administration in charge of V.I.E is UBIFRANCE, the French agency for inter-national business development which studies the requests for support and en-sures the management of the V.I.E. UBIFRANCE brings an operational support with a pre-selection of the most suitable candidates as well as the administrative and legal management of the V.I.E (contractual aspects, payments of the allow-ances and the social welfare of the volunteer). The company is exempted from any direct contractual link, the contract being signed between UBIFRANCE and the young volunteer. The volunteer is then placed under the administrative su-pervision of the Economic Mission with the Embassy of France in the selected country. Specific measures are proposed to SMEs: support by big groups and companies of international standing (from the hosting to the follow-up of the V.I.E during his mission) or possibility of sponsoring with the network of foreign trade advisers. The concept of "shared time" allows taking advantage of a V.I.E while sharing the services and the costs with other companies, from the same industry or the same region. The cost of the V.I.E depends on the turnover of the exporting company and of the country of destination. The company has to pay: the monthly allowance of the volunteer, variable according to countries, from € 1 200 to € 3 200 a month, as well as the monthly expenses of management and social welfare, from 175 € to 375 €, according to the business figure and the number of V.I.E. In using the V.I.E. programme, SMEs may also benefit from other national or regional sup-port. The cost of a VIE can be covered by a COFACE business development insur-ance policy, whose objective is to encourage companies to seek new foreign markets. It assists them financially by insuring companies for costs incurred if the new export opportunities were not to succeed. In some cases, companies are eligible for regional grants, offered by many regions in France, which cover part of the cost of the VIE. Using a VIE also allows small businesses to take advan-tage of a tax reduction offered to SMEs which incur export business development costs when exploring new foreign markets. This tax credit is capped at € 40 000 and reimburses 50% of eligible expenses for a 24 month period from the start of the V.I.E. The international voluntary service has been a real success for French compa-nies, particularly SMEs. This service allows an active presence of French compa-nies in the foreign markets at a minimal cost and a simplified administrative management. See: http://www.ubifrance.fr/formule-vie.html, and also http://www.civiweb.com/ http://www.ubifrance.fr/Galerie/Files/Divers/V.I.E._guidepratique.pdf http://www.exporter.gouv.fr/exporter/Pages.aspx?iddoc=408&pex=1-12-408 http://www.ambafrance-cn.org/Le-succes-du-Volontariat-International-en-Entreprise-VIE-en-Chine-ne-se-dement-pas.html?lang=fr http://www.cidj.com/emploi-etudes-jobs.aspx?docid=2083&catid=4
8. Germany: German Centres for Industry and Trade
The German Centres for Industry and Trade support German small and medium-sized enterprises (SMEs) in opening their own local bases for establishing and expanding their business activities in major growth markets. Through the combi-nation of office space and services under one roof, and an easy access to net-works, enterprises can quickly enter new markets with defined risk and manage-able costs. This infrastructure enables the German business community to be-come more visible in the respective host countries. It provides ample opportuni-

108
ties to foster business contacts between local and German firms and institutions and offers newcomers many opportunities for exchanging experiences and infor-mation (e.g. tenant meetings, seminars and other special gatherings). The German Centres provide - adapted to local conditions - the following ser-vices: office and industrial space, rental of small and larger units at competitive rates, conference and training facilities as well as exhibition space and an exten-sive range of consulting and other services. The German Centres pool together the resources of German foreign trade promotion through the leading business and trade associations, such as the German Chamber of Commerce Abroad (DIHK), Federation of German Industries (BDI), and German Engineering Foun-dation (VDMA), as well as with federal and state ministries. The German Centres are owned and managed by private investors, who plan the projects, build and finance them and ensure that the building is operated in ac-cordance with the German Centre and industry guidelines. Tenants of the Ger-man Centres are mostly small and medium-sized German companies from myriad industry and trade sectors and from various service sectors as well. The idea of the German Centres has been developed mutually by industry, politics, and banks based on practical experience. Initially, the concept was implemented in Singapore in 1995. Meanwhile, the network has grown to include seven sites in Beijing, Delhi, Jakarta, Mexico City, Shanghai and Singapore. Two additional sites are currently under development, one in Moscow and another one in Dubai. So far, the German Centres have assisted more than 1 500 companies to enter challenging growth markets.
9. Germany: IHK-Company Pool Programme ("IHK-Firmenpools")
The innovative Company Pool Programme ("IHK-Firmenpools") managed by sev-eral German Chambers of Commerce and Industry (IHKs) offers valuable and cost-effective support for SMEs at developing international business activities by reducing individual risks and costs. Currently, the IHKs are coaching in total 31 company groups focussing on market entry in various countries (mostly emerg-ing economies) in Asia, Eastern Europe, the Middle East, Northern and Southern Africa, South America and the USA. A company group usually consists of up to 15 German SMEs that normally do not directly compete against each other (often working in different economic areas) and that intend to enter the same target market. The companies benefit from the comprehensive services taken over by a joint representative office in the host country which is managed by an experienced business expert (appointed by the IHK). The standard service package includes preparatory and accompanying ser-vices in Germany, such as assistance in developing a strategy for market entry and the organisation of regular meetings of all participating SMEs in order to ex-change information and experiences. In the host country, the representative of-fice professionally handles business correspondence and translations and carries out information and market research on behalf of the SMEs. The business expert also selects and initiates contacts with potential business partners and holds preparatory negotiations on behalf of the German group of companies. Further-more, he also prepares SMEs' participation in fairs, accompanies their business trips to the target country and reports regularly on current economic and politi-cal developments in the host country. Costs for joining an IHK-Company Pool vary according to the specific target country and the scope of used services but normally fall between 5 000 and 15 000 EUR per annum. The foreign trade sup-port programmes of several German Federal States offer financial assistance to cover part of the costs. SMEs usually participate for two or three years in the

109
company group, i.e. until they are able to stand on their own and continue their business activities independently. The success of the measure can be illustrated by the fact that, for example, in the case of the IHK company group in Ukraine (founded 15 years ago and serv-ing as a model for all other IHK company pools) approx. 80% of former partici-pants keep on maintaining (independent) business relations with the Ukraine af-ter leaving the company group.
10. Ireland: First Fl ight Asia
The First Flight Asia initiative was launched in 2005 and is a sub-programme of the larger First Flight initiative that assists first-time Irish exporting SMEs to tar-get major export markets such as the UK. In addition to supporting SMEs to in-ternationalise, the First Flight Asia (FFA) initiative also contributes to the achievement of Ireland's Asia strategy which highlights the growing importance of exporting to Asia and the necessity to target Ireland's export marketing ef-forts appropriately within the Asia region. The aim of the FFA initiative is to help SMEs to save time and expenses and to manage the risk associated with entering a new marketplace in Asia. The First Flight Asia initiative is administered by Enterprise Ireland, the primary Government agency charged with developing and promoting the Irish enterprise sector. Its mission is to accelerate the development of world-class Irish enter-prises to achieve strong positions in global markets resulting in increased na-tional and regional prosperity. Enterprise Ireland's parent ministry, the Depart-ment of Enterprise, Trade and Employment, provides funding for the FFA initia-tive. First time exporting SMEs are faced with many issues: knowing who their cus-tomers are, understanding what their needs are, identifying the most appropriate routes to market, determining their competitive advantage and establishing the financial resources required to successfully enter foreign markets. Cultural con-ventions and language may also present their own challenges. First Fight is a multi-step information provision, self-assessment, mentoring and training process that is designed to help SMEs in approaching new export mar-kets. Through the First Flight initiative, managers can develop awareness of ar-eas of strength and risk for their enterprise in exporting as well as be supported in taking action to prepare to enter a new export market. The FFA initiative seeks to ensure that first-time exporters avoid expensive mistakes while also preparing their enterprises to create and maximise future opportunities for ex-port growth. A core element of the FFA initiative is that an experienced mentor - who provides his or her time on a voluntary basis - is assigned to the company; typically, the mentor will have had previous experience of exporting to Asia and may even be based in the region. Using a self-assessment tool-kit developed by Enterprise Ireland that has been customised for Asian markets, the mentor assists the enterprise to undertake a detailed appraisal of its readiness to export. The management of the enterprise then produces an action plan to maximise strengths and address any gaps that have been identified. The action plan can also be used by Enterprise Ireland as

110
the basis for the provision of other enterprise and/or market-related develop-ment supports. Additionally, Enterprise Ireland publishes FFA guides to Asian markets which provide exporters with information on market conditions. The guides highlight the challenges of exporting to Asia particularly the importance of taking account of different cultures, languages, etc. In 2005, forty two enterprises attended First Flight Asia workshops and nine are receiving mentoring support. As the mentors provide their time voluntarily, the First Flight initiative is a cost effective way of helping SMEs to scale up for international markets. http://www.enterprise-ireland.com/Exports/Export+Training/First+Flight+Asia.htm
11. Lithuania: Innovation Relay Centre78 in Lithuania
One of the effects of globalisation processes and accession of Lithuania to the European Union is the increased competition and shorter product life-cycle. Con-trary to large companies, small and medium-sized enterprises often lack ade-quate resources and systems, e.g. adequate capacity to adopt new technologies or introduce their created technologies to new markets. SMEs tend to search for cooperation partners through international trade fairs and matchmaking events, but this search is performed spontaneously rather than strategically. Moreover, there is still a certain gap in knowledge of Lithuanian businesses about EU poli-cies and functioning of the EU internal market. Lithuanian SMEs need simple, clear and efficient access to EU and especially to its legislation, programmes and opportunities. The creation of the Innovation Relay Centre (IRC) in Lithuania ad-dressed the need for both information and assistance in internationalisation mat-ters. The measure also stimulates inward technology transfer, research and de-velopment by SMEs and for their benefit, diffusion of innovation and transfer of knowledge, which are the key elements for the development of Lithuanian indus-try. The measure, started in 1996, established the IRC as part of the international network of Innovation Relay Centres (since 2008 Enterprise Europe Network), which works as a mediator in European technology market, facilitating the estab-lishment of technological partnerships between enterprises and scientific labora-tories, as well as export and import of technologies. The Network offers concrete and effective solutions to entrepreneurs and companies in more than 40 coun-tries, including the 27 EU Member States. The Centre in Lithuania cooperates with regional consortium partners, which create a coherent support structure for local companies, boosting the profiles and competitiveness of the regions and of-fering easy access and proximity to local services for SMEs. The Centre helps SMEs to realise their potential in terms of growth and regional job creation. The concrete services offered include provision of information on EU legal basis, in-ternal market, innovation support activities, trends of technological development in Europe (e.g. newsletters, specific information upon request), evaluation of en-terprises' development potential, as well as assistance in their search of foreign partners (e.g. participation in company missions, brokerage events, compilation of collaboration contracts).
78 Since 2008 Enterprise Europe Network.

111
The definition and size of measure's target groups differs with respect to services rendered. In a broad sense, services are addressed to any enterprise in the re-gion, especially with regards to information (EU policy, legislation, market infor-mation, participation opportunities, etc.). Analysis of the profiles of Centre's re-gional offices shows a fairly even distribution among the sectors. The most im-portant designated target groups are innovative, technology oriented companies. Their number in Lithuania is quite limited, but in the past two years a number of high-tech start-ups were established. Many of these high-tech companies were established in technology parks, and a specific spin-off technology transfer cen-tre was created for them in 2008 (the Technology transfer centre). Another im-portant target group refers to sectors forming the backbone of the Lithuanian economy: metal and machinery, textile, food and wood sectors. The measure is coordinated by the Lithuanian Innovation Centre. Since 1996, the measure has been implemented through a series of projects, with its average annual budget staying at approximately 200,000 EUR. The continuation of the Centre's activities is secured through the whole current programming period of 2007-2013. The implementation of the measure has been funded by the Euro-pean Union (on average 60% of funding, with the remaining 40% from the na-tional budget. The EU funding was distributed through different initiatives, e.g. 5th and 6th Framework programme, Structural Funds (for instance, funding for the Technology Transfer Centre), Competitiveness and Innovation Framework Programme (CIP) (current major funding source). No financial contribution from participating enterprises is required, and all the services are provided free of charge. In 2008, more than 900 companies benefited in some way from the IRC. Ap-proximately 600 of them received consulting services, the rest limited them-selves to information services (newsletter etc.). 200 enterprises participated in company missions or brokerage events and thus were exposed to international markets, 60 partner search profiles were created and included in relevant inter-national technology exchange databases, whilst 11 companies established actual agreements for international technology transfer. The measure's activities in 2008 generated 300,000 EUR worth of partnership agreements, 1.2 million. EUR of foreseen investments in the following 2 years, and an average 10% increase in turnover of the participating enterprises. The usage of the measure grew steadily since its introduction (e.g. the number of newsletter subscribers in-creased several times). The quality of the measure in terms of process is gener-ally considered to be very good, as sufficient regional coverage is offered through regional offices in 5 major cities across Lithuania, serving as local nodes, the „no wrong door" principle is well implemented, and good visibility of the measure is ensured through unique identity and brand of the Centre, coher-ent communication strategy and effective communication with business support organisations (associations, technology platforms, cluster organizations and in-termediaries). The overall value for money efficiency of the measure is consid-ered to be high. The independent evaluation reports of the measure are pro-duced by the European Commission Executive Agency for Competitiveness and Innovation. The Centre also published a catalogue of innovative Lithuanian com-panies and administrative activity reports. VšĮ Lietuvos inovacijų centras (Lithuanian innovation centre) T. Ševčenkos g. 13, LT-03223 Vilnius, Lithuania Tel.: +37052356116 Fax: +37052132781 El. p.: [email protected] http://www.lic.lt/index.php?1288504095

112
12. Netherlands: Prepare2start
Until the end 2007 the name of the policy measure was PSB, Programme Starters in Foreign markets. PSB was evaluated by EIM in 2007. The PSB-scheme is one of the financial instruments of the Ministry of Economic Affairs with the objective to support at least 600 enterprises a year in compiling an internationalisation plan. Of these plans at least 300 should result in definite export results. The PSB-scheme aims to support SMEs with little or no export ex-perience to enter an (almost) new export market in a systematic way. The scheme includes the obligation for the SME to draw up an internationalisation plan and based on that, certain specific instruments to implement that plan may be subsidised for 50%. The Ministry of Economic Affairs - responsible for the PSB-scheme - made annual commitments in the period 2002-2006 rising from € 5 million to over € 10 mil-lion; approximately 60% was actually spent. Contracts are made with a number of parties to provide advice about and mentoring of PSB-activities. In these con-tracts annual objectives are set concerning the number of participating enter-prises i.e. the number of internationalisation plans to be drawn up. The parties involved are Chambers of Commerce, many trade organisations and Syntens, an innovation network for SMEs. The number of participating SMEs increased from 500 in 2002 to over 750 in 2006. The Chambers of Commerce are responsible for supplying the majority of the participants. An SME participating in the PSB-scheme receives on average a subsidy of approximately € 6,000; excluding a payment of € 2,700 made to the implementing organisation. Only enterprises with less than 100 employees are entitled to participate. About 70% of the businesses employ fewer than 10 employees: on average the partici-pants are somewhat larger than SMEs in general but somewhat smaller than ex-porting SMEs in the Netherlands. The greater part of the PSB-subsidy is granted to enterprises where export accounts for less than 5% of turnover. The majority of the applications concern the neighbouring countries Germany, England and Belgium. Two thirds of enterprises using the scheme report 'PSB is an easily accessible, low threshold scheme' and feel that the subsidised activities have a very good link to the needs of their businesses. The newly included services such as; legal advice, international patents, registrations of brands or models, production pres-entations and hiring trainees or interim mangers were well received. The instru-ments used most frequently were: production presentation, market orientation and presentation material. Based on the results of the evaluation report it may be concluded that the PSB-scheme does indeed contribute to promoting international entrepreneurship, the objective set by the Ministry of Economic Affairs. Various effects have been identified at enterprise level: 18% of the participants would not have exported to the target country without
the support of the PSB-scheme. 30% increased their exports to the target country. One half is still regularly exporting (after their participation in the PSB-
scheme) to the target country.

113
44% of the participants started exporting to the target country earlier than expected thanks to PSB.
60% of the participants obtained a better picture of the opportunities for their own enterprise in the target country.
Spill over effect. Next to direct export to the target country, 60% has im-proved their ability to do marketing abroad independently and adopted a structurally planned approach.
Implementing Agency: EVD - Agency for International Business and Cooperation P.O. Box 20105 2500 EC Den Haag, the Netherland Tel.: + 31 70 778 88 88. http://www.evd.nl/home/financiering_projecten/financiering/programma_pts.asp?land=pts
13. Slovakia: Enterprise Europe Network
Launched in February 2008, this new European Commission initiative - Enterprise Europe Network (EEN) - offers entrepreneurs a one stop shop where they can seek advice and benefit from a wide range of easily accessible support services in business, innovation and research. There is a large variety of services providing complex approaches to companies to boost their competitiveness for easier access to foreign markets. They offer information about European legislation and programmes and provide tailored in-telligence for SMEs and other clients; offer assistance and advice services to SMEs to benefit from EU programmes and initiatives; provide feedback from SMEs to the Commission to ensure that future legislation responds to SME needs; offer services to develop transnational co-operation between SMEs and help them finding suitable business partners to expand their business and enter new markets. In Slovakia, the services are distributed in several business supporting institu-tions including BIC Bratislava (leading partner), National Agency for Develop-ment of SMEs, Slovak Chamber of Commerce and Industry, Regional Advisory and Information Centre, BIC Group s.r.o. and I-Europa, s.r.o. - EurActiv.sk. The advantage of the Enterprise Europe Network is that all services are delivered at one place, which eliminates bureaucracy and chaos originating when one does not know which institution to address with a specific issue. The aim of Enterprise Europe Network is to help SMEs unlock their innovative po-tential and improve their knowledge on the policies of the European Commission. The new initiative is close to entrepreneurs - one stop shops assist them when searching for advice as well as while using the wide range of easily accessible services aimed at business support. Starting up, small entrepreneurs often lack necessary resources for monitoring different types of aid that EU programmes offer. Moreover, such companies are not always able to fully assess innovative and market potential of their products or identify business opportunities, especially in the areas they are not familiar with. Enterprise Europe Network fills this gap. The new network is building on experiences of support initiatives - Euro Info Centres (EIC), Innovation Relay Centres (IRC) and SME support services in the FP7 - and integrates their activities.

114
The Network offers concrete and effective solutions to entrepreneurs and compa-nies in more than 40 countries, including the 27 EU Member States, three EU candidate countries (Croatia, the Former Yugoslav Republic of Macedonia and Turkey), members of the European Economic Area (EEA) and other participating third countries. In the area of innovation, it disseminates information and raises awareness re-garding innovation-related policies, legislation, and support programmes; engag-ing in the dissemination and exploitation of research results; providing brokerage services for technology and knowledge transfer, and for partnership building be-tween all kinds of innovation actors; stimulating the capacity of firms, especially SMEs, to innovate; facilitating linkage to other innovation services including in-tellectual property related services. In the area of research, there are services encouraging the participation of SMEs in the Community Framework Programme for RTD (FP7); raising awareness among SMEs regarding the Community Framework Programme for RTD; helping SMEs to identify their RTD needs and find relevant partners; assisting SMEs in the preparation and coordination of project proposals for the participation in the Community Framework Programme for RTD. The Enterprise Europe Network has been established by the European Commis-sion in the framework of CIP programme. These measures and included services are widely used by SMEs because they can substantially contribute to their com-petitiveness. This network is highly visible due to long term existence of provi-sion of similar services by former EICs and IRCs for which SMEs have been ac-customed. Quality of provided services is regularly evaluated on yearly basis. Effect of the measure in terms of more SMEs being active on international mar-kets is rather high due to international nature of EEN where all participating SMEs are exposed to foreign partners. This measure has a total budget of EUR 3.0 mil for the period from 2008 to 2013, what represents about EUR 0.5 million per year. BIC Bratislava Zochova 5 811 03 Bratislava Tel.: +421 2 5441 7515 Fax: +421 2 5441 7522 Web: www.bic.sk, www.enterprise-europe-network.sk
14. Slovakia: Export-Import Bank of the Slovak Republic (Eximbanka)
Export-Import Bank of the Slovak Republic was established under Act No. 80/1997 Coll. on the Export-Import bank Slovak Republic and started its activi-ties on 22 July 1997. EXIMBANKA SR supports Slovak exporters, which are en-terprises with their registered office, or with permanent residence, in Slovakia, and which under contractually agreed conditions produce and/or export products and services of predominately Slovak origin. The main objective of the institution is to support export of the maximum volume of sophisticated product, especially to the European Union and OECD countries, as well as to developing countries, while ensuring the return on investment through the minimization of risks arising from insurance, credit, guarantee, and finance activities.

115
Banking products designated for small and medium enterprises (SMEs) allow ac-cess to the financing of an export contract or purchase of technologies by means of a loan from a commercial bank, providing direct financing of an export con-tract, providing financing of an investment aimed at production technology for producing goods for the international market, to simplify acquiring advance pay-ment guarantees from the foreign customer and offer various other forms of guarantees. EXIMBANKA SR requires appropriate collateral for the credit or guarantee rela-tionship. The interest rate or the fee charge depends on the individual transac-tion and risk exposure. The method and extent of guarantee on loan or guaran-tee relationship is considered case by case, the risk of the business case is taken into account as well as the financial situation of the applicant, whereas EXIM-BANKA SR, unlike the commercial banks, stresses its main mission - the support of Slovak exporters in transactions in the international market. Bank loan products include direct bill of exchange-based loans supporting export, financing operating costs in relation to export contract realization and direct bill of exchange loans for purchase and modernization of technology; it means an investment aimed at production technology for producing goods for the interna-tional market. Guarantee products include bank guarantee on technologies, when the purchased technology is a part and condition of further development of the exporter activi-ties and the production from the particular equipment is designed for interna-tional markets, and bank guarantee on export financing. This guarantee is issued in order to refinance the inputs for the production designed to be exported. Within the scope of purchasing the export receivables, EXIMBANKA SR offers a product similar to factoring. The product portfolio of the insurance products designated for small and medium enterprises eliminates the risks of non-payment of receivables by the foreign buyers that accompany the export credits. Moreover, EXIMBANKA SR enables in-suring the receivables on domestic market on condition that the insured client is also an exporter and is not making business only on domestic markets. The credit risks can be divided into two groups. Commercial risks are caused by bad financial situation, insolvency or bankruptcy of the buyer, eventually by his unwillingness to keep his contractual payment obligations. The creditworthiness of each buyer is assessed based on data of financial and non-financial nature. Political risks are caused by bad economic and political situation of the buyer's country. It includes force majeure such as war, civil war, revolution, insurrec-tion, coup d'état, natural catastrophes, terrorism and other revolts preventing the buyer from making the payment. In 2008 Eximbanka supported exports in the total amount of EUR 4.0 billion, which represents 36.7 percent increase compared to 2007. It includes the provi-sion of loans of EUR 270 mil and guaranties of EUR 95 mil. All bank activities are regularly evaluated and published in Annual Reports. Export-Import Bank of the Slovak Republic (Eximbanka) Grösslingová 1 813 50 Bratislava Tel.: + 421 2 59 398 111 Fax: + 421 2 52 931 624 E-mail: [email protected] Web: www.eximbanka.sk

116
15. Slovakia: Slovak Investment and Trade Development Agency
SARIO, Slovak Investment and Trade Development Agency, is a government-funded organization established by the Slovak Ministry of Economy in 2001. Its mission is to contribute to the development of Slovak economy by supporting export and internationalisation of Slovak companies, promoting Slovakia for for-eign investment and business cooperation, providing complex care for both do-mestic and foreign investors, and funding the development of industrial infra-structure. SARIO aims to increase Slovak economy's competitiveness through integrated export and investment support in Slovakia and abroad, making use of its know-how and its networks. This aim is particularly important because Slovak economy is very open and dependent on exports. Especially SMEs need support for gaining contacts and for operating in foreign markets worldwide. SARIO has been focusing its foreign trade support mostly on territories that have been perceived as promising, growing and strategically significant, by offering Slovak companies assistance through a number of export support projects. Cur-rently, despite a stable domestic situation and a sound bank system, there is a risk of falling foreign demands for the products of Slovak companies due to the worldwide financial and economical crisis. More importance is therefore given to providing effective support to Slovak companies entering new markets and inte-grating into global value chains. The range of services offered by the agency extends from identifying and assis-tance in taking advantage of market opportunities to providing governmental support to businesses and diplomatic support of international trade relations in cooperation with the commercial counsellors of the Slovak Ministry of Economy. The export support projects include: Presenting the business environment in Slovakia to target groups at home and
abroad to increase awareness of the name "Slovakia" and create interest in foreign direct investments and trade.
The foreign trade section conducts activities to support exports and develop foreign trade. Some of the top priorities are participation in general and spe-cialised expositions and trade fairs, setting up trade delegations to other countries, receiving foreign delegations, designing educational programmes for start-up exporters, providing consulting services at home and abroad and developing marketing studies.
Expositions and trade fairs - Participation in expositions and trade fairs pro-motes Slovakia and allows Slovak entrepreneurs and agencies to take advan-tage of opportunities to strengthen trade and investment connections and to develop new marketing relationships.
SARIO organises trade missions - official trips abroad for business groups that include specific goals and programmes that are among the most effective tools for boosting foreign trade relationships. These missions are organised primarily to support export activities of Slovak enterprises and are closely tied to introduc-ing Slovak products to foreign markets. In 2008, SARIO attended 44 events abroad and 117 events in Slovakia.

117
Additional activities include e.g. subcontracting. The primary objective is to cre-ate awareness about production capabilities and promote a close relationship be-tween Slovak producers and large multinational companies. SARIO has developed an electronic database of demands and offers for Slovak firms, the SARIO Information Centre where at the end of 2008 1651 domestic and foreign companies were registered and there were 1650 offers and demands for cooperation activities, services or partnership offers with a foreign subject. Throughout the year 2008 SARIO has processed 2235 business cases. All activi-ties are regularly assessed and evaluate in Annual Reports published on the web-site. The agency budget had euro 3.2 mil (in 2008) for operation costs predominantly from the state budget. SARIO - Slovak Investment and Trade Development Agency Martinčekova 17 821 01 Bratislava Slovak republic Tel: +421 2 58 260 100, 101 Fax: +421 2 58 260 109 E-mail: [email protected] Web: www.sario.sk
16. Slovenia: Export Window (Izvozno okno)
An effective and successful policy instrument in Slovenia that supports the inter-nationalisation of SMEs is called Export Window (Izvozno okno). The initial foun-der of the measure established in 2002 is Sector for Internationalisation at the Ministry of Economy. Since January 2006 it operates under JAPTI - Slovenian Public Agency for Entrepreneurship and Foreign Investment which is the execut-ing agent for the measure today. All JAPTI activities are financed by the Ministry of Economy (i.e. source of finance is government budget). With different activities, JAPTI's aim is to maximize the contribution of Slovenian export to the GDP and economic progress. One of the mechanisms is the Export Window; its main purpose is to help SMEs in their internationalisation process. It is tailored in a way that it takes into account that companies are at different stages of internationalisation - some at the very beginning of the internationali-sation process, others already established exporters. It tries to facilitate different decisions of companies relating to the export or business internationalisation. The measure provides diversified information and consultancy to existing and po-tential exporters depending on the level and type of services they need: For internationalisation beginners i.e. companies that need very basic intro-
duction to internationalisation: web portal with basic (up to date) information. For existing exporters: consultancy and help in organizing participation on in-
ternational trade fairs and/or their visits to fairs, providing education for in-ternational business (international seminars, lectures about sales techniques, introduction of changes, cultural differences…) and providing contacts with foreign companies in similar industries.
For experienced exporters: Slovenian business centres abroad helping Slove-nian companies with information, overcoming language barriers, providing help in establishing contacts with foreign companies which have interest for cooperation.

118
The measure Export Window tackles the problems of market access and partner search. The target markets are in 51 countries and the main impact of the meas-ure for SMEs is lower costs of market entry. According to a study79 done in 2008, the majority of clients of the Export Window (82%) found the measure useful and they are generally satisfied (77%) with the level of service provided. Approximately 22,000 users visit the web portal each month and the quality of the measure in terms of process (visibility, accessibility, ease of process) is high. The effect of the measure expressed in terms of more SMEs being active in in-ternational markets is moderate, but taken into account that the budget for the measure is only 150,000 euro per year its efficiency (relation between effect and costs) can be estimated as being relatively high. See: www.izvoznookno.si.
17. Spain: Plan for Init iating in International Activit ies (PIPE)
PIPE, set up in 1997, is intended to help SMEs that are interested in initiating exports for the first time. More than 5,000 Spanish SMEs have successfully par-ticipated. Basically, PIPE consists of three main phases ranging a total of 24 months: 1 Export Potential Assessment. This phase, lasting 3-4 weeks, is intended to
assess the current competitive position of the enterprise in the national market. For this purpose, the enterprise is assisted with external collabora-tion coming from an approved specialised external consultant.
2 Design of the Internationalisation Plan. This second phase lasts 3-4 months, and it is intended to elaborate a strategic internationalisation plan, accord-ingly to the concrete characteristics of the assisted enterprise. This phase is conducted in close collaboration between the enterprise and an approved specialised external consultant.
3 Implementation of the Internationalisation Plan. This last phase lasts be-tween 20 and 21 months, and it is intended to implement in practice all the policies suggested in the previously defined internationalisation plan. For this purpose, the enterprise is supported by an approved specialised exter-nal consultant, with a maximum of supporting hours previously defined.
In addition to these three phases, the PIPE programme includes a number of ad-ditional support measures, namely the PIPE Club (only for enterprises benefited from the PIPE programme), several training activities for PIPE enterprises, or a special follow-up programme for enterprises that have benefited from PIPE. Basi-cally, the public support includes a financial aid of up to 80% of the total invest-ment devoted for the three phases, with a maximum of € 46,000 per enterprise. Organization: Spanish Institute of Foreign Trade (ICEX), a public entity belong-ing to the Secretariat of State of Tourism and Trade. It provides services for Spanish companies and aims to promote and help them to achieve an interna-tional projection by:
79 http://www.izvoznookno.si/aktualno/?id=2009011209130352.

119
designing and implementing marketing programs in foreign markets providing information on Spanish products and on international markets promoting the technical skills of company managers and training foreign trade
experts promoting investment as well as industrial projects and business cooperation
in foreign markets ICEX has a network abroad of Economic and Trade Offices at Spanish Embassies, and Regional and Territorial Trade Offices in Spain.


121
ANNEX VI Literature and web sources
Anderson, E., H. Gatignon. 1986. Modes of entry: a transaction cost analysis and propositions. Journal of International Business Studies, 17(3), 1-26.
Bernard, A.B., J.B. Jensen. 1999. Exceptional export performance: Cause, effect or both. Journal of International Economics, 47(1), 1-25.
Branstetter, L., 2006. Is foreign direct investment a channel of knowledge spill-overs? Evidence from Japan's FDI in the United States. Journal of Interna-tional Economics, 68(2), 325-344.
Chuang, Y.C., 1998. Learning by doing, the technology gap, and growth. Interna-tional Economic Review, 39(3), 697-721.
Copenhagen Economics, 2003. The Internal market and the relevant geographi-cal market, the impact of the completion of the Single Market Programme on the definition of the geographical Market, Executive summary of a study commissioned by DG Enterprise and Industry of the European Commission, Copenhagen.
Daniels, J.D., J. Bracker, 1989. Profit performance: Do foreign operations make a difference? Management International Review, 29(1), 46-56.
EIM, 2003. The SMEs sector in Europe, prepared for the European Commission by EIM in 2003 in the framework of the Observatory of European SMEs (Re-port 2003/7: SMEs in Europe 2003, available at website DG Enterprise http://ec.europa.eu/enterprise/enterprise_policy/analysis/doc/smes_observatory_2003_report7_en.pdf).
EIM/SEOR, 2005. Policy instruments to foster training of the employed, Final re-port Lifelong Learning, Volume 1 Main Report prepared for DG Employment, Social Affairs and Equal Opportunities of the European Community, Brussels.
European Commission, 2008. Small Business Act (SBA), COM(2008) 394 final, Brussels.
European Commission, 2007. Supporting the Internationalisation of SMEs', final report of the Expert Group, DG Enterprise and Industry, Brussels.
European Commission, 2008, Supporting the internationalisation of SMEs, Good practice selection, DG Enterprise and Industry, Brussels.
European Commission, 2008. Communication from the Commission to the Coun-cil, the European Parliament, the European Economic and Social Committee and the Committee of the Regions - "Think Small First" - A "Small Business Act" for Europe (available at: http://eur-lex.europa.eu/LexUriServ/ LexUriS-erv.do?uri=COM:2008:0394:FIN:EN:PDF).
European Commission, 2009. First Section of the Annual Report on EU Small and Medium-sized Enterprises, Zoetermeer, (12-01-2009, prepared by EIM for DG Enterprise and Industry of the European Commission and available at: http://ec.europa.eu/enterprise/policies/sme/files/craft/sme_perf_review/doc_08/spr08_annual_reporten.pdf
European Commission and The Gallup Organisation, 2007. Flash Eurobarometer 196 - Observatory of European SMEs, Analytical report.

122
European Commission and The Gallup Organisation, 2007. Flash Eurobarometer 196 - Observatory of European SMEs, Technical and Evaluation report.
European Commission, 2001. Commission Staff Working Paper, Creating Top-Class Business Support Services, (SEC(2001) 1937, Brussels.
EUROSTAT, 2002. Statistical Classification of Economic Activities in the European Community, Rev. 1.1 (NACE Rev. 1.1, see: http://ec.europa.eu/eurostat).
EUROSTAT, 2009. Eurostat Newsrelease, euroindicators, 119/2009, 17 August 2009. See: http://www.eurostat.eu/.
Floyd J. Fowler, 1984. Survey Research Methods, Applied Social research Meth-ods series, Volume 1, Sage publications, Beverly Hills, 1984.
Greenaway, D. S. Girma, R. Kneller, 2004. Does exporting increase productivity? A micro econometric analysis of matched firms. Review of International Eco-nomics, 12(2), 855-866.
Hauser Christian and Arndt Werner, 2008. Fostering International Entrepreneur-ship: Are SMEs targeted adequately by official foreign trade promotion schemes? Working paper posted 15/4/2008 at: http://papers.ssrn.com/sol3/papers.cfm?abstract_id=1120824.
Hessels J., 2008. International Entrepreneurship: Value Creation Across National Borders, Erasmus Research Institute of Management (ERIM), ERIM PhD Se-ries in Research in Management, 144, Rotterdam.
Hessels J. and N. Tiggeloove, 2009. Review: Internationalisation of Dutch SMEs, Zoetermeer.
Horst, Rob van der, 2002. Supporting enterprises throughout their life cycle: cur-rent policy work on the business environment, paper for conference 'Small enterprises in our economy', Enterprise Directorate-General European Commission, Brussels, 23 May 2002.
IKEI/EIM, 2009. EU SMEs and Subcontracting, report by IKEI Spain and EIM commissioned by European Commission, DG Enterprise and Industry, forth-coming.
ING Bank, 2002. Ondernemers over adviseurs, een grensoverschrijdende ver-kenning (Entrepreneurs on their advisors; a cross border comparison); Am-sterdam.
Institut für Mittelstandsforschung, 2007. Die Bedeutung der außenwirtschaft-lichen Aktivitäten für den deutschen Mittelstand (The Significance of Inter-nationalisation Activities for German SME), a study conducted on behalf of the Federal Ministry of Economic Affairs and Technology by Das Institut für Mittelstandsforschung (IfM) Bonn in cooperation with the Volkswirtschaft-lichen Institut für Mittelstand und Handwerk an der Universität Göttingen (ifh), Bonn.
Jarillo, J.C., 1989. Entrepreneurship and growth: the strategic use of external resources. Journal of Business Venturing, 4(2), 133-147.
JSBRI, Japan Small Business Research Institute, 2008. White Paper on Small and Medium Enterprises in Japan, improvement of Productivity and the Chal-lenge of Community Revitalization, Tokyo (Available as PDF file at: http://www.chusho.meti.go.jp/sme_english/whitepaper/whitepaper.html).

123
Karagozoglu, N., M. Lindell, 1998. Internationalization of small and medium-sized technology based firms. Journal of Small Business Management, 36(1), 44-60.
KfW, Creditreform, IfM Bonn, RWI and ZEW, 2007. MittelstandsMonitor 2007, Den Aufschwung festigen - Beschäftigung und Investitionen weiter voran-treiben Jährlicher Bericht zu Konjunktur- und Strukturfragen kleiner und mittlerer Unternehmen, (http://www.ifm-bonn.org/assets/documents/Mimo-2007.pdf).
Knight, G.A., 2000. Entrepreneurship and marketing strategy: the SME under globalization. Journal of International Marketing, 8(2), 12-32.
Lachenmaier, S., L. Wößmann, 2006. Does innovation cause exports? Evidence from exogenous innovation impulses and obstacles using German micro data. Oxford Economic Papers, 58(2), 317-350.
Lopéz, R.A., 2005. Trade and growth: Reconciling the macroeconomic and micro-economic evidence. Journal of Economic Surveys, 19(4), 623-648.
Ministry of Economic Affairs the Netherlands, 2004. 'Action Plan Internationalisa-tion', Den Haag.
Muûls, M, M. Pisu, 2007. Imports and Exports at the Level of the Firm: Evidence from Belgium, working paper research, National Bank of Belgium.
National Federation of Independent Business (NFIB), 2004. The National Small Business Poll, Volume 4, Issue 1 2004 (ISSN - 1534-83260). Report avail-able at: http://www.411sbfacts.com/sbpoll.php?POLLID=0005&KT_back=1.
OECD, 2006. Member Economy Policymaker Survey and SME survey, Paris.
OECD, 2008. Enhancing the role of SMEs in global value chains, Paris.
OECD, 2008. Globalisation and Emerging Economies, Brazil, Russia, India, Indo-nesia, China and South Africa, Paris.
OECD 2008. Removing barriers to SME Access to international Markets, Paris.
Onkelinx Jonas, Leo Sleuwaegen 2009, Determinants of successful internationali-sation by SMEs in Flanders, Research Report Vlerick Leuven Gent Manage-ment School.
Robb Alicia, Janice Ballou, David DesRoches, Frank Potter, Zhanyun Zhao and E.J. Reedy, 2009. An Overview of the Kauffman Firm Survey Results from the 2004-2007 Data, Kaufmann The foundation of Entrepreneurship USA.
Roper, S., J.H. Love, 2002. Innovation and export performance: Evidence from the UK and German manufacturing plants. Research Policy, 31(7), 1087-1102.
Scientific Council for Government Policy (WRR), 2000. Het borgen van publiek belang (safeguarding the public interest), reports to the government, no. 56, WRR Den Haag.
Scientific Council for Government Policy (WRR), 2003. Nederland handelsland: het perspectief van de transactiekosten (The Netherlands, a trading nation: the transaction costs perspective), reports to the government no. 66, WRR Den Haag.
Storey, D.J., 1994. Understanding the Small Business Sector, London.

124
Storey, D.J., 1998. Six Steps to Heaven: Evaluating The Impact Of Public Policies To Support Small Businesses In Developed Economies, working paper no. 59, September 1998 Warwick Business School's Small and Medium-sized En-terprise Centre, UK.
Storey, D.J., and Potter, J., 2008. 'OECD Framework for the evaluation of SME and Entrepreneurship Policies and Programmes', OECD, Paris.
Swedish National Board for Industrial and Technical Development (NUTEK), 2000. Support Services to SMEs, Stockholm.
US Census Bureau, 2009. Profile of US Exporting Companies, 2006-2007 (see: http://www.census.gov/foreign-trade/Press-Release/edb/2007/edbrel.pdf).
US Small Business Administration, 2008. The Small Business Economy: a Report to the President, Washington (Available on the Internet at: http://www.sba.gov/advo/research/sb_econ2008.pdf).
Verhoeven, W.H.J., D. Snel, P. Gibcus, 2007. De Exportindex MKB - Bronnen en methodologie (The export index, sources and methodology), Zoetermeer.
Verhoeven, W.H.J., D. Snel, P. Gibcus, 2008. De Exportindex MKB 2007 (Export index SME 2007), Zoetermeer.
Wakelin, K., 1998. Innovation and export behaviour at the firm level. Research Policy, 26(7-8), 829-841.
World Trade organisation (WTO), 2009. World Trade report 2009, Trade Policy Commitments and Contingency Measures, Geneva.
Zahra, S.A., D.O. Neubaum, M. Huse, 1997. The effect of the environment on export performance among telecommunications new ventures. Entrepre-neurship Theory and Practice, 22(1), 25-46.
http://www.surveysystem.com/sscalc.htm (sample size calculator of Creative Research Systems at)
http://ec.europa.eu/enterprise/enterprise_policy/analysis/doc/smes_observatory_2003_report7_en.pdf
http://ec.europa.eu/eurostat
http://ita.doc.gov/td/industry/otea/sme_2007/SME_index_2007.htm
http://www.ifm-bonn.org/assets/documents/Kennzahlen_Auslandsaktivitaeten_und_Export_2004-2006.pdf
http://www.kauffman.org/uploadedFiles/kfs_fourth_040709.pdf
http://www.iso.org/iso/english_country_names_and_code_elements
http://europa.eu/abc/european_countries/index_en.htm
http://ec.europa.eu/enterprise/entrepreneurship/craft/sme_perf_review/spr_main_en.htm