Internationalisation Monitor 2010 - UNSD · Statistics Netherlands Telephone +31 88 570 70 70 ......
191
Internationalisation Monitor 2010
Transcript of Internationalisation Monitor 2010 - UNSD · Statistics Netherlands Telephone +31 88 570 70 70 ......

Internationalisation Monitor2010

2 Statistics Netherlands
Explanation of symbols
. = datanotavailable* = provisionalfigure** = revisedprovisionalfigurex = publicationprohibited(confidentialfigure)− = nilorlessthanhalfofunitconcerned− = (betweentwofigures)inclusive0(0.0) = lessthanhalfofunitconcernedblank = notapplicable2008−2009 = 2008to2009inclusive2008/2009 = averageof2008uptoandincluding20092008/’09 = cropyear,financialyear,schoolyearetc.beginningin2008and
endingin20091998/’99-2008/’09 = cropyear,financialyear,etc.1998/’99to2008/’09inclusive
Duetorounding,sometotalsmaynotcorrespondwiththesumoftheseparatefigures.
Publisher InformationStatisticsNetherlands Telephone+31885707070HenriFaasdreef312 Telefax+317033759942492JPTheHague Viacontactform: www.cbs.nl/informationPrepressStatisticsNetherlands Where to orderGrafimedia E-mail:[email protected] Telefax+31455706268CoverTelDesign,Rotterdam Internet www.cbs.nl
Price:€49.70(excludingpostage)ISBN:978-90-357-1506-6
Printrun:400copies
©StatisticsNetherlands,TheHague/Heerlen,2010.Reproductionispermitted.‘StatisticsNetherlands’mustbequotedassource.
60192201001M-21

Internationalisation Monitor 2010 3
Foreword
Theprocessofeconomicglobalisation ischaracterisedby increasing internationaltradeandforeigndirectinvestments,reflectingtheactivitiesofDutchmultinationalenterprisesintheeconomyoftheNetherlands.Thesizeandimpactoftheseeconomiccross-border activities have important consequences for many policy areas ofnationalgovernmentsandinternationalinstitutions.TherecenteconomicdownturnfurtherillustratestheimportanceofinternationaltradefortheDutcheconomy.
Policymakersand thegeneralpublicare interested in theeffectsof internationaltradeonemployment,economicgrowthandsustainability.Tohelpquantifytheseeffects,thisthirdeditionoftheInternationalisationMonitor,publishedbyStatisticsNetherlands,presentsarangeofconnectedandconsistentstatisticsoninternationaltrade. In four descriptive chapters on trends and 24 annotated tables, theInternationalisation Monitor analyses developments in the area of internationaltradeofgoods,internationaltradeofservices,internationaldirectinvestments,andinternationalR&Dandinnovation.ThusStatisticsNetherlandsaimstocontributetoabalancedandfactualdiscussiononthepositionoftheDutcheconomyfromaninternationalperspective.Internationaltradeisthefocusoffourin-deptharticlesthathighlighttheimportanceof exports and imports for the Netherlands, and analyse the characteristics ofcompanies involved in the international flow of goods and services. AlthoughcompaniesengagedineitherexportsorimportsofgoodsorservicesaccountforonlyasmallnumberofoverallDutchenterprises,theygenerateapproximately80percentoftheturnoverandtwo-thirdsofthevalueaddedoftheDutcheconomy.Bothexportingandimportingcompaniesareonaveragelarger,moreproductiveandmoreinnovativethancompaniesnotinvolvedininternationaltrade.Lastly,firmsengagedininternationaltradealsopayhigherwages:7and5percenthigherforimportersandexportersrespectively.Althoughpartofthiswagepremiumisareflectionoftheireconomicsuccess,itislargelyexplainedbyadifferentworkforcecompositionthancompaniesoperatingonlywithintheNetherlands.
Future editions of the Internationalisation Monitor will cover more themes andindicators,basedonscientificresearchandclosecooperationwithpolicymakers,researchinstitutesanduniversities.Formoreinformationvisitthe‘Globalisation’dossieronourwebsite(www.cbs.nl).
DirectorGeneralofStatistics
G.vanderVeen
Heerlen/TheHague,October2010

Internationalisation Monitor 2010 5
Table of ContentsIntroduction: the Internationalisation Monitor 2010 9
1.1 Introduction 91.2 Measuringinternationalisation:statisticalinnovation 101.3 Results 11
1.3.1Trends 111.3.2Traders–anin-depthanalysis 12
1.4 Structureofthepublication 131.5 Furtherdevelopments 14
A1 Trends in international trade in goods 171.1 Introduction 171.2 CompositionofDutchtrade 18
1.2.1Partnercountries 181.2.2Products 201.2.3Comparativeadvantagesanddisadvantages(Balassaindex) 211.2.4TheNetherlands’roleinglobaltrade 22
1.3 Thecurrentfinancialandeconomiccrisis 241.3.1Introduction 241.3.2Declineinimportsandexportsofgoods 26
1.4 Conclusion 28References 30
AnnexI 31Balassaindex(RevealedComparativeAdvantage): 31
A2 Trends in international trade in services 332.1 Introduction 332.2 DevelopmentsinDutchinternationaltradeinservices 332.3 CompositionofDutchinternationaltradeinservices 352.4 ThelargestimportandexportservicesmarketsfortheNetherlands 372.5 Comparativeadvantages:theBalassaindex 392.6 TheNetherlandsasservicespartnerforothercountries 402.7 Summaryandconclusions 43
References 43
A3 Trends in international direct investment 453.1 Introduction 453.2 TrendsintheNetherlands 46
3.2.1Flowsandstocks 463.2.2Trendsonsectorallevel 473.2.3Trendsoncountrylevel 48

6 Statistics Netherlands
3.3 ForeignAffiliateTradeStatistics(FATS) 503.4 TheNetherlandsinaninternationalperspective 51
3.4.1Trends:stocks 523.4.2Trendsonsectorallevel 543.4.3Trendsoncountrylevel 54
3.5 Conclusionsandfurtherresearch 55References 55
A4 Trends in international R&D and innovation in the Netherlands 574.1 Introduction 57
4.1.1Innovation:definition 584.2 Innovationinput 594.3 Innovationoutput 624.4 Dutchinnovationovertimeandinaninternationalperspective: benchmarkingpatentindicators 66
4.4.1Futuretechnologies 684.5 Summaryandconclusion 70
References 72
B1 International traders in goods and services – differences and similarities 731.1 Introduction 731.2 Methodologyanddatasets 74
1.2.1Internationaltradeingoodsstatistics(2002–2008) 741.2.2Servicestraders(2006–2008) 751.2.3Combiningthedatasets(2006–2008) 76
1.3 Populationcharacteristics 771.3.1Populationcount 771.3.2Differencesintermsofsizeclass 771.3.3Differencesintermsofeconomicactivity 791.3.4ForeigncontrolledtradersversusDutchcontrolledtraders 81
1.4 Conclusion 82References 83
B2 A closer look at Dutch goods and services traders 852.1 Introduction 852.2 Theoryandbackground 862.3 Methodologyandcompositionofdatasets 862.4 Results 88
2.4.1ContributionofspecifictraderstoDutchturnoverandvalue added 882.4.2Differencesinturnoverandlabourproductivity 892.4.3Theprobabilityofexportingandimporting 922.4.4Theprobabilityofbeinganexporterexpoundedforseveralfactors 94

Internationalisation Monitor 2010 7
2.5 Conclusions 97References 98
B3 In-depth analyses: international trade and R&D 1013.1 Introduction 101
3.1.1Tradeandknowledge 1023.1.2Structureofthischapter 102
3.2 Literaturereviewoninternationaltradeandknowledge 1033.2.1Self-selectioneffectsandproductivity 1033.2.2Innovationdiffusion 104
3.3 Dataandmethodology 1053.4 Tradeandknowledge 106
3.4.1Internationaltradeinhigh-techgoods 1063.4.2Keyeconomicindicatorsforaggregationsontechnologyand knowledgeintensity 108
3.5 Innovatorsandhigh-techexporters:theircharacteristics 1103.5.1Innovators 1103.5.2Exportersofhigh-techgoods 112
3.6 Summaryandconclusion 114References 115
B4 Wage and employee differences between trading and non-trading firms in the Netherlands 117
4.1 Introduction 1174.2 Theoryandbackground 1184.3 Dataandmethodology 1204.4 Results 1214.5 Regressionresults 1264.6 Discussionandconclusion 127
References 128
C1 International trade in goods by enterprises 131Introduction 131Changingmethodology 131
1.1 DistinguishinginternationaltradeingoodsbetweenDutchand foreigncontrolledenterprisesintheNetherlands 1341.2 Internationaltradeingoodsorganisedbysizeclass 1361.3 Internationaltradeingoodsbyindustry 1381.4 InternationalgoodstradersintheNetherlands 140

8 Statistics Netherlands
C2 International trade in services by enterprises 143Introduction 143
2.1 Overviewofinternationaltradeinservicesbyoriginoftheparent enterprise 1442.2 Internationaltradeinservicesorganisedbysizeclass 1462.3 Internationaltradeinservicesbyindustry 1482.4 InternationalservicestradersintheNetherlands 150
C3 Foreign Direct Investments 153Introduction 153
3.1 Foreigndirectinvestment:stocksandflows 1543.2 Foreigndirectinvestment:byeconomicsector 1563.3 Foreigndirectinvestment:bycountry 1583.4 ShareoftheNetherlandsinworldwideFDI 162
C4 Internationalisation of research and development (R&D) 165Introduction 165Classification 165
4.1 R&DexpendituresofforeigncontrolledenterprisesintheDutch businesssector 1664.2 Technologicalinnovationprofile 1684.3 Cooperationprofileofinnovators 1704.4 Grossdomesticexpenditureonresearchanddevelopment(GERD) 172
C5 International traffic and transport flows 175Introduction 175
5.1 Internationalairpassengertransport 1785.2 Internationalairfreightandmailtransport 1805.3 Internationalisationofgoodstransportflowbymodalityandby nationalityofthetransporters 1825.4 Internationalseacontainerflowbyoriginanddestination 186
C6 Internationalisation and employment 190Introduction 190
6.1 EmploymentinforeignandDutchcontrolledenterprises 1926.2 LabourturnoverrateatforeignandDutchcontrolledenterprises 1946.3aShareofhighandlow-paidemployeesinforeignandDutch controlledenterprises 1966.3bShareofhighandlow-paidemployeesinforeignandDutch controlledenterprises,byindustryandsizeclass 1986.4 LabourforcecompositioninforeignandDutchcontrolledenterprises 200
Contributors to the Internationalisation Monitor 2010 203

Internationalisation Monitor 2010 9
Introduction: the Internationalisation Monitor 2010
Fabienne Fortanier
1.1 Introduction
Globalisation has become a popular and much discussed topic over the past twodecades.Internationaldevelopmentshavemajorimplicationsparticularlyforasmalland open economy like the Netherlands. The recent financial and economic crisisillustratestheroletheinternationaleconomyplaysfortheNetherlands.Globaltradefell by 12.5percent in2009 –due to a collapse in demand, the drying up of tradefinance,andtheintegratednatureofglobalsupplychains(OECD,2010)–whichwasmirroredbyanevengreaterdecreaseinDutchexportsandimports.Thiscollapseofinternationaltradeexplainstwo-thirdsofthedeclineinDutchGDPin2009(SN,2010a).Atthesametime,thepositiveeconomicgrowthratesthatwererecordedforthefirsthalfof2010arealsolargelydrivenbyresurgingexports(SN,2010b).
Sinceinternationaltrade,butalsointernationalinvestmentsandotherdimensionsof globalisation play a vital role in the Dutch economy, it is not surprising thatpolicymakers and the public-at-large ask questions about the determinants ofglobalisationanditseffectsintermsofemployment,economicgrowth,sustainabilityanddevelopmentsovertime.Tohelpanswerthesequestions,StatisticsNetherlands(SN)aimstodevelopandpresentcoherentdataandstatistics,withcleardescriptionsandannotationsofthetrendsandimpactsofglobalisation.
Toachievethisambition,StatisticsNetherlandshasoverthepastfewyearsinitiatedaseriesofprojectstomatchexistingdatasetsinordertoconstructandpublishnewand relevant data on globalisation. The first results were published in Key Figures Internationalisation(2007)andtheInternationalisation Monitor (2008and2009).Thesepublications–andthis2010editionoftheInternationalisation Monitor–serveathreefoldgoal:– firstly, they monitor trends and developments in international trade and
international investment, and enterprise activities, bearing in mind therelationshipbetweenthesedevelopmentsandtheeconomicroleandpositionoftheNetherlandsinEuropeandintheworld;
– secondly,theyanalysetheconsequencesofthesetrendsanddevelopmentsforeconomicgrowth,wealth,thelabourmarketandinnovation;
– finally, they contribute to a well-balanced and factual discussion oninternationalisationandthepositionofDutchandforeigncontrolledenterprisesinthisdiscussion.

10 Statistics Netherlands
Inthisintroduction,wepresentthestructureofthiseditionoftheInternationalisationMonitor2010 and highlight the main findings. We start with the statisticalchallenges and innovations necessary to capture a widespread and complexphenomenonsuchasglobalisation.Inthesubsequentsectionswesummarisethemaintrendsandconclusionsformulatedthroughoutthispublication.
1.2 Measuring internationalisation: statistical innovation
Measuringtheprocessofglobalisationaccuratelyandconsistentlyisanenormouschallenge for statisticalauthorities.Existingstatistical conceptsand frameworks–for instance, various macroeconomic indicators, systems of national accounts,andbalanceofpaymentsprinciples–becomeincreasinglydifficulttoconstruct.Inaddition, the ever-expanding activities of enterprises (and persons) abroad areinherentlydifficulttoobservebystatisticalagencies,whichareoftenrestrictedtoanationalmandateand locality. It is alsoamajor challenge toembody themanydimensions and effects of globalisation such that it justifies the intrinsic andmethodological subtleties of the individual indicators as well as theinterconnectednessofthedimensions.
In multidimensional and complex discussions, statistical agencies have anobligationandaresponsibilitytoprevent,basedontheirdataandanalyses,partialorincorrectconclusionsbeingdrawn.Athoroughknowledgeofthemainconceptsandsubjectsofdebatewithinthethemearenecessarytoidentifywhichindicatorsand figures are most significant in political and policy debate. Additionally, toensure the correct interpretation of the data and figures, it is very important toexplainclearlywhichdataareusedtoconstructthestatisticsandindicatorsandtoillustrate the trends within a context, while the limitations of the data and themethodsused,areexplicitlydescribed.Theseconsiderationshavematerialisedinthe Internationalisation Monitor2010, where several descriptive and analyticalpapers are combined with a large number of annotated tables on variousglobalisationindicators.
Eachyear,theInternationalisationMonitorpresentsawidevarietyofnewstatisticsonthenatureandconsequencesoftheinternationalisationoftheDutcheconomy.Oneofthekeysourcesforthesenewstatisticsistheintegrationofmicro-datafromvarioussources(surveysandregisters)availableatStatisticsNetherlands.Manyoftheinnovationsmadeinpreviouseditionscannowbefoundas‘regular’outputinpartCofthispublication.
Thiseditionalsoincludesaseriesofanalyticalpapersoninternationaltradeandthe characteristics of firms that are responsible for exports and imports. Byexpanding the dataset that links the General Business Register to International

Internationalisation Monitor 2010 11
Trade data with information on various economic, employment and innovationindicators,webuilda coherentpictureof the similaritiesanddifferencesacrossexporters,importersandtwo-waytraders(i.e.,enterprisesengagedinbothexportandimport)onvariousdimensions.
1.3 Results
ThissectionfocusesonthemainresultsofthearticlesandannotatedtablesintheInternationalisation Monitor2010. Firstly, we describe the trends ininternationalisationbyfocusinginparticularonthedevelopmentsininternationaltradeingoodsandservices,foreigndirectinvestment,andtechnology.Secondly,wesummarisetheresultsofthefocusedpapersanalysingthekeythemesofthispublication:internationaltradeandthecharacteristicsoftheenterprisesresponsibleforDutchimportsandexports.
1.3.1 Trends
From2002totherecenteconomiccrisis,internationaltradeingoodshasincreasedonaverageby10percenteachyear(seechapterA1).AlthoughasignificantpartofDutchtraderemainswiththeEuropeanUnion, theshareof importsoriginatingfromEUcountrieshasdecreasedsince1996,from64percentto55percentin2009.ThemainreasonbehindthisdevelopmentisthesurgeinimportsfromChina.TheshareofexportstotheEuropeanUnionhasalsodecreasedsince1996,toroughly75percentin2009.NearlyhalfthegoodsexportedtotheEuropeanUnionin2009consistedofre-exports.
The economic crisis resulted in a strong decline in Dutch exports of almost22percent in2009, and goods imports decreased even more strongly. The firstquarterof2010markedanupturnintrade,moresoforexportsthanforimports,drivenbyastrongrecoveryinChinaandotherdevelopingAsiancountries.
Inadditiontogoods,servicesarealsoimportantininternationaltrade,andhaveasimilargeographiccomposition(seechapterA2).Theservicessectorhaslongbeenconsideredasnon-tradable,butsincethemid1990s,servicesexportsaccountforapproximately20percentoftotalexports.Approximatelyhalfthevalueofservicestradeisdonebyforeigncontrolledenterprises.
Theroleof foreignenterprises isalsoapparent in thestatisticson foreigndirectinvestment (FDI) and the activities of foreign affiliates in the Netherlands (seechapterA3).Asageneraltrend,theshareofforeigncontrolledenterprisesintheprivateDutchsectorisontheincrease.In2008,theseenterprisesgeneratedmorethan a fifth of the added value, one-sixth of employment and nearly a third of

12 Statistics Netherlands
turnoverintheprivatesector.However,likeotherinternationaleconomicrelations,Dutch inward and outward FDI was strongly affected by the economic crisis.Incomingandoutgoingdirect investmentflowseventurnednegative inseveralquartersof2008and2009,andstocksofinwardandoutwardDutchFDIdecreasedfor the first time in many years.A very substantial part of these dynamics canhoweverbeexplainedbytheactivitiessurroundingonesinglefirm:theacquisitionof ABN AMRO by Santander, Fortis and the Royal Bank of Scotland, and thesubsequentpurchaseofFortisbytheDutchgovernment.
Asafinaldimensionof theanalysisof internationalisation trends,wenote thatDutch innovative performance is relatively internationally oriented, given theshareofR&Dinvestmentsbyforeigncontrolledenterprises (30percent in2008),and theprominenceof tradingfirmsamong investors inR&D(seechapterA4).This is partly caused by size effects: a small number of large enterprises areresponsible for the majority of R&D, and also trading enterprises and foreigncontrolled enterprises are often larger than their counterparts that are notinternationally active. Since 2002 total R&D investments in the Dutch businesssector increased by 16percent (2008), while the share of enterprises with R&Dactivitiesdecreasedbyonepercent.CorrectedforinflationtheR&Dinvestementsin 2008 are on par with those in 2002. The resulting innovations from R&Dinvestments are often reflected in patents. Although Dutch patent applicationshavestagnatedsince2002andevendeclinedsince2004,thereisarelativelyhighfocusonthefuturetechnologypatentclasseswhichmightpresentopportunitiesforfutureproductivityandwelfaregrowth.
1.3.2 Traders – an in-depth analysis
Thevolumeofinternationaltradeingoodsandservicesisoftenusedasameasureofopennessandintegrationofeconomieswiththerestoftheworld.However,thedrivers of these macro-economic developments are the enterprises that pursueinternational sales (or purchases) in order to expand their market. Hence, anunderstandingofthecharacteristicsofthesefirmshelpsustogetabettergraspoftrendsininternationaltrade.
ResultsfortheNetherlandsconfirmtheinternationalstylisedfactsforexportersofgoods,inthattheyaregenerallylarger,moreprofitable,andpayhigherwages.Butwe know far less about the characteristics of importers and two-way traders ofgoods, and about traders in services. Chapter B1 presents new datasets oninternationaltradersingoodsandservicesinordertodescribethemainsimilaritiesanddifferencesbetween thesevarious typesof international traders in termsofeconomic activity, enterprise size, ownership, productivity (B2), R&D andinnovation(B3),andwagesandemploymentcharacteristics(B4):

Internationalisation Monitor 2010 13
We find that traders in goods and services are larger (in terms of employeenumbers)thanenterprisesthattradedineithergoodsorservicesalone.Exportersandimportersofservicesaresomewhatlargerthantradersingoods,butsmallerthanenterprisesthatengagedinboththetradeofgoodsandservices.Asaresultoftheir larger size, in2008, exporters of goods and/or services generated almost80percent of total Dutch turnover and two-thirds of total value added. Theseshareswereevenhigherforimportersofgoodsand/orservices.Tradersingoodsweremostlyfoundinwholesaleandretailtradesectors,whereastradersinservicesaregenerallyactiveinrealestate,rentalandbusinessactivities.
Exportersandimportersaremoreproductiveandmoreinnovativethanfirmsthatdonotengageineitherexportsorimports.Inaddition,foreigncontrolledexportersandimporterswerealsosignificantlymoreproductive,innovative,andlargerthantheirDutchcontrolledcounterparts.In2008,almost30percentoftheexportersofgoods and services were foreign controlled, and 34percent of importers.Particularlyfirmsthatexporthigh-techgoodscanbecharacterisedas(very)largein size, and are relatively often foreign controlled and have their own R&Dactivities.
Finally, we established that exporters, importers and two-way traders paysignificantly higher wages than non-trading firms. This is partly a reflection ofhigherlevelsofproductivityoftradingfirms(necessarytocounteractthecostsofdoing business overseas), but partly also a reflection of the differences in thecompositionoftheworkforceofexportersandimporters.Forexample,exportersand two-way traders employ relatively highly-educated employees, and fewerwomen. Similarly, differences in other firm characteristics influence the wagedifferential between trading and non-trading firms. For example, enterprisesengagedinexportsorimportsaremuchmorelikelytobeforeigncontrolled,andithas been established that foreign subsidiaries pay higher wages e.g. to forestalllabour turnover (cf. the InternationalisationMonitor2009).Yet, evencontrollingforthosedifferences,weestablishedwagepremiumsof7percentand5percentforimporters and exporters (including two-way traders) respectively, although theresultswerenotextremelysignificant,suggestingthatthewagepremiumiswhollycausedbydifferencesinthecompositionoftheworkforce.
1.4 Structure of the publication
The current format of the Internationalisation Monitor2010 improves upon thesetupwedevelopedinpreviousyears.Itnowincludesanentirelynewsection(A)with chapters on trends, in addition to the focused analytical section (B) oninternational trade and international traders, and the annotated tables (C). ThepublicationistheresultofclosecooperationwithdifferentresearchersinStatistics

14 Statistics Netherlands
Netherlands, and as such reflects the variety of statistics available in ourorganisation’sportfolio.
Section A describes and monitors trends in several key areas of internationaleconomicactivity.ChapterA1focusesontradeingoods,chapterA2ontradeinservices,chapterA3onforeigndirectinvestment,andchapterA4oninternationaltechnologyandR&D.Allchaptersdescribethemaindevelopmentsandtrendsupto the latest possible moment (generally 2008 or 2009), highlighting geographicand sectoral patterns. In addition, each chapter also benchmarks Dutchdevelopmentsagainstseveralothercountries,includingneighbourslikeGermanyandcountriesthatsharetheDutchnatureofasmall,openeconomy,likeSweden.
Section B then presents a set of 4papers that all focus on a selected topic. Thisyear’s topic is international traders: thecharacteristicsofenterprisesengagedinexports, imports or both. Chapter B1 first explores how trade in goods and inservices are related. Subsequent chapters report on the differences across thevarious types of trade with respect to their economic characteristics such asproductivity and turnover) (B2), innovation activities (B3) and employmentcharacteristics(B4).Eachchapterreportsbreakdownsbysectors(manufacturing,wholesale trade, services), size class and by locus of control (foreign versusdomestic).
Finally,sectionCpresentsasetofannotatedtablesthatwillberegularlyupdated.SomeofthesetablescanalreadybefoundonStatline,othersareintheprocessofbeing made available through that channel. The tables are closely linked to thetopics in sectionA, and involve trade ingoods, trade in services, foreigndirectinvestment,R&D,transportandemployment.
1.5 Further developments
While publication of the Internationalisation Monitor2010 presents yet anotherstepinpublishingmoredetailedandmorecoherentdataonglobalisationanditsconsequences for the Netherlands, additional research remains necessary. Manytopicsthatarecentraltothedebateonglobalisationandinternationalisationhavenot yet been addressed. Examples include international outsourcing, regionaldistributionofwealthandwelfare,internationalmigration,entrepreneurshipandentrepreneurial behaviour. As we move from static comparison to analyses ofdynamics and changes over time, the need for (international) enterprisedemographyalsobecomesincreasinglyapparent.
ThisInternationalisationMonitor2010isthethirdinaseriesofsimilarpublicationsthatareplanned for thecomingyears,whichwill furtherdescribe theextentof
Internationalisation Monitor 2010 15
internationalisation of the Dutch economy and the consequences of thatinternationalorientationforenterprisesandindividuals.
StatisticsNetherlandshasalreadyembarkedonseveralnewprojectsontheabove-mentionedtopics,orwillstarttodosointhenearfuture.Manyoftheseinvolvematching existing micro-level datasets and involve collaboration with strategicpartnersincludinge.g.theMinistryofEconomicAffairs,theDutchCentralBank(DNB),theDutchBureauforEconomicPolicyAnalysis(CPB),EIMBusinessandPolicy Research (SMEs and Entrepreneurship), universities, and Eurostat. Thisallows for the pooling of expertise and knowledge, and guarantees broaddisseminationoftheresearchfindings.
References
OECD(2010).Trade, policy and the economic crisis,Paris.StatisticsNetherlands(2009).Internationalisation Monitor 2009,TheHague/Heerlen.StatisticsNetherlands(2010a).De Nederlandse Economie 2009,TheHague/Heerlen.StatisticsNetherlands (2010b).De Nederlandse Economie per kwartaal,TheHague/Heerlen.

Internationalisation Monitor 2010 17
A1 Trends in international trade in goodsMarjolijn Jaarsma
1.1 Introduction
InternationaltradeisvitallyimportanttotheDutcheconomy.TheNetherlandshasbeenatradingnationforcenturies,withitsprosperitydependingtoalargedegreeonfreeandprofitableinternationalrelationswithothercountries.Where,attheendofthe19thcentury,manysmalleconomiesstartedtospecialiseinparticulareconomicactivities,ofteninlinewiththeircomparativeadvantage,theNetherlandsdidnotconfine itself to any specific activity. Instead, the country transformed into adiversifiedandmulti-facetedeconomywitha strong focuson international tradeandassociatedservices(VanZanden,1997).Owingtoitsgeographiclocation,theNetherlandsisperfectlypositionedasagatewaytoEuropeforgoodsfromthroughouttheworld.Moreover,thecreationandintegrationoftheEuropeanUnion,theSingleEuropean Market and the introduction of the euro have also contributed to thealready increasing number of international transactions and trade flows, andprovidedthefoundationfortheeconomicgrowthofthepreviousdecades.
GraphA1.1illustratestheroleofinternationaltradeonthedevelopmentofDutchGDPinthepasttwentyyears.TheshareoftotalexportsorimportsinGDPisafrequently used indicator of trade intensity, as it shows the extent to which theeconomydependsonforeignsalesandpurchases.In1990,Dutchexportsofgoodsequalled 46percent of Dutch GDP. By2008, this share had increased to almost62percentofGDP,whileimportsofgoodsamountedtoalmost55percentofGDP.ThenetcontributionoftradetoGDP,thetradebalance,hasalsorisenduringthepast20years,fromalmost4percentofGDPtoover7percentin2008.
TheDutcheconomyhasnotbeensparedfromtheimpactofthecurrentworldwidefinancialcrisis.Tradefiguresshowedunprecedenteddeclinesthathavenotbeenseen in recentdecadesandat themoment thenational economy isonly slowlyrecovering.TheprimarydevelopmentsandtrendsinDutchtradeandtheimpactofthecrisisonDutchtradearethemaintopicsofthischapter.Section1.2startswith an overview of the structure of Dutch trade in terms of partner countries,goodsandrelativecomparativeadvantagesasmeasuredbytheBalassaindex.ThissectionalsoanalysestheDutchtradingpositioninaninternationallycomparativeperspective. Section 1.3 examines the impact of the economic crisis on Dutcheconomicgrowthandtradesofar,comparedwithabenchmarkofothercountries.Thechapterconcludeswithashortsummaryinsection1.4.

18 Statistics Netherlands
A1.1 Trade in goods as share of GDP
Source: Statistics Netherlands, StatLine, National Accounts.
0
1
2
3
4
5
6
7
8
0
10
20
30
40
50
60
70
80
1990 1991 1992 1993 1994 1995 1996 1997 1998 1999 2000 2001 2002 2003 2004 2005 2006 2007 2008* 2009*
%%
Exports of goods (L) Imports of goods (L) Trade balance (R)
1.2 Composition of Dutch trade
1.2.1 Partner countries
TableA1.1showshowDutchtradeingoodswithitsmainpartnercountrieshasdevelopedsincethemid-90s.Thetotalimportvaluealmostdoubledbetween1996and 2009, increasing from 140billion to 274billion euros. A significant part ofDutch trade was with the European Union, which is not only explained bygeographical and historical factors, but also by increased European integration.Nevertheless, the shareof importsoriginating fromEUcountrieshasdecreasedsince1996,from64percentto55percentin2009.Theimportvalueofgoodsfromnon-EU countries was almost 2.5times greater in2009 than in1996. The mainreason behind this development is the surge in imports from China. In1996,importsfromChinaconstitutedabout1percentofDutchimports,whichincreasedtoroughly8percentin2009andthefirstquarterof2010.However,asignificantpart of this trade consists of re-exports, implying that the goods are ultimatelydestinedforotherEUcountries.Intheobservedperiod,importsfromtheCzechRepublic,Hungary,Polandand theRussianFederationalso increasedrelativelystrongly.
The total export value was also twice as high in2009 compared with 1996,increasingfrom154billionto309billioneuros.ThebulkofDutchexportswenttothe European Union, although this share decreased somewhat since 1996, toroughly75percentin2009andthefirstquarterof2010.Around48percentofthegoodsexportedtotheEuropeanUnionin2009consistedofre-exports,illustrating

Internationalisation Monitor 2010 19
theroleoftheNetherlandsasagatewaytoEurope.Atalmost66percent,theshareof re-exports was highest for goods going to the Czech Republic in2009.Alternatively,approximatelyathirdofexportsgoingtonon-EUcountriesconsistedofre-exports.
Table A1.1 International trade in goods by partner country
Importvalue Exportvalue Re- exports 1996 2008 2009 2010Q1* 1996 2008 2009 2010Q1* 2009*
million euro %
Total 139,913 335,921 274,020 77,116 153,752 370,480 309,359 87,459 44.0
EU 89,616 185,125 151,824 42,020 121,773 282,730 231,337 65,900 47.9Non-EU 50,297 150,796 122,196 35,096 31,979 87,750 78,022 21,559 32.7
Argentina 547 1,561 1,518 306 191 273 291 223 .Austria 1,198 2,007 1,636 427 2,342 4,871 4,102 1,149 50.1Belgium(inclLuxem-bourgupto1999) 15,905 33,896 27,452 7,538 21,218 42,967 34,619 10,181 40.9Brazil 1,316 4,854 3,893 827 607 1,231 1,109 445 34.1Bulgaria . 219 187 47 . 554 413 112 .Canada 711 1,540 1,110 319 483 1,725 1,391 288 39.9China 1,965 25,000 21,948 6,360 592 3,852 4,589 1,250 33.9Cyprus . 82 83 24 . 369 324 90 .CzechRepublic 297 3,701 3,761 1,119 568 4,481 3,818 1,135 65.6Denmark 1,643 3,529 2,975 630 2,591 5,061 4,076 1,135 45.0Estonia . 154 346 110 . 357 264 66 .Finland 1,287 3,606 2,640 826 1,254 3,686 2,888 889 53.1France 9,934 16,884 13,591 3,,638 16,491 32,375 27,484 7,874 47.1Germany 31,805 64,622 52,537 13,941 43,800 90,618 75,225 21,423 48.4Greece 229 432 389 101 1,292 3,018 2,571 646 48.1HongKong 1,735 1,754 1,800 462 898 1,091 1,151 297 45.1Hungary 377 2,004 1,845 571 410 2,725 2,108 556 54.9Ireland 1,591 3,534 3,154 822 1,048 3,318 2,600 650 40.8Italy 5,407 7,962 6,322 1,762 8,550 19,608 16,007 4,637 48.9Japan 4,932 9,492 7,251 2,108 1,682 2,945 2,381 672 22.6Latvia . 202 152 23 . 427 230 63 .Lithuania . 281 312 138 . 611 449 117 .Luxembourg(asof2000) 1,200 716 163 . 1,198 959 273 .Malta . 16 40 55 . 178 247 54 .Poland 763 3,938 3,595 1,119 1,225 7,261 5,948 1,692 55.0Portugal 960 1,304 1,088 301 1,147 2,460 2,413 664 49.4Romania . 912 957 200 na 1,732 1,298 342 45.2RussianFederation 1,293 13,036 9,628 3,134 1,388 6,559 4,419 1,161 41.6Slovakia . 1,182 1,118 249 . 1,068 890 258 .Slovenia . 274 228 60 . 650 528 146 .Spain 2,806 5,988 4,799 1,569 4,233 12,730 10,512 3,068 56.2Sweden 3,545 5,737 3,992 1076 3,407 6,463 5,185 1,552 52.1Turkey 606 1,642 1,367 382 1,119 3,850 3,482 1,001 45.0UnitedKingdom 13,306 21,224 17,648 5,438 14,400 33,586 25,879 7,044 47.0UnitedStates 11,283 27,042 22,995 5,820 5,299 16,472 13,928 3,620 26.9
Restofworld 24,471 65,108 50,948 15,450 17,516 50,111 45,583 12,688 .
Source:StatisticsNetherlands,StatLine,Internationaltradeingoods(extracted:13-8-2010).

20 Statistics Netherlands
The above illustrates that the Netherlands continues to be a country activelyengagedintradewithEuropeandtherestoftheworld.TheincreasingshareofimportsoriginatingfromoutsidetheEU15,whileexporttradewiththeinternalmarket ismaintained, implies thatglobalisationhasresulted intheNetherlandsenjoyingaspecialpositioninintegratedglobalvaluechains.
1.2.2 Products
TableA1.2showsthepatternofgoodsimported,exportedandre-exportedbetween1996 and the first quarter of 2010. In1996, the total value of imported goodsamountedto140billioneuros.By2008,importswere2.4timeshigher,amountingto336billioneuros.TheworldwideeconomiccrisisaffectedDutchtradeasofthethirdquarterof2008,causingtradevaluestodropsignificantly.Assuch,in2009theimportvaluehaddecreasedby62billioneuroscomparedwith2008.
Table A1.2 Imports, exports and re-exports of commodities by SITC classification
Imports Exports Re-exports1)
1996 2008 2009 2010- 1996 2008 2009 2010- 2008 2009 2010- Q1* Q1* Q1*
billion euro % of exports
Total 140 336 274 77 154 370 309 87 42 44 44
Foodandliveanimals 14 27 26 7 24 42 40 11 25 25 26Beveragesandtobacco 2 3 3 1 4 6 6 1 13 12 11Crudematerials,inedibleex.fuels 6 14 10 3 8 18 15 5 31 27 32Mineralfuels,lubricants,relatedmaterials 11 61 43 14 11 57 38 12 18 24 25Animalandvegetableoils,fatsandwaxes 1 3 2 1 1 4 3 1 27 20 21Chemicalsandrelatedproducts 17 48 44 12 25 66 59 17 36 43 40Manufacturedgoodsclassifiedbymaterials 21 39 28 8 19 35 27 8 38 37 39Machineryandtransportequipment 48 102 83 23 44 107 88 25 62 64 62Miscellaneousmanufacturedarticles 19 37 34 9 16 33 31 8 68 69 69Commoditiesnotclassifiedelsewhere 0 1 1 0 0 2 2 0 7 21 49
Source:StatisticsNetherlands,StatLine,InternationalTradeinGoods(extracted:13-8-2010).
1) Nofiguresfor1996available.

Internationalisation Monitor 2010 21
At102billioneuros, importsofmachineryandtransportequipment formedthebulkofDutchimportsin2008,followedbychemicalsandmineralfuels.Combined,thesethreecategoriesconstituted63percentofDutchimportsin2008.Remarkably,thisshareremainedfairlystablein2009andinthefirstquarterof2010,indicatingthat the impact the crisishadon trade in thevarious typesofgoodswas fairlyuniform.ThecompositionofDutchexportsisquitesimilartothatof imports.Duetotherecession,thetotalexportvaluealsodecreasedbyroughly61billioneurosbetween2008and2009.ThemainexportproductsfromtheNetherlandsweremachineryandtransportequipment,chemicalsandrelatedproductsandmineralfuels.Theshare of re-exports was high in the observed period, mainly in miscellaneousmanufacturedarticlesandinmachineryandtransportequipment,varyingbetween62andalmost70percent.Exportedbeveragesandtobaccoweremainlyproduceddomestically, while mineral fuels and chemical products displayed increasingsharesofre-exportssince2008.
1.2.3 Comparative advantages and disadvantages (Balassa index)
AsthefiguresinGraphA1.2show,theNetherlandstraditionallyhasaverystrongcomparativeadvantageintheexportoflivetreesandotherplants,suchasbulbs,roots and cut flowers compared with the EU14 (Balassa index, see Annex I),although by 2009 this comparative advantage had decreased somewhat. Otherproducts in which the Netherlands had a comparative advantage in both yearswere, for instance, tobacco, edible vegetables, and residues and waste from thefoodindustry.ComparedwiththeEU14,theNetherlandsisrelativelyspecialisedintheexportofflowersandplantsandingoodsoriginatingfromtheagro-foodsector.Productsinwhichthecomparativeadvantagehasincreasedcomparedwith1996areoilseeds,(oleaginous)fruits,grainsandseeds,vegetableplaitingmaterialaswellascrudematerialsandarticlesthereof,suchastinandore.In2009 there were four commodity chapters in which the Netherlands haddevelopedacomparativeadvantagecomparedwiththeEU14,i.e.whereithadadisadvantagein1995.Thesewerewood,pulp,orotherfibrouscellulosicmaterial,wasteandscrappaperorpaperboard(HS47),electricalmachineryandequipment(HS85),musicalinstrumentsandpartsthereof(HS92)andnuclearreactors,boilers,machinery and mechanical appliances (HS84). There were eight commoditychapters in which the Netherlands lost its comparative advantage to the EU14between1996and2009.However,inmostcasestheindexremainscloseto1in2009,indicatingthattherewasnostrongdisadvantagerelativetotheEU14.Insum,itcanbeconcludedthattheNetherlandshasmanagedtomaintainitscompetitiveedgeingoodswherethecomparativeadvantagewasthegreatestin1996.However,thecommoditychaptersforwhichtheNetherlandshadacomparativeadvantagein2009showedanevengreateradvantagein1996.

22 Statistics Netherlands
A1.2 Balassa index 1)
Source: Easy Comext, EU27 Trade Since 1995 by HS2-HS4 (includes quasi-transit trade).1) Full description of commodity chapters in Annex I.
0
5
10
15
20
25
30
6 24 7 23 67 46 12 14 80 26 75 27
index Comparative advantage
1996
0
0.1
0.2
0.3
0.4
0.5
0.6
0.7
0.8
50 45 71 97 88 86 51 10 43 60
index Comparative disadvantage
2009*
1.2.4 The Netherlands’ role in global trade
Evena small country like theNetherlandscanplayan important role inglobaltrade. Graph A1.3 shows that in1970, the Netherlands was the sixth largestimporter in the world, accounting for approximately 5percent of total worldimports.Whilethissharehadfallento3percentby2008,itremainsonlyaslightlysmallersharethancountriessuchasFranceortheUK.Thelargestimporterintheobserved period, the United States, imported approximately 13percent of alltradedgoodsworldwide.In2008,Germanywasstillthesecondlargestimporterintheworld,with7percentoftotalimports.WorthyofnoteistheriseofChinaasatradingnation,accountingforalmost7percentofworldimportsin2008,comparedwith1percentin1970.
In1970,theNetherlandsaccountedforroughly4percentofworldexportsandthisshare has remained stable throughout the past four decades. As a result, theNetherlandshasgone frombeing theseventh largestexporter tobeing thefifthin2008.GermanyhastakenovertheroleoftheUnitedStatesasthelargestexporterworldwide, only just ahead of China in2008. In2008, Germany, China and theUnitedStatescombinedexportedalittleover25percentofallcommoditiesintheworld. Compared with 1970, developing Asian countries and south Americancountriescurrentlyaccountforanincreasinglylargeshareinworldexports.

Internationalisation Monitor 2010 23
A1.3 Share of Dutch trade in world trade
Source: UNCTAD, Handbook of Statistics Online (extracted 6-8-2010).
Imports, 2008
United States Germany China Japan France United Kingdom Netherlands Italy Belgium Canada China, Hong Kong SARRussian Federation Denmark Rest of the world
Imports, 1970
Exports, 2008
Germany China United States Japan Netherlands France Italy Belgium Russian Federation United Kingdom Canada China, Hong Kong SAR Denmark Rest of the world
Exports, 1970
United StatesGermany (former Federal Rep.) United KingdomJapanFranceCanadaNetherlandsItalyBelgiumGermany (former Dem. Rep.)DenmarkChina, Hong Kong SARChinaRest of the world
United StatesGermany (former Federal Rep.)United KingdomFranceJapanNetherlandsItalyCanadaBelgiumGermany (former Dem. Rep.)DenmarkChina, Hong Kong SARChinaRest of the world
Countries forwhich theNetherlandswasarelatively important tradingpartnerin2008areshowninTableA1.3.TheNetherlandsplaysthemostimportantroleforneighbouringcountries.In2008,Belgiumexportedapproximately12percentofitstotalexportstotheNetherlandsandimportedalmostafifthofitsimportsfromtheNetherlands. The Netherlands is also an important partner country in terms ofimports and exports for Germany, the United Kingdom, Luxembourg, andDenmark.
RemarkablearealsotherelativelylargesharesofIcelandicandNorwegianexportsgoingtotheNetherlands.In2008,roughly34percentofIcelandicexportswenttotheNetherlands.Almost85percentoftheseexportsconsistedofaluminiumandrelatedarticles.Roughly10percentofNorway’sexportswenttotheNetherlandsin2008,whichconsistedofapproximately75percentmineral fuels,mineraloilsandproductsoftheirdistillation.

24 Statistics Netherlands
Table A1.3 The role of the Netherlands in trade of selected countries, 2008
Shareofexportsgoingto Shareofimportscomingfrom theNetherlands theNetherlands
%
Belgium 12 19Germany 6 8UnitedKingdom 8 7Denmark 4 7Luxembourg 6 6Iceland 34 6Sweden 5 6Italy 2 5Ireland 4 5Greece 2 5Switzerland 3 5Hungary 3 5Portugal 3 4Finland 5 4Norway 10 4France 4 4Spain 3 4Poland 4 3CzechRepublic 4 3Austria 2 3Turkey 2 2Mexico 1 1SlovakRepublic 3 1UnitedStates 3 1Australia 2 1NewZealand 1 1Korea 2 1Canada 1 1Japan 3 1
Source:OECDOlisnet(extracted:6-8-2010).
1.3 The current financial and economic crisis
1.3.1 Introduction
It took some time before the worldwide financial crisis, which began on theAmericanhousingmarket inAugust2007, took its tollon theeconomyat large(WTO,2009).ThecollapseofseveralWallStreet institutionsandthesubsequentmajorgovernmentbailoutsofnationalbankslate2008andearly2009intensifiedthe financial downturn and marked a sharp drop in economic growth andinternationaltradethroughoutdevelopedanddevelopingcountries.Asignificantreductioninconsumerandbusinessconfidence,fuelledbythecreditcrunchandthereluctanceofthefinancialsectortoreleasefinancialresources,causedastrongdecline indemandwhich, combinedwithdeclining inflationpressures, led toa

Internationalisation Monitor 2010 25
significant slowdown in global production. Through the mechanism of globalsupplychainsandintegratedfinancialandcapitalmarkets,virtuallynocountryormarketwasspared.
A1.4 GDP and trade growth (% change on previous quarter)
Source: OECD Olisnet; Quarterly National Accounts.
–12–10–8–6–4–202468
2007
Q1
2007
Q2
2007
Q3
2007
Q4
2008
Q1
2008
Q2
2008
Q3
2008
Q4
2009
Q1
2009
Q2
2009
Q3
2009
Q4
2010
Q1
% United States
Imports of goods and services Exports of goods and services GDP
2007
Q1
2007
Q2
2007
Q3
2007
Q4
2008
Q1
2008
Q2
2008
Q3
2008
Q4
2009
Q1
2009
Q2
2009
Q3
2009
Q4
2010
Q1
% European Union (27)
2007
Q1
2007
Q2
2007
Q3
2007
Q4
2008
Q1
2008
Q2
2008
Q3
2008
Q4
2009
Q1
2009
Q2
2009
Q3
2009
Q4
2010
Q1
% OECD (total)
–12–10–8–6–4–202468
–12–10–8–6–4–202468
–12–10–8–6–4–202468
2007
Q1
2007
Q2
2007
Q3
2007
Q4
2008
Q1
2008
Q2
2008
Q3
2008
Q4
2009
Q1
2009
Q2
2009
Q3
2009
Q4
2010
Q1
% The Netherlands
GraphA1.4showsthatformosteconomies,thesecondquarterof2008markedthestartoftherecessionasaresultoftheeconomiccrisis.TheDutcheconomydidnotgrow in this quarter and contracted substantially in the ensuing four quarters.Hugenegativegrowthrateswerealsorecordedforimportandexportvolumesinmanycountriesandthistrendcontinuedwell into2009.Mostcountrieshitrockbottominthefirstquarterof2009intermsofimportandexportdecline.OECDcountriesingeneralhadalreadyrealisedpositiveexportandeconomicgrowthinthesecondquarterof2009,whileEuropeancountriesandtheUnitedStatesslowlyrecoveredasofthethirdquarter.Thefirstquarterof2010showsminimalpositiveeconomic growth rates, whereas imports and exports are already growing at afasterpace.

26 Statistics Netherlands
1.3.2 Decline in imports and exports of goods
Acrosstheboard,thedeclineintradevolumein2009isunprecedentedinrecenteconomichistory.ThemerchandiseexportsoftheNetherlandsdecreasedbyalmost22percent in2009, while goods imports decreased even more strongly. TheinternationaltradeingoodsinneighbouringcountriessuchasBelgium,Denmark,GermanyandtheUnitedKingdomdeclinedinthesameorderofmagnitude.Italyand Sweden were hit somewhat harder by the economic crisis than other EUcountries and experienced negative growth rates in their international trade ofalmost30percent.TheEuropeanUnionasawholesawitsimportsofgoodsdeclinefasterthanitsexports,namelyby25percentin2009.
TheRussianFederationexperiencedthestrongestdeclineintradeofthecountriesinTable1.Thecountry’sexportsofgoodsdecreasedbyalmost36percentcomparedwith2008,andimportsonlyslightlylessso.TheinternationaltradeingoodsfromChinaandHongKongseemtobelessaffectedbytheeconomicdownturn,sincetheirtradeingoodsshranktheleastcomparedwithothermajortraders.China’simports decreased by some 11percent in2009, while its exports decreased byalmost 16percent compared with 2008. The United States also experienced acomparatively modest decline in exports in2009. The devaluation of the dollaragainsttheeuromaypossiblyhavebeenbeneficialforUSexports,whilethecreditcrunch and job losses had a negative impact on domestic demand leading to adeclineinimports,aswasthecaseinothercountries.
Table A1.4 Export and import growth
Export Import
2007 2008 2009 2010Q1 2007 2008 2009 2010Q1
% change on one year previously
Argentina 19.8 25.5 –20.5 10.8 30.9 28.4 –32.5 33.1Belgium 17.5 9.8 –21.8 21.4 17.2 13.4 –24.7 19.1Brazil 16.6 23.2 –22.7 25.8 32.1 44.0 –26.7 36.2China 25.7 17.4 –16.0 28.7 20.7 18.5 –11.2 64.7Denmark 11.4 13.2 –19.8 10.4 14.7 12.2 –24.9 –1.1EU27 16.3 11.1 –22.6 17.8 16.0 12.6 –25.0 15.8France 11.4 11.7 –21.5 14.1 14.5 15.6 –21.9 13.0Germany 19.2 9.6 –22.2 16.8 16.4 12.3 –20.9 12.4HongKong 8.8 5.3 –12.2 25.8 10.0 5.6 –10.6 34.2Italy 19.9 8.9 –25.5 13.0 15.6 10.0 –26.8 17.4Japan 10.4 9.5 –25.7 48.4 7.4 22.6 –27.6 22.7Netherlands 18.9 15.8 –21.9 21.5 18.3 17.9 –23.3 20.0RussianFederation 16.8 33.1 –35.7 61.1 36.0 30.6 –34.3 18.7Sweden 14.3 8.8 –28.6 22.4 19.6 10.7 –29.0 26.6Turkey 25.4 23.1 –22.6 6.3 21.8 18.8 –30.2 33.3UnitedKingdom –1.9 4.9 –23.4 22.0 3.8 1.9 –24.1 19.0UnitedStates 11.9 12.1 –18.0 20.5 5.3 7.4 –26.0 20.5
Source:EasyComext,Eurostat(extracted:18-8-2010);WTOstatistics;MonthlyMerchandiseTrade.

Internationalisation Monitor 2010 27
Adifferentwayofpresentingtheeffect thecrisishadontrade is tomeasure itsimpact and depth simultaneously (Bergeijk, 2009). Graph A1.5 shows, for aselection of countries, the depth and duration of the reduction in imports andexportsduetothepresenteconomiccrisis.Tradedeclineismeasuredinpercentagesfrompeak(i.e.thequarterinwhichtradewasatitshighestpoint)totrough(i.e.thequarterinwhichtradevaluewasatitslowestpoint).Durationismeasuredasthenumber of quarters in which imports (exports) decreased compared with thepreviousquarter.
Thecontractionoftrade(inpercentages)wassmallerforEuropeancountriesthanfor the selected non-EU countries such as Russia, Argentina, Brazil and Japan.Graph5showsthatDenmark’sexportsdecreasedby21percent,measuredfrompeaktotrough.EvenatradingcountryliketheNetherlands,forwhichinternationaltrade in goods is an important pillar of economic growth, was not as stronglyaffected as some Latin-American or Asian countries. For example, by the firstquarter of 2009, Russian exports of goods had dropped by almost 60percentcomparedwiththethirdquarterof2008(whichwasthelastquarterwithpositiveexportgrowth).Eventhecountrythatiscreditedforthecurrentupturninworldtrade,China,hasseenitsexportsdecreaseby40percentovertwoquarters.
Althoughitmaybetooearlytosay,intermsofduration,theEuropeancountriesseemed to take longer to recover than other countries, particularly in terms ofimports. World imports declined for two consecutive quarters while the EU27reportedfourquartersofnegativeimportgrowth.Oftheselectedcountries,Francereportedthemostquarterswithnegativegrowth:fiveintermsofimportsandsixquartersforexports.
Theeconomiccrisishitsomecountriessoonerthanothers,althoughthisdidnotnecessarilymeanthatthesecountrieswerealsothefirsttorecover.Forinstance,inBelgium, Denmark, France, Sweden and Italy, the third quarter of 2008 alreadyyieldednegativegrowthratesforimportsandexports,wheretheNetherlandsstillmanagedtohavepositivegrowth.Inaddition,ItalyandFrancetookarelativelylongtimetorecoverfromthisdrop.Worldimportsandexportsdecreasedbymorethan35percentfrompeaktotrough,althoughexportstooklongertorecover(threequarterscomparedwithtwoquartersforimports).
Country or region-specific economic crises and credit crunches affect exportpatternsdifferentlyfromimportvolumes(VanBergeijk,2009).Export-ledgrowthstrategies or protectionist measures implemented by the government during acrisiscanactuallycauseexportstodeclinelessorevengrowduringorshortlyafteracrisis.Importersontheotherhand,mightsufferfromalackoffunding,currencydevaluation,lossoftrustanddecreaseddomesticdemand.Assuch,theimpactofa‘normal’crisisismostvisibleandunambiguousinimportstatistics(VanBergeijk,

28 Statistics Netherlands
2009). However, van Bergeijk argues that since countries are part of globalproductionchainsandmainlytrade intermediategoods,governmentpolicies tostimulateexportsmightnotbeeffectiveinaglobalcrisislikethepresentone.Assuch,exportsshouldalsobehithardbyaglobalcrisis,whichisthegeneralpicturethatemergesfromTable4andGraph5.
A1.5 Decline and duration of financial crisis, 2007–2010
Source: Easy Comext (Eurostat; extracted 28-7-2010) and WTO Monthly Merchandise Exports (extracted 17-8-2010).
–60 –55 –50 –45 –40 –35 –30 –25 –20 –15 –10 –5 0 5 10
RussianFederation
BrazilArgentina
SwedenJapanChina
UnitedKingdom
WORLDTurkey
Hong Kong,China
ItalyUSA
GermanyNetherlands
EU 27Belgium
FranceDenmark
Exports of goods
Decline in percentages Decline in quarters
–60 –55 –50 –45 –40 –35 –30 –25 –20 –15 –10 –5 0 5 10
RussianFederation
TurkeyArgentina
BrazilSweden
ChinaJapanUSA
UnitedKingdom
WORLD
Hong Kong,China
ItalyBelgium
DenmarkEU 27
NetherlandsFrance
Germany
Imports of goods
However,Table4alsoshowsthatexportsarerecoveringmorestronglythanimportdemandin thefirstquarterof2010. In fact, for theNetherlands,exportwas themaindrivingforcebehindtheeconomicgrowthof0.1and2.1percentinthefirsttwoquartersof2010respectively(CBSa/b,2010).AstrongrecoveryinChinaandotherdevelopingAsiancountriesisanimportantreasonbehindthisstrongexportperformanceintheNetherlandsandotherexportingcountriessuchasGermany.
1.4 Conclusion
International trade in goods has always been an important driver of economicgrowth in the Netherlands. The country’s geographic location and ongoingEuropeaneconomicintegrationhasmadetheNetherlandsamajorplayeringlobaltrade.ThebulkofDutchtradeisstillwithotherEuropeancountries,eventhoughthissharehasdeclinedsomewhatcomparedwiththemid-90s.NearlyhalfofallgoodsexportedtotheEuropeanUnioncurrentlyconsistofre-exports.

Internationalisation Monitor 2010 29
Trade in machinery and transport equipment formed the bulk of Dutch tradein2008,followedbychemicalsandmineralfuels.Thesamepictureemergedfor2009 and the first quarter of 2010, indicating that the economic crisis impactedtrade in thevarious typesofgoods fairlyuniformly.Thesearehowevernot thecommodities inwhich theNetherlandshad thegreatest comparativeadvantagecomparedwithotherEuropeancountriesin2009.ComparedwiththeEU14,theNetherlandsisparticularlyspecialisedintheexportoflivetrees,andplants,suchasbulbs,rootsandcutflowers,andproductsfromtheagro-foodindustry.Thesecomparativeadvantageswerealreadypresentinthemid-90s,althoughsometimesmorepronouncedthanin2009.
TheNetherlandswasthesixthlargestimporterintheworldin1970.By2008,thissharehaddecreasedto3percent,butwasonlyslightlylessthancountriessuchasFranceandtheUnitedKingdom.Intermsofexports,theNetherlandswentfrombeingtheseventhlargestexporterin1970tofifthin2008.TheNetherlandsremainsan important trading partner particularly for neighbouring countries such asBelgiumandGermany.
For many countries, including the Netherlands, the worldwide financial andeconomiccrisishashadadetrimentalimpactoneconomicgrowthandinternationaltrade. The Dutch economy did not grow in the second quarter of 2008 andcontractedinthesubsequentfourquarters.Dutchexportsofgoodsdecreasedbyalmost22percentin2009,whileimportsdecreasedevenmorestrongly.ComparablenegativegrowthrateswererecordedbyneighbouringEUcountries.TheimpactofthecrisiswasevengreateroutsidetheEU.
Thecontractionoftrade(inpercentages)wassmallerforEuropeancountriesthanfornon-EUcountriessuchasRussia,Argentina,BrazilandJapan,butitseemedtotaketheEUlongertorecover.EventhoughthecontractionofinternationaltradeintheNetherlandswassubstantial, thedeclinewasbelowaveragecomparedwithothercountries.Worldimportsandexportsdecreasedbyalmost40percent,whereexportsdeclinedduringthreequartersandimportsduringtwoquarters.
Crisesinindividualcountriesaffectexportsandimportsinadifferentway(VanBergeijk, 2009).Empirical evidence shows that the impactof a ‘normal’ crisis ismostvisibleandunambiguousinimportstatistics(VanBergeijk,2009).Aglobalcrisislikethecurrentoneputsbothimportsandexportsunderseverepressure.Atthemomentexportsseemtoberecoveringmorestronglythanimportdemandinseveral European countries. The first quarter of 2010 shows cautious positiveeconomic growth rates, whereas imports and exports are already growing at afaster pace. The tentative economic growth in the Netherlands in the first twoquartersof2010islargelyduetoexportgrowth,stimulatedbyChinesedemand(CBSa/b,2010).

30 Statistics Netherlands
References
Bergeijk,P.van(2009).Expectedextentandpotentialdurationoftheworldimportcrunch.KYKLOS,Vol.62,No.4(pp.479–487).
CBSa (2010).Economiegroeitmet2,1procent.Persbericht:http://www.cbs.nl/nl-NL/menu/themas/macro-economie/publicaties/artikelen/archief/2010/2010-052-pb.htm.StatisticsNetherlands.
CBSb(2010).Minimalegroeivandeeconomie.Persbericht:http://www.cbs.nl/nl-NL/menu/themas/macro-economie/publicaties/artikelen/archief/2010/2010-036-pb.htm.StatisticsNetherlands.
Ramaekers, P. and T. de Wit (2010). Helft Nederlandse goederenexport naarDuitslandisvaneigenmakelij.Webmagazine:http://www.cbs.nl/nl-NL/menu/themas/internationale-handel/publicaties/artikelen/archief/2010/2010–3142-wm.htm.StatisticsNetherlands.
WTO (2009). World trade report 2009. Trade policy commitments and contingency measures.Geneva,Switzerland.
Zanden,J.L.van(1997).Een klein land in de 20e eeuw. Economische geschiedenis van Nederland 1914–1995(1sted.)[Asmallcountryinthe20thcentury.Dutcheconomichistory1914–1995].Zeist,theNetherlands:HetSpectrum.

Internationalisation Monitor 2010 31
Annex I
Balassa index (Revealed Comparative Advantage):
TheBalassaindexmeasuresacountry’sdegreeofspecialisationinacertainsectororcommodityrelativetoanothergroupofcountries.Inthischapter,theBalassaindexiscalculatedasfollows:
whereXrepresentstheexportsoftheNetherlands(NL)andtheEU14respectively(the EU15 excluding the Netherlands) of commodities in chapter i and for allcommodities(tot).IftheBalassaindexexceeds1,thentheNetherlandshasacomparativeadvantageintheexportsofproducticomparedwiththeEU14.Iftheindexislessthan1,thecountryhasacomparativedisadvantage.
Table Annex A1.1 Commodity chapters with largest comparative advantages/disadvantages (Balassa index)
Commodity Description
6 Livetreesandotherplants;bulbs,rootsandthelike;cutflowersandornamentalfoliage24 Tobaccoandmanufacturedtobaccosubstitutes7 Ediblevegetablesandcertainrootsandtubers23 Residuesandwastefromthefoodindustries;preparedanimalfodder67 Preparedfeathersanddownandarticlesmadeoffeathersorofdown;artificialflowers;articlesofhumanhair46 Manufacturesofstraw,ofespartoorofotherplaitingmaterials;basketwareandwickerwork12 Oilseedsandoleaginousfruits;miscellaneousgrains,seedsandfruit;industrialormedicinalplants;straw
andfodder14 Vegetableplaitingmaterials;vegetableproductsnotelsewherespecifiedorincluded80 Tinandarticlesthereof26 Ores,slagandash75 Nickelandarticlesthereof27 Mineralfuels,mineraloilsandproductsoftheirdistillation;bituminoussubstances;mineralwaxes50 Silk45 Corkandarticlesofcork71 Naturalorculturedpearls,preciousorsemi-preciousstones,preciousmetals,metalscladwithpreciousmetal
andarticlesthereof;imitationjewellery;coin97 Worksofart,collectors’piecesandantiques88 Aircraft,spacecraftandpartsthereof86 Railwayortramwaylocomotives,rolling-stockandpartsthereof;railwayortramwaytrackfixturesand
fittingsandpartsthereof;mechanical(includingelectro-mechanical)trafficsignallingequipmentofallkinds51 Wool,fineorcoarseanimalhair;horsehairyarnandwovenfabric10 Cereals43 Furskinsandartificialfur;manufacturesthereof60 Knittedorcrochetedfabrics

Internationalisation Monitor 2010 33
A2 Trends in international trade in servicesChantal Lemmens-Dirix
2.1 Introduction
Servicesaretheintangibleequivalentofeconomicgoodsbecausetheirformandcompositionaredifficulttodescribeandtheirtransferandexchangearedifficulttomeasure.Servicesoftenrequirethattheyare‘consumed’atorneartheplaceandatornearthetimeoftheirproduction.Furthermore,theyareusuallycustomisedtomeet client needs (Lennon, 2008; Doh and Pearce, 2003). Services are in mosteconomiesthelargestcontributortoeconomicgrowthandemployment(HufbauerandWarren,1999).Whiletheincreasingeconomicimportanceofserviceshasnotgone unnoticed, services have not, until recently, figured as prominently in theliteratureoninternationaltrade.Foralongtime,theservicessectorwasconsideredas the non-tradable sector of economy. However, globalisation has affected allfacets of the world economy, including services. This chapter provides moreinformation about recent trends in the international trade in services in theNetherlandsandinaninternationalperspective.
Thischapterisorganisedasfollows.Section2.2highlightsthemaindevelopmentsinDutchinternationaltradeinservices.ThebreakdownoftheDutchinternationaltradeinservicesbyservicescategory,andbycountryoforiginanddestinationcanbe found in sections 2.3 and 2.4 respectively. The export specialisation of theNetherlands, as measured with the Balassa Index, is presented in section 2.5.Section 2.6 examines the market share in services trade of the Netherlands inseveralforeignmarkets.Finally,section2.7containsasummaryandconclusions.
2.2 Developments in Dutch international trade in services
Overthelastthreedecades,services(seedefinitionsinBoxA2.1)havegrownfromaround58percentofGDPtoalmost75percentinhigherincomecountries,suchastheNetherlands(FrancoisandHoekman,2009).Thisgrowingimportanceoftradeinservicesistheresultofadvancesininformationandcommunicationtechnologieswhich are increasingly enabling cross-border ‘disembodied’ trade in services.Furthermore, an increase in the production of intermediate services (i.e.outsourcing) is also one of the driving forces behind this trend (Lennon, 2008;FrancoisandHoekman,2009).

34 Statistics Netherlands
Box A2.1 International trade in services: definitionInternationaltradeinservicescoversallservicestransactionsbetweenacountry(i.e. itsresidents)andforeigncountriesor internationalorganisations(i.e. thenon-residentsofthatcountry)duringagivenperiod.Theservicesareclassifiedasfollows:transportation,travel,communicationservices,constructionservices,insurance services, financial services, computer and information services,royalties and licence fees, other business services, personal, cultural, andrecreationalservicesandgovernmentservicesnotincludedelsewhere.
StatisticsNetherlands(SN)usesthebusinesssurveytocollectdataforalargeportionoftheinternationaltradeinservices.Data,forinstance,ongovernmentservicesandtravelareobtainedbyotherdatacollectionmethods.
TableA2.1showstheoverallDutchimportsandexportsofinternationaltradeinservices as a share of total international trade (goods and services) for fivesuccessive years. In2008, the value of imported services was 19percent higherthan in2004. For the same period, it was observed that the export of servicesincreasedbyalmost26percent.
Dutchservicesexportsaccountedforapproximately20percentoftotalexports,seealsoTableA2.1.Thispercentagehasbeencomparativelystablefromthemid1990sonwards(seeWTO,1998).Therelativegrowthofservicestradevis-à-vistradeingoods happened before that period (increasing from 7percent of total exportsin1987).
Table A2.1 Dutch imports and exports of international trade in services as a share of total international trade (goods and services)
Imports Exports
international internationaltradeinservices international internationaltradeinservices trade trade
million euro % of total imports million euro % of total exports
2004 292,344 64,097 22 323,922 68,262 212005 317,779 67,934 21 355,298 73,998 212006 354,569 69,199 20 395,973 77,020 192007 378,542 71,721 19 425,836 81,534 192008 412,391 76,470 19 456,415 85,935 19
Source:CBS,InternationalTradeinServicesStatistics.
Theshareofservicesexportsintotalexportsappearsrelativelylow,consideringthattheshareofservicesinGDPisabout75percent.However,thereareseveralreasons why services are relatively less frequently traded across borders than

Internationalisation Monitor 2010 35
goods.Manyservicesmustbeconsumedatthepointofproduction.Onlyalimitednumberofservicescanbeshippedortransferredviainternetortelephone.Firmsthatexportservicesarenotonlyconfrontedwithlanguagebarriersbutalsowithabroad range of national regulatory barriers, such as special licences, labourlegislationetc.whichmakeitmoredifficulttotradeinservices.Furthermore,theirformandcompositionaredifficulttodescribeandtheirtransferandexchangearedifficulttomeasurecomparedwithgoods(Kox,Lejour&Verweij,2009).
2.3 Composition of Dutch international trade in services
Although total international trade in services increased during the period2004–2008, the composition of the Dutch international trade in services remainedmarkedlyconstantinthisperiod.The‘Otherbusinessservices’categoryisbyfarthelargestgroupinDutchimportsaswellasexports,seealsoTablesA2.2AandA2.2B.Thisgroupisextremelydiverseandincludesamongothersmerchanting,operationalleasingservices,advertising,marketresearchandpublicopinionpolling,researchanddevelopment,architecturalengineeringandothertechnicalservices.Theshareof trade in these ‘other business services’ in total Dutch services trade declinedslightly,seealsoGraphsA2.2AandA2.2B.GiventheroleoftheNetherlandsasadistributioncountryfortheEUhinterlanditisnotsurprisingthat‘transportation’wasthesecondlargestserviceintheobservedperiodforbothimportsandexports.Theshareof‘royaltiesandlicencefees’intotalserviceshadgrownremarkablysince2005andwasthereforethethirdmostimportantserviceinDutchexportsfrom2007onwards.Becauseofthisgrowth,‘travel’serviceswerepushedtofourthplaceinexports in2008.For importson theotherhand, ‘travel’ remained the thirdmostimportant service during the whole period. This implies that Dutch travelexpendituresabroadare20percentofthetotalDutchservicesimports.
Table A2.2A Trends in total Dutch import values by the three largest services in 2008
2004 2005 2006 2007 2008
million euro
Total 64,097 67,934 69,199 71,721 76,470
Largest services in 2008
Otherbusinessservices 24,298 25,924 23,654 23,985 25,429Transportation 11,035 12,025 14,948 15,182 15,382Travel 13,211 12,996 13,560 13,912 14,777
Source:CBS,InternationalTradeinServicesStatistics.

36 Statistics Netherlands
A2.2A Trends in relative distribution of Dutch import values by the three largest services in 2008
Source: CBS. International Trade in Services Statistics.
40
35
39
25
20
15
10
5
02004 2005 2006 2007 2008
%
Transportation Travel Other business services
Table A2.2B Trends in total Dutch export values by the three largest services in 2008
2004 2005 2006 2007 2008
million euro
Total 68,262 73,998 77,020 81,534 85,935
Largest services in 2008
Otherbusinessservices 24,945 28,364 27,372 28,163 28,467Transportation 15,610 17,257 19,815 20,040 21,081Royaltiesandlicencefees 8,727 8,234 8,207 10,029 13,405
Source:CBS,InternationalTradeinServicesStatistics.
A2.2B Trends in relative distribution of Dutch export values by the three largest services in 2008
Source: CBS, International Trade in Services Statistics.
40
35
30
25
20
15
10
5
0
2004 2005 2006 2007 2008
%
Transportation Royalties and licence fees Other business services

Internationalisation Monitor 2010 37
2.4 The largest import and export services markets for the Netherlands
The Netherlands mainly trades in services with adjacent countries. This is notsurprising given that services often require suppliers and consumers to bephysicallylocatedatornearthesameplaceinordertofulfilthetransaction.ThelargemarketsizeoftheUnitedStatesmadeitthemostimportanttradingpartneroutsideEurope.
In2008,theUnitedStateswas,atnearly11billioneuros,themostimportantsourceof Dutch import of services, closely followed by the European trading partnersUnitedKingdom,GermanyandFrance.However,in2006and2007,theshareofDutch imports from the United States decreased significantly, mostly due toreductionsincross-border‘royaltiesandlicencefees’and‘otherbusinessservices’,seealsoGraphA2.3A.ThedecreaseintotalimportsfromFranceintheperiod2004–2008wasmainlyduetoreducedimportsof‘otherbusinessservices’.
Table A2.3A Trends in total Dutch import values of all services imported from the largest markets in 2008
2004 2005 2006 2007 2008
million euro
Total 64,097 67,934 69,199 71,721 76,470
Largest markets in 2008
UnitedStates 9,291 9,849 8,145 9,296 10,865UnitedKingdom 8,510 9,794 9,592 9,625 9,094Germany 8,306 9,052 9,283 8,940 8,334France 6,112 5,739 5,527 5,296 5,240
Source:CBS,InternationalTradeinServicesStatistics.
A2.3A Trends in relative distribution of the Dutch import values of all services imported from the largest markets in 2008
Source: CBS, International Trade in Services Statistics.
20
15
10
5
02004 2005 2006 2007 2008
%
Germany France UK US

38 Statistics Netherlands
Ontheotherhand,Germanywasthemost importantexportdestinationfor theNetherlandsat10.5billioneurosin2008.TheimportingtradingpartnersUnitedKingdomandtheUnitedStateswerealsointhetopfour.Between2007and2008the share of Dutch imports from Germany decreased by 2.5percentage points,mostlyduetoreductionsin‘otherbusinessservices’,seealsoGraphA2.3B.
Table A2.3B Trends in total Dutch export values of all services exported to the largest markets in 2008
2004 2005 2006 2007 2008
million euro
Total 68,262 73,998 77,020 81,534 85,935
Largest markets in 2008
Germany 9,238 9,278 11,379 11,951 10,512UnitedKingdom 9,177 9,217 9,803 10,163 10,020Ireland 2,100 2,504 3,624 3,793 7,929UnitedStates 7,753 8,547 7,565 7,569 7,738
Source:CBS,InternationalTradeinServicesStatistics.
A2.3B Trends in relative distribution of the Dutch export values of all services exported to the largest markets in 2008
Source: CBS, International Trade in Services Statistics.
20
15
10
5
0
2004 2005 2006 2007 2008
%
Germany Ireland UK US
Inadditiontodevelopedcountries,emergingmarketsarebecomingincreasinglymoreimportantinDutchservicestrade.TableA2.4showstheshareoftheDutchimport and export values from and to four main emerging markets –the BRICcountries(Brazil,Russia,IndiaandChina)–fortheperiod2004–2008.

Internationalisation Monitor 2010 39
ThetableshowsthattotalDutchimportsofservicesfromBRICcountriesincreasedby238percentbetween2004and2008.TheshareoftheDutchimportsvaluefromBRIC countries amounted to 2.1percent in2004 and 5.8percent in2008. Similarresultswerefoundforexports.TheoverallDutchexportvaluetoBRICcountrieswas167percenthigherin2008thanin2004,whereastheshareoftheDutchexportvaluetoBRICcountriesrosefrom3percentin2004to6.3percentin2008.
Table A2.4 Total Dutch import and export values for total services from and to BRIC countries
2004 2005 2006 2007 2008
million euro
TotalDutchimport 64,097 67,934 69,199 71,721 76,470ofwhichBRICcountries 1,320 1,681 2,693 2,982 4,469shareofBRIC(%) 2.1 2.5 3.9 4.2 5.8
TotalDutchexport 68,262 73,998 77,020 81,534 85,935ofwhichBRICcountries 2,044 2,934 3,217 4,061 5,454shareofBRIC(%) 3.0 4.0 4.2 5.0 6.3
Source:CBS,InternationalTradeinServicesStatistics.
2.5 Comparative advantages: the Balassa index
TheBalassaindexhasbeenextensivelyusedintheinternationaltradeliteraturetomeasureexportspecialisation.Thisindexcomparestheactualexportstructureofacountryrelativetotheexportstructureofasetofreferencecountries.Ifacountryhasarelativelylargeshare(i.e.relativetothebenchmarkgroupofcountries)ofaparticularserviceinitsexportpackage,itisconsideredtospecializeinthatservice.TheEU26(i.e.,EU27excludingtheNetherlands)wasusedasabenchmarkgroupinthischapter.
Box A2.5 The Balassa indexTheBalassaindex(RevealedComparativeAdvantage)iscalculatedasfollows:
(XiNL/Xtot
NL)
(XiEU26/Xtot
EU26)

40 Statistics Netherlands
Where X represents the exports of, respectively, the Netherlands (NL) or theEU26 to all countries in services category (i) or in all services categoriescombined(total).If the Balassa index for a given services category is greater than1 then theNetherlandshasacomparativeadvantageandisthusrelativelyspecializedinthe export of these services compared with the EU26. If the index is lowerthan1,theNetherlandshasacomparativedisadvantage.
TableA2.5showstheRevealedComparativeAdvantages(RCA)oftheNetherlandsforsevenoftheelevenservicescategoriesin2008.
Table A2.5 The Balassa index: comparison of the Netherlands and EU 26, 2008
RCAwithrespecttotheEU26 TotalDutchexportstoallcountries
million euro
Otherbusinessservices 1.2 28,467Transportation 1.1 21,081Travel 0.5 9,072Computerandinformationservices 0.9 4,569Communicationsservices 1.4 3,074Constructionservices 1.0 2,210Personal,cultural,andrecreationalservices 0.6 514
Source:Eurostat.
TheBalassaindexdemonstratedthat,comparedwiththeEU26,theNetherlandshad a comparative advantage in the two largest export sectors of the Dutcheconomy,namely‘otherbusinessservices’and‘transportation’.Furthermore,theNetherlands was strongly specialized in the relatively small ‘communicationservices’ sector. However, with regard to ‘travel’, ‘computer and informationservices’and‘personal,cultural,andrecreationalservices’,theNetherlandshadacomparativedisadvantagecomparedwiththeEU26in2008.
2.6 The Netherlands as services partner for other countries
TableA2.6AgivesanoverviewoftheDutchshareinservicesimportsforseveralimportantEuropeanbenchmarkcountries.Thetotalimportofservicesincreasedbetween2004and2008forallthesecountries.Asregardstheimportvaluesfrom

Internationalisation Monitor 2010 41
the Netherlands, only the United Kingdom showed a slight decrease from4.8billioneurosto4.3billioneurosin2008.
Ofall thesebenchmark countries,Germany, at 193.5billion euros, imported themostin2008,ofwhich10.3billioneuroscamefromtheNetherlands.However,asGraph A2.6A shows, the Dutch market share of the total import for Germanydeclinedbetween2004and2008by0.8percentagepoint.FortheUnitedKingdom,France and Sweden also a decrease was found for the Dutch share in the totalimportsof these countries.On theotherhand,an increase in theDutchmarketshareoftotalimportswasobservedforthreecountries,ofwhichBelgiumwasthemostimportantwithanincreaseof1percentagepointbetween2004and2008.
Table A2.6A Total import values of all services from the Netherlands and the world for several European countries
Country Importfrom 2004 2008
million euro
Germany World 157,405 193,549 TheNetherlands 9,575 10,336Belgium World 39,475 56,058 TheNetherlands 3,975 6,119UnitedKingdom World 120,658 137,962 TheNetherlands 4,804 4,296France World 79,171 97,199 TheNetherlands 3,315 3,736Denmark World 26,757 42,545 TheNetherlands 932 1,572Sweden World 26,617 37,367 TheNetherlands 1,196 1,362Austria World 22,542 29,129 TheNetherlands 518 755
Source:Eurostat.
A2.6B Import market shares of the Netherlands on several foreign markets
Source: Eurostat.
16
14
12
10
8
6
4
2
0Germany Belgium UK France Denmark Sweden Austria
%
2004 2008

42 Statistics Netherlands
A similar analysis can be made for exports, see also TableA2.6B. The UnitedKingdom was the most important exporter among the selected countries,196.2billioneurosin2008.AsGraphA2.6Bdemonstrates,theDutchexportshareintotalexportoftheUnitedKingdomwasalmost6percent.Aswithimports,thelargest Dutch market share was observed in Belgium.Almost 16percent of thetotalexportvalueofBelgiumwasdestinedfortheNetherlandsin2004,althoughthissharedecreasedbetween2004and2008byalmost2percentagepoints.
Table A2.6B Total export values of all services to the Netherlands and the world for several European countries
Country Importfrom 2004 2008
million euro
UnitedKingdom World 159,106 196,157 TheNetherlands 9,441 11,185Germany World 117,725 167,985 TheNetherlands 7,636 10,873Belgium World 42,396 58,878 TheNetherlands 6,636 8,084France World 92,422 111,657 TheNetherlands 5,325 3,549Denmark World 29,424 49,390 TheNetherlands 715 1,545Austria World 30,516 42,304 TheNetherlands 1,366 1,878Sweden World 31,336 49,643 TheNetherlands 918 1,254
Source:Eurostat.
A2.6B Export market shares of the Netherlands on several foreign markets
Source: Eurostat.
16
14
12
10
8
6
4
2
0UK Germany Belgium France Denmark Austria Sweden
%
2004 2008

Internationalisation Monitor 2010 43
2.7 Summary and conclusions
Theaimofthischapterwastoprovidemoreinformationaboutrecenttrendsintheinternational trade in services in the Netherlands and in an internationalperspective.ItwasshownthattheDutchimportandexportvaluesoftotalservicesincreased substantially during the period2004–2008. Despite this increase, theexportshareofservicesintotalDutchexportremainedapproximately20percent.Theliteratureindicatesthatthispercentagehasbeenquitestablesince1997.Thecomposition of the Dutch international trade in services has been markedlyconstant during the period2004–2008. The ‘other business services’ and‘transportation’ services categories were the largest services groups in Dutchimportsaswellasexports.
TheBalassaIndexdemonstratedthattheNetherlandshasacomparativeadvantagein ‘other business services’ and ‘transportation’, which are also the two largestexportsectorsintheDutcheconomy.TheNetherlandsmainlytradeswithadjacentcountriessuchasGermanyandtheUnitedKingdom.Inaddition,DutchimportfromandexporttotheupcomingBRICcountriesincreasedsignificantlyfrom2004to2008.Asaconsequence,itcanbeconcludedthattheBRICcountriesarebecomingincreasinglymoreimportantfortheDutcheconomy.Finally,itwasobservedthatforBelgium,theNetherlandsisthemostimportantimportingaswellasexportingcountry.
References
Doh,J.andPearce,J.II.(2003).‘Revisingourunderstandingandexpectationsofthe international trade in services’. Journal of Transnational Management Development,9(1):59–78.
Francois, J.andHoekman,B. (2009). ‘Services tradeandpolicy’.WorkingpaperNo.0903,JohannesKeplerUniversityofLinz,Linz-Auhof.
Hufbauer, G. and Warren, T. (1999). ‘The globalisation of services: What hashappened? What are the implications?’. Working Paper No.99–12, Institute forInternationalEconomics,Washington.
Kox, H., Lejour,A. and Verweij, G. (2009). ‘Regulatory barriers in business andtransport services trade’. Paper prepared for the First Meeting of GlobalisationInvestmentandServicesTrade,June,Milan.
Lennon, C. (2008). ‘Trade in services and trade in goods: Differences andcomplementarities’.WorkingPaperNo.52,ParisSchoolofEconomics,Paris.

44 Statistics Netherlands
WorldTradeOrganisation(1998).‘AnnualReport’.Volume2,StatisticalAppendix,Geneva.

Internationalisation Monitor 2010 45
A3 Trends in international direct investmentOscar Lemmers
3.1 Introduction
The Netherlands is an attractive country for foreign enterprises interested ininvestingabroad.AlmostathirdofDutchprivatesectorturnoverisgeneratedbyforeigncontrolledenterprises,whichindicatestheimportanceof inwardforeigndirectinvestment(FDI)fortheDutcheconomy.Similarly,Dutchenterpriseshavesubstantialinvestmentsabroad.Asaresult,theNetherlandsalwaysrankshighlyintheUNCTADPerformanceIndicesforinwardandoutwardFDI.Forexample,inthe2009UNWorldInvestmentReporttherewereasmanyassixDutchcompaniesinthetop100ofnon-financialTransNationalCompanies,includingShell,PhilipsElectronics,andAkzoNobel.
However, theeconomiccrisishasaffectedFDIflows justas ithasaffectedotherinternational economic relations such as foreign trade, international R&D, andcross-border transport. Incoming and outgoing direct investment flows to andfromtheNetherlandsturnednegative inseveralquartersof2008and2009.Thestocks of inward and outward Dutch FDI decreased for the first time in manyyears.Inparticular,theDutchgovernment’sacquisitionoftheDutchpartofFortisinOctober2008hadaconsiderabledirecteffectonDutchFDI.Thistakeoverledtoa decrease in the incoming investment position from Belgium and “provides astrongsafeguardforallthoseinvolvedintheseinstitutions(Fortis,editor)andforthestabilityoftheDutchfinancialsystem”(DutchMinistryofFinance,2008).
ThischapterexplorestherecenttrendsininternationaldirectinvestmentsinandfromtheNetherlands.Section3.2focusesontrendsduringthecrisis,suchasthedecrease in FDI stocks, which is followed by a review of a number of ongoingtrendssuchastheshiftfromservicestomanufacturing.Thesectionconcludeswithadiscussionon thepossible channels throughwhich theeconomiccrisisaffectsFDI. In section3.3 we focus on inward and outward Foreign Affiliate TradeStatistics (inward and outward FATS). These statistics describe the activities offoreigncontrolledenterprisesthatresideintheNetherlandsandtheactivitiesofDutch controlled enterprises in foreign countries, respectively. Subsequently,DutchFDIisputintoaninternationalperspectiveinsection3.4.Thechapterendswithanumberofconclusionsandsuggestionsforfurtherresearch.

46 Statistics Netherlands
Box A3.1 Definitions and methodology
The leading authority on FDI in the Netherlands is De Nederlandsche Bank(DNB).Itcollects,compilesandpublishesthedataaboutincomingandoutgoingFDIaspartoftheBalanceofPaymentsaccordingtotheIMFBalanceofPaymentsManual (IMF, 1993). DNB divides FDI into two categories: manufacturing(sectorsAthroughFinNACERev.2,whichincludesmining,quarryingandthemetalindustry)andservices(sectorsGthroughS,excludingO,whichincludestrade,transportandthefinancialsector).DNBpublicationshavebeenusedforreferencestoenterprisesinthischapterwherethesourceisnotspecified.
Special Purpose Entities (SPEs). According to De Nederlandsche Bank, SPEs,sometimescalledspecialfinancialinstitutions(SFIs),areDutch-basedsubsidiariesof foreign parent companies that “function as financial turntables for foreigncomponents of the group to which they belong. (…) With its favourable taxclimateandinfrastructure,theNetherlandshasalwaysbeenapopulardomicileforSPEs.”(DNB2008–9,p.195andp.7,respectively).DeNederlandscheBankdoesnotincludeSPEsindetailedFDIstatistics,butitdoespublishtheBalanceofPaymentsincludingtheSPEs(aswellasaversionexcludingtheSPEs).VandenDool(2008)alreadypointedoutthatin2007theDutchfiguresexcludingSPEscameout72percentlowerthanthefiguresthatincludedSPEs.
FormoredefinitionsandmethodologyseetheintroductiontoC3.
3.2 Trends in the Netherlands
3.2.1 Flows and stocks
Table A3.1 Distribution of Dutch FDI in manufacturing and services (stocks)
2003 2004 2005 2006 2007 2008
%
InwardFDI
Manufacturing 38.8 45.1 39.3 39.0 37.1 42.1Services 61.2 54.9 60.7 61.0 62.9 57.9
OutwardFDI
Manufacturing 39.4 41.5 43.6 42.1 43.5 49.6Services 60.6 58.5 56.4 57.9 56.5 50.4
Source:DeNederlandscheBank,calculatedbyStatisticsNetherlands.

Internationalisation Monitor 2010 47
OutwardFDIflowsweregenerallypositivebeforethecrisis,butturnednegativeduringthecrisis.TherewereseveralquartersinwhichDutchenterpriseswithdrewfunds from their foreign subsidiary enterprises or even sold them. Inward FDIflowswerealsoaffected.Althoughtherewasasharpincreaseinthefourthquarterof2007,itwaslargelyduetothepurchaseofABNAMRObySantander,FortisandtheRoyalBankofScotland.Ontheotherhand,therewasasubstantialdecreaseininward FDI flows in the fourth quarter of 2008 because the Dutch governmentboughttheDutchpartofFortis.
Thestocksofinwardandoutwarddirectinvestmentsalsodecreased.In2008(andin2009)stocksofinwardFDIdecreasedforthefirsttimesinceDeNederlandscheBankstartedtorecordthemin1984.Again,itshouldbenotedthatalargepartofthe decrease in2008 was caused by the Dutch government acquiring the Dutchpart of the Belgian company Fortis, which caused a substantial decrease inincominginvestmentsfromBelgium.StocksofoutwardFDIalsodecreasedin2008;thelasttimethishashappenedwasin1986.
3.2.2 Trends on sectoral level
A3.1 Dutch FDI flows
Source: De Nederlandsche Bank.
80,000
60,000
40,000
20,000
0
–20,000
–40,000I II III IV I II III IV I II III IV I II III IV
2006 2007 2008 2009
million euro
Inward FDI Outward FDI
Onasectorallevel,theshareofmanufacturinginbothinwardandoutwardFDIincreasedduring theperiod2003–2008,whereas theshareofservicesdecreased.Morespecifically,intheservicessectortheshareofbothinwardandoutwarddirectinvestments decreased in the trade, and in the radio, TV and communicationequipment sectors. In the manufacturing sector the share of inward directinvestmentsinfoodproductsincreasedduringtheperiod2003–2008,asaresultof,amongotherthings,theacquisitionofNumicobyDanonein2007(DNB,2008–3).

48 Statistics Netherlands
Furthermore,theincreaseinoutwarddirectinvestmentsintherefinedpetroleumandothertreatmentssectorcanbepartiallyexplainedbytherestructuringofShellin2005.MoredetailedinformationaboutthedistributionofDutchFDItoandfromsectorscanbefoundinTableC3.2“Foreigndirectinvestment:byeconomicsector”.
3.2.3 Trends on country level
Table A3.2 Share of top three countries inward Dutch FDI (stocks)
2003 2004 2005 2006 2007 2008
%
UnitedStates 20.5 19.7 19.1 18.9 18.2 20.0UnitedKingdom 16.7 16.6 13.9 13.6 15.9 19.0Luxembourg 6.0 7.4 8.9 9.2 10.3 11.2
Source:DeNederlandscheBank,calculatedbyStatisticsNetherlands.
OnacountrylevelthelargestshareofDutchinwardFDIisfromtheUnitedStates,even though there was a decline in the period1999–2003 (not shown in table).AnotherlargeinvestoristheUnitedKingdom,whoseshareininwardDutchFDIfluctuatedconsiderablyin2005(becauseof therestructuringofShell)and2007–2008(becausetheRoyalBankofScotlandboughtpartofABNAMRO).Anothernoteworthy trend shown in TableA3.2 is that inward FDI from Luxembourg isincreasingrapidly.
Table A3.3 Share of top three countries outward Dutch FDI (stocks)
2003 2004 2005 2006 2007 2008
%
UnitedKingdom 13.2 14.1 18.2 15.1 14.5 13.2UnitedStates 17.1 16.2 16.1 13.2 9.4 10.6Belgium 8.7 8.1 7.0 10.0 11.5 10.3
Source:DeNederlandscheBank,calculatedbyStatisticsNetherlands.
WithregardtooutwardFDIstockstherearealsoseveraltrendsworthmentioning.Firstofall,thereisarelativedeclineinDutchFDIintheUnitedStates.In1999thisconsistedofaboutonequarteroftotalDutchFDI,butitsteadilydecreasedtoaboutonetenthby2008.ThiscanbeexplainedtosomeextentbythedepreciationoftheUSdollaragainsttheeuro.EvenifinvestmentsintheUnitedStateshadretainedtheir value in dollars, their value in euros would have declined. The United

Internationalisation Monitor 2010 49
KingdomisnowthelargestrecipientofDutchFDI.Anothernoticeabletrend,notshowninTableA3.3,istheriseofdirectinvestmentsinLuxembourg.
TheshareofEuropeanstocksinbothinwardandoutwarddirectinvestmentshasincreased.Thesharesofemergingmarkets,suchasBrazil,Russia,IndiaandChina,remained modest and most Dutch direct investments are still related to OECDcountries(around90percent).MoredetailedinformationaboutthedistributionofDutch FDI to and from countries can be found in TableC3.3, “Foreign directinvestment:bycountry”.
ThetrendsinflowsofinwardandoutwardFDIaresimilar,eventhoughtheflowsfluctuatefarmore.TheyalsoshowthatinvestmentsfromtheDutchAntillesandArubahaverisensince2006,althoughitispossiblethattheultimateoriginofthisflowmightbefromsomewhereelse.
BoxA3.2summarisestheeffectsofthecrisisandpossibleimplicationsforFDI.
Box A3.2 Transmission channels of the crisis– A lower supply of capital combined with increasing costs of capital has
discouraged investment. Banks lost confidence following the collapse ofLehman Brothers in September2008. Although attempts were made toimprovecapitalbuffers,banksbecamereluctanttoenterintoloanagreementsand raised the interest rates on loans (World Investment Report2009). Inorder to preserve liquidity and credit, parent companies withdrew fundsfromtheirforeignsubsidiaries.ForFDI,thesedisinvestmentsarerecordedasnegativeflows.
– Thedecliningstockexchangebothdiscouragedandencouragedinvestments.Financinginvestmentsthroughthedecreasingstockmarketwasnolongerfeasible,butontheotherhand,thisdidcreateopportunitiesforenterprisesorcountriesthatstillhadfundsavailableforinvestments.Theycouldbuystocksatafarlowerpricethaninthepast.
– Reduced demand diminished the propensity of enterprises to invest infurtherexpansion.AccordingtoKoo(2009),thecurrentrecessionisabalancesheet recession.After the decline of the real estate markets and the stockmarkets:“businessesandindividualsaresaddledwithexcessliabilitiesandareforcedtopaydowndebtsbycurbingconsumptionandinvestment.Thelastthingtheyareinterestedinisincreasingtheirborrowings.”(Koo,2009).
– According to theUnitedNations, foreign investments inseveralcountriesarediscouragedbytheirlocalgovernments,as“someprotectionisttendencieshaveemerged,assomecountrieshavebeguntodiscriminateagainstforeigninvestors and/or products in a “hidden” way using gaps in internationalregulations”(WorldInvestmentReport2009,p.31).

50 Statistics Netherlands
3.3 Foreign Affiliate Trade Statistics (FATS)
Theforeignaffiliatetradestatistics(FATS)presentdetaileddataonforeignaffiliates,e.g.onperformancecharacteristicssuchasemploymentlevels,turnoverandvalueadded. In principle, FATS data cover a sub-set of the entities involved in FDI.Unfortunately, the same information is not yet available for all enterprises thatengage inFDI. Itmustbe taken intoaccount that themethodologiesapplied tocurrentFDIandFATSarenotcompletelyconsistent,whichwefurtherexplainattheendofthissection.
TableA3.4 displays the inward foreign affiliate trade statistics (inward FATS),whichdescribetheactivitiesofmajorityforeigncontrolledenterprisesresidentinthecompilingcountry(here:theNetherlands).Controlisdefinedastheabilitytodeterminethegeneralpolicyofanenterprisebychoosingappropriatedirectors,ifnecessary(FATSregulation,article2,2007).
Table A3.4 Share of foreign controlled enterprises in total private Dutch sector
2001 2002 2003 2004 2005 20061) 2007 20081)
%
Numberofenterprises 0.7 0.8 0.7 0.7 1.2 1.1 1.0 1.0Numberofemployees 11.9 13.5 13.4 14.7 14.6 15.5 14.9 15.8Turnover 23.7 25.1 25.3 27.1 26.7 29.9 29.4 31.4Addedvalue 17.5 20.5 19.2 20.9 20.5 23.4 22.3 24.4Grossinvestment 16.9 19.2 15.4 17.6 17.8 20.0 20.6 21.8
Source:StatisticsNetherlands,InwardFATS.
1) Between2005and2006,2007and2008,therearebreaksinthetimeseriesduetodifferentdefinitions.
Eventhoughthenumbersfluctuatefromyeartoyearasaresultofmergers,salesandacquisitions,thegeneraltrendisanincreaseintheshareofforeigncontrolledenterprises in the private Dutch sector. In2008, these enterprises generated aquarteroftheaddedvalueoftheprivatesector,or12percentofGDP.
Therefore,alotisknownaboutforeigncontrolledenterprisesintheNetherlands.Unfortunately, it is not yet possible to make a single table that includes allenterprises engaged in Dutch inward FDI. Therefore Statistics Netherlands hasstarted a project to determine, for larger and smaller enterprises, whether theyhave investmentsabroadornot,andtosubsequentlymatch that information tootherbusinessandperformancecharacteristics.

Internationalisation Monitor 2010 51
TableA3.5 displays the outward FATS, which describe the activities of Dutchcontrolledenterprisesresident ina foreigncountry.TheoutwardFATSisanewstatistic, and this is the first time that Statistics Netherlands has published itsresults. Statistics Netherlands only collects information on activities outside theEuropeanUnion.Intime,usingthemirrorstatisticsoftheinwardFATScollectedbyothermemberstates,informationonactivitiesinsidetheEuropeanUnionwillalsobecomeavailable.
Table A3.5 Activities of Dutch controlled enterprises outside the European Union
2008
Enterprises 6,067Employees 667,353
Turnover(billion euro) 295
Source:StatisticsNetherlands,OutwardFATS.
An important difference between FATS and FDI statistics is that FATS use theconceptofultimatecontrolling institute (UCI),whereasFDIuses theconceptofdirect investor. For example, suppose a Dutch enterprise owns, and controls, aGermanenterprise,whichinturnowns,andcontrols,anAustrianenterprise.ThentheUCIoftheAustrianenterprise isDutch,butthedirect investor inAustria isGerman.Furthermore,therearealsoothermethodologicaldifferences,ascanbeseen in a comparison of the IMF Balance of Payments Manual and the FATSRegulation.
3.4 The Netherlands in an international perspective
InthissectionweplaceDutchFDIinaninternationalperspectivebycomparingitwith several European countries: Denmark, Germany, France and Sweden.UnfortunatelytherewasnotsufficientdataforBelgium,soBelgiumwasomittedfromthiscomparison.
Compared with other countries, the Netherlands has relatively more FDI whenadjusting for the size of the economy. This adjustment is made by dividing thestocks of inward, or outward, direct investments by a country’s GDP. TheNetherlandsalsoalwaysoccupiesahighposition in theannualUnitedNationsFDIcountryrankings.TheserankingsconsistofaninwardFDIPerformanceIndex,an inwardFDIPotential IndexandanoutwardFDIPerformanceIndex,seee.g.WorldInvestmentReport2008.

52 Statistics Netherlands
Why is the Netherlands so attractive for foreign investments? According to asurveyamongtopexecutivesofAmericancompaniesintheNetherlands,theyarehighlysatisfiedwiththeDutchinvestmentclimate,includingknowledgeofforeignlanguages,clearandstablepolicies,legislationandadministration,qualityoflife,the levelof local labour skills, telecommunications infrastructure, transportandtechnical infrastructure (AmCham, 2010). The OECD also notes that comparedwith other countries, the Netherlands creates very few barriers for FDI. Of48economies, including the members of the OECD and large economies, theNetherlandsscoredthelowestontheOECDFDIRestrictivenessIndex,togetherwithLuxembourg(Kalinovaetal.,2010).
GraphA3.2showsoutwardFDIrelativetoGDPandinwardFDIrelativetoGDP.TheirdifferenceisnetassetsrelativetoGDP.TheNetherlandshasfarmoreinwardandoutwardFDIthantheothercountries.ThisindicatesthatforeignenterprisesseegoodinvestmentopportunitiesintheNetherlands,andthatDutchenterprisesmightbemoreinclinedtoinvestabroadthantheirforeigncounterparts.
A3.2 FDI positions relative to GDP, 2008
Source: Eurostat (GDP) and OECD (FDI), calculated by Statistics Netherlands.
120100806040200
–20–40–60–80
Denmark
%
Outward FDI Inward FDI
SwedenNetherlandsFranceGermany
3.4.1 Trends: stocks
ItseemsthatthecrisishashadmorenegativeeffectsonDutchFDIthanonthatofothercountries.ThegraphbelowshowsthatgrowthofDutchinwardFDI(stocks)stillfaredwellcomparedwiththoseofDenmark,France,GermanyandSwedenduring the period2000–2005. In2006 it grew considerably less than in othercountries, and a large part of the big boost of Dutch inward FDI in2007 wasexplainedbythetakeoverofABNAMRO.DuringthenexttwoyearsinwardFDIin the Netherlands decreased, while it continued to grow in other countries.

Internationalisation Monitor 2010 53
However,itmustbetakenintoaccountthatalargepartofthedecreasein2008wastheresultoftheDutchStateacquiringtheDutchpartofFortis.
NotethatthefindingsinthissectionarerestrictedtoFDIstocks,astheflowsarehighlyvolatileandonadetailedleveltheyareoftenheavilyinfluencedbyalargesingletransaction.
A3.3 Growth of inward FDI (stocks)
Source: OECD, calculated by Statistics Netherlands.1) 2009 data for Denmark and France not yet available.
30
25
20
15
10
5
0
–5
–10
–15
%
Denmark France Germany Netherlands Sweden
2000/2005 2006 2007 2008 2009 1)
A3.4 Growth of outward FDI (stocks)
Source: OECD, calculated by Statistics Netherlands.1) 2009 data for Denmark and France not yet available.
20
15
10
5
0
–5
%
2000/2005 2006 2007 2008 2009 1)
Denmark France Germany Netherlands Sweden

54 Statistics Netherlands
AsimilarpatterncanbediscernedinoutwardFDI.FortheNetherlands,outwardFDIgrewatthesamepaceasforothercountriesduringtheperiod2000–2006.Butit grew far less in the subsequent three years. In2008 outward Dutch FDI evendecreased,whereasoutwardFDIcontinuedtogrowintheothercountriesunderinvestigation.
3.4.2 Trends on sectoral level
ThegeneraltrendinEuropeonasectorallevelseemstobethatthereisanincreasingconcentrationofinvestmentsintheservicesector.However,TableA3.2showsthatin the Netherlands the shares of manufacturing increased. Furthermore, in theEU15witharatioof3:1,theshareofservicesisfarlargerthanthatofmanufacturing,whereasthisratiointheNetherlandsisaround1:1.ThisissurprisingbecausethegeneralviewisthattheNetherlandsisaserviceseconomy.Theanswerisfoundinthe“businessandmanagementconsultancyactivitiesincludingthoseofholdingcompanies”sector.WhereasthissectorissmallintheNetherlands,itisverylargeinothercountries.Forexample,inFranceitaccountsfortwothirdsofincomingFDI. The most plausible explanation is that other countries include financialholdings(suchasSPEs)intheirstatistics,whereastheNetherlandsdoesnotdosofordetailedstatistics,asnotedinBoxA3.1.Itisobviousthatthishasconsequencesforother internationalcomparisonsaswell.Wehaveoptednot to takethis intoaccountforthetimebeing.
TheNetherlandshastraditionallyhadarelativelylargesharein“refinedpetroleumproductsandothertreatments”,forbothinwardandoutwardFDI.Thisisaverycapitalintensivesector.Recently,inwardFDIroseforgasextraction,foodproductsandcomputeractivitiescomparedwithothercountries.
3.4.3 Trends on country level
JustasintheNetherlands,theshareoftheOECDininwarddirectinvestmentsdidnotchangemuchduringtheperiod2000–2008forthecountriesunderinvestigation.However,therewassomevariationintheleveloftheshareoftheOECDamongcountries:from90percentinDenmarkandtheNetherlands,upto97–98percentinGermany. Another similarity between the Netherlands and the benchmarkcountrieswasthedecreaseinUSincomingdirectinvestments,whereastheshareofincomingdirectinvestmentsfromtheEU15showedageneralincrease.Aswastobeexpected,theshareofneighbouringcountriesintotalFDIwasrelativelyhighforeverycountry.
TheshareoftheOECDinoutwarddirectinvestmentswasjustbelow90percentforthe Netherlands and the benchmark countries in2008. It remained constant forFrance,GermanyandtheNetherlands,whileitdroppedforDenmarkandSweden

Internationalisation Monitor 2010 55
by 5 and 3percent respectively, during the period2000–2008. Just as in theNetherlands,theshareofdirectinvestmentsfromtheothercountriesintheUnitedStatesdecreasedsharply,whereastheshareofinvestmentsintheEU15rose.Thisphenomenon isonlypartiallyexplainedby theconsiderabledepreciationof thedollaragainsttheeuroduringtheperiod2000–2008.Apparently,itbecamemoreinterestingforEuropeanenterprisestoinvestinEuropeinsteadofintheUnitedStates. Ingeneral, those investmentswent tocountries that joinedtheEuropeanUnionbefore2004,andtheshareforthenewerEUcountriesremainedconstant.Only for Germany did the share of investments in the new EU countries risequickly.Newinvestmentsinotheremergingmarkets,suchastheBRICcountries,werealsomostprominentinGermany.
3.5 Conclusions and further research
The sustained increase in FDI stocks in and by the Netherlands came to a haltduringthecrisis.Forthefirsttimeinmanyyears,stocksofinwardandoutwardFDI decreased. A prominent trend observed in the Netherlands and in similarEuropeancountriesisthatenterpriseshavestartedtoinvestmoreinEuropethanin the United States. Consequently, the share of incoming European directinvestmentsisalsoontheincrease,whereasthatoftheUnitedStatesisdecreasing.Surprisingly,thereseemstobeatrendintheNetherlandsinfavourofincomingdirect investments inmanufacturing,whereas it is exactly theopposite inothercountries. However, it is possible that this difference is an artefact caused by adifferenttreatmentofSpecialPurposeEntities.
ThereisonlylimitedinformationaboutenterprisesthatengageinFDI.TheinwardFATSandoutwardFATSyielddetailedinformationsuchasturnover,numberofemployees, number of enterprises, but the population they describe is differentfromthepopulationintheFDIstatistics.ThereforeStatisticsNetherlandsstartedaprojectinordertodetermine,forbothlargerandsmallerenterprises,whethertheyhave investments abroad or not. It will subsequently match that information tootherbusinessandperformancecharacteristics.
References
AmCham(2010).Theattractivenessof theNetherlandsasa location for foreigninvestment.TheAmericanChamberofCommerceintheNetherlands.
DNB (2008–3). Selected Recent Developments. Statistical Bulletin March 2008, DeNederlandscheBank.

56 Statistics Netherlands
DNB(2008–9).Statistical Bulletin September 2008,DeNederlandscheBank.
DutchMinistryofFinance(2008,3October).PressreleaseMinistryofFinanceonFortis.
FATSRegulation(2007).Regulation(EC)No716/2007oftheEuropeanParliamentandoftheCouncilof20June2007onCommunitystatisticsonthestructureandactivityofforeignaffiliates,Official Journal of the European Union,29thJune2007.
IMF Balance of Payments Manual (1993), fifth edition, International MonetaryFund.
Kalinova, B., Palerm A. and S. Thomsen. OECD’s FDI Restrictiveness Index:2010Update.OECD Working Papers on International Investment,No.2010/3.
Koo, R.C. (2003). Balance Sheet Recession: Japan’s Struggle with UnchartedEconomicsanditsGlobalImplications.JohnWiley&Sons(Asia)PteLtd:Singapore.
Van den Dool, G. (2008) Can foreign direct investment statistics be made moreuseful?Statistical Bulletin December 2008,DeNederlandscheBank.
WorldInvestmentReport2008,TransnationalCorporationsandtheInfrastructureChallenge,UnitedNations2008.
World Investment Report2009, Transnational Corporations, AgriculturalProductionandDevelopment,UnitedNations2009.

Internationalisation Monitor 2010 57
A4 Trends in international R&D and innovation in the NetherlandsRené Bongard
4.1 Introduction
“If we fail to act now, our prosperity growth will come to a standstill”(MichaelPorter,2001,InnovationLectureDutchMinistryofEconomicAffairs).
AccordingtoPorter,theNetherlandsneedstoshiftfromanapproachbasedonlowcostandefficiencytoonebasedoninnovationanddynamisminordertofurtherincreaseproductivityandwelfare(Porter,2001).Policymakershavealsorecognisedtheimportanceofinnovation,andhaveplacedtheitemhighontheiragendas.OnEU level, the Lisbon agenda has set targets for EU member states to invest ininnovationinordertofostereconomicgrowth.Onanationallevel,keyactorsfrombusiness,politics,scienceandeducationareworkingtogetherontheKnowledgeand Innovation Agenda2011–2020 in the Knowledge and Innovation Agendacoalition(KIA-coalition),whichwasknownastheDutchInnovationPlatformuntilApril2010. The new Knowledge and Innovation Agenda2011 –2020 has beenformulated in response to the European Commission’s communication entitled“Europe2020–astrategyforsmart,sustainableandinclusivegrowth”.Itsgoalforthe Netherlands is for the country to be among the top five countries with thestrongestcompetitiveness.
However, Dutch advances towards achieving the Lisbon goals have not beenconvincing. Furthermore, neither has the Dutch ambition to be among the fivemost competitive countries been reached. The ranking is based on the GlobalCompetitiveness Indicator compiled by the World Economic Forum (2010).Currentlyrankednumber10(April2010),theNetherlandsparticularlyfallsshortoninnovationcomparedwiththenumberoneSwitzerland.Stimulatinginnovationin the Netherlands is currently recognised as a key factor for maintainingcompetiveness.InMay2010theConferenceBoardpublishedtheresultsofresearchon the Dutch innovation agenda which they had conducted for the DutchInnovationPlatformandconcludedthat“continuedinvestmentinintangiblesisakeypartofkeepingthegrowthoftheDutcheconomyontrack.Adestructionorslowdown in creation of intangible capital would hamper the ability to keepeconomic growth at sustainable rates” (Conference Board, 2010). In anotherpublication by the Innovation Platform, the authors recommend that theNetherlandsattractmoreinternationalenterprisesandincreasetrade,expressingtheir concernabout thepressureonDutchcompetitivenessasa consequenceof

58 Statistics Netherlands
globalisation,anageingsociety,energytransition,theeconomicrecessionandtheshiftofeconomicpowertowardsAsia(DutchInnovationPlatform,2010).
ThischapteroftheInternationalisationMonitorexaminesinnovationactivitiesinthedifferentindustrybranchesoftheDutchbusinesssectorovertimeandinaninternationalperspective.ForeigncontrolledenterprisesarecomparedwithDutchcontrolled enterprises, exporters with non-exporters and importers with non-importers.Usingamicro-levelapproach,weareabletoprovidenewinsightsintothe interrelation between innovativeness and the globalising economy. TheCommunityInnovationSurvey(CIS)isthemaindatasourceforthefirsttwopartsofthischapter.TheoutcomesareweightedtothepopulationofallenterprisesintheNetherlandswithmorethan10employees.
4.1.1 Innovation: definition
InordertoanalysethevarietyofinnovationactivitiesintheNetherlandswefirsthavetomakeadistinctionbetweeninventionandinnovation.Aninventionisthediscoveryofanideathatisnewtotheworld.Aninventionisoftenregardedasaneworimprovedtechnology.However,anewmethodofprocessingoranewwayof organising something is also an invention. An innovation is a successfullyimplemented invention in practice, which means that it has to add value. Ineconomictermsaninventionisaninnovationifityieldshighervalueforcustomersor producers. Many scholars in the field of economics regard innovation as themainsourceofproductivitygrowthfordevelopedcountriesandthereforeasthemotorbehindwelfaregrowth(Porter,2001;Hall,2009).
Someinventionsarespontaneousdiscoveriesmadewhenpeoplemaketheirworkmoreefficientandcomeupwithnewideas.Otherinventionsresultfromresearchanddevelopment(R&D)specificallyfocusedoncomingupwithsomethingnew.Universities, government organisations and enterprises have dedicated R&Dactivitieswhoseremitistoimproveexistingtechnologiesanddiscovercompletelynew technologies. R&D investment increases the odds of inventions beingdiscovered. Many inventions are unsuccessful, but the ones that are successfulyieldaddedvaluetoanenterprise,industry,customerorsocietyasawhole.R&Dinvestmentisimportantforinnovation.
TodescribethetrendinR&Dandinnovationfromaninternationalperspectivethischapterisdividedintothreemainparts.Aftertheintroduction(4.1),thefirstpart(4.2)providesindicatorsoninnovationinput(R&Dexpendituresandenterprisesactive in R&D) for several stratifications such as industry branch, internationaltrade profile (i.e. exporter / non-exporter, importer / non-importer), locus ofcontrol(i.e.whethertheimportantdecisionsfortheenterprisearetakenabroadorin the Netherlands) and size class. International trade and locus of control are
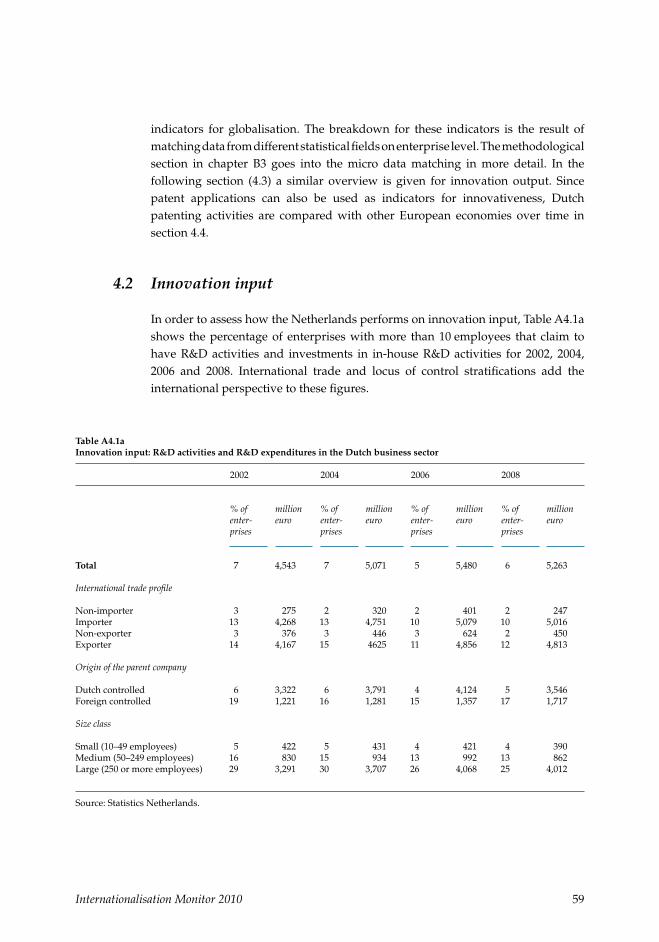
Internationalisation Monitor 2010 59
indicators for globalisation. The breakdown for these indicators is the result ofmatchingdatafromdifferentstatisticalfieldsonenterpriselevel.Themethodologicalsection in chapter B3 goes into the micro data matching in more detail. In thefollowing section (4.3) a similar overview is given for innovation output. Sincepatent applications can also be used as indicators for innovativeness, Dutchpatenting activities are compared with other European economies over time insection4.4.
4.2 Innovation input
InordertoassesshowtheNetherlandsperformsoninnovationinput,TableA4.1ashows the percentage of enterprises with more than 10employees that claim tohave R&D activities and investments in in-house R&D activities for 2002, 2004,2006 and 2008. International trade and locus of control stratifications add theinternationalperspectivetothesefigures.
Table A4.1a Innovation input: R&D activities and R&D expenditures in the Dutch business sector
2002 2004 2006 2008
% of million % of million % of million % of million enter- euro enter- euro enter- euro enter- euro prises prises prises prises
Total 7 4,543 7 5,071 5 5,480 6 5,263
International trade profile
Non-importer 3 275 2 320 2 401 2 247Importer 13 4,268 13 4,751 10 5,079 10 5,016Non-exporter 3 376 3 446 3 624 2 450Exporter 14 4,167 15 4625 11 4,856 12 4,813
Origin of the parent company
Dutchcontrolled 6 3,322 6 3,791 4 4,124 5 3,546Foreigncontrolled 19 1,221 16 1,281 15 1,357 17 1,717
Size class
Small(10–49employees) 5 422 5 431 4 421 4 390Medium(50–249employees) 16 830 15 934 13 992 13 862Large(250ormoreemployees) 29 3,291 30 3,707 26 4,068 25 4,012
Source:StatisticsNetherlands.

60 Statistics Netherlands
In2008,4percentofsmallenterpriseshadR&Dactivities.Medium-sizedenterprisesweremoreoftenactiveinR&D(13percent).ItappearsthatlargerenterprisestendtoinvestmoreofteninR&D,asaquarterofthelargeenterpriseshadR&Dactivitiesin2008. The large enterprises are responsible for 76percent of total R&DinvestmentsintheDutchbusinesssector.Thisisinlinewithresultspublishedinthe2009editionof the InternationalisationMonitor (Statistics Netherlands) andwiththein-depthanalysisinchapterB3ofthis2010edition.In2002relativelymoreenterprises had R&D activities than in2008: the percentage of R&D enterprisesdeclinedforallsizeclasses.TotalexpenditureonR&DintheDutchbusinesssectorincreased by roughly 700million euros, or 16percent, in the period2002–2008.However, correcting for annual price level increases (inflation) in the Dutcheconomy, one can state that R&D investments in2008 are on a par with thosein2002.TheincreaseinR&Dexpenditurescametoanendin2006.Thereisevenadeclineof200millioneurosbetween2006and2008whichmaybetheresultoftheeconomic stagnation that started in that period, as uncertainty about futureeconomicgrowthcanleadtocautiousinvestmentbehaviourbyenterprises.
Furthermore,itappearsthatDutchcontrolledenterprisesarerelativelylessactiveinR&Dcomparedwithforeigncontrolledenterprises:in2008,5percentofDutchenterprisesinvestedinR&D,while17percentofforeigncontrolledenterpriseshadR&D activities. However, it must be taken into account that the distribution ofDutchandforeigncontrolledenterprisesoverthesizeclassesisnotequal.Byfarmost Dutch enterprises are classified as small, whereas foreign controlledenterprises are underrepresented in this small size class. Foreign controlledenterprises in the Netherlands are, on average, larger than Dutch controlledenterprisesintermsofemployeenumbers.LargeenterprisesinvestrelativelymoreofteninR&Dandonaveragetheamountsinvestedarehigher.Ontheotherhand,chapterB3providesin-depthanalysesoftherelationshipbetweencompanysizeandR&Dactivitiesandestablishesthatwhencontrollingforotherfactors,foreigncontrolledenterprisesarestillmoreinnovativethanDutchcontrolledenterprises(seealsothe2009editionoftheInternationalisationMonitor).
In2008, foreign controlled enterprises were responsible for one third of R&DexpendituresintheDutchbusinesssector.Thisisaconsiderableincreasecomparedwith theperiod2002–2006when foreigncontrolledenterpriseswereresponsiblefor a quarter of R&D expenditure. However, this is the result of just a fewacquisitions of large Dutch controlled firms by foreign controlled firms. Themajority of R&D expenditures is incurred by a limited number of very largeenterprises. International enterprises decide to exploit R&D activities in theNetherlands by setting up new R&D facilities or by taking over existing DutchR&D activities through mergers and acquisitions. However, the reasons whyforeign enterprises acquire Dutch R&D activities remain uncertain. Will theycontinuetoinvestinR&DintheNetherlandsandincreaseR&Dexpenditures?Or

Internationalisation Monitor 2010 61
willtheycapturetheknowledgeanddecreaseorevenstopinvestmentsinDutchR&D? For example, in July2010 a large pharmaceutical enterprise in theNetherlands announced its intention to close its R&D department and move itabroad. One year earlier the former Dutch enterprise had been acquired by aforeigncontrolledmultinational.
Importers and exporters generally have more R&D activities than non-tradingfirms.In2008,just2percentofthenon-importingenterprisesareinvolvedinR&Dactivities,while10percentoftheimportingenterpriseshaveR&Dactivities.Twopercentofthenon-exportingenterprisesarealsoactiveinR&D,while12percentofthe exporting enterprises invest in R&D. Size is also obviously significant here.Enterprisesinvolvedininternationaltradearelargerthanenterprisesthatdonottradeinternationally.RegressionanalysesinchapterB3showthattheeffectofsizeclassdoesnotfullyexplainthedifferencesbetweentradersandnon-traders.Notethatanenterpriseisdefinedasaninternationaltraderifittradesinternationally,oratleastoneoftheenterprisesinthesameenterprisegroupdoes.
TableA4.1bcontainsthesameindicatorsasTableA4.1a,butnowbrokendownbyindustrybranch.SinceenterprisesinthemanufacturingbranchspendthemajorityoftotalR&DexpendituresintheDutchbusinesssector,afurtherbreakdownintomanufacturing classes is provided. 17percent of the enterprises in themanufacturingbranchhaveR&Dactivitiesin2008,spendingatotalof3.8billioneurosonR&Dactivities.Acloserexaminationofthemanufacturingsectorrevealsthat the following three manufacturing sectors turn out to be the most R&Dintensive:
– Electricalandopticalequipment– Chemicals,chemicalproductsandman-madefibres– Machineryandequipment
Enterprisesinthesefieldsareresponsibleforover80percentofR&Dexpendituresin the Dutch manufacturing sector and for almost 60percent of the total R&DexpendituresintheDutchbusinesssector.LaterinthischapterweseethatthisisinlinewithDutchpatentapplicationsinrelatedtechnologyfields.

62 Statistics Netherlands
Table A4.1b Innovation input: R&D activities and R&D expenditures in the Dutch business sector
2002 2004 2006 2008
% of million % of million % of million % of million enter- euro enter- euro enter- euro enter- euro prises prises prises prises
Total 7 4,543 7 5,071 5 5,480 6 5,263
Industry branch
Agriculture,huntingandforestry 2 53 6 12 3 1 3 27Miningandquarrying 10 64 9 31 3 183 4 35Electricity,gasandwatersupply 25 16 21 5 14 16 12 15Manufacturing 20 3,454 18 3,898 16 4,094 17 3,758Ofwhich
foodproducts,beveragesandtobacco 13 256 13 215 11 172 13 152textilesandtextileproducts 12 14 16 34 17 20 15 19leatherandleatherproducts 14 1 16 10 9 3 15 2woodandwoodproducts 5 6 11 9 4 9 5 7pulp,paperandpaperproducts;publishingandprinting 8 40 8 98 8 68 6 65coke,refinedpetroleumproductsandnuclearfuel 38 10 30 10 39 9 39 26chemicals,chemicalproductsandman-madefibres 56 843 42 1,165 38 683 45 974rubberandplasticproducts 25 45 29 90 20 75 33 64othernon-metallicmineralproducts 11 34 14 62 11 27 23 32basicmetalsandfabricatedmetalproducts 17 161 12 97 10 89 10 137machineryandequipmentn.e.c. 34 466 32 918 26 697 25 879electricalandopticalequipment 37 1,414 30 793 35 1,986 31 1,221transportequipment 22 141 23 369 18 220 12 154manufacturingn.e.c. 11 24 8 28 8 38 7 24
Construction 1 28 2 24 1 29 1 47Wholesaleandretailtrade 3 201 3 93 2 169 3 113Hotelsandrestaurants 0 3 0 2 0 1 0 1Transport,storageandcommunication 2 27 2 18 1 53 1 25Financialintermediation 5 41 5 56 6 33 3 140Realestate,rentingandbusinessactivities 9 641 9 925 7 895 7 1,056Othercommunity,socialandpersonalserviceactivities 3 16 3 7 3 6 2 45
Source:StatisticsNetherlands.
4.3 Innovation output
In addition to the indicators on R&D input, this section provides indicators oninnovationoutput.Weknowfromsection4.2howmuchenterprisesinvestinR&D,butwedonotknowhowmuchtheyearnfrominnovation.Scholarsfoundevidence

Internationalisation Monitor 2010 63
thatprivatereturnstoR&Darestronglypositive,whilesocialreturnsasaresultofknowledge spillovers are even higher (Hall, 2009). However, there is as yet nosubstantial quantitative evidence to bear this out. Therefore other variables areusedtomeasureinnovationoutput.First,thepercentageofenterprisesthathaveintroducedaninnovation–alsodistinguishingbetweenproductinnovationsandprocessinnovations–sayssomethingaboutinnovativeness.Second,theshareofenterprisesthatappliedforapatentintheperiodunderinvestigation(2004–2008)canalsobeusedasanindicatorofinnovation.Thesamestratificationsasinthesectiononinnovationinputareused:industrialbranch,internationaltradeprofile,locusofcontrol,andsizeclass.
Table A4.2a Innovation output: innovating enterprises and patent applications
2004 2008
Inno- Product Process Patent Inno- Product Process Patent vation inno- inno- appli- vation inno- inno- appli- vation vation cation vation vation cation
% of enterprises
Total 25 17 17 3 25 17 15 3
International trade profile
Non-importer 18 11 13 1 17 11 11 1Importer 35 25 23 6 33 23 21 6Non-exporter 18 11 13 1 17 11 11 1Exporter 38 28 25 7 36 26 22 7
Origin of the parent company
Dutchcontrolled 23 15 16 3 23 15 15 3Foreigncontrolled 46 35 31 9 48 37 27 9
Size class
Small(10–49employees) 22 12 14 2 21 14 13 2Medium(50–249employees) 38 26 26 7 37 26 25 6Large(250andmoreemployees) 59 38 46 14 54 41 39 14
Source:StatisticsNetherlands.
There are only marginal differences between 2004 and 2008, indicating thatdifferencesininnovationoutputovertimearesmall.In2008almostaquarteroftheenterprisesintroducedaninnovationandjust3percentappliedforapatent.Althoughthedifferenceisslight,therearemoreproductinnovationsthanprocessinnovations.

64 Statistics Netherlands
Importers and exporters are roughly twice as likely to be innovators comparedwithnon-importersandnon-exportersrespectively.Thisappliestobothproductinnovations and process innovations. Enterprises active in international tradeapplyformorepatentsthannon-traders.Again,thefactthattradersarelargerthannon-tradersisthemainreasonforthisobservation.However,controllingforsizeclass and other structural business factors, international traders still seem to bemore innovative. The same applies to the difference in innovativeness betweenDutchcontrolledenterprisesandforeigncontrolledenterprises(seechapterB3).The size class breakdown clearly shows that larger enterprises introduceinnovations more often. One in five small enterprises introduced an innovationin2008,whereasmorethanhalfthelargeenterpriseswereinnovativeinthesameyear.Thedifferencebetweensmallandlargeenterprisesisafactorsevenforpatentapplications,whichmayindicatethatsmallenterprisesencounterrelativelymorebarrierswhenapplyingforapatentthanlargeenterprisesdo.Thesebarrierscouldbe because applying for a patent is costly and time consuming. The need forpatenting could also be less urgent for small enterprises since in geographicaltermstheyareusuallyactiveonsmallermarkets.
TableA4.2bshows the innovationoutput indicatorsby industrybranchwithanadditional breakdown for the manufacturing branch. The construction and thehotels and restaurantssectorsaretheleastinnovativesectors,whichmaybebecauseof the high number of small enterprises in these branches. Note that there arerelativelyfew,butverylargeenterprisesactiveintheElectricity, gas and water supplyandMining and quarryingbranches.Thisispartlythereasonforthehighpercentageof innovative enterprises to be found here. The manufacturing branch has highinnovationoutputrates.Twoinfivemanufacturingfirmsintroducedaninnovationin2008 and almost 10percent applied for a patent. The breakdown for themanufacturing sector reveals that chemical enterprises are the most innovative.More than70percentof themanufacturingenterprises in the chemicals, chemical products and man-made fibresandrubber and plastic productsbranchesintroducedaninnovationin2008.Thesesectorsalsoscorethehighestforpatentapplicationswithashareof19percent.Inthemachinery and equipmentsectorandintheelectrical and optical equipmentsectorrelativelymanyenterprisesalsoappliedforpatents.Whileinmostsectorsthereismoreproductinnovation,somesectorsshowhighersharesfor process innovation. In particular, innovation in the wood and wood productssectorandinthecoke, refined petroleum products and nuclear fuelsectorseemstobemoreprocessorientedthanproductoriented.Thesesectorsmainlyproducelow-techandstandardisedoutputwhich implies that increasing labourproductivityandprofitrequiresmoreprocessinnovationthanproductinnovation.

Internationalisation Monitor 2010 65
Table A4.2b Innovation output: innovating enterprises and patent applications
2004 2008
Inno- Product Process Patent Inno- Product Process Patent vation inno- inno- appli- vation inno- inno- appli- vation vation cation vation vation cation
% of enterprises
Total 25 17 17 3 25 17 15 3
Industry branch
Agriculture,huntingandforestry 29 17 22 3 26 18 16 5Miningandquarrying 35 23 24 21 37 27 21 2Electricity,gasandwatersupply 51 23 41 6 51 24 33 14Manufacturing 42 29 29 9 42 30 28 9ofwhich
Foodproducts,beveragesandtobacco 36 25 28 3 38 29 26 2Textilesandtextileproducts 39 27 31 10 48 30 35 9Leatherandleatherproducts 19 17 12 0 27 19 14 9Woodandwoodproducts 34 24 22 7 38 16 28 2Pulp,paperandpaperproducts;publishingandprinting 37 23 30 3 31 20 21 3Coke,refinedpetroleumproductsandnuclearfuel 56 35 33 0 54 28 44 0Chemicals,chemicalproductsandman-madefibres 66 49 45 24 70 57 39 19Rubberandplasticproducts 53 38 35 17 71 53 48 19Othernon-metallicmineralproducts 32 21 26 10 55 39 35 10Basicmetalsandfabricatedmetalproducts 36 23 26 4 34 21 27 6Machineryandequipmentn.e.c. 54 41 33 19 46 35 25 17Electricalandopticalequipment 55 47 33 13 57 41 37 16Transportequipment 41 29 29 12 37 26 21 10Manufacturingn.e.c. 30 20 19 4 30 21 20 7
Construction 11 6 8 1 12 8 9 1Wholesaleandretailtrade 21 14 12 2 22 14 13 3Hotelsandrestaurants 12 7 8 1 10 6 7 0Transport,storageandcommunication 18 10 14 1 21 12 15 0Financialintermediation 29 19 21 0 29 20 17 0Realestate,rentingandbusinessactivities 31 21 20 3 26 19 15 3Othercommunity,socialandpersonalserviceactivities 25 13 17 1 20 14 12 1
Source:StatisticsNetherlands.
NotethatsomeindustrybranchespaylessattentiontoR&Dandinnovation,butstill increase productivity by introducing innovative products or processesdevelopedbysuppliersinotherbranches.Theconstructionindustryisknowntobe less innovative than many other industries. However, innovations in, for

66 Statistics Netherlands
example,thechemicalindustrycanfinallyleadtoimprovedconstructionmaterialsusedintheconstructionindustry.Therefore,innovationinonebranchalsoleadstoproductivity gains in other branches and innovation diffuses through trade invaluechains.
4.4 Dutch innovation over time and in an international perspective: benchmarking patent indicators
PatentsareintellectualpropertyrightsthatofferlegalprotectionfortheresultsofR&D investments. They are granted if the invention is new and industriallyapplicable.Thisjustifiestheassumptionthatpatentscanbeusedasindicatorsofinventionsthatmayaddvaluewhenimplemented.Inaddition,theadvantageofpatent indicators is that theunderlyingdatasourcesarepubliclyavailable foralong time.Adisadvantageofusingpatentsasan indicatorof innovation is thatpatentscanalsobeusedforstrategicreasons.Enterprisesmayapplyforpatentsinorder to forcecompetitors to inventaroundthepatented invention,without theproperincentivetoexploitthepatentedtechnology(Granstrand,2000).
TocomparetheDutchinnovationoutputwiththatofsimilarEuropeancountries,Graph A4.1 shows the number of annual patent applications at the EuropeanPatentOffice(EPO)fortheselectedcountries.Thecorrelationbetweenacountry’spopulation,industrysizeandnumberofpatentapplicationshastobetakenintoaccount. The Netherlands has the largest economy in terms of GDP of thebenchmarkcountriesandthereforeonemayexpectthenumberofannualpatentapplicationstobehigherthaninasmallereconomy.However,thegraphshowsthattheannualnumberofDutchpatentapplicationswasmoreorlessthesameasthe number of Swiss patent applications in the period1990–1998. From 1998through2004theNetherlandsledinthenumberofannualpatentapplications,butsince2004asuddendeclineinDutchpatentapplicationsisvisible(mainlyintheElectricityclass,seeTableA4.1),whileSwissapplicationscontinuetoincrease.Theother benchmark countries show a more stable number of annual patentapplications.AreasonfortheSwissincreaseinpatentapplicationsmaybestrategicpatentingwhichispopularinthepharmaceuticalbranch(OECD,2008,p.68),andtheSwisspharmaceuticalindustryismuchlargerthantheDutchpharmaceuticalindustry.
InternationalcooperationinR&Dactivitiesleadstocross-borderknowledgeflowsandfostersinnovationdiffusion.Thenumberofjointpatentapplicationsbetweendomestic and foreign inventors is indicative of international cooperation ininnovation. Belgium and Switzerland are the leading benchmark countries ininternationalcooperationinR&D.Geographicalandlinguisticreasonsmayexplainthistoacertainextent.In2004,18percentofallDutchpatents(withmorethanone

Internationalisation Monitor 2010 67
inventor)wereapplied forbyat leastoneDutchandone foreign inventor.Thisinternationalco-inventionrateis9percentforthewholeEuropeanUnion.Inlinewith increasing globalisation of the world economy, the Netherlands and allbenchmarkcountries in theavailable timeseriesshowanupwardtrendin jointpatentapplications.Enterprises tendtoexploit theiractivities increasinglymoreoftenacrossbordersinordertogainaccesstonewmarketsandproductionfactorse.g. mineral resources, cheap labour.Access to knowledge and R&D is anotherimportantmotiveforeconomicactorstocrossborders.Thisstimulatesinnovationdiffusionandincreasesknowledgespillovereffects.
A4.1 Annual patent applications at European Patent Office (EPO)
Source: European Patent Office (EPO).
5,000
4,500
4,000
3,500
3,000
2,500
2,000
1,500
1,000
500
0
1990 1991 1992 1993 1994 1995 1996 1997 1998 1999 2000 2001 2002 2003 2004 2005 2006
patent applications
Austria Belgium Denmark Finland
Netherlands Sweden Switzerland

68 Statistics Netherlands
A4.2 International cooperation in invention
40
35
30
25
20
15
10
5
0
percentage of patents with foreign co-inventor
Source: European Patent Office (EPO).
1990 1991 1992 1993 1994 1995 1996 1997 1998 1999 2000 2001 2002 2003 2004 2005 2006
Austria Belgium Denmark Finland
EU 27Netherlands Sweden Switzerland
4.4.1 Future technologiesInthecurrenteconomicclimatewithdecliningandevennegativeeconomicgrowthinsomepartsoftheworld,astronginnovativemotorisneededtofosterrecovery.Investmentsinfuturetechnologies,forexampleinthefieldofrenewableenergy,offeropportunitiesforeconomiestorecoverandgenerateaddedvalue.Takingintoaccountthedwindlingstockoffossilfuels,attentionforalternativeenergysourcescan be expected. This offers opportunities for new technologies in the fields of,among others, energy saving and renewable energy. TableA4.1 and TableA4.2contain figures on selected technology domains, further referred to as futuretechnologypatent classes. These classesare identified by theOECDandby theUnitedStatesPatentandTrademarkOffice(USPTO),theEuropeanPatentOffice(EPO)andtheJapanPatentOffice(JPO).
TableA4.3presentsfigures forDutchpatentapplications forsevenof the futuretechnologypatentclassesandtheeightmainInternationalPatentClasses(IPCs).In2006almost48percentofDutchpatentapplicationswereinafuturetechnologyclass,ofwhichICTisbyfarthemostimportantfollowedbybiotechnology. Human necessities, physics, electricity and chemistry / metallurgy are the most important

Internationalisation Monitor 2010 69
InternationalPatentClassesfortheNetherlands.Itisinterestingtoseethedeclineintheelectricityfieldandtheriseinthefieldofphysics.
Table A4.3 Dutch patent portfolio
1994 2000 2006
% of Dutch patent applications abs.
Patent applications / International Patent Classes (IPC) 100 100 100 4,319
HumanNecessities 18.8 13.0 20.2 871PerformingOperations;Transporting 14.6 11.9 11.8 511Chemistry;Metallurgy 16.4 15.2 16.1 694Textiles;Paper 1.2 1.2 1.2 50FixedConstructions 3.5 3.3 3.9 168MechanicalEngineering;Lighting;Heating;Weapons;Blasting 5.4 4.3 5.0 214Physics 16.5 23.2 23.3 1,006Electricity 23.7 27.9 18.6 804
Future technology patent classes 43.3 55.8 47.9 2,070
Biotechnology 4.5 6.0 6.3 271ICT 35.3 46.4 36.4 1,571Nanotechnology 0.5 0.5 1.5 64Pollutionabatementandwastemanagement 1.7 1.2 1.6 70Renewableenergy . 0.4 0.3 13Electricandhybridvehicles . 0.0 0.0 2Energyefficiencyinbuildingsandlighting 1.2 1.2 1.8 79
Source:EuropeanPatentOffice(EPO).
TableA4.4 places the Dutch patent portfolio in a European perspective bybenchmarkingitwithcomparableEuropeaneconomies.Bydividingacountry’srelativeshareofpatentapplicationsinacertainpatentclassbytherelativeshareofallitsEPOpatentapplications,thefocusonaparticularpatentclassinthecountrycanbededuced.Valueshigher thanone indicateanaboveaveragefocusonthepatentclassandtheunderlyingtechnologyfield.Forexample,in2006weseethattheNetherlandshasahighfocusonnanotechnology.TheNetherlandshasaveryhighfocusonenergy efficiency in buildings and lighting,while theDutchfocusonmechanicalengineeringisbelowtheEuropeanaverage.ThebenchmarkcountriesFinland, Sweden and Switzerland have, just as the Netherlands, a relative highfocusonfuturetechnologyclasses.Switzerland,BelgiumandDenmarkfocusmoreon biotechnology, while Finland and Sweden have a relatively high share of ICTpatentapplications.Finland,Belgium,AustriaandDenmarkhavehighersharesinthefieldsofpollution abatement and waste management.The27EUmember states

70 Statistics Netherlands
have,onaverage,arelativelylowshareofpatentsinthefuturetechnologyclasses.TheNetherlandsthereforeperformswellcomparedwiththeaverageEUmemberstate,andalsoquitewellcomparedwiththeselectedbenchmarkcountries.
Table A4.4 Dutch patent portfolio in a European perspective
TheNetherlands Benchmarkcountriesin2006
1994 2000 2006 Austria Bel- Den- Finland SwedenSwitzer-EU27 gium mark land in
2006
% of EPO patents
Patent applications / International Patent Classes (IPC) 3.2 3.5 3.5 1.1 1.1 0.8 1.2 2.2 3.9 43.0
HumanNecessities 3.9 2.9 3.9 1.2 1.4 1.4 0.5 2.1 6.4 40.4PerformingOperations;Transporting 2.5 2.5 2.5 1.5 1.1 0.6 0.9 2.1 4.4 53.9Chemistry;Metallurgy 2.9 3.5 4.3 0.8 2.1 1.0 0.9 1.2 4.5 40.5Textiles;Paper 2.0 2.7 2.9 1.8 5.1 0.3 2.8 1.6 4.9 58.1FixedConstructions 3.4 4.2 4.6 3.9 1.6 1.6 1.5 2.6 3.6 69.6MechanicalEngineering;Lighting;Heating;Weapons;Blasting 2.1 1.9 1.8 1.2 0.9 1.1 0.6 2.2 2.4 54.2Physics 3.0 4.2 4.4 0.5 0.7 0.5 1.3 1.7 3.5 34.7Electricity 4.4 4.8 3.2 0.7 0.5 0.4 2.3 3.6 2.0 35.5
Future technology patent classes 3.4 4.0 3.9 0.7 0.8 0.7 1.6 2.6 2.6 35.4
Biotechnology 2.3 2.8 4.3 1.1 2.1 1.9 0.5 1.5 4.2 36.6ICT 3.6 4.3 3.7 0.5 0.6 0.4 1.9 2.9 2.3 33.7Nanotechnology 3.1 2.2 6.8 0.8 1.7 0.4 1.0 1.2 3.2 39.3Pollutionabatementandwastemanagement 2.1 2.3 3.4 1.5 1.4 1.3 1.4 1.6 3.3 52.7Renewableenergy . 6.4 1.8 1.2 0.1 6.0 1.2 0.8 1.2 57.2Electricandhybridvehicles . 0.7 0.5 1.0 . . . 1.0 0.9 33.5Energyefficiencyinbuildingsandlighting 9.5 9.3 14.6 2.0 0.9 1.3 0.7 0.9 2.0 56.9
Source:EuropeanPatentOffice(EPO).
4.5 Summary and conclusion
This chapter places data on Dutch innovation activities in an internationalperspective and compares them over time. Breakdowns in several dimensions-industrial branch, international trade profile, locus of control and size class-provide an insight into R&D investment and innovation activities by differenttypesofenterprisesintheNetherlands.

Internationalisation Monitor 2010 71
The results showed that a relatively small number of large enterprises areresponsible for themajorityofDutchR&D investments.Furthermore,exportersand importers are more often active in R&D and invest more in R&D thanenterprisesthatdonottradeinternationally.Thisobservationispartlycausedbythesizeeffect,sincetradingenterprisesare,onaverage,larger(intermsofemployeenumbers)thannon-tradingenterprises.ThesamecanbesaidforthehigherR&Dactivity of foreign controlled enterprises compared with domestic-controlledenterprises.ChapterB3examinesthesefindingsinmoredetail.
Ingeneral,since2002totalR&DinvestmentsintheDutchbusinesssectorincreasedby16percent(2008),whiletheshareofenterpriseswithR&Dactivitiesdecreasedby 1percent. Enterprises in the manufacturing industry invest most in R&D,particularly in the fields of chemistry, machinery and electricity and optics.However,enterprisesinthesebranchesareoftensuppliersforother,lessinnovative,branches and therefore they lead to productivity growth in other branches as aresultofsellinginnovativeproductstotheircustomers.
Theconclusionsoninnovationoutputaremoreorlessthesameastheconclusionsoninnovationinput.Largeenterprisestendtobemoreinnovativeandapplyformorepatents.Foreigncontrolledenterprisesandexportersandimportersarealsomore innovative than Dutch controlled enterprises and non-exporters and non-importers respectively. The manufacturing sector is the most innovative sectorbecausetechnologyismoreimportantinthissectorthaninothers.
Theannualincreaseinthenumberpatentapplicationscametoanendin2002inthe Netherlands and has declined since 2004, while annual figures for patentapplicationsinmostbenchmarkcountriescontinuetoincrease.EnterprisesintheNetherlandsapplyforrelativelymanypatentsinfuturetechnologyclasses,whiletheaveragefocusofthe27EUmemberstatesontheseclasseslagsbehind.DutchR&Dseemstobehighlyfocusedonnanotechnologyandonenergyefficiencyinbuildingsandlighting.
Toconclude,wefindthatDutchinnovativeperformanceisrelativelyinternationallyoriented,sincetheshareofR&Dinvestmentsbyforeigncontrolledenterprisesis30percent in2008. Patent indicators also show that the Netherlands performsreasonablywellcomparedwiththebenchmarkcountries.Thereisarelativelyhighfocuson the future technologypatent classes thatofferopportunities for futureproductivity and welfare growth. The fact that Dutch patent applications havestagnatedsince2002andhaveevendeclinedsince2004isnotapositivesign,sincepatent applications indicate innovativeness and therefore future productivitygrowth.

72 Statistics Netherlands
ChapterB3discussesthetopicscoveredhereinmoredetail.Newbreakdownsandvariablesarepresentedandregressionanalysesshowrelationsbetweeninnovationandseveralessentialvariables.ChapterC4givesanoverviewofsomekeytablesoninnovationthathavebeenpublishedinearliereditionsofthisInternationalisationMonitor.
References
Dutch Innovation Platform (2010). ‘Netherlands2020: back in the top5 – Theeconomical agenda: innovative, international, involving’. Workgroup onCompetitiveness,TheHague
EuropeanPatentOffice(2008).‘WorldwideStatisticalDatabase.’editionApril2008.
Granstrand,O.(2000).‘The economics and management of intellectual property: towards intellectual capitalism’.EdwardElgarPublishing,Northampton.
Hall,B.H.,Mairesse,J.,Mohnen,P.(2009).‘MeasuringtheReturnstoR&D’.ChapterfortheHandbook of the Economics of Innovation.
Knowledge&InnovationAgendacoalition(2010).‘DutchKnowledge&InnovationAgenda2011–2020’,TheHague.
Organisation for Economic Co-operation and Development (OECD) (2008).‘Pharmaceuticalpricingpolicies inaglobalmarket’.OECD Health Policy Studies,Paris.
Porter,M.E.(2001).‘Innovationlecture2001’,TheHague.
StatisticsNetherlands(2009).Internationalisation Monitor 2009,TheHague/Heerlen
TheConferenceBoard(2010).Intangible Capital in the Netherlands and its applications for future growth.Workingpaper,NewYork.
World Economic Forum (2009). The Global Competitiveness Report 2009–2010.Geneva.

Internationalisation Monitor 2010 73
B1 International traders in goods and services – differences and similaritiesMarjolijn Jaarsma and Chantal Lemmens-Dirix
1.1 Introduction
Thevolumeofinternationaltradeingoodsandservicesisoftenusedasasimplemeasure of openness and integration with the rest of the world. However, thedrivers of these macro-economic developments are the enterprises that pursueinternationalsalesinordertoexpandtheirmarket(MayerandOttaviano,2007).Asis well documented in academic literature (Bernard and Jensen, 2007; Wagner,2005;BreinlichandCriscuolo,2008)andbrieflydiscussedinthepreviouseditionofthe Internationalisation Monitor (CBS, 2009), firms that engage in internationaltradedifferfrombusinessesthatoperateonlyonthedomesticmarket.Tradersareingeneralbigger,moreprofitable,payhigherwagesandaremorecapitalandskill-intensive than non-traders. However, international traders are by no means ahomogeneousgroup.Moststudiesfindthatonlyafractionoftradersaccountforalargeshareofthetotaltradeflowsandhavethehighestnumberoftradingpartners(Bernard and Jensen, 2007; Mayer and Ottaviano, 2007). These traders are mostoftenthelargestandmostproductiveenterprises.Smallerfirmsoftenhavealowertrade incidence and a different trade pattern. Firms that import and/or exportgoodsalsodifferfromenterprisesthatonlytradeinservices,inthesensethattheirproductportfoliorequiresdifferent inputsandthatservicesare inherentlymoredifficult to trade cross-border (e.g. buying a service might require the physicalpresenceoftheserviceprovider)(DohandPearce,2003).
Despite the growing importance of international trade in services, not much isknownaboutthecharacteristicsandperformanceofthefirmsengagedinthiskindoftradesincedetaileddataonamicro-levelarelacking.Onthecontrary,therearemanystudiesoninternationaltradeingoodsusingfirm-leveldatatodescribethespecificfirmfeatures.However,betterknowledgeofthecharacteristicsoftradersin services and a more profound link with traders in goods, are importantcontributionstotheunderstandingoffirmsengagedininternationaltransactions.Assuchtheaimofthisarticleistopresentnewdatasetsoninternationaltradersingoods and services in order to describe the main similarities and differencesbetweenthesevarioustypesofinternationaltradersintermsofeconomicactivity,enterprisesize,andownership.
Thenextsectionprovidesrelevantbackgroundinformationabouttheinternationaltrade in goods and services statistics and the composition of the datasets.

74 Statistics Netherlands
Subsequently,differencesinstructure,economicactivityandownershipbetweenthevarioustypesoftradersareexaminedinsection3.Thelastsectionpresentsthemainconclusionsofthischapter.
ThedatasetspresentedhereareusedinchapterB2tostudythedifferencesintwokeyeconomicvariables–turnoverandlabourproductivity–betweeninternationaltraders in services and/or goods and their non-exporting or non-importingcounterparts.TherelationshipbetweeninternationaltradeandthelevelofresearchanddevelopmentisinvestigatedinchapterB3.Inaddition,chapterB4examineswhether there are differences in employment between traders and non-traders.Thestudiescarriedoutinthesetwochaptersonlyincludedataontradersingoods.
1.2 Methodology and datasets
1.2.1 International trade in goods statistics (2002–2008)
New developments in the general business register in2008 made it possible tomatchasubstantialportionofthepopulationofinternationaltradersingoodstoenterprise (groups) in thegeneralbusinessregister.Theresultsof thismatchingexercise were satisfying: approximately 80percent of the total export value ofgoodsin2008couldbeattributedtoenterprisesinthebusinessregister,ascould84percent of imports. Using the same linked dataset for the 2007 trade figuresresulted in a match of 76 and 81percent of the total export and import valuesrespectively1).However,thesematchingalgorithmswerenotapplicabletoearlieryears. Therefore, determining which enterprises were involved in internationalgoods trade in2002–2006 was done based on CBS-source information and (old)VAT information. As such, two separate methods of matching trade flows toenterpriseswereimplemented,wherethefirst-mentionedmethodwassuperiortothe method implemented for 2002–2006. Combined, these efforts resulted in anenterprisedatasetfor2002–2008,inwhichallenterpriseswerecharacterisedastowhetherornottheywereanimporter,exporterortwo-waytraderi.e.involvedinbothimportsandexports.Theinformationontradersingoodsfor2002–2006wasusedinchaptersB3,B4andC1.
Thedecisionofanentrepreneurtostarttradinginternationallyisnottakenlightly.Strategicdecisionsinvolveacertaindegreeofriskandwillmostlikelybemadeatthetopofanorganisation.Inordertoavoidfocusingonjustasegmentofanentireorganisation, and to avoid mismatches due to the peculiarities in the differentsurveys of Statistics Netherlands (SN), the focus was not on whether a singleenterpriseisatraderornotbutontheenterprise groupintheNetherlands.Therefore,the classification of exporters and non-exporters was made at enterprise grouplevel.Forinstance,FigureB1.1showsthatenterprise‘X’ispartofenterprisegroup

Internationalisation Monitor 2010 75
’1’andreportsexportsofgoodstoSN.Logically,sinceenterprise ‘X’belongstoenterprisegroup’1’,thegroupasawholeisactiveinexporting,eventhoughtheactualgoodsmightbeproducedordeliveredby‘X’.Sinceenterprisegroup’1’asawholeengages in theexportofgoods,bothenterprise ‘X’andenterprise ‘Y’arepart ofanexporterofgoods,andwillbetreatedassuchintheanalysis.Thesamerationaleisappliedtoimportersofgoods.Whenanenterprisegroupwasinvolvedin importing and exporting, all enterprises belonging to this group werecharacterisedaspart ofatwo-waytradeingoods.Inmostinstanceshowever,theenterprisegroupistheequivalentoftheenterprise,implyingthatthereisonlyoneunitofactivity.
Enterprise group 1Exporter
Enterprise YPart of
exporter
Enterprise XPart of
exporter
Enterprise group 1
Enterprise YEnterprise XExporter
Figure B1.1: Identifying exporters
1.2.2 Services traders (2006–2008)
Internationaltradeinservicescoversallservicestransactionsbetweenacountry(i.e.itsresidents)andforeigncountriesorinternationalorganisations(i.e.thenon-residentsofthatcountry).Foralargepartoftheinternationaltradeinservices,SNusesthebusinesssurveytocollecttheinternationalservicesdata.Data,forinstance,on government services and travel are obtained by different data collectionmethods.Dataonenterprisesacquiredwiththeseothermethodsarenotavailablefortheanalysespresentedinthischapter.
The business survey is according to the size value of the international trade inservices,basedontwogroups:1. GroupA,containingenterpriseswithasignificantshareinthetotalsizevalue
oftheinternationaltradeinservices.Theseenterprises(n=350)areintegrallyobservedonenterprisegrouplevel.
2. GroupB, containingenterpriseswitha less significant share in the total sizevalue of the international trade in services. These enterprises are questioned

76 Statistics Netherlands
basedonasamplesurveyofapproximately5000companiesatenterpriselevel.The enterprises in the survey originated from a larger gross sample framecontaining approximately 90000enterprises of the general business register.Thisgrosssampleframeisreducedbyremovingenterpriseswhosesizevalueoftheinternationaltradeinservicesisexpectedtobelimited.Thisleavesanetsampleframeofnearly45000enterprisesofwhichthe5000enterprisesweresampled.
To identify the exporting services traders, the same system was used as for thetradersingoods:1. If anenterprisegroup ingroupAresponded to thebusiness surveywithan
exportvalue≠0,allenterprisesbelongingtothisenterprisegroupreceivedthecode‘partofexporterofservices‘(seealsoFigureB1.1).
2. TheenterprisesbelongingtotheremainingenterprisegroupsingroupAweredefinedas‘partofexporterofservicesunknown’.
3. Ifanenterprise ingroupBrespondedto thebusinesssurveywithanexportvalue≠0, the enterprise and all other enterprises belonging to the sameenterprisegroupweredefinedas‘partofexporterofservices’.
4. AllotherenterprisesingroupBthatwerenotdefinedearlier,includingallotherenterprisesbelonging to the sameenterprisegroup,weredefinedas ‘partofexporterofservicesunknown’.
5. Enterprisesinthegrosssampleframethatwerenotsampledandnotdefinedearlier,includingallotherenterprisesbelongingtothesameenterprisegroup,werealsodefinedas‘partofexporterunknown’.
6. All remaining enterprises in the general business register, which were notdefinedelsewhere,weregiventhecode‘nopartofexporterofservices’.
Thesameprocedurewasappliedfortheimportersofservices.Whenanenterprisegroupwasinvolvedinimportingandexporting,allenterprisesbelongingtothisgroupwerecharacterisedaspartofatwo-waytradeinservices.
1.2.3 Combining the datasets (2006–2008)
Combining the datasets of traders in goods and services for 2006 through 2008madeitpossibletoclassifyDutchenterprisesasanexporter(ofgoods,servicesorboth)and/oranimporter(ofgoods,servicesorboth).Itwasimpossibletodepictenterprises in the gross sample frame of the services dataset as an exporter orimporter.Theseenterpriseswerethereforeexcludedfromthesubsequentanalyses.Furthermore,enterpriseswithnoemployeeswerealsoleftoutoftheanalyses.Inthefinalcombineddataset,thenationalityoftheultimatecontrollinginstitutionalunit (UCI) for each enterprise was determined. The UCI is defined as theinstitutional unit, proceeding up an enterprise’s chain of control, which is notcontrolledbyanotherinstitutionalunit.‘Foreigncontrolled’meansthattheresident

Internationalisation Monitor 2010 77
country of the UCI is a country other than the Netherlands. Enterprises weremarked as Dutch controlled if it was not known whether they were foreigncontrolledornot.
1.3 Population characteristics
1.3.1 Population count
TableB1.1showsthecompositionofthedatasetin2008,intermsoftheshareoffirms engaged in imports, exports, or both, for either goods or services. Mostenterprises in2008 (84.2percent) did not engage in international trade. Almost5percentofDutchenterpriseswere(partof)enterprisesthatonlyimportedgoods.Enterprises that exported and imported goods, but for which it was uncertainwhethertheyalsotradedinservices,comprised3.1percentofallenterprises.Two-waytraders inbothgoodsandservicesrepresentedonly0.3percentof the2008dataset.
Table B1.1 Dataset and trade indication, 2008* 1)
7 8 9 10 11 12
Goods importer Yes Yes Yes No No No Services importer Yes No ? Yes No ?
Goods exporter Services exporter
1 Yes Yes 0.3 0.1 – 0.0 0.0 –2 Yes No 0.1 1.9 – 0.0 1.1 –3 Yes ? – – 3.1 – – 0.44 No Yes 0.0 0.0 – 0.0 0.0 –5 No No 0.0 4.9 – 0.0 84.2 –6 No ? – – 0.9 – – 2.9
1) n=1,175,181.Dashesindicatecombinationsthatdidnotoccurinthe2008dataset.
Thefocusintheremainderofthisarticleisonthoseenterprisesforwhichitwaspossible to determine whether they traded in goods and/or services or not.Assuch,theenterprisesinrows3and6,andcolumns9and12werenotincludedinthefollowingtables(7.3percentofthedataset).
1.3.2 Differences in terms of size class
TableB1.2showsthedistributionofexportingenterprisesintermsofsize,definedasSMEandLargeenterprises.A smallormedium-sizedenterprise (SME) is an

78 Statistics Netherlands
enterprisethatemploysfewerthan250people.Alargeenterpriseisanenterprisewith250ormoreemployees.
The exporting firms in the investigated population were classified in foursubgroups:firmsthatexportedgoodsandservices,firmsthatonlyexportedgoods,firms that only exported services, and firms that did not export. The group ofexporters contained relatively more large enterprises than non-exporters.Furthermore,exportersofonlyservicesinvolvedmorelargeenterprises(6.8percentin2008) than exporters of only goods which consisted for 0.6percent of largeenterprises. Firms that exported goods and services included, at 14.6percent in2008,evenmorelargeenterprises.Duringtheperiod2006–2008,aslightdecreasewas seen in the relative distribution of large enterprises in all three exportingsubgroups which means that the small and medium-sized enterprises becamemoreimportantintheirshareoftheexportpopulation.
Table B1.2 Exporting enterprise population by size class
Exporter(goods Exporter(goods Exporter(services Noexports andservices) only) only)
2006* 2007* 2008* 2006* 2007* 2008* 2006* 2007* 2008* 2006* 2007* 2008*
%
SME 83.7 85.7 85.4 98.8 99.3 99.4 90.4 90.8 93.2 99.7 99.9 99.9Largeenterprise 16.3 14.3 14.6 1.2 0.7 0.6 9.6 9.2 6.8 0.3 0.1 0.1
Total 100 100 100 100 100 100 100 100 100 100 100 100
The results for importing firms are presented in TableB1.3. The outcomes forimporting enterprises were in concordance with the exporting results. In2008,only0.1percentofthenon-importingenterpriseswerelargeenterprises,whereas0.3–15.6percentof the importingfirms,dependingon the subgroup,were largeenterprises.Inaddition,firmsthatonlyimportedgoodscontainedmoresmallandmedium-sized enterprises compared with the enterprises that only importedservices. In2008, 99.7percent of firms that only imported goods were small ormedium-sized enterprises in contrast to 92.1percent of the firms that importedservices.Justliketheexportingfirms,the‘firmsthatimportedgoodsandservices’subgroupwasthegroupwiththehighestpercentageoflargeenterprises.Fortheimportingenterprises,aslightreductionwasalsoseenintherelativedistributionoflargeenterprisesinallthreesubgroups.

Internationalisation Monitor 2010 79
Table B1.3 Importing enterprise population by size class
Importer(goods Importer(goods Importer(services Noimports andservices) only) only)
2006* 2007* 2008* 2006* 2007* 2008* 2006* 2007* 2008* 2006* 2007* 2008*
%
SME 83.0 84.4 84.4 99.1 99.6 99.7 89.8 89.6 92.1 99.7 99.9 99.9Largeenterprise 17.0 15.6 15.6 0.9 0.4 0.3 10.2 10.4 7.9 0.3 0.1 0.1
Total 100 100 100 100 100 100 100 100 100 100 100 100
1.3.3 Differences in terms of economic activity
TablesB1.4andB1.5showtheeconomicactivitiesofthevarioustypesoftradersin2006and2008.Almost30percentofexportersofgoodsandserviceswereactiveinrealestate,rentingandbusinessactivitiesin2008.About20percentwereactivein manufacturing and almost 19percent could be classified as wholesalers andretailers.Thesepercentagesdidnotvarymuchbetween2006and2008.
In2008, approximately 44percent of exporters (goods only) were wholesale orretailenterprises.Table4inchapterC1(inthisInternationalisationMonitor2010)showsthatofallwholesaleenterprisesin2008,some47percentreportedexportsofgoods(ofretailersandrepairenterprisesalmost9percentexported).Sonotonlywere most goods exporters wholesalers or retailers, a large portion of theseenterpriseswerealsoactiveinexporting.
Exporters of services were mostly active in real estate, renting and businessactivities.In2008,almost40percentofservicesexporterswereactiveinthissectorIntermsofthetotalnumberofenterprisesactiveinthissector,theyformonlyasmallportion,namely2percent(seeTable4,chapterC2).
Non-exportingenterpriseswereabundantlyactiveintherealestate,rentingandbusinessactivitiessectors.Non-exporterswererelativelywellrepresentedinthepublic sectorand in thehotelsandrestaurants sector, comparedwithexportingenterprisesinbothyears.

80 Statistics Netherlands
Table B1.4 Exporting enterprises by economic activity
Exporter Exporter Exporter Noexports (goods (goods (services andservices) only) only)
2006* 2008* 2006* 2008* 2006* 2008* 2006* 2008*
%Economic activity (NACE Rev.1.1)
Agriculture,hunting,forestry,fishing,miningandquarrying 1.2 1.5 5.5 7.6 0.7 1.0 7.4 6.5Manufacturing 21.0 19.0 15.7 15.0 2.3 1.4 4.3 3.9Electricity,gas,watersupplyandconstruction 5.8 7.4 4.2 3.9 2.7 2.7 10.4 11.6Wholesaleandretailtrade,repair 18.7 18.9 45.3 44.0 6.1 6.1 18.3 16.4Hotelsandrestaurants 0.5 0.4 0.6 0.4 0.1 0.2 5.2 4.6Transport,storageandcommunication 14.2 14.6 2.7 2.4 24.4 27.1 3.1 2.9Financialintermediation 6.1 4.1 3.2 3.7 10.7 15.2 7.6 8.2Realestate,rentingandbusinessactivities 29.8 29.7 18.4 18.4 44.3 39.2 25.1 27.1Publicadministration,education,health,socialworkandotherservices 2.8 4.4 4.6 4.6 8.7 7.1 18.5 18.7
Total 100 100 100 100 100 100 100 100
The distribution of importing enterprises across industries did not differ muchfromthatofexporters.In2008,almost27percentofimportersofgoodsandserviceswereactiveinrealestate,rentingandbusinessactivities.Approximately21percentofimportersofgoodsandservicesweremanufacturingenterprises,andasimilarpercentagewereactiveinwholesale,retailtradeandrepairs.
Morethanhalfofallgoodsimporterswerewholesaleandretailenterprises,whilethe share of importing manufacturers remained relatively modest in2006 and2008. Even though ‘only’ 10percent of goods importers were characterised asmanufacturers,Table4 inchapterC1showsthat in2008almost40percentofallmanufacturingenterprisesreportedimports.
Servicesimportersweremainlyfoundinthefollowingsectors:realestate,rentingand business activities, and in transport, storage and communication. Almost28percentofservicesimporterswereactiveintransport,storageandcommunicationin2008,eventhough‘only’6percentofallenterprisesactiveinthissectorreportedservices imports (see Table4 in chapter C2). Compared with 2006, importers ofserviceswerelessactiveinmanufacturingindustries,energyandconstruction.

Internationalisation Monitor 2010 81
Table B1.5 Importing enterprises by economic activity
Importer Importer Importer Noimports (goods (goods (services andservices) only) only)
2006* 2008* 2006* 2008* 2006* 2008* 2006* 2008*
%Economic activity (NACE Rev.1.1)
Agriculture,hunting,forestry,fishing,miningandquarrying 1.5 1.7 2.7 4.8 0.5 1.1 7.7 6.6Manufacturing 21.2 20.4 10.3 10.2 3.1 1.1 4.3 3.8Electricity,gas,watersupplyand,construction 5.0 5.9 6.3 6.6 4.0 2.4 10.5 11.7Wholesaleandretailtrade,repair 19.7 20.9 53.7 52.2 4.2 4.1 16.8 14.5Hotelsandrestaurants 0.3 0.3 2.9 2.6 0.1 0.4 5.2 4.6Transport,storageandcommunication 12.4 13.0 1.5 1.4 27.5 27.8 3.2 3.0Financialintermediation 6.8 5.0 2.5 3.0 13.2 19.3 7.8 8.5Realestate,rentingandbusinessactivities 28.2 26.6 13.0 12.6 39.0 35.2 25.7 28.0Publicadministration,education,health,socialworkandotherservices 4.9 6.2 7.2 6.6 8.5 8.6 18.9 19.2
Total 100 100 100 100 100 100 100 100
1.3.4 Foreign controlled traders versus Dutch controlled traders
TablesB1.6andB1.7givean insight into theownershipstructureof thevarioustypesoftradingenterprises. It turnsoutthatenterprisesthat importandexportbothservicesandgoodsweremostlikelytobeforeigncontrolled.Almost30percentofallexportersofgoodsandserviceswereultimatelycontrolledbyaforeignentity,comparedwithathirdofimporters.Thissharehadonlyslightlyincreasedsince2006.MayerandOttaviano(2007)foundthatexportersinBelgium,theUK,Italyand Hungary were also more likely to be foreign owned than non-exporters,although no distinction was made between exporters of goods or services. Inaddition, Breinlich and Criscuolo (2008) found that services traders were morelikelytobeforeignownedcomparedwithnon-traders.TheDutchdataconfirmedthispicture.
Enterprisesthatexportedandimportedonlygoodswereleastlikelytobeforeignowned. The share of foreign controlled traders increased for exporters andimportersofservicescomparedwith2006.Enterprisesthatonlytradedingoodsaswellasnon-traderswere,inmostcases,Dutchowned.

82 Statistics Netherlands
Table B1.6 Foreign controlled versus Dutch controlled exporters
Exporter(goods Exporter(goods Exporter(services Noexports andservices) only) only)
2006* 2008* 2006* 2008* 2006* 2008* 2006* 2008*
%
Dutchcontrolled 71.7 70.5 97.9 98.2 83.0 79.7 99.9 99.9Foreigncontrolled 28.3 29.5 2.1 1.8 17.0 20.3 0.1 0.1
Total 100 100 100 100 100 100 100 100
Table B1.7 Foreign controlled versus Dutch controlled importers
Importer(goods Importergoods Importer(services Noimports andservices) ditiesonly) only)
2006* 2008* 2006* 2008* 2006* 2008* 2006* 2008*
%
Dutchcontrolled 67.9 66.4 99.3 99.2 88.6 85.0 99.9 99.9Foreigncontrolled 32.1 33.6 0.7 0.8 11.4 15.0 0.1 0.1
Total 100 100 100 100 100 100 100 100
1.4 Conclusion
Manystudiesoninternationaltradefocusonindustriesorenterprisesthattradeingoods and highlight their strengths and importance for economic growth,comparedwithnon-traders.Clearly,excludingfirmsthattradeinservicesmeansthatasignificantandinterestingportionofcross-border transactions isomitted.Therefore, this chapter attempted to provide an insight into all enterprises thatwereengagedintrade,usingseveraldescriptivetableswhichshowedstructuraland organisational differences and similarities between the various types oftraders.
Traders ingoodsandserviceswere larger thanenterprises that traded ineithergoods or services. Interestingly, in the period2006–2008, the share of large

Internationalisation Monitor 2010 83
enterprisesdecreasedinfavourofSMEs.Exportersandimportersofservicesweresomewhatlargerthantradersingoods,butstillrelativelysmallerthanenterprisesthatengagedinbothtypesoftrade.
Most traders in goods and services were involved in real estate, renting andbusinessactivities,manufacturingandwholesale,retailandrepairssectors.Almost70percentofimportersaswellasexportersofgoodsandserviceswereactiveintheseindustriesin2008.Tradersingoodswereoftenfoundinwholesaleandretailtrade, while traders in services were mostly active in real estate, renting andbusinessactivities.
Foreigncontrolwasmainlyacharacteristicofthelargesttradersthatimportedandexportedbothgoodsandservices.In2008,almost30percentofexportersofgoodsandserviceswereforeignowned,comparedwithnearly34percentofimportersofgoodsandservices.Tradersingoodsweretheleastlikelytobeforeigncontrolled.Thenon-exportersandnon-importersweremorelikelytobedomesticallyownedcomparedwith2006.
Thischapterfocusedondifferencesinfirmcharacteristicsofinternationaltradeingoodsandservicesenterprises.Thefollowingchapterpresentsbroaderresearchwithemphasisonthedifferencesbetweeninternationaltradersinservicesand/orgoods and their non-exporting or non-importing counterparts in terms ofperformance(measuredasturnoverandlabourproductivity).
References
Bernard,A., Jensen, J., Redding, S. and Schott, P. (2007). ‘Firms in internationaltrade’.Journal of Economic Perspectives,21(3):105–130.
Breinlich,H.andCriscuolo,C.(2008).‘ServicetradersintheUK’.CEPDiscussionPaperNo.901,CentreforEconomicPerformance,LSE,London.
CBS(2009).Internationalisation Monitor 2009.StatisticsNetherlands.
Doh,J.andPearce,J.II.(2003).‘Revisingourunderstandingandexpectationsofthe international trade in services’. Journal of Transnational Management Development,9(1):59–78.
Lennon, C. (2008). ‘Trade in services and trade in goods: Differences andcomplementarities’.WorkingPaperNo.52,ParisSchoolofEconomics,Paris.

84 Statistics Netherlands
Mayer, T. and Ottaviano, G. (2007). ‘The happy few: the internationalisation ofEuropeanfirms.Newfactsbasedonfirm-levelevidence’.BruegelBlueprintSeries,Volume3,Brussels.
Melitz,M.(2003).‘Theimpactoftradeonintra-industryreallocationsandaggregateindustryproductivity’.Econometrica71(6):1695–1725.
Muûls, M. and Pisu, M. (2007). ‘Imports and exports at the level of the firm:EvidenceforBelgium’.WorkingPaperResearchNo.114,NationalBankofBelgium,Brussels.
Smeets,R.,Creusen,H.,Lejour,A.andKox,H.(2010).‘Exportmarginsandexportbarriers. Uncovering market entry costs of exporters in the Netherlands’. CPBDiscussionPaperNo.208,TheHague.
WagnerJ. (2005). ‘Exportsandproductivity:Asurveyof theevidencefromfirmlevel data’. Working Paper Series in Economics No.4, University of Lüneburg,Lüneburg.
Notes in the text:1) SeeintroductiontoC1forthereasonswhyacertaininternationaltradeflowcannotbematchedtoan
enterprise.

Internationalisation Monitor 2010 85
B2 A closer look at Dutch goods and services tradersMarjolijn Jaarsma and Chantal Lemmens-Dirix
2.1 Introduction
Enterprisesengagedininternationaltradeactivitiesaredifferentfromenterprisesthatoperateonlyonthedomesticmarket.Thiscanbeconcludedfromawiderangeof studies that have shown that exporters are larger, pay higher wages and aremore productive than non-exporters (Bernard and Jensen, 1999; Bernard et al.,2007; Mayer and Ottaviano, 2007; Wagner, 2005). Yet most of these studiesconcentratedonexportersofgoods.Thispaperaimstocontributetothecurrentliteraturebyexploringwhethersimilarresultscanalsobeestablishedforimportersandtradersinservices.
ChapterB1describesthemainsimilaritiesanddifferencesbetweenthesetypesofinternationaltradersintermsofeconomicactivity,enterprisesize,andownership,based on three newly prepared datasets. A main conclusion was that Dutchexportersandimporterswerelargerintermsofnumberofemployeesandweremore likely to be part of a foreign controlled organisation compared with non-exportersandnon-importersrespectively.
Theemphasisinthischapterisonthedifferencesbetweeninternationaltradersinservicesand/orgoodsandtheirnon-exportingornon-importingcounterpartsintermsofturnoverandlabourproductivity.Wealsoanalysedwhetherthereweredifferences in the labour productivity and turnover of domestic versus foreigncontrolledtraders.Finally,severalregressionanalyseswereconductedtoexplorewhether the likelihood of exporting or importing is associated with the labourproductivityofacompany,whencontrollingforenterprisesize,economicactivityandforeignownership.
Thischapterisorganisedasfollows.First,webrieflydiscusssomeoftherelevantliteratureonfirmheterogeneity inexports.Subsequently,section3describes thedatasetsandestimationmethodology.Theresultsarepresentedinsection4,whilethemainconclusionsarereportedinsection5.

86 Statistics Netherlands
2.2 Theory and background
There is overwhelming, empirical evidence in the existing academic literaturethatexportersaredifferentfromnon-exporters.Exportersaregenerallyfoundtobemoreproductivethannon-exportersevenwhencontrolledfortime,industry,locationorsize(BernardandJensen,1999;Wagner,2005;Smeetsetal.,2010).Thedifferencesbetweenexportersandnon-exportersaregenerallyexplainedbytheself-selection hypothesis which presumes that the most productive firms selfselectintoexportmarketssincetheyarecapableofovercomingthecostsinvolvedin exporting. Exporting, and also importing to a certain degree, requiresadditionaleffortandinvestmentinordertosetupadistributionchannelortoshipgoodsabroad.Assuch, therearefixedandvariablecostsassociatedwithinternationalisation, which only firms that exceed a certain threshold value ofproductivityareable toovercome(Melitz,2003;Smeetsetal.,2010).Themostcommonapproachtotestthistheoryistolookatdifferencesinaveragelevelsofproductivityanddifferencesinproductivitygrowthrates(Wagner,2005).
Thelearning-by-doinghypothesisextendsthisargumentbyalsoaccountingforthe(productivity)consequencesofexporting,namelywhetherexportinginitselfhasapositiveeffectonproductivitygrowth(BernardandJensen,1999;Schanketal.,2008).Thegeneralideaisthatexporterslearnfromdifferentenvironmentsandtheirforeigncompetitorsandtherebyincreasetheirproductivity.However,thereis little evidence for this hypothesis. One explanation for this might be thatlearning-by-doing studies mainly focus on developed countries. Enterprises inpoor countries may have much more to learn from trading and their tradingpartners than firms in more developed countries (Blalock and Gertler, 2004).Another explanation might be that exporters are not a homogeneous group ofenterprises, implying that learning-by-doing effects may only occur for certainfirmsandnotforall.Thisissupportedbyempiricalstudiesthatdemonstratethatproductivity and performance vary widely within the group of exportingenterprises.Furthermore, importsandexportsappeartobeconcentratedinthelargest (employment and value added) and most productive firms (Muûls andPisu,2007).
2.3 Methodology and composition of datasets
ThelinkeddatasetspresentedinchapterB1alsoformthebackboneoftheresearchdescribed in this chapter. Unfortunately, these datasets are not yet suitable forlongitudinalstudiesonself-selectionorlearning-by-doingtheories.Thereforetheanalyses were restricted to determining the differences in productivity andturnoverbetweenthreetypesofexportersandnon-exporters.Thesameanalyseswereconductedforimportersandnon-importers.Whetherornotanenterpriseis

Internationalisation Monitor 2010 87
foreigncontrolledorDutchcontrolledmightalsoinfluenceitsproductivity;hencethisvariablewasexplicitlyincludedintheanalysis.Furthermore,theassociationbetweenlabourproductivityandtheprobabilityofbeinganexporterorimporterwasexamined.
Inordertoinvestigatetheseresearchquestionsthedatafilesneededtobeextended.Therefore,severalvariablesfromtheStructuralBusinessStatistics(SBS)for2006–2008werelinkedtothefinaldatasetsatthemicrolevel,usingtheuniqueenterpriseidentifieraskeyvariable.Thevariablesincludedwereturnoverandvalueadded.Labourproductivitywasconstructedbydividingthevalueaddedbythenumberofemployees(fte).Informationontheultimatecontrollinginstitutionalunit(UCI)was used to determine whether an enterprise was foreign or Dutch controlled.Since the SBS are survey statistics, all enterprises in the SBS received a weightfactortoestimatethepopulationvalues.Onlyenterpriseswithaweightfactor>0wereincludedinthefinaldatasets.Furthermore,outliers(1%oftheupperlimit)fromtheSBSvariableswereremovedandthenormalityoftheirdistributionswaschecked using histograms. Since these variables were not normally distributed,transformation was applied by natural log to optimise the data distributiontowardsnormal.
F-tests (ANOVA) were conducted to investigate whether there were statisticaldifferencesbetweentheaveragelabourproductivityandturnoveracrossvarioustypesofexportersandnon-exporters.Independentt-testswereusedtostudythedifferencesbetweenDutchandforeigncontrolledexporters.Bothmethodswerealsousedforthevarioustypesofimportersandnon-importers.Poolingthethreeobservedyearsinonelargefileresultedinadatasetofaround130000observations.Logisticregressionanalyseswereperformedonthepooleddatasettotestwhethertherewasapositiveassociationbetweenlabourproductivityandthelikelihoodofexporting or importing, taking into account firm-specific characteristics such assize,economicactivityandownership.Yeardummieswereincludedtocorrectfortimeeffects.Finally,differencesintheeffectsofownership,sizeandindustryonthe likelihood of exporting were illustrated graphically. To create these graphsregression models were used with the binary variable ‘exporter’ as dependentvariable and labour productivity as the independent variable. The variables‘ownership’,‘sizeclass’and‘industry’wereincludedseparatelytoquantifytheirmarginaleffectontheprobabilityofbeinganexporterforvariouslevelsoflabourproductivity.

88 Statistics Netherlands
2.4 Results
2.4.1 Contribution of specific traders to Dutch turnover and value added
Thefollowingtwotablesaredescriptivetablesthatshowtheeconomiccontributionof each typeof trader, aswell asnon-traders, to theDutcheconomy. Since it isunknownforasub-setofthesamplewhetherornotthey(also)exportservices(asexplainedinchapterB1),aseparatecategoryfortheseenterpriseswascreated.Thesamesubdivisionwasmadeforimportersin2006–2008.
TableB2.1 shows that in the observed period, roughly 27percent of the totalamountofDutchturnoverandvalueaddedwasgeneratedbyexportersofbothgoodsandservices.Approximately35percentofDutchturnoverandaquarterofvalueaddedwereproducedbyenterprisesthatexportedgoods,butforwhichitwas uncertain whether they also exported services. Exporters of only goodsgenerated an increasing share in total turnover and value added, while thecontributionofonlyservicesexportersremainedrelativelyconstantbetween2006and2008.Interestingly,non-exportersproducedafairlylargeshareofvalueadded,comparedwiththeirshareofturnover.
Table B2.1 Distribution of Dutch turnover and value added over exporters versus non-exporters
Turnover Valueadded
2006* 2007* 2008* 2006* 2007* 2008*
%
Exporters(goodsandservices) 27 27 27 27 27 27Exporters(goods,maybeservices) 35 35 36 25 25 26Exporters(goodsonly) 7 7 11 7 6 10Exporters(servicesonly) 4 4 3 4 4 3Nogoodsexports,maybeservices 9 12 9 12 14 10Non-exporters 18 16 14 26 24 24
Total 100 100 100 100 100 100
In TableB2.2, total Dutch turnover and value added were distributed over thevarioustypesof importersandnon-importingenterprises.Thebulkof turnoverand value added, 73 and 63percent respectively in2008, was generated byenterprises that imported goods and perhaps services. Enterprises that onlyimportedservicesrepresentedabout1percentofDutchturnoverandvalueadded,

Internationalisation Monitor 2010 89
which was slightly less than exporters of services. Importers of only goodsincreasedtheirshareintotalturnoverandvalueaddedbetween2006and2008.Non-importers had a larger share in total value added than in turnover in theobserved period, even if enterprises for which it was uncertain whether theyimportedservices(butnogoods)wereincluded.
Table B2.2 Distribution of Dutch turnover and value added over importers versus non-importers
Turnover Valueadded
2006* 2007* 2008* 2006* 2007* 2008*
%
Importers(goodsandservices) 32 31 34 31 31 34Importers(goods,maybeservices) 37 39 39 29 29 29Importers(goodsonly) 6 7 9 7 7 8Importers(servicesonly) 1 1 1 2 2 1Nogoodsimports,maybeservices 6 8 5 8 10 7Non-importers 17 14 12 23 21 21
Total 100 100 100 100 100 100
2.4.2 Differences in turnover and labour productivity
i. Exporters and importers versus non-exporters and non-importers
TableB2.3showstheaveragelabourproductivityandturnovervalueofvarioustypes of exporters and non-exporters in2008. The results for the importers andnon-importersarepresented inTableB2.4. Every typeof exporter and importerappearedtobelargerintermsofturnoverandmoreproductivethannon-exportersandnon-importersrespectively.This is inconcordancewithstudiesobservedintheliterature,whichshowedthatgoodstraderswerelargerintermsofturnoverandweremoreproductivethannon-traders(BernardandJensen,1999;MayerandOttaviano,2007).Furthermore,otherstudiesfoundthatfirmsengagedintradeinservicesalsohadahigherturnoverandweremoreproductivethannon-traders(Hijzenetal.,2006;BreinlichandCriscuolo,2008;Vogel,2009).Theresultsshowedthat,ingeneral,enterprisesinvolvedinbothgoodsandserviceshadthehighestaveragelabourproductivityandturnover,followedbyfirmsthatonlytradedinservices. Enterprises that only traded in goods had the lowest average labourproductivityandturnover.

90 Statistics Netherlands
Table B2.3 Average labour productivity and turnover of exporters versus non-exporters, 2008*
Exporters T-test(comparedwith F-value(ANOVA) non-exporters)
1,000 euro
Labour productivity
Exporters(goodsandservices) 89.1 41.1*** 3,369***Exporters(goodsonly) 58.0 33.5***Exporters(servicesonly) 96.5 26.8***Non-exporters 49.8
Turnover
Exporters(goodsandservices) 32,951 147.6*** 34,600***Exporters(goodsonly) 2,988 122.3***Exporters(servicesonly) 14,340 71.8***Non-exporters 452
***p<0.01;**p<0.05;*p<0.10
Table B2.4 Average labour productivity and turnover of importers versus non-importers, 2008*
Importers T-test(comparedwith F-value(ANOVA) non-exporters)
1,000 euro
Labour productivity
Exporters(goodsandservices) 94.8 46.3*** 3,181***Exporters(goodsonly) 50.3 13.2***Exporters(servicesonly) 84.5 16.5***Non-exporters 50.2
Turnover
Exporters(goodsandservices) 37,000 167.6*** 37,739***Exporters(goodsonly) 1,800 150.1***Exporters(servicesonly) 16,308 53.5***Non-exporters 411
***p<0.01;**p<0.05;*p<0.10
ii. Foreign controlled enterprises versus Dutch controlled enterprises
TablesB2.5andB2.6presenttheroleofownershiponaveragelabourproductivityandturnoverofexportersandimportersin2008.TableB2.5showsthat,ingeneral,foreigncontrolledexportersweresignificantlymoreproductiveandhadahigher

Internationalisation Monitor 2010 91
average turnover value than Dutch controlled exporters. Differences betweenforeigncontrolledandDutchcontrolledexportersweremostpronouncedwhenthe enterprise only exported goods. The average turnover of foreign controlledexportersofbothgoodsandserviceswasalmosttwiceashigh;andtheirlabourproductivity was, on average, ten thousand euros higher than that of Dutchcontrolledfirms.
Table B2.5 Average labour productivity and turnover of foreign controlled versus Dutch controlled exporters, 2008*
Dutchcontrolled Foreigncontrolled Independentt-test
1,000 euro
Labour productivity
Exporters(goodsandservices) 86.7 95.0 6.0***Exporters(goodsonly) 56.2 115.9 22.7***Exporters(servicesonly) 97.8 91.2 –1.6
Turnover
Exporters(goodsandservices) 27,769 46,518 12.8***Exporters(goodsonly) 2,239 30,229 43.0***Exporters(servicesonly) 11,151 27,637 6.4***
***p<0.01;**p<0.05;*p<0.10
TableB2.6showswhetherthereweresignificantdifferencesinlabourproductivityandturnoverbetweenthevarioustypesofforeigncontrolledandDutchcontrolledimporters. As was seen with respect to exporters, foreign controlled importerswere also larger in terms of turnover and more productive than Dutch ownedimporters. For services traders, no significant results were found for labourproductivity.
Foreigncontrolledenterprisesthatimportedonlygoodshadafarhigheraveragelevel of labour productivity in2008 than Dutch importers of only goods. Thismightbeexplainedby the fact that therewereonlyvery fewforeigncontrolledimporters of only goods, which may have very specific trading activities in theNetherlands (e.g. distribution). Their average turnover was also substantiallyhigherthanthatofDutchcontrolledimportersofonlygoods.Dutchcontrolledservicesimportersweresomewhatmoreproductivethanforeigncontrolled importers, although not significantly so. Their average turnover wasonly half that of foreign controlled importers, indicating that Dutch controlledimportersofserviceswere,ingeneral,smallerenterprises.

92 Statistics Netherlands
Table B2.6 Average labour productivity and turnover of foreign controlled versus Dutch controlled importers, 2008*
Dutchcontrolled Foreigncontrolled Independentt-test
1,000 euro
Labour productivity
Importers(goodsandservices) 94.2 95.9 4.2***Importers(goodsonly) 49.4 106.9 23.2***Importers(servicesonly) 85.3 79.6 –0.9
Turnover
Importers(goodsandservices) 31,733 47,445 11.7***Importers(goodsonly) 1,583 16,780 35.9***Importers(servicesonly) 14,589 27,159 2.6**
***p<0.01;**p<0.05;*p<0.10
2.4.3 The probability of exporting and importing
TheresultsofthelogisticregressionanalysesarepresentedinTablesB2.7andB2.8.All models in TableB2.7 represented a multivariate regression model with thebinary export variable as the dependent variable, and labour productivity (ln),foreigncontrol,industry,sizeclassandyearasindependents.Asignificantpositiveassociationwasfoundbetweenlabourproductivityandthelikelihoodofexporting.Additionally,foreignownershipwasalsopositivelyassociatedwiththechanceofbeinganexporter.Models2–6alsoincludedavarietyofinteractioneffectsbetweenlabour productivity and foreign control, industry and size class respectively.Model5 included all interaction terms simultaneously. But since the interactiontermsizeclass*lnlabourproductivitywasnotsignificant,thistermwasexcludedfrommodel6.Thislastmodelshowedthatiflnlabourproductivitywasincreasedby one unit the likelihood of being an exporter was nearly twice as high. Forinstance, if an enterprise was able to increase its labour productivity from e.g.33thousandeuros to89thousandeuros1), the regressionmodelpredicts that itschanceofbeinganexporteralmostdouble.However,theresultsfortheinteractioneffectsindicatethatthiseffectdiffersacrossfirmsfromdifferentindustries,andbyforeign ownership. These regression results are in line with existing research(BernardandJensen,2001;BernardandWagner,1998).

Internationalisation Monitor 2010 93
Table B 2. 7 Probability of exporting, pooled dataset 2006*–2008*
1 2 3 4 5 6
Constant –6.30*** –6.33*** –6.08*** –6.33*** –6.10*** –6.12*** (0.00) (0.00) (0.00) (0.00) (0.00) (0.00)Lnlabourproductivity 0.69*** 0.70*** 0.63*** 0.70*** 0.64*** 0.64*** (2.00) (2.01) (1.88) (2.01) (1.90) (1.90)Foreigncontrolled 3.18*** 6.20*** 3.20*** 3.18*** 6.17*** 6.16*** (24.05) (491.53) (24.43) (24.03) (477.75) (475.15)Industryfixedeffects *** *** *** *** *** ***Sizeclassfixedeffects *** *** *** *** *** ***Timefixedeffects *** *** *** *** *** ***
Interactioneffectsforeigncontrolled*lnlabourproductivity n.i. *** n.i. n.i. *** ***industry*labourproductivity n.i. n.i. *** n.i. *** ***sizeclass*lnlabourproductivity n.i. n.i. n.i. *** n.s. n.i.
n 129,310 129,310 129,310 129,310 129,310 129,310Chi-square 189,347 189,567 196,392 189,385 196,608 196,605R²(Nagelkerke) 0.329 0.330 0.340 0.329 0.341 0.341
n.i.=notincluded;n.s.=notsignificant;***p<0.01;**p<0.05;*p<0.10
TableB2.8 displays the results for the likelihood of being an importer. The firstmultivariateregressionmodelshowedasignificantpositiveassociationbetweenlabour productivity and the probability of being an importer. Increasing the lnlabourproductivitybyoneunitraisedthechanceofbeinganimporterbynearly68percent.Inthefollowingmodelstheinteractiontermswereintroducedwhichledtothedefinitemodelinwhichalltermswereincluded.Allvariablesincludedinthefinalregressionmodelwerestatisticallysignificantandpositivelyassociatedwiththelikelihoodofbeinganimporter.However,theeffectoflabourproductivityon the likelihood of importing again depends on ownership, industry and sizeclass.

94 Statistics Netherlands
Table B2.8 Probability of importing, pooled dataset 2006*–2008*
1 2 3 4 5
Constant –4.94*** –4.95*** –4.89*** –4.95*** –4.88*** (0.01) (0.01) (0.01) (0.01) (0.01)Lnlabourproductivity 0.52*** 0.52*** 0.50*** 0.52*** 0.50*** (1.68) (1.68) (1.66) (1.68) (1.65)Foreigncontrolled 3.65*** 5.94*** 3.68*** 3.65*** 5.56*** (38.4) (379.73) (39.68) (38.38) (260.11)Industryfixedeffects *** *** *** *** ***Sizeclassfixedeffects *** *** *** *** ***Timefixedeffects *** *** *** *** ***
Interactioneffectsforeigncontrolled*lnlabourproductivity n.i. *** n.i. n.i. ***industry*labourproductivity n.i. n.i. *** n.i. ***sizeclass*lnlabourproductivity n.i. n.i. n.i. n.s. ***
n 133,063 133,063 133,063 133,063 133,063Chi-square 216,497 216,591 221,070 216,498 221,154R²(Nagelkerke) 0.328 0.328 0.334 0.328 0.334
n.i.=notincluded;n.s.=notsignificant;***p<0.01;**p<0.05;*p<0.10
2.4.4 The probability of being an exporter expounded for several factors
Exactly how the effect of labour productivity on the probability of exporting(importing)differsacrossfirmownership(foreignversusdomestic),industryandsize-classcanbestbeobservedfromtheseriesofgraphspresentedhere.TheeffectofDutchorforeignownershiponthelikelihoodofbeinganexporterforawiderangeoflabourproductivityisplottedinGraphB2.1.Theeffectsofsizeclassandindustryon theprobabilityofexportingaredisplayed inGraphsB2.2andB2.3.Sincetheanalysisoftheimpactofownership,sizeandindustryonthelikelihoodof importing yielded quite similar results as for exporters, only the results forexportersareshownhere.
GraphB2.1showsthatforeignownedenterprisesalreadyhaveahigherprobabilityof exporting (50percent) than Dutch enterprises (2percent). When labourproductivity increased up to e.g. the average value for enterprises that exportgoods and services (89130euros, see TableB2.3), the odds of being an exporterrose rapidly for foreign enterprises, to approximately 90percent, and thenremained relatively stable. For Dutch enterprises, the probability of being anexporterremainedmuch lower,andeven if labourproductivity increasedupto150000eurosthechanceofbeinganexporterremainedaround20percent.Thus,at each level of labour productivity, foreign controlled enterprises had a muchhigherchanceofbeinganexporterthanDutchcontrolledfirms.

Internationalisation Monitor 2010 95
B2.1 The probability of exporting controlled for origin of the parent company, pooled dataset 2006*–2008*
NB The straight line represents average labour productivity of exporters of goods and services in 2008 (Table B2.3).
0
0.2
0.4
0.6
0.8
1.0
0 25 50 75 100 125 150 175 200
probability of being an exporter
labour productivity (1,000 euro)Dutch controlled enterprises Foreign controlled enterprises
GraphB2.2displaysthelikelihoodofbeinganexporteratvariouslevelsoflabourproductivityforsmall,medium-sizedandlargeenterprises.Small-sizedenterpriseshadarelativelylowprobabilityofbeinganexporter,evenathigherlevelsoflabourproductivity. On the other hand, even when labour productivity was very low,largefirmsalreadyhada46percentchanceofbeinganexporter.Therefore,sizeisa sign of past success and may also be associated with lower marginal costs,providingtwoseparatemechanismsforsizetoincreasethelikelihoodofexporting(BernardandWagner,1998).Whenlabourproductivityincreaseduptotheaveragelevelofproductivityforfirmsthattradeingoodsandservices(89130euros,seeTable3), this percentage even grew to 90percent. Medium-sized enterprisesshowedadevelopmentsimilar to thatof largeenterprises,althoughona lowerlevel. This indicates that exporting is mainly undertaken by medium-sized andlargeenterprises,andthatsmallenterprisesareinthisrespectarelativelyseparategroup.

96 Statistics Netherlands
B2.2 The probability of exporting controlled for size class 1), pooled dataset 2006*–2008*
NB The straight line represents average labour productivity of exporters of goods and services in 2008 (Table B2.3).1) Small enterprises < 50 emplyees; medium-sized enterprises >_ 50 and < 250 employees; large enterprises >_ 250 employees.
0
0.2
0.4
0.6
0.8
1.0
0 25 50 75 100 125 150 175 200
probability of being an exporter
labour productivity (1,000 euro)
Small enterprises Medium-sized enterprises Large enterprises
GraphB2.3showstheeffectofeconomicactivityofenterprisesontheprobabilityofexporting.Whenallindustrieswereconcerned,enterprisesinthemanufacturingindustry were most likely to be exporters. Firms in this industry were closelyfollowed by enterprises in the wholesale, retail trade, hotels and restaurantssectors,inwhichmosttradersingoodswereactive(seee.g.Table4inchapterC1andTable4inB1).Ontheotherhand,enterprisesintheindustriesthatincluded,amongothers,thepublicadministration,realestate,energyandagriculturesectorshad the lowest chance of being an exporter. These last-mentioned industriesincluded a high percentage of enterprises that trade in services, whereas mostfirms that trade in goods were found in the manufacturing industry. It is notsurprisingthatindustriesthatcomprisemainlyservicesenterprises,havealowerprobabilityofbeinganexporter.Inaddition,itisknownfromtheliteraturethatservicesaretradedlessacrossbordersthangoods.Oneimportantreasonforthisisthat many services must be consumed at the point of production. Furthermore,firms that export services are also confronted with a broad range of nationalregulatorybarrierswhichmaketradingmoredifficult(Koxetal.,2009).

Internationalisation Monitor 2010 97
B2.3 The probability of exporting controlled for enterprise activity, pooled dataset 2006*–2008*
NB The straight line represents average labour productivity of exporters of goods and services in 2008 (Table B2.3).
0
0.2
0.4
0.6
0.8
1.0
0 25 50 75 100 125 150 175 200
probability of being an exporter
labour productivity (1,000 euro)
Agriculture, hunting, fishing, mining and quarrying Manufacturing
Energy, construction Wholesale, retail trade, hotels and restaurants
Transport, storage and communications
Public administration, education, healthcare, social work and other services
Real estate, renting and business activities
2.5 Conclusions
Inthischapterthreenewdatasetsoninternationaltradersingoodsandserviceswere used to investigate whether there were significant differences in labourproductivityand turnoverbetweenvarious typesof traders in theperiod2006–2008.TheinfluenceofbeingaDutchcontrolledoraforeigncontrolledenterpriseon labour productivity and turnover was also investigated. Finally, regressionanalyses showed how the association between labour productivity and thelikelihoodofexportingorimportingvariedacrossindustries,foreignownershipandsizeclass.
In2008,exportersofgoodsand/orservicesgeneratedalmost80percentof totalDutchturnoverandtwo-thirdsoftotalvalueadded.Intermsofimportersofgoodsand/or services, these shares were even higher, hence enterprises active ininternationaltrademakeasignificantcontributiontotheDutcheconomy.
Acomparisonbetweenthevarioustypesofexportersandnon-exportersshowedthat each type of exporter had a significantly higher average turnover and wasmoreproductivethannon-exporters.Similarresultswereobservedforimporters

98 Statistics Netherlands
and non-importers. Foreign controlled exporters (importers) were significantlymoreproductiveandhadahigheraverageturnovervaluethanDutchcontrolledexporters(importers).
Itcanbeconcludedfromtheregressionanalysesthatincreasedlabourproductivityraisedboth theprobabilityof exportingand importing significantly, evenwhencontrolledforsize,industryandownership.Theprobabilitythatanenterpriseisactiveinexportingwasalmosttwiceashighifitslnlabourproductivityincreasedbyoneunit(e.g.fromaround33thousandto89thousandeuros).Comparatively,the likelihood of being an importer increased by 65percent. In addition, weestablishedthattherelationshipbetweenlabourproductivityandtheprobabilityofexporting(importing)variedacrossforeignownership,firmsizeandindustry.Givenacertainleveloflabourproductivity,foreigncontrolledfirmshadamuchhigher chance of being an exporter than Dutch controlled enterprises. Largerenterprises,andmedium-sizedfirmstoalesserextent,werealsomuchmorelikelytobeexportersthansmallenterprises.Asregardseconomicactivity,enterprisesinthemanufacturingindustryhadthehighestprobabilityofbeinganexporter.Firmswith the lowest chance of being an exporter were found in the industries thatcontained, among others, the public administration, real estate, energy andagriculturalsector.
Assuch,ourfindingssupporttheacademicliterature,andempiricalstudiesshowthatexportersaredifferentfromenterprisesthatdonottrade.Labourproductivity,firm size and foreign ownership are all positively related to the probability ofexporting,andalsototheprobabilityofimporting.Sinceourdatadonotyetallowfor longitudinal analyses, the direction of causality between trade status andproductivitywasbeyondthescopeof thisresearchproject.However,extendingthepresentmicro-datasetsongoodsandservicestradersallowsforfurtherresearchinthisarea.
References
Bernard,A.andJensen,J.(1999).‘Exceptionalexporterperformance:cause,effect,orboth?’.Journal of International Economics,47(1):1–25.
Bernard,A.andJensen,J.(2001).‘Whysomefirmsexport’.NBERWorkingPaperNo.W8349,NationalBureauofEconomicResearch,Cambridge.
Bernard,A., Jensen, J., Redding, S. and Schott, P. (2007). ‘Firms in internationaltrade’.Journal of Economic Perspectives,21(3):105–130.
Internationalisation Monitor 2010 99
Bernard,A.andWagner,J.(1998).‘ExportentryandexitbyGermanfirms’.NBERWorkingPaperNo.6538,NationalBureauofEconomicResearch,Cambridge.
Blalock, G. and Gertler, P. (2004). ‘Learning from exporting revisited in a lessdevelopedsetting’.Journal of Development Economics,75(2):397–416.
Breinlich,H.andCriscuolo,C.(2008).‘ServicetradersintheUK’.CEPDiscussionPaperNo.901,CentreforEconomicPerformance,LSE,London.
Hijzen,A.,Pisu,M.andUpward,R.(2006).‘Aportraitoftradeinservices’.ReportfortheDTI,London.
Kox, H., Lejour,A. and Verweij, G. (2009). ‘Regulatory barriers in business andtransport services trade’. Paper prepared for the First Meeting of GlobalisationInvestmentandServicesTrade,June,Milan.
Mayer, T. and Ottaviano, G. (2007). ‘The happy few: the internationalisation ofEuropeanfirms.Newfactsbasedonfirm-levelevidence’.BruegelBlueprintSeries,Volume3,Brussels.
Melitz,M.(2003).‘Theimpactoftradeonintra-industryreallocationsandaggregateindustryproductivity’.Econometrica71(6):1695–1725.
Muûls, M. and Pisu, M. (2007). ‘Imports and exports at the level of the firm:EvidenceforBelgium’.WorkingPaperResearchNo.114,NationalBankofBelgium,Brussels.
Schank,T.,Schnabel,C.andWagner,J.(2008).‘Higherwagesinexportingfirms:Self-selection,exporteffect,orboth?FirstevidencefromGermanlinkedemployer-employeedata’.IZADiscussionPapers3359,InstitutefortheStudyofLabor(IZA),Bonn.
Smeets,R.,Creusen,H.,Lejour,A.andKox,H.(2010).‘Exportmarginsandexportbarriers. Uncovering market entry costs of exporters in the Netherlands’. CPBDiscussionPaperNo.208,TheHague.
Vogel,A. (2009). ‘Exporter performance in the German business services sector:Firstevidencefromtheservicesstatisticspanel’.WorkingPaperSeriesinEconomicsNo.111,UniversityofLüneburg,Lüneburg.
WagnerJ. (2005). ‘Exportsandproductivity:Asurveyof theevidencefromfirmlevel data’. Working Paper Series in Economics No.4, University of Lüneburg,Lüneburg.

100 Statistics Netherlands
Notes in the text:1) Theaveragelabourproductivitylevelofexportersingoodsandservicesin2008(TableB2.3).

Internationalisation Monitor 2010 101
B3 In-depth analyses: international trade and R&DRené Bongard
3.1 Introduction
Globalisationandtechnologicaldevelopmentareessentialforeconomicgrowthinthe Netherlands. More than ever before, people and enterprises cross countryborders in order to undertake economic activities. The integration and furtherdevelopment of the European Union has led to a more open internal Europeaneconomy.Tradebarriersfadeandcompetitionintensifies.Thefreeflowofcapital,goods, services and labour eliminates the borders between member states andstimulates more economic interaction. This is in line with the increasingglobalisationoftheworldeconomy.Improvedtransportationandcommunicationsystems, fostered by developments in ICT, contribute to a more interconnectedglobal economy. Shifts in political attitudes of protective economies towardsforeignaccesstotheireconomiesresultinevenmoreopenness,internationaltradeand other cross-border activities of economic actors, such as foreign directinvestment (FDI) and outsourcing. Large multinational enterprises (MNEs) inparticularplayanimportantroleinourglobalisingeconomy.MNEsperformtheircoreandsupportactivitiesinthecountrieswheretherelevantproductionfactorsare available and most advantageous to them. Labour-intensive activities arecapitalised in countries where plenty of cheap labour is available, for exampleEastern Europe and South-East Asia. Enterprises requiring access to naturalresources locate their plants where it is most advantageous, in terms ofinfrastructure,availableresourcesandregulations.Knowledge-intensiveactivities,suchasR&Dandinnovation,areusedtoadvantageincountrieswhereenterpriseshaveaccesstotheknowledgetheyneed.Highhumancapital,gooduniversitiesand innovative enterprises and government support for innovation all attractenterprises looking for knowledge and knowledge development. It is theNetherlands’aimtobecomealeadingknowledgeeconomy(seealsochapterA4).FurtherDutchproductivitygrowthcanno longerbeachievedby increasingtheinputoflabourintheeconomy.Policymakersfocusonthecreationofknowledgein order to boost innovativeness, and productivity, and hence economic andwelfaregrowth.TheglobalisingeconomyoffersopportunitiesfortheNetherlands,asanopeneconomy,tobenefitfromtheapplicationandfurtherdevelopmentoftheknowledgeinthiscountry.TheNetherlandsis,historically,anopeneconomy,where international trade is essential for its welfare. Continued benefit fromexports in this globalising economy, in which there is strong competition fromcountries in Eastern Europe and Asia where labour costs are low, can only be

102 Statistics Netherlands
achieved if the Netherlands increases its competitiveness by focusing on thedevelopmentandapplicationofknowledge.
3.1.1 Trade and knowledge
Thechallengeistomeasuretheeffectsofincreasingglobalisationonknowledgecreationand innovativeness in theNetherlands.ChapterA4describes trends inDutchR&Dandinnovationinaninternationalperspective.Thischapterprovidesan in-depth analysis of the interrelation between R&D (and innovation) andinternational trade. What are the characteristics of exporting enterprises? AreexportersmoreactiveinR&Dandinnovationthannon-exporters?AndareR&Denterprisesmoreactiveintheexportofhigh-techgoods?Weexpectthatenterprisesthat invest inR&Dwillhave to scaleup, in termsof sales, inorder togeneratereturns on the high R&D investments. As a result of increased productivityresultingfrominnovation,R&Denterprisesmayachievecomparativeadvantageswhich enable them to export their (differentiated) products. This could lead toinnovationdiffusionfromthe innovator to theadopter.Whenenterprises in theNetherlands import high-tech goods one may expect that innovation diffusionoccursinthedirectionoftheNetherlands.Sonotonlydoesknowledgedevelopmentleadtoproductivitygrowth,buttheadoptionofknowledgecreatedabroadalsoyields productivity growth. International trade plays an important role inknowledgediffusionandthereforealsointhedevelopmentofnewknowledge.Forthe Netherlands as an open knowledge economy it is interesting to analyse theinterrelation between international trade and R&D and innovation activities byenterprisesintheDutchbusinesssector.
3.1.2 Structure of this chapter
The next section (3.2) gives an overview of recent studies into the interrelationbetweenR&Dandinternationaltrade.Themethodologicalsection(3.3)expandsonthesourcedataandmethodsusedinthisstudy.Section3.4presentsnewtablesabouttradeinhigh-techgoodsbyforeignanddomestic-controlledR&Denterprises.Bothexportandimportarebrokendownintodestinationandoriginrespectivelyfor 2002, 2004, 2006 and 2008. Further, in this section we distinguish severalcategories of firms as defined by Eurostat, based on technology intensity, andcomparethemonbusinesseconomicindicators,includingshareofhigh-techgoodsexportersandhigh-techgoodsimporters,governmentinnovationsupport,R&Dactivity,innovativenessandlabourproductivity.Theresultsoftwosetsofbinarylogistic regressionmodelsarepresented in3.5.Thefirst regressionmodels shedlightonthecharacteristicsofinnovatingenterprises.Thesecondsetofregressionmodelsfocusesonexportersofhigh-techgoodsandtheircharacteristics.Findingevidenceforcausalityischallengingastherelationshipsbetweentheindicatorsarenot straightforward and they are therefore hard to describe. Several indirect

Internationalisation Monitor 2010 103
relationshipsbetweeneconomicaspectsplayarole,forexamplecompetitionintherelevantmarketandscaleeffects,justlikeintrinsicaspectsofR&Dactivitiesandinternational trade, time lags and risk factors. The chapter concludes with adiscussionoftherelationshipbetweentradeandknowledge(3.6).
3.2 Literature review on international trade and knowledge
ChapterA4 in this Internationalisation Monitor describes trends in Dutch R&Dand innovation and benchmarks them in a European perspective. The figuresrevealthatenterprisesthattradeinternationallyinvesthighersumsofmoneyandmore often in R&D, and they tend to be more innovative. However, the samefigures also reveal that international trading enterprises are, on average, largerthanenterprisesnotinvolvedininternationaltrade.EnterprisesthatinvestinR&DarealsolargerthanenterprisesthatdonotinvestinR&D.Sothesizeofanenterprisedoesseemtoexplain,toacertainextent,boththetradingbehaviourofenterprisesandthelikelihoodofacompanyinvestinginR&D.
3.2.1 Self-selection effects and productivity
Scholarshaveresearchedthistopicextensively.Thereisalargebodyofempiricalliteraturethatdocumentstherelationshipbetweenexportingandproductivity.Ingeneral, scholars find that exporting enterprises are more productive than non-exportingenterprises,whichreflectstheself-selectionprocessofmoreproductiveenterprisesintheexportmarket(Girmaetal.,2004).Productiveenterpriseshavecomparativeadvantageandstarttoexport.Othersstatethatexportingmakesthemeven more productive (Aw, Roberts, Xu, 2008). This further increases theircomparativeadvantage,which,inturn,leadstoevenmoreexport.Theproductivityof enterprises correlates highly with the size of enterprises. Expansion enablesenterprisestobenefitfromeconomiesofscalebyreducingunitcost,resultinginlower long-run average costs and therefore higher added value and increasedproductivity.BothR&Dandexportinvolvehighfixedcosts.Soenlargingthescaleofanenterprise,whilekeepingfixedcostsconstant,impliesloweraveragefixedcostsperunit.ThisexplainswhythefiguresinchapterA4showthatexportersandR&Denterprisesare,onaverage,largerthannon-exportersandenterprisesthatdonot invest in R&D. The self-selection of productive enterprises drives them toparticipateintheexportmarketoritdrivesthemtostartinvestinginR&D.Scholarsfindtheself-selectioneffect forbothembarkingonexportandforstartingR&Dactivities. R&D and exporting have a positive effect on the enterprise’s futureproductivity which reinforces the selection effect (Aw, 2008). The question istherefore:howdoenterprisesachievetheinitialproductivitylevelthatdrivesthemtostartexportactivities?Girmaetal.(2004)statethatprofit-maximisingfirmsenterexportmarketsonlyifthepresentvalueoftheirprofitsexceedsthefixedcostsof

104 Statistics Netherlands
entry. One may expect that the same applies when starting R&D activities.Enterprises generate profit when they manage to generate higher output valuethaninputvalue.Soprofitsdependonproductivity,whichisthefunctionbetweenoperating inputs and outputs. Several types of input can be discerned: capital,labour, energy, materials, and services. A more efficient use of input increasesproductivity.R&Dincreasestheprobabilityofbeinginvolvedininnovationsthatyieldmoreefficientuseofinputs.SeeHalletal.(2009)forareviewoftherelevantliteratureonthistopic.WeconcludefromthispartoftheliteraturethatexportingandR&Dinvolvehighfixedcosts.EnterprisesrequireacertainlevelofproductivityinordertobetriggeredtostartexportingorinvestinginR&D.Thisself-selectioneffectisfurtherreinforcedbytheproductivitygainsfromexportingandinnovating.Sofromthisperspectivethereseemstobenodirectrelationshipbetweenexportingand R&D, other than the possibility that productivity gains achieved throughexportmaydriveenterprisestostartR&D,andviceversa.
3.2.2 Innovation diffusion
AnotherrelevantaspectoftheinterrelationbetweentradeandR&Disthattradeleads to innovation diffusion since international trade facilitates technologytransfer.Manyscholarsarguethatinnovationdiffusionisanimportantsourceofproductivitygrowth.Fromhisempirical researchon16OECDcountries for theperiod1870–2004, Madsen (2007) concludes that there is a robust relationshipbetweenproductivityandknowledgeimports,andthat93percentoftheincreaseinproductivityoverthepastcenturywasthankstoknowledgeimportalone.CoeandHelpman(1995)alsofindthatinternationaltransmissionofR&Dknowledgethroughthechanneloftradehascontributedsignificantlytoproductivitygrowth.“WhileR&Draisesratesofinnovation,internationaltradeenhancesthespeedoftechnologytransfer,”(Cameronetal.,2003).SoR&Dincreasesanenterprise’soddsfor embarking on innovation, while international trade increases innovationdiffusion.Technology transfer isparticularly important forcountriesbehindthetechnological frontier. Countries that are less developed in technological termstendtoconvergequicklytosteady-statelevelsofproductivitywhentradingwithcountries at the technological frontier. So enterprises that innovate and tradeprovide their trading counterparts with productivity advantages in terms oftechnologicaldevelopment.Themoreeducatedandskilfultheimportersare,thebetter the adoption of the innovation will be and the faster and higher theproductivity growth. “It may be seriously argued that, historically, Europeanreceptivitytonewtechnologies,andthecapacitytoassimilatethemwhatevertheirorigin, has been as important as inventiveness itself,” (Rosenberg, 1982). ThisindicatestherelevanceoftheinterrelationbetweenR&Dandinternationaltrade.For a comprehensive study on the diffusion of innovations see Rogers (2003).Hejazi(1999)addsforeigndirectinvestment(FDI)stockstointernationaltradeasadiffusionchannelforR&Dbetweencountries.Hearguesthattheimportanceof

Internationalisation Monitor 2010 105
the trade channel as a source of productivity growth is reduced once FDI isconsidered. Although the focus in this paper is on the interrelation betweeninternationaltradeandR&D,wealsotakeFDIintoaccount.FDIbyforeignfirmsintheNetherlandsiscoveredbythelocusofcontrolbreakdown,sincethisindicatestheforeignownershipofenterprisesintheDutchbusinesssector.KnowledgefromabroadmayflowintotheNetherlandsviatheFDIchannelasaresultofintra-firmknowledgespilloverswhenaforeignenterpriseacquiresorstartsanenterpriseinthe Netherlands. FDI is also more appropriate for some types of knowledgetransmissionthantheinternationaltradechannel(Hejazi,1999).Toconclude,theliterature on innovation diffusion provides evidence for the importance ofinternationaltradeasafacilitatoroftechnologytransferandthecauseofknowledgespillovers,resultinginproductivitygainsforthereceivingcounterpart.
3.3 Data and methodology
Weconstructedadatabaseonmicrolevel,i.e.atenterpriselevel,inordertoassesstheeffectsofglobalisationonR&DandinnovationactivitiesintheDutchbusinesssector.TheCommunityInnovationSurvey(CIS)isthebackboneofthisresearch.ThisEU-coordinatedsurveyoninnovationcanbeweightedtothepopulationofallenterprises in the Netherlands with ten or more employees. Since internationaltradeandforeigndirectinvestmentareindicatorsofglobalisation,wematchourCISdatabaseonenterprise levelwith indicatorson international trade ingoodsand with locus of control. Both globalisation indicators are binomial, so eachenterprisehaseitherazeroorone.Theindicatorsoninternationaltradeingoodsenableus todistinguishexporters fromnon-exportersand importers fromnon-importers.Amoredetailedlevelinthisdimensionisprovidedbydistinguishinginternational trade in high-tech goods (according to the OECD high-tech goodslist)andbydisaggregatinginternationaltradetoregionofdestinationandorigin.We can make a distinction between the following regions: the main EuropeanUnionmemberstates(EU14),theUnitedStates(US),China,Japan,andtherestofthe world (ROW). It should be borne in mind that we do not use data aboutinternationaltradeinservices.ThelocusofcontrolindicatordistinguishesDutchcontrolledenterprisesfromforeigncontrolledenterprises.TheUltimateControllingInstitute(UCI)lististhesourceforthisvariable.
The matching task yields new datasets that open up many new researchopportunities.Dataon innovation input (R&Dactivities)and innovationoutputcannowbebrokendownbyglobalisationindicators.Inaddition,wematchthisdatasetwithyetanotherdatabase inorder toaddallkindsof relevantbusinessperformance indicators, such as turnover, employment, added value, labourproductivityandprofitability.Contrarytothematchwithinternationaltradeandlocusofcontroldata,whichcorresponded100percent,thesebusinessperformance

106 Statistics Netherlands
indicators only match 70 to 85percent of all enterprises in the CIS database,dependingonthevariableofinterest.
NACE classifications are used to distinguish different industries. A specialaggregation,definedbyEurostat,ismadeonthebasisoftechnologyintensityinNACE classes. Manufacturing enterprises are categorised in the high-tech, themedium-high-tech, themedium-low-techorinthelow-techgroups.Enterprisesintheservices sector are either classified as knowledge intensive or as less knowledge intensive.Enterprisesthatdonotfitinoneoftheabovecategoriesareintheothergroup. These new classifications facilitate better opportunities for comparingenterprisesandtheyproducemoresoundcomparisons.Inaddition,enterprisesizelevel is available for all dimensions: small (10–49employees), medium (50–249employees),andlarge(250ormoreemployees).Anadditionalsizeclasswasaddedtotheregressionanalysesinthischapter:verylargeenterprises.Asaresult,thelargesizeclassisreducedto250–999employees.Enterpriseswith1,000ormoreemployeesarecategorisedasvery large.ThiswasdonebecauseanalysesshowedthatverylargeenterprisesplayanimportantroleinR&D,sothisextrasizeclassisusefulforR&Dactivities.
Thenewmicroleveldatasetsareavailableandconsistentfortheperiod2002–2008,whichmakesitpossibletoprovidetimeseriesinordertoindicatetrends.
3.4 Trade and knowledge
3.4.1 International trade in high-tech goods
InordertoshedlightontheinterrelationbetweenR&Dandexportsofhigh-techgoodsintheDutchbusinesssector,TableB3.1showstheshareofR&Denterprisesthatexportandimporthigh-techgoods.MoredetailonthisrelationshipisachievedbythebreakdownondestinationandoriginandonthelocusofcontroloftheR&Denterprise.High-techgoodsaredefinedbytheOECDonthebasisoftheir3,4,or5digitSITCcode(SITCstandsforStandardInternationalTradeClassification).Anenterprise is referred to in this paper as being a high-tech goods exporter orimporterwhentheenterpriseexportsorimportsatleastoneofthegoodsdefinedasahigh-techgood.
“Increases in high-technology exports suggest that learning and industrialupgrading is takingplace in theexportingcountry,” (Sturgeon&Gereffi,2009).The share of R&D enterprises in the Netherlands that exports high-tech goodsincreasedintheperiod2002–2008.ThissuggeststhatDutchindustryisperformingrelativelywellintermsoftechnologicaldevelopment.Enterprisesthatareabletoselltheirhigh-techgoodsabroadhaveacomparativeadvantageinproducingthat

Internationalisation Monitor 2010 107
good compared with competitors in the importing countries. The underlyingreasonforthisadvantageislikelytobetechnologyrelated.TheseDutchexportsofhigh-techgoodsmayleadtoproductivitygrowthinothercountriesasaresultofinnovationandknowledgespillovers.
TheshareofenterprisesintheNetherlandsthatimporthigh-techgoodsisgreaterthan the share of enterprises that export high-tech goods. This is in line withgeneralfiguresonexportsandimportsandmaybecausedbythefactthatimportingis ‘easier’ than exporting. Exporting requires higher entry costs and is onlyprofitable forfirmswithacertainproductivity level,whilealmosteveryfirm isabletoimport(high-tech)goods.SeealsochapterB1.5inthe2009editionoftheInternationalisationMonitor.However,accordingtothe literatureoninnovationdiffusion, the import of high-tech goods leads to knowledge inflow to theNetherlands,whichfostersproductivitygrowth.AccordingtotableB2.1,mostoftheimportingR&Denterprisesreceivetheirhigh-techproductsfromexportersintheUnitedStates.Thiscouldindicatethatintherelevantbranchesofindustry,US-basedenterprisesareclosertoorareonthetechnologyfrontier(i.e.areleadinginthe development of a certain technology). We assume that access to advancedknowledgeandtechnologiesisessentialfortheproductionofhigh-techgoods.Theshareofenterprisesthatimporthigh-techgoodsfromChinaisincreasingrapidly,whichindicatesthatenterprisesinChinaaredevelopingquicklyintechnologicalterms. China seems to be moving to the technology frontier. Foreign controlledenterprises tend to export and import high-tech goods more than their Dutchcontrolledcounterparts.Thiscanbeexplainedbythefactthatforeigncontrolledenterprises are larger and more productive than Dutch controlled enterprises.Further, it isworthnotingthat in2008fewerenterprisesimportedandexportedhigh-techgoodsthanin2006.Thismaybeanearlyconsequenceofthe“economiccrisis”,whichledtosignificantdecreasesinglobaltrade.
Enterprises may also focus on R&D and exploit the inventions by licensing orselling technologies (i.e. patents) instead of producing and exporting high-techgoods.SotheR&Denterprisesinthistablethatexporthigh-techgoodsareprobablyverticallyintegratedfirmswhichdevelop,produceandsell(export)theirhigh-techproducts.TheknowledgeoutflowthatdoesnotoccurthroughtradeingoodsfromR&D enterprises is not visible in this table. Knowledge outflow may also gothroughFDI,sourcingofbusinessactivitiesorinternationaltradeinservices.SmallR&D enterprises without production facilities may use channels other than theexportingofhigh-techgoodstoachievereturnsonR&Dinvestment.

108 Statistics Netherlands
Table B3.1 Dutch and foreign controlled R&D enterprises’ high-tech exports and imports to / from destination and origin
2002 2004 2006 2008
Dutch foreign Dutch foreign Dutch foreign Dutch foreign
% of R&D enterprises
Exporterofhigh-techgoods 8 13 8 19 11 20 13 15toEU12 2 5 3 4 4 6 3 5toUnitedStates 4 6 3 9 5 12 6 7toChina 2 4 1 3 3 7 5 4toJapan 1 5 2 4 2 4 3 4toROW 2 3 2 7 3 6 4 3
Importerofhigh-techgoods 14 24 17 27 21 29 18 25fromEU12 3 6 2 7 3 8 4 8fromUnitedStates 7 14 9 15 12 10 9 11fromChina 2 7 3 7 8 10 6 6fromJapan 4 5 4 4 4 8 4 5fromROW 4 5 5 7 5 7 5 5
3.4.2 Key economic indicators for aggregations on technology and knowledge intensity
Eurostatdistinguishessevendifferentaggregationsbasedontechnologyintensityfor manufacturing enterprises and knowledge intensity for services enterprises,seeTableB3.2.Manufacturingenterprisesarecategorisedinfourgroups,basedonthe technology intensity of their NACE sector (from high technology to lowtechnology). Enterprises operating in the services sector are either classified asknowledge-intensiveoraslessknowledge-intensive.The‘other’groupconsistsofallenterprisesthatarenotinanyoftheabovegroups.Thesevenfirmcategoriesarebenchmarkedonseveralvariablesfor2002,2004,2006and2008.
Theshareofhigh-techgoodsexportersis,asexpected,byfarthehighestforthehigh-technology enterprises and the lowest for the low-technology and otherenterprises.Thisconfirmsthathigh-techgoodsaremainlyexportedbyenterprisesthatinvestinR&Dandthattheyareequippedwithstate-of-the-arttechnologies.The share of importers of high-tech goods is also highest for the high-techenterprises.Notethatmoreenterprisesimporthigh-techgoodsthanexporthigh-techgoods.Thereasonforthisisthatimportingiseasierthanexporting.Further,these high import percentages may indicate that high-tech enterprises in theNetherlandsarepartofglobalvaluechains.Obviouslynotallpartsofthehigh-techoutputfromenterprisesintheNetherlandsareproducedintheNetherlandsandthereforeneedtobeimported.

Internationalisation Monitor 2010 109
In2008theshareofenterprisesinthehigh-technologycategorythatexportedhigh-techgoodsishigherthantheshareofenterprisesthatimportedhigh-techgoods.Comparedwith2006,thereisadeclineofalmost7percentintheshareofimportersofhightech-goods,whiletheshareofexportersincreasesbyalmost7percent.Itwouldbe interesting toconduct furtherresearchonthisobservation inorder toestablishanexplanationforthis.
Table B3.2 Economic and innovation indicators by industry technology-intensity category
Technology-intensitycategory Export Import Govern- R&D Innovation Patent Labour high-tech high-tech mental activities application produti- goods goods innovation vity support1)
1,000 % euro
High-technology2002 16.7 23.9 35.5 31.8 46.1 n.a. 722004 17.8 33.1 64.0 30.9 56.2 14.2 932006 24.3 36.2 52.8 35.6 56.2 15.7 1062008 31.0 29.5 45.7 35.4 59.2 18.8 n.a.
Medium-high-technology2002 6.8 10.6 26.8 39.2 56.7 n.a. 832004 7.7 12.2 69.3 33.2 56.0 19.4 952006 10.2 16.5 60.5 28.0 55.0 18.9 1082008 8.6 11.8 47.5 27.0 50.2 15.7 n.a.
Medium-low-technology2002 3.0 6.6 12.1 17.0 39.1 n.a. 772004 2.8 5.3 46.8 14.8 37.4 7.0 862006 3.3 7.0 41.9 11.9 40.3 11.3 982008 4.5 10.8 39.3 14.9 42.3 8.4 n.a.
Low-technology2002 1.3 5.6 9.4 10.4 30.6 n.a. 772004 1.9 6.3 31.9 10.4 35.1 4.0 992006 1.9 6.4 30.5 9.4 33.9 5.8 942008 2.3 4.7 26.1 9.0 34.7 3.8 n.a.
Knowledge-intensiveservices2002 3.2 7.5 12.3 8.7 22.7 n.a. 1262004 2.6 6.8 23.3 8.8 30.8 2.2 1772006 3.2 7.4 23.8 6.8 27.7 2.6 1562008 2.7 4.8 19.1 6.3 25.9 2.3 n.a.
Lessknowledge-intensiveservices2002 2.8 5.4 7.6 2.4 13.3 n.a. 862004 2.7 5.9 18.6 2.6 19.1 1.6 1012006 2.8 5.7 14.9 1.8 19.2 2.3 1112008 2.5 5.2 12.5 2.0 19.6 2.3 n.a.
Other2002 1.1 2.2 8.5 1.6 10.4 n.a. 752004 1.0 2.1 27.8 2.7 15.0 1.8 762006 1.0 2.4 22.9 1.5 15.2 3.2 1072008 1.5 3.2 29.0 1.7 15.8 2.1 n.a.
1) As%ofinnovativeenterprises.

110 Statistics Netherlands
Theshareofinnovativeenterprisesthatreceivedgovernmentinnovationsupportdeclinedin2008,apartfromtheenterprisesintheothercategory.In2008almosthalf the medium-high-technology and high-technology enterprises receivedgovernment innovation support, either from local, national or Europeangovernmentagencies.ThetechnologyandknowledgeintensiveenterprisestendtobethemostactiveinR&Dandaremostofteninnovative.Thelabourproductivityishighestfortheknowledgeintensiveservicesbranchesandforthemedium-high-technologyandhigh-technologymanufacturingbranches.Thisisinlinewiththefindingsintheliteraturethatknowledgegenerationandtechnologydevelopmentrequirehighproductivityandyieldfurtherproductivitygrowth.
3.5 Innovators and high-tech exporters: their characteristics
Thissectionpresentstableswithseveralbinarylogisticregressionmodelsinordertocharacteriseinnovators(TableB3.3)andexportersofhigh-techgoods(TableB3.4).Thesebinaryregressionmodelsestimatestandardisedcoefficientsbynormalisingall the covariates so that these variables have a mean of zero and a standarddeviationofone.Thismakesitpossibletocomparetherelativeeffectofindependentvariables on the dependent variables ‘innovator’ and ‘high-tech exporter’respectively(Pampel,2000).
3.5.1 Innovators
TableB3.3 shows very significant results: all variables in all six models have ap-value lower than0.01. Further, the coefficients are robust, showing limitedrelative fluctuations when adding or removing variables in the models. Thesemodelsdonotexplainallthevarianceofthedependentvariableinnovator.It islikely that indirect relations exist between the control variables in the models.Further, other economic indicators that are not used in these regression modelsmayexplainpartof thevarianceof thedependentvariable.Neithercanwesayanythingaboutcausality,becausetherelationsarenotstraightforwardasconcludedfromtheliteratureontradeandR&D.However,theregressionmodelsaresuitedtocharacteriseinnovatingenterprisesintermsoftheexplanatoryvariables.
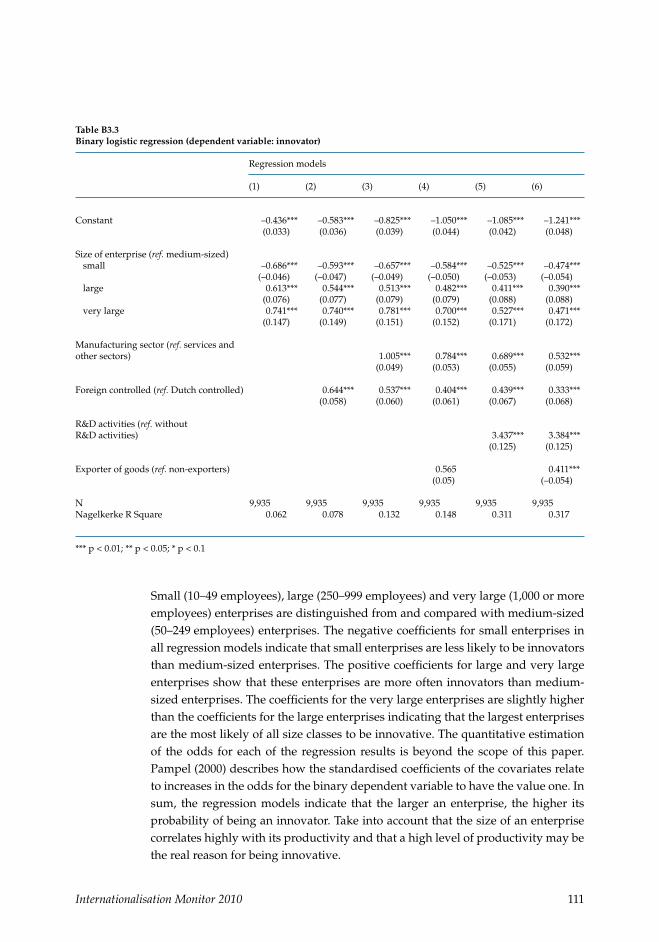
Internationalisation Monitor 2010 111
Table B3.3 Binary logistic regression (dependent variable: innovator)
Regressionmodels
(1) (2) (3) (4) (5) (6)
Constant –0.436*** –0.583*** –0.825*** –1.050*** –1.085*** –1.241*** (0.033) (0.036) (0.039) (0.044) (0.042) (0.048)
Sizeofenterprise(ref.medium-sized)small –0.686*** –0.593*** –0.657*** –0.584*** –0.525*** –0.474***
(–0.046) (–0.047) (–0.049) (–0.050) (–0.053) (–0.054)large 0.613*** 0.544*** 0.513*** 0.482*** 0.411*** 0.390***
(0.076) (0.077) (0.079) (0.079) (0.088) (0.088)verylarge 0.741*** 0.740*** 0.781*** 0.700*** 0.527*** 0.471***
(0.147) (0.149) (0.151) (0.152) (0.171) (0.172)
Manufacturingsector(ref.servicesandothersectors) 1.005*** 0.784*** 0.689*** 0.532*** (0.049) (0.053) (0.055) (0.059)
Foreigncontrolled(ref.Dutchcontrolled) 0.644*** 0.537*** 0.404*** 0.439*** 0.333*** (0.058) (0.060) (0.061) (0.067) (0.068)
R&Dactivities(ref.withoutR&Dactivities) 3.437*** 3.384*** (0.125) (0.125)
Exporterofgoods(ref.non-exporters) 0.565 0.411*** (0.05) (–0.054)
N 9,935 9,935 9,935 9,935 9,935 9,935NagelkerkeRSquare 0.062 0.078 0.132 0.148 0.311 0.317
***p<0.01;**p<0.05;*p<0.1
Small(10–49employees),large(250–999employees)andverylarge(1,000ormoreemployees)enterprisesaredistinguishedfromandcomparedwithmedium-sized(50–249employees)enterprises.Thenegativecoefficientsforsmallenterprisesinallregressionmodelsindicatethatsmallenterprisesarelesslikelytobeinnovatorsthanmedium-sizedenterprises.Thepositivecoefficientsforlargeandverylargeenterprisesshowthattheseenterprisesaremoreofteninnovatorsthanmedium-sizedenterprises.Thecoefficientsfortheverylargeenterprisesareslightlyhigherthanthecoefficientsforthelargeenterprisesindicatingthatthelargestenterprisesarethemostlikelyofallsizeclassestobeinnovative.Thequantitativeestimationof theodds foreachof the regression results isbeyond the scopeof thispaper.Pampel(2000)describeshowthestandardisedcoefficientsofthecovariatesrelatetoincreasesintheoddsforthebinarydependentvariabletohavethevalueone.Insum, the regression models indicate that the larger an enterprise, the higher itsprobabilityofbeinganinnovator.Takeintoaccountthatthesizeofanenterprisecorrelateshighlywithitsproductivityandthatahighlevelofproductivitymaybetherealreasonforbeinginnovative.

112 Statistics Netherlands
Enterprisesinthemanufacturingsectoraremoreinnovativethanenterprisesintheservicesandothersectors.Thisisnotsurprising,becausemostR&Dinvestmentsinvolvetechnologicalresearchanddevelopment,andthemanufacturingsectorisknownforbeingmoretechnologyintensivethantheservicesandothersectors.
Theregressionmodelsrevealthat,whencontrollingforsizeclass,foreigncontrolledenterprisesaremorelikelytoinnovatethanDutchcontrolledenterprises.Thisisinlinewith theconclusionsof the2009editionof the InternationalisationMonitor.Oneexplanationmaybethatforeigncontrolledenterprisesaremoreproductivethan Dutch controlled enterprises. We know that productivity is an importantexplanatory economic aspect for starting R&D activities and that innovation isoften a result of R&D. The fact that foreign controlled enterprises have aninternational network which they can benefit from could explain their higherproductivity.Further,foreigncontrolledenterprisesintheNetherlandsmaysavecostsbecausetheycanbookcertainfixedcostsintheiraffiliatesabroad.However,furtherresearchmayleadtoanexplanationforthisobservation.
In line with the findings of other scholars, the regression analyses reveal thatenterprises that have R&D activities are more likely to be innovators thanenterprisesthatdonotinvestinR&D.Thecoefficientsarerelativelyhigh,indicatingtheexpectedstrongrelationshipbetweenR&Dandinnovation,whichmanyotherstudieshavedescribed.
Exportersofgoodsaremoreofteninnovatorsthannon-exportersofgoods.ThisconfirmstheassumptionthatacertainlevelofproductivityisneededinordertostarthighfixedcostactivitieslikeexportandR&D.Obviously,enterprisesthatareproductive enough to export their products are also likely to start innovating.However,therelationshipbetweeninnovationandexportseemstobeatwo-wayrelationship.
To conclude, innovative enterprises in the Netherlands can be characterised asbeinglargeintermsofemployeenumbers,beingmembersofanenterprisegroupwiththelocusofcontrolabroad,beingactiveinamanufacturingbranch,investinginR&Dandexportinggoods.
3.5.2 Exporters of high-tech goods
Whatarethecharacteristicsofenterprisesthatexporthigh-techgoods?InordertoanswerthisquestionwehavetolookatthebinarylogisticregressionmodelsinTableB3.4wherethedummyhigh-techgoodsexporteristhedependentvariable.

Internationalisation Monitor 2010 113
Table B3.4 Binary logistic regression (dependent variable: high tech good exporter)
Regressionmodels
(1) (2) (3) (4) (5) (6)
Constant –2.480*** –2.937*** –2.584*** –2.784*** –2.843*** –2.933*** (–0.060) (0.074) (0.066) (0.070) (0.075) (0.077)
Sizeofenterprise(ref.medium-sized)small –1.083*** –0.818*** –1.090*** –0.895*** –0.900*** –0.817***
(0.105) (0.109) (0.105) (0.108) (0.108) (0.109)large 0.642*** 0.409*** 0.615*** 0.511*** 0.499*** 0.409***
(0.116) (–0.120) (0.116) (0.118) (0.118) (0.120)verylarge 1.138*** 1.010*** 1.145*** 1.142*** 1.153*** 1.008***
(0.185) (0.192) (0.186) (0.189) (0.189) (0.193)
Manufacturingsector(ref.servicesandothersectors) 0.369*** 0.240 –0,022 (0.091) (0.093) (0.101)
Foreigncontrolled(ref.Dutchcontrolled) 0.907*** 1.011*** 0.976*** 0.909*** (0.095) (0.093) (0.094) (0.096)
R&D-activities(ref.withoutR&D-activities) 0.911*** 0.919*** (0.101) (0.108)
N 9,935 9,935 9,935 9,935 9,935 9,935NagelkerkeRSquare 0.068 0.117 0.072 0.097 0.099 0.117
***p<0.01;**p<0.05;*p<0.1
Regardingenterprisesizeclassthesameconclusionasinthepreviouspartaboutinnovatorsapplies.Thecoefficientsforallsizeclassdummiesareverysignificant.Smallenterprisesarelesslikelytobeexportersofhigh-techgoodsthanmedium-sizedenterprises.Largeandverylargeenterprisesaremoreofteninnovatorsthanmedium-sizedenterprises.Themaindifferencewiththeregressionmodelsontheinnovator dependent variable in TableB3.3 is that the coefficients for very largeenterprisesarerelativelyhighcomparedwithlargeenterprisesintheregressiononhigh-tech good exporter.This indicates thatexportersofhigh-techgoodsaremorelikelytobeverylargeenterprisescomparedwithinnovators.AnexplanationforthisobservationmaybethatR&Dandinnovationisoftenarequirementforstartingto export high-tech goods. A high level of R&D is needed to come up withinnovationsanddevelophigh-techproducts.
Thecoefficientsforthemanufacturingenterprisesarenotrobustandnotsignificantinallmodels.Sowecannotcharacterisehigh-techgoodsexportersintermsofthesector inwhich theyareactive.Onemayexpecthigh-techgoodexporters tobeactive in the manufacturing sector, which is the most technology-intensive.However,partofthehigh-techexportscouldbesourcedtowholesaleenterprises.

114 Statistics Netherlands
In particular, enterprises with R&D and innovation as their core business maywanttofocusontheircorebusiness,andleavetheproduction,marketingandsalesto others. This could explain why we do not find significant results for themanufacturingsectorinalltheregressionmodels.
Foreigncontrolledenterprisesaremoreoftenexportersofhigh-techgoods thanDutchcontrolledenterprises.ProbablythefactthatforeigncontrolledenterprisesintheNetherlandsaremoreproductivethanDutchcontrolledenterprisesistheunderlyingreasonforthisobservation.
TheregressionmodelsshowthatenterpriseswithR&Dactivitiesaremoreoftenexportersofhigh-techgoodscomparedwithenterprisesthatdonotinvestinR&D.Many enterprises that export high-tech goods are probably also producers anddevelopersofhigh-techgoods.ThisimpliesthattheyconductR&Dactivities.AnexceptiontothisobservationisthegroupofwholesaleenterprisesthatarehiredbyR&Denterprisestoexporttheirproducts.
Insum,enterprisesthatexporthigh-techgoodscanbecharacterisedas(very)largein size, relatively often under foreign control, and often have their own R&Dactivities.
3.6 Summary and conclusion
BothexportandR&Dincreaseproductivity.Acertain levelofproductivity (andfuture profit expectations) is needed in order to start exporting or investing inR&D,becausefixedcostsarehigh.Onceenterprisesreachacertainproductivitylevel, theoddsofthembecomingexportersorR&Denterprises increase.This isreferred toas theself-selectioneffect.ProductiveenterprisesbecomeevenmoreproductivebecausetheystartexportingorstartupR&Dactivities.Thissuggeststhat it is important for enterprises to achieve the initial productivity level thattriggersthemtostartexportingortostartupR&Dactivities.
Inordertoinnovate,creationandcombinationofknowledgeareessential.Tradeoftenincludesthetransferoftechnologiesandknowledge.Soinnovationdiffusionis fostered by (international) trade and is regarded as an important source ofproductivitygrowth.Increasinginternationaltradeandincreasingforeigndirectinvestmentare,amongotherthings, inherenttoglobalisation.Wearguedinthispaperthattheinternationaltradeaspectofglobalisationincreasesandacceleratesthepaceofinnovationdiffusion.Whiletheincreasingexportsofhigh-techgoodsbyenterprisesintheDutchbusinesssectorindicatethatindustrial“upgrading”istakingplace, increasingimportsofhigh-techgoodsshowsthatmoreenterprisesareimporting(valuable)knowledgeintotheNetherlands.Theinflowofknowledge

Internationalisation Monitor 2010 115
fromabroadyieldsspilloveradvantagesintheNetherlands,whichadddirectlyorindirectly to productivity growth. In addition, the inflow of knowledge incombination with knowledge already available offers opportunities for creatingnew knowledge. Therefore, globalisation offers an open economy like theNetherlandsopportunitiestoattractanduseforeignknowledge.
The binary logistics regressions show that innovating enterprises are generallylargeenterprisesinthemanufacturingindustry.Theyarerelativelyoftenforeigncontrolled,areexportersofgoodsandinvestinR&D.Inparticular,therelationshipbetweeninvestinginR&Dandbeinganinnovatorisstrong.Anindirectindicatorthatisnottakenupinthemodelsisproductivity.Probablyandaccordingtotheliterature there is a correlation between the innovator dependent variable andseveralindependentvariables.Controllingforsizeclass,locusofcontrolandsectorwecanstatethatexportersaremoreinnovativethannon-exporters.However,duetoindirectrelationsandintrinsicaspectsofR&Dactivitiesandinternationaltrade,such as time lags and risk factors, it is difficult to study the causality betweenexportandinnovation.
Exportersofhigh-techgoodscanbecharacterisedas(very)largeinsize,relativelyoftenforeigncontrolled,andwiththeirownR&Dactivities.
References
Aw,B.Y.(2008).‘R&DInvestment,Exporting,andProductivityDynamics’.NBER Working Paper Series,WorkingPaper14670.
Cameron,G.,Proudman,J.,Redding,S.(2005).‘Technologicalconvergence,R&D,tradeandproductivitygrowth’.European Economic Review 49, 775–807.
Coe,D.T.,Helpman,E. (1995). ‘InternationalR&Dspillovers’.European Economic Review 29, 859–887.
Girma,S.,Greenway,D.,Kneller,R.(2004).‘DoesExportingIncreaseProductivity?A microeconometric Analysis of Matched Firms’. Review of International Economics,12(5),855–866.
Hall,B.H.,Mairesse,J.,Mohnen,P.(2009).‘MeasuringtheReturnstoR&D’.ChapterfortheHandbook of the Economics of Innovation.
Hejazi, W., Safarian, A. (1999). ‘Trade, Foreign Direct Investment, and R&DSpillovers’.Journal of International Business Studies, Vol. 30, No. 3, 491–511.

116 Statistics Netherlands
Lumenga-Neso, O., Olarreaga, M., Schiff, M. (2005). ‘On ‘indirect’ trade-relatedR&Dspillovers’.European Economic Review 49, 1785–1798.
Madsen, J.B. (2007). ‘Technology spillover through trade and TFP convergence:135yearsofevidencefortheOECDcountries’.Journal of International Economics, 72, 464–480.
Pampel,F.C.(2000).‘Logisticregression:Aprimer’.Sage Quantitative Applications in the Social Sciences Series, 132.ThousandOaks,CA:SagePublications.
Roberts,E.M.(2003).‘DiffusionofInnovations’.Free press,fifthedition.
Statistics Netherlands (2009). Internationalisation Monitor 2009. The Hague/Heerlen.
Sturgeon, T. J., Gereffi, G. (2009). ‘Measuring success in the global economy:international trade, industrial upgrading, and business function outsourcing inglobalvaluechains’.Transnational Corporations, Vol.18,No.2.

Internationalisation Monitor 2010 117
B4 Wage and employee differences between trading and non-trading firms in the NetherlandsSandra Genee, Marjolein Korvorst and Fabienne Fortanier
4.1 Introduction
Economic globalisation in the form of increased trade flows has a multitude ofpotentialconsequences.Thereisasubstantialbodyofempiricalresearchthathasdocumentedthehigherwagesofexportingfirmsrelativetonon-exporters,partlyasafunctionoftheirothersuperiorperformancecharacteristics,suchasproductivity(seeSchanketal.,2006forarecentoverview).Todate,fewstudieshaveinvestigatedtheunderlyingbusinesscharacteristicsof importingfirms,andmoreover, little isknown about the employee characteristics of the workforce of firms that import,exportorboth.Istheexportwagepremiumlinkedtothespecificselectionofhumancapital i.e.educationandexperienceofworkers, inexportingfirms?Areimportsalsoanimportantwagedeterminant?Thispaperanalyses thedifference inaveragewagelevelperemployeebetweentrading and non-trading firms, and also considers whether there is still anobservable wage differential when employee characteristics are explicitly takenintoaccount.Usingtheterm“traders”toidentifycompaniesthateitherexportorimport goods or services and introducing the term “two-way traders” forcompaniesthatdoboth,wecontinuebylookingatthestructureoftheworkforceasanexplanationastowhy(two-way)tradingfirmspayhigherwagesthantheirnon-tradingcounterparts.An integrated employer-employee dataset was developed for this analysis,enabling links to be made between employee-level information, in the form ofwagesearnedandemployeecharacteristics,suchasgender,age,countryoforiginetc.,andemployer-levelinformationsuchasenterprisesize,sectorofactivity,andownership.ThisenablesustoempiricallyestablishandquantifytheneteffectoftradingonproductivityandwagesintheDutchcontext.FortheNetherlandsinparticular,withitsopeneconomyandmajorrelianceontradinganditsinternationaleconomic outlook, it is interesting to be able to shed new light not only on theeconomicbutalsoonthesocialconsequencesofglobalisation.Thispaperisorganisedasfollows.Wefirstpresentanumberofstylisedfactsfromthetheoreticalandempirical literaturethathasexploredthequestionoftradingfirms and wages in other, i.e. non-Dutch, empirical contexts. We then brieflydescribe the process of matching employer and employee-level data, andsubsequentlypresenttheresults.

118 Statistics Netherlands
4.2 Theory and background
Currenttheoreticalandempiricalliteraturegenerallyshowsthatexportingfirmspayhigherwagesandaremoreproductivethannon-exportingfirms(e.g.Schanketal.2006).Althoughlearning-by-exportinghasbeenpresentedasamajorreasonastowhyexportingfirmsaregenerallymoreproductiveandthereforepayhigherwages, most evidence points to self-selection of more productive, and thereforebetter paying firms, into exporting (e.g. Bernard and Jensen, 2004). Therefore,higherwagesaregenerallyexplainedbyhigherproductivity.Indeed,aswehaveseen inotherStatisticsNetherlandspublications (cf.GeneeandFortanier,2010),exportingenterprises in theNetherlandsare,onaverage,moreproductive thantheirnon-exportingcounterparts(seeBox4.1).InananalysisoftheproductionandR&Dcharacteristicsoffirmsintheyearsjustbeforeandjustafterthedecisiontoexportgoodsandservicesabroad,therewasalsoanobservableself-selectioneffectasproductivitywasalreadyconsiderablyhigher in theyearsprior toexporting.Anotherrelatedexplanationastowhycertainfirmspayhigherwagesthanothersistheimpactofforeigninvestment.FortanierandKorvorst(2009)concludethatforeign owned enterprises pay significantly higher wages than domesticallyownedenterprises,mostlikelybecauseofhigherproductivitylevels,andinorderto prevent labour migration and the ensuing transfer of superior technicalknowledge.
Box B4.1: Economic, R&D and employee differences between exporters and non-exporters.There are many factors that influence a firm’s decision to start exportingproducts.StatisticsNetherlandshascarriedoutathree-wayanalysistoseetowhat extent exporting companies differ significantly from non-exportingcompanies,aswellasidentifyingtheunderlyingfactorsthatplayedaroleinthedecisiontostartexporting(cf.Genee&Fortanier,2010).Usingourmatchedemployer-employeedatabase,thefirstdescriptiveanalysisshowedthatin2007approximately7%ofthetotalDutchenterprisepopulationcanbedefinedasanexporter,whichalsoincludesthosecompaniesthatbelongto a corporate group of which one or more affiliates is an exporter. For thesecond ‘event-history’ analysis for the period2002–2007, a representativesampleconsistingof2%of the totalDutchenterprisepopulationwasfurtherdecomposed into the following groups: exporters, non-exporters, startingexporters,stoppingexporters,andchangingexporters.Itbecameapparentfromthese analyses that exporting and non-exporting companies differ in thefollowing ways: exporters are larger, more innovative and more efficient (intermsofnetturnoverandaddedvalue)thannon-exporters.Particularattentionwaspaidtothegroupofstartingexportersandtheirdevelopmentrightbefore

Internationalisation Monitor 2010 119
andafter thedecision tostartexporting. Itwas foundhere thatself-selectionplays an important factor; in the period before export started exporters aresubstantially larger (turnover), more innovative (R&D), more productive(labourproductivity),moreflexible(shareoftemporarilyemployedworkers),andspenda largerpercentageof their turnoveronmarketingandsales thannon-exporters.Inthethirdanalysisagroupofstartingandnon-exporterswassampledfromthematcheddatasetbymeansofpropensityscorematching.Accordingly,theselectednon-exportingcompanieshadthehighest‘exportpotential’;theyweresimilartostartingexportersoneconomicandR&Dcharacteristics,buthavenot(yet)madethedecisiontostartexporting.Eventhoughthismethodresultedinasampleofcomparablenon-andstartingexportersfromtheperiod2002–2007,whenmatchingtheseenterprisestotheircorrespondingsocialstatisticsitwasfoundthattherearestillsomeobservabledifferencesintermsofthecompositionof their labour force. For example, potential exporters (non-exporters with ahighexportpotential)have,onaverage,aconsiderablylowertotalnumberofemployees (enterprise size) than starting exporters, of which a substantiallyhigher percentage are employees with flexible work contracts. Moreover,potentialexportersalsoemploymarginallymorepart-timeworkerscomparedwithstartingexportersandthereforealsohavealowerpercentageoffull-timersin their labour force. Potential exporters also employ a higher percentage oflow-paid employees and a slightly higher percentage of job-starters (i.e.graduatesstartingtheirfirstjobonthelabourmarket)andmorenativeDutchemployeesthanstartingexporters.Whensectorandcompanysizeweretakenintoaccountitbecameapparentthattheobserveddifferencesbetweenstartingandpotential exportingfirmswithrespect to enterprise size and workforce composition are strongest in thewholesale and production sectors, as well as in small and large companies,fewerthan50andmorethan250employeesrespectively.Source: Genee and Fortanier (2010)
Onlyafewstudieshaveinvestigatedtheperformancecharacteristicsofimportingfirms,whilethereisanextensivebodyofresearchonthesuperiorcharacteristicsofexportingfirms.Althoughthefocusintheliteratureisonexports, importshavealsobeenshowntobeanimportantwagedeterminant(e.g.Martinsetal.,2009).Furthermore,usingadatasetofUSenterprise-leveldata,Bernardetal.(2005)findthatthemostglobally-engagedfirms,i.e.two-waytraders,dominatetradeflowsandemploymentattradingfirms.However,mostoftheempiricalliteratureisbasedonfirm-leveldataratherthanonlinkedemployer-employeedata.Thismeansthattherearefewstudiesthathaveconsidered whether the observed export (or import) wage premium is still inevidence if employee characteristics are taken into account which can influence

120 Statistics Netherlands
theirproductivity,andthereforetheirwages.Itmightbeexpectedthattheimpactof exportsonwages is considerably reducedwhencontrolling for theeffectsofemployer and employee characteristics. Recent studies (e.g. Schank et al., 2004;Munch & Skaksen, 2006) have tested whether comparable workers (e.g. sameeducationlevel)areindeedbetterpaidwhenworkingforacomparablefirmthatexports(e.g.sameindustryorsizeclass).Infact,Schanketal.(2004)findthatthe“exportwagepremiumsvanishiflinkedemployer-employeedatainsteadofplant-level data are used” (pg.11). However, Munch and Skaksen (2006) find that theexportwagepremiumisstillobservable,evenwhencontrollingforthepossibleselectionofhighqualityworkersintoexportingfirms.Itisthereforenotsufficienttomakeasimplecomparisonbetweenwagespaidatexporting,importingandtwo-waytradingfirmsinordertoempiricallyestablishtheextenttowhichandhowtradingaffectswagesintheNetherlands.Firstofall,other factorsareknownorexpected toaffectbothwagesand thepropensityofenterprises to start exporting and/or importing, including industry, enterprisesize,andforeignownership.Inaddition,theeffectofemployeecharacteristicshasto be taken into account in order to establish if wage premiums are indeedattributabletotradingactivities.
4.3 Data and methodology
In order to assess the consequences of economic globalisation, in the form oftradingactivities,foremployeesworkingintheNetherlands,webuiltanintegratedemployer-employee dataset that allows us to link employee-level information(wages, gender, age, education level etc.) with employer-level information,includingenterprisesize,activitysector,andlocusofcontrol(foreignvs.domestic).Thelinkedemployer-employeedatasetfortheNetherlands,originallycreatedfor2000–2005forforeignandDutchenterprises,wasnowupdatedfor2006–2007andenrichedwithinformationontradingstatus(importand/orexportactivities)fromtheInternationalTradedata,andtheeducationlevelofemployees,estimatedattheenterprise level from the Social Statistics Database (SSB). More detailedmethodological information on the dataset can be found in the2009InternationalisationMonitor(FortanierandKorvorst,2009).The resulting employer-employee dataset presented in this paper comprises asampleofanaverageof373,000enterprisesfromtheGeneralBusinessRegisterineach year (2002–2007) (total number of observations is 2,238,274) for which theSocialStatisticsDatabase(SSB)employmentdatawereavailable.Themicrodataintegration was done at enterprise level with the unique enterprise identifier(BEID) as key variable. In this linked sample of enterprises in2007, there areapproximately12%exporters,17%importers,10%two-waytradingfirmsand61%non-traders.

Internationalisation Monitor 2010 121
Wefirstpresenta setofdescriptive tables inorder toexplore thedifferences inwagesbetweenexporters,importersandtwo-waytraders.Thesetablescomparetheaverageannualwagelevelsbetweenthesethreegroupsoffirmsin2007,whichissubsequentlybrokendownbyindustry,sizeclass,andlocusofcontrol(i.e.iftheenterprise is Dutch or foreign owned). We then combine the various factorsinfluencingwagesinaregressionanalysis, inordertoestablishwhethertradingfirmspayhigherwagesifallothervariablesarecontrolledfor,usingthefollowingregressionmodel:
This regressionequationcontainsvariables for several employeecharacteristics,including the percentage of highly-educated employees (i.e. tertiary education);female employees; 50+ employees; and native Dutch employees as firm-levelaggregatesforeducation,gender,age,andethnicity,respectively.Theequationalsoincludesvariousfirmlevelvariables,includingasetofindustrydummies(δi)anda measure of firm size (log employees). International orientation is assessedthrough binary variables ‘foreign’ (foreign ownership), importer, exporter, and2-way-trader (note that the last variable in essence represents the interactionbetweenthebinaryvariables‘importer’and‘exporter’).Asetofyeardummies(αt)controlsfortimefixedeffects.
4.4 Results
Basedonthelinkedemployer-employeedatasetfortheNetherlands,enrichedwithinformationontradingfirmsandtheeducationlevelofemployees,wedeterminedwhether annual wage levels and labour force composition differ substantiallybetween exporters, importers, two-way traders and non-trading firms. The firstresults are displayed in TableB4.1, indicating the differences in sample meansbetweenthedifferentgroupsoffirms,usinganindependentt-test.Thetableshowsthatbothexportersandtwo-waytradingfirmspayhigherwagesthanimporters,whilethedifferencebetweenexporters/two-waytradersandnon-tradingfirmsisminimal.Thefactthatexporterspayhigherwagesisinlinewiththe theoretical observation that exporters are able to afford the cost of enteringforeignmarketsbecause theyaremoreproductive ingeneraland thereforealsopayhigherwages(accordingtothefairwage-efforthypothesis(AkerlofandYellen,1990)).However, thefact that importerwagesare lowerthanthewagesofnon-tradersissurprising:itmaybeexpectedthatsincetheNetherlandsisanadvancedeconomy,primarily labour intensive, lowvalueaddedinputsare imported,and

122 Statistics Netherlands
the more advanced (and hence higher paying) work would remain in theNetherlands.Weexplorethisissueinmoredetailinthesubsequenttables.
Table B4.1 Average differences between exporters, importers, two-way traders and non-traders, 2007
Exporter Importer Two-waytrader
yes no t-stat yes no t-stat yes no t-stat
1,000 euro 1,000 euro 1,000 euro
Averagewages 43.3 42.2 –7.30***40.0 42.8 20.99*** 43.9 42.1 –11.06***
% % %
Shareoffemaleemployees 27 37 74.67*** 34 37 17.21*** 28 37 68.73***Shareofhigh-paidemployes 29 28 –9.82*** 25 28 30.09*** 30 27 –13.40***Shareofolder(50+)employees 25 27 16.34*** 24 27 23.07*** 25 27 15.30***ShareofDutchnativeemployees 83 85 12.99*** 84 85 12.52*** 83 85 14.65***Shareofstarters 24 28 23.74*** 26 27 11.11*** 23 28 28.21***Shareofhigh-skilledemployees 46 42 –12.71*** 44 43 –3.11*** 46 42 –13.75***Labourturnover 40 74 56.52*** 49 74 39.91*** 37 74 64.45***
log log log
Numberofemployees 0.91 0.48 –143.28***0.85 0.47 –153.89*** 0.96 0.48 –146.49***
***p<0.01;**p<0.05;*p<0.10
Inadditiontowages,wealsoexploreddifferencesinotheremployeecharacteristicssuchasgenderandage,aswellashumancapitalvariablessuchaseducationlevel.Finally,twoadditionalfirm-levelvariableswereincluded,namelylabourturnover(job-outflow rate) and the logarithm of the average number of employees(enterprisesize).Atfirstglance,exportersandtwo-waytradersareverysimilarwithrespecttothecompositionoftheirworkforce,butonenterpriselevel,two-waytraderstendtohaveslightlymoreemployeesandasomewhatlowerlabourturnover.Therearehowever some significant differences between firms that do not trade or onlyimport and firms that do have export activities. With regard to the employeecharacteristicsofimporters,itisparticularlythepercentageofhighlypaidworkersthatstandsout,asitissignificantlylowercomparedwiththeothergroupsoffirms.Asexpected,exportersand two-way traders thatcapitaliseon theircompetitiveadvantages abroad and that therefore have to overcome the various fixed andvariablecostsemployrelativelyhighly-educatedandhighly-paidemployees.Bothimporters and non-traders have a higher labour turnover and fewer employeesthanexportersandtwo-waytraders.However,thedifferencesbetweennon-traders

Internationalisation Monitor 2010 123
and firms with export activities are much greater than the differences betweenimportersandfirmswithexportactivities.So far these resultsdonot control forfirmheterogeneity.Since it isknown thatlabourproductivityandwagescanvarygreatlyacrossindustries,notcontrollingfor industrieswoulddistort thecomparisonbetweennon-tradingfirmsand thegroupsoftradingfirms.Numerousstudieshavealsoreportedapositivecorrelationbetweenfirmsize,exportsandproductivity.ThiswasalsoseeninanearlierstudybyStatisticsNetherlandswhichincludedtheentireDutchenterprisepopulation,where in2007 approximately 67percent of larger firms had export activities(>250employees),whereasofthemedium-sizedandsmallerfirms(<50employees)51percentand10percentrespectivelyhaveexportactivities(GeneeandFortanier,2010). Furthermore, in earlier SN studies (c.f. Fortanier and Korvorst, 2009) asignificant wage differential was also observed between Dutch and foreigncontrolledfirms.Inordertoadequatelycomparewagesbetweentradingandnon-tradingfirms,weneedtocontrolatleastforthesefactors.Tables4.2,4.3and4.4doexactlythat.
TableB4.2showstheaverageannualwagelevelofexporters,importers,two-waytradersandnon-tradersbrokendownbyindustry.Generally,evenwhencorrectingforindustry,wagesintradingfirmsarehigherthantheaverageannualwagespaidbynon-tradingfirms.Wagesaresignificantlyhigherparticularlyinthefoodandbeverage,tradeandrepairsandfinancialintermediationindustries.
Table B4.2 Average wage differences between exporters, importers, two-way traders and non-traders by sector, 2007
Exporter Importer Two-waytrader
yes no t-stat yes no t-stat yes no t-stat
1,000 euro 1,000 euro 1,000 euro
Agriculture,forestry,fishing 29.9 25.3 –12.44*** 29.2 25.4 –12.25*** 31.3 25.4 –14.51***Mining,quarrying 62.7 56.2 –0.89 61.6 56.7 –0.68 63.4 55.7 –1.05Food,beverages 37.8 25.6 –24.18*** 36.1 25.5 –22.81*** 38.4 25.8 –24.42***Paper,paperprod.,publishers 39.2 36.1 –4.74*** 39.3 36.2 –4.64*** 39.7 36.3 –4.75***Chemicals/plastics 41.2 42.0 0.61 40.8 43.3 1.62 41.241.9 0.48Metalproducts 35.4 33.7 –4.68*** 34.8 34.0 –2.34** 35.5 33.8 –4.80***Machinery,equipment 38.9 36.8 –3.61*** 38.6 37.3 –2.19** 38.9 37.1 –2.95**Otherindustryandutilities 36.6 33.4 –9.50*** 35.7 33.6 –6.10*** 36.8 33.5 –9.76***Construction 38.9 34.4 –13.73*** 36.8 34.3 –10.82*** 39.3 34.4 –14.10***Trade,repairs 40.4 29.1 –79.12*** 36.0 29.1 –53.42*** 40.9 29.3 –78.38***Hotels,restaurants 26.3 20.8 –7.53*** 22.4 20.8 –5.95*** 26.8 20.8 –7.68***Transport,storage,comm. 43.9 37.6 –13.82*** 43.0 37.6 –12.86*** 44.3 37.8 –12.60***Financialintermediation 73.5 63.3 –8.47*** 72.1 63.3 –9.03*** 75.2 63.3 –8.84***Businessservices 54.2 54.7 0.84 52.8 54.9 4.11*** 56.4 54.6 –2.80*Otherservices 40.6 36.7 –4.49*** 36.4 36.8 0.69 41.5 36.7 –4.38***
***p<0.01;**p<0.05;*p<0.10

124 Statistics Netherlands
There are also a number of exceptions. Wages in the chemicals and businessservicesindustriesareslightlylowerforexportingandtwo-waytradingfirmsthanfor their non-trading counterparts, but the wages of importers are significantlylower.Given the largenumberoffirms in thebusinessservicessector, thismaypartlyexplainwhyinTableB4.1thetotalaverageimporterwagesarelower.
Table B4.3 Average differences between exporters, importers, two-way traders and non-traders by size class 1), 2007
Exporter Importer Two-waytrader
yes no t-stat yes no t-stat yes no t-stat
1,000 euro 1,000 euro 1,000 euro
Average wages
Smallenterprises 43.1 42.2 –5.61*** 39.6 42.9 23.73*** 43.8 42.2 –9.28***Mediumenterprises 43.9 40.3 –8.32*** 43.8 39.8 –9.29*** 44.1 40.2 –8.84***Largeenterprises 45.9 39.0 –11.41*** 45.3 38.0 –13.44*** 46.1 39.0 –11.72***
% % %
Share of female employees
Smallenterprises 28 37 65.87*** 35 36 9.85*** 28 37 59.38***Mediumenterprises 24 43 41.99*** 26 44 37.84*** 24 42 41.11***Largeenterprises 30 58 33.18*** 34 59 28.06*** 29 58 32.87***
Share of Dutch native employees
Smallenterprises 84 85 9.78*** 84 85 9.43*** 83 85 11.10***Mediumenterprises 81 81 0.34 81 81 1.65* 81 81 0.48Largeenterprises 80 82 3.70*** 81 82 3.21** 80 82 3.52***
Share of high-skilled employees
Smallenterprises 44 42 –5.08*** 42 44 4.64*** 45 43 –5.43***Mediumenterprises 47 38 22.24*** 46 37 –14.95*** 47 38 –17.98***Largeenterprises 50 43 –4.50*** 49 42 –4.74*** 50 43 –5.14***
Labour turnover
Smallenterprises 41 74 50.87*** 50 74 34.93*** 38 74 57.97***Mediumenterprises 31 77 –16.98*** 33 81 20.53*** 30 77 22.90***Largeenterprises 32 63 7.61*** 33 69 8.16*** 30 64 9.09***
***p<0.01;**p<0.05;*p<0.10
1) Smallenterprises<50employees;medium-sizedenterprises≥50and<250employees;largeenterprises≥250employees.
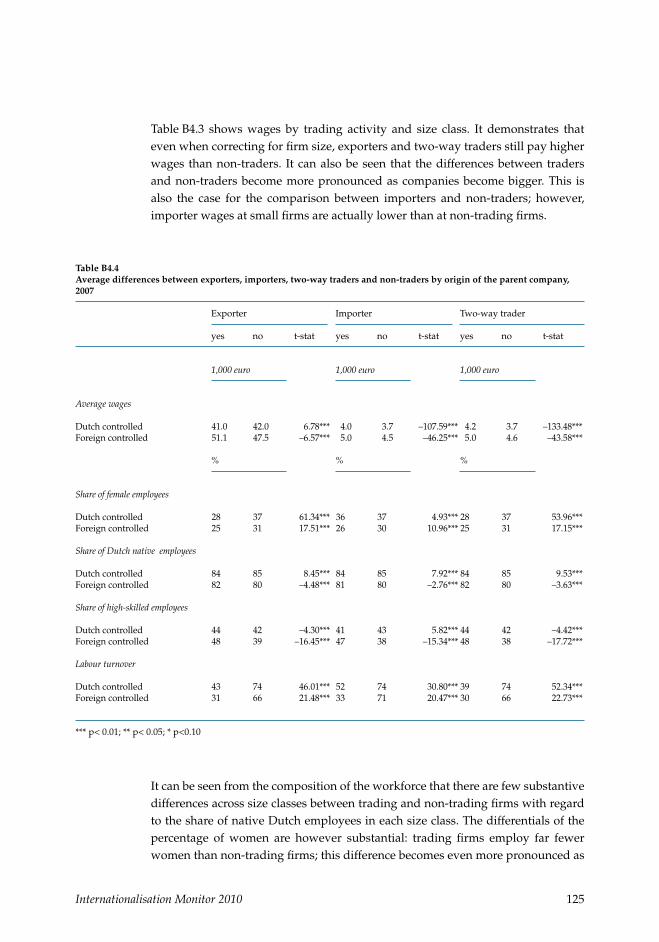
Internationalisation Monitor 2010 125
TableB4.3 shows wages by trading activity and size class. It demonstrates thatevenwhencorrectingforfirmsize,exportersandtwo-waytradersstillpayhigherwages thannon-traders. Itcanalsobeseenthat thedifferencesbetweentradersandnon-tradersbecomemorepronouncedascompaniesbecomebigger.This isalso the case for the comparison between importers and non-traders; however,importerwagesatsmallfirmsareactuallylowerthanatnon-tradingfirms.
Table B4.4 Average differences between exporters, importers, two-way traders and non-traders by origin of the parent company, 2007
Exporter Importer Two-waytrader
yes no t-stat yes no t-stat yes no t-stat
1,000 euro 1,000 euro 1,000 euro
Average wages
Dutchcontrolled 41.0 42.0 6.78*** 4.0 3.7 –107.59*** 4.2 3.7 –133.48***Foreigncontrolled 51.1 47.5 –6.57*** 5.0 4.5 –46.25*** 5.0 4.6 –43.58***
% % %
Share of female employees
Dutchcontrolled 28 37 61.34*** 36 37 4.93***28 37 53.96***Foreigncontrolled 25 31 17.51*** 26 30 10.96***25 31 17.15***
Share of Dutch native employees
Dutchcontrolled 84 85 8.45*** 84 85 7.92***84 85 9.53***Foreigncontrolled 82 80 –4.48*** 81 80 –2.76***82 80 –3.63***
Share of high-skilled employees
Dutchcontrolled 44 42 –4.30*** 41 43 5.82***44 42 –4.42***Foreigncontrolled 48 39 –16.45*** 47 38 –15.34***48 38 –17.72***
Labour turnover
Dutchcontrolled 43 74 46.01*** 52 74 30.80***39 74 52.34***Foreigncontrolled 31 66 21.48*** 33 71 20.47***30 66 22.73***
***p<0.01;**p<0.05;*p<0.10
Itcanbeseenfromthecompositionoftheworkforcethattherearefewsubstantivedifferencesacrosssizeclassesbetweentradingandnon-tradingfirmswithregardtotheshareofnativeDutchemployeesineachsizeclass.Thedifferentialsofthepercentage of women are however substantial: trading firms employ far fewerwomenthannon-tradingfirms;thisdifferencebecomesevenmorepronouncedas

126 Statistics Netherlands
companies become bigger. With the exception of small importers, trading firmshave a more highly-educated workforce, although the differentials of smallexportersandtwo-waytradersarealsoverysmall.However,itmustbetakenintoaccountthatinverysmallfirmsourmeasureofeducation(i.e.,thepercentageofhighly-educatedemployeesperfirm)becomessensitivetotheeducationofasingleworker.Finally,labourturnover(annualjoboutflowrate)isconsiderablylowerattradingfirms,withthelargestdifferentialsformedium-sizedenterprises.Ontheotherhand,whilelabourturnoverisloweratsmallimportersthanatnon-traders,it is still considerably higher compared with the labour turnover of firms withexportactivities.Finally,TableB4.4showsthatforeignownershipoffirmshasasignificanteffectontheannualwagelevel.Whiledifferencesbetweentradingandnon-tradingfirmsaresmall,thedifferencesbetweenDutchownedandforeigncontrolledenterprisesaremuchlarger,regardlessofthetradingactivitiesoffirms.Thedifferentialswithregardtothecompositionoftheworkforceshowasimilarpattern,andresemblethe results reported in last year’s Internationalisation Monitor (Fortanier &Korvorst,2009).
4.5 Regression results
TableB4.5presents the resultsof the regressionanalyses.Thebivariatefindingsreportedabovearegenerallyconfirmedbytheseresults.Allthemodelscontrolfortimeandindustryeffects,andshowthattheoveralleffectoffirmsizeonwagesispositive, though not very large. In addition, we see that primarily the level ofeducationandgenderareimportantdeterminantsofwages.Wecancalculatefromtheresultsthatiftheshareofhigh-skilledemployeesincreasesby10percentagepoints,averagewagesincreaseby5.6%.Likewise,iftheshareoffemaleemployeesincreasesby10percentagepoints,averagewagesdecreaseby3%.
Theregressionresultsalsopointtothepresenceofwagepremiumsassociatedwithinternationalactivity.Firstofall,wefindthat,after controlling for the level of education and other employee characteristics 1),foreigncontrolledfirmspay10%higherwagesthan domestic firms. Similarly, we find a 7% wage premium for importers(including two-way traders) and a 5% wage premium for exporters (includingtwo-way traders). It should be noted however that the results, particularly forexporters,werenotextremelysignificant,whichmeansthat in lightof the largenumber of observations in our dataset, the effect may be not be practicallymeaningful.

Internationalisation Monitor 2010 127
Table B4.5 Regression results (dependent variable logWage per employee)
(1) (2) (3) (4) (5)
Constant 4.35*** 4.34*** 4.38*** 4.38*** 4.37*** 8,325.29 3,318.86 2,490.12 2,500.30 2,497.05Log_employees 0.02*** 0.02*** 0.03*** 0.02*** 0.01*** 90.85 57.91 61.39 42.59 25.95Shareofhigh-skilledemployees 0.24*** 0.23*** 0.23*** 0.22*** 235.17 223.85 218.78 203.28Shareoffemaleemployees –0.13*** –0.13*** –0.12*** –124.10 –122.33 –116.19Shareofolder(50+)employees 0.00*** 0.00** 0.00 –2.82 –2.39 0.01ShareofnativeDutchemployees –0.01*** –0.01*** 0.00 –7.08 –4.19 –0.96Foreigncontrolledenterprise 0.04*** 0.04*** 45.86 38.06Importer 0.02*** 23.70Exporter 0.01*** 6.87Two-way-trader 0.01*** 4.27
RSquare 0.22 0.30 0.34 0.35 0.36F 30,332.26*** 4,995.24*** 5,284.81*** 5,204.98*** 4,824.12***
T-valuesbelowthecoefficients.Allmodelsincludetimeandindustrydummies(notreported).
4.6 Discussion and conclusion
Thispaperanalyses thedifference inaveragewagelevelperemployeebetweentrading and non-trading firms, explicitly taking employee characteristics intoaccount. Using the term “traders” to identify companies that either export orimport goods or services and introducing the term “two-way traders” forcompaniesthatdoboth,wecontinuebylookingatthecompositionoftheworkforceasanexplanationastowhy(two-way)tradingfirmspayhigherwagesthantheirnon-tradingcounterparts.Usinglinkedemployer-employeedataforthe2002–2007period,wefindthatonaverage,exporters,importersandtwo-waytraderspaysignificantlyhigherwagescompared with non-trading firms. This is partly a reflection of the higherproductivity levels of trading firms (necessary to counteract the cost of doingbusinessoverseas),butpartlyalsoareflectionofthedifferencesinthecompositionoftheworkforceofexportersandimporters.Forexampleexportersandtwo-waytradersemployrelativelyhighly-educatedemployees,andfewerwomen.Similarly,differences in other firm characteristics influence the wage differential betweentradingandnon-tradingfirms.Forexample,firmsengagedinexportsorimportsaremuchmorelikelytobeforeignowned,andithasbeenestablishedthatforeign

128 Statistics Netherlands
subsidiaries pay higher wages e.g. to prevent labour turnover (c.f. the2009InternationalisationMonitor).Yet,evencontrollingforthosedifferences,weestablishedwagepremiumsof7%and5%forimportersandexporters(includingtwo-waytraders)respectively.However, we also observed that the results were not extremely significant,particularlyforwagepremiumforexporters,whichmeansthatinlightofthelargenumber of observations in our dataset, the effect may be not be practicallymeaningful.Thisisinlinewithrecentfindingsthatsuggestthatthewagepremiumiswhollytheresultofdifferencesinthecompositionoftheworkforceatexportingandnon-exportingfirms.Furtherresearchattheindividualemployeelevelshouldhelpprovidefurtheranswers.
References
Akerlof, G. A., Yellen, J.L., 1990. “The fair wage–effort hypothesis andunemployment.”QuarterlyJournalofEconomics105,255–283.
Bernard,A.,Jensen,J.,2004.“WhysomefirmsExport.”ReviewofEconomicsandStatistics86,561–569.
Bernard,A.,Jensen,J.,Schott,P.,2005.“Importers,exportersandmultinationals:AportraitoffirmsintheUSthattradegoods.”CenterforEconomicStudies(CES).
Fortanier, F. and Korvorst, M. (2009). “Effects of globalisation: wage differencesbetweenemployeesatDutchandforeigncontrolledenterprisesintheNetherlands.”InternationalisationMonitor2009,A5,p.71–80,StatisticsNetherlands.
Genee, S., Fortanier, F., (2010) Internationalisation and productivity, StatisticsNetherlands:Heerlen/DenHaag.
Martins,PedroS.&Opromolla,LucaDavid,2009.“Exports,ImportsandWages:EvidencefromMatchedFirm-Worker-ProductPanels.”IZADiscussionPapers4646,InstitutefortheStudyofLabor(IZA).
Munch,J.,Skaksen,J.,2006.“HumanCapitalandWagesinExportingFirms.”IZADiscussionPapers2409,InstitutefortheStudyofLabor(IZA).
Schank, T., Schnabel, C., Wagner, J., 2004. “Exporting firms do not pay higherwages,ceterisparibus.Firstevidencefromlinkedemployer-employeedata.”IZADiscussionPapers1185,InstitutefortheStudyofLabor(IZA).

Internationalisation Monitor 2010 129
Schank,T.,Schnabel,C.,Wagner,J.,2006.“Doexportersreallypayhigherwages?First evidence from German linked employer–employee data.” Working PaperSeriesinEconomics,UniversityofLüneburg.
Notes in the text:1) Please note that the 15% wage premium for foreign controlled firms as reported in last year’s
InternationalisationMonitor(FortanierandKorvorst,2009)didnotcontrolforemployeecharacteristics.

Internationalisation Monitor 2010 131
C1 International trade in goods by enterprises
Introduction
The aim of the tables and graphs in chapter C1 is to describe the pattern ofinternational trade in goods of enterprises in the Netherlands. This is ademonstration of recent developments in the international trade statistics andprovidesfurtherinsightintothecompositionandevolutionofthepopulationofresident traders. International trade flows between 2002 and 2008 are enrichedwithenterprisecharacteristicssuchaseconomicactivity,sizeclassandforeignordomesticcontrol.Thematchingprocessanditsresultsarestillunderdevelopment,whichimpliesthatthefindingspresentedinthischapterarepreliminary.
Theinternationaltradeingoodsstatisticsdescribethevalueandvolumeofgoodscrossing the Dutch border on a monthly basis. Approximately 10thousandcommodities and around 250trading partners can be distinguished. To obtainthesedata,StatisticsNetherlandsconductsamonthlysurveyonintracommunitytradeandobtainsinformationonextra-EUtradeflowsmainlyfromcustoms.
Around80percentofimportsand75percentofexportflowscanbeattributedtoenterprises registered in the General Business Register (GBR). However, sometrade flows cannot be assigned to an enterprise in the GBR. Some internationaltraders are not registered in the GBR, for instance because they have noestablishmentintheNetherlandsorbecausetheyarenotrequiredtoregistertheireconomicactivities(e.g.farmersormedicalprofessionalsorattorneys).
Changing methodology– Themethodologybehindthematchingprocesshaschangedoverthepastfew
years.Inaddition,newsourcesofinformationhavebecomeavailablewhichareofconsiderablevalueinthematchingprocess.Duetothesedevelopments,thegeneralbusinessregisterunderwentsignificantchangesin2006,whichimpliesthatthequalityofmatchingtraderstoenterprisesissignificantlybetterasofreferenceyears2007and2008.
– The method of determining whether an enterprise is foreign controlled orDutch controlled changed in2005 to the concept of the Ultimate ControllingInstitute (UCI) as defined by the FATS Regulation. This causes a slightreinforcementofthetrendasof2006.
– The distinction between re-exports (belongs to Dutch trade according toNational Concept) and quasi-transit trade (does not belong to Dutch tradeaccordingtotheNationalConcept)haschangedasof2008.Theneteffectofthis

132 Statistics Netherlands
methodologicalchangeisadownwardrevisionofthetotaltradelevel,whereexportsdecreasedsomewhatmorestronglythanimports.
(Dutch) enterprise: an enterprise is the actual transactor in the productionprocess,characterisedbyindependenceindecisionsabouttheprocessandbyprovidingproductstoothers.Asaresultofthedefinitionandparticularlytherequired independency, one enterprise can comprise several local units orseverallegalunits.
Foreign controlled vs. Dutch controlled enterprise: The Ultimate ControllingInstitutional Unit (UCI) is defined as the institutional unit, proceeding up aforeignaffiliate’schainofcontrol,whichisnotcontrolledbyanotherinstitutionalunit.‘Foreigncontrolled’meansthattheresidentcountryoftheUCIisacountryotherthantheNetherlands.‘Control’meanstheabilitytodeterminethegeneralandstrategicpolicyofanenterprisebychoosingappropriatedirectors.TheUCIis determined on a yearly basis by combining enterprise information fromvarioussources.

134 Statistics Netherlands
1.1 Distinguishing international trade in goods between Dutch and foreign controlled enterprises in the Netherlands
TableC1.1showsthevalueofinternationaltradeingoodsthattookplaceinthepastsevenyears.Between2002and2008theDutchinternationaltradeingoodsincreased by approximately 10percent annually. In2008, this resulted in a totalimport value of 336billion euros. The total export value of goods in2008 was370billioneuros.Thisresultedinatradesurplusof35billioneuros.
AsignificantpartofDutchinternationaltradeiscarriedoutbyforeigncontrolledenterprises. In2002 approximately 40percent of Dutch trade was conducted byforeigncontrolledenterprises.Sincethen,theshareoftradeengagedinbyforeigncontrolled enterprises has increased steadily. However, in terms of populationcount, foreign controlled enterprises make up approximately 5percent of alltrading enterprises. This implies that the vast majority of traders are Dutchcontrolled.
In2008, about 54percent of the total import value of goods was attributed toforeign controlled enterprises and 46percent to Dutch controlled enterprises.Comparedwith2002,thisimpliesthatthebalancehasshiftedtowardsamajorityofimportscarriedoutbyforeigncontrolledenterprises.
With regard toexports, the share that foreigncontrolledenterprisesmakeup isgenerallysomewhatsmaller.Still,in2008theirshareinthetotalexportvaluewasalmostaslargeasthatofdomesticallycontrolledenterprises.
Theshareofre-exportscarriedoutbyforeigncontrolledenterprisesissignificantlyhigherthanforgoodsexportsasawhole.In2008,roughly60percentofre-exportswashandledby foreigncontrolledenterprises.Achange in thedefinitionof re-exports in2008 explains the marked decrease in re-exports and the increase inforeignownershipbetween2007and2008.
Re-exports are defined as goods, in temporary custody of a Dutch resident,which are transported through the Netherlands without any significantindustrialprocessing.Re-exportsaregoodsthatareclearedforcustomsby,forinstance,Dutchdistributioncentresanddistributedtoothercountries(mostlyEuropeanMemberStates).Contrarytoquasi-transittrade,re-exportsarepartofDutch international trade (National Concept). Quasi-transit trade refers togoodsenteringandexitingtheNetherlands,withoutdomesticownership.Asof2008,thedefinitionofre-exportshasbeenexpandedtoincludetradeconductedbyDutchaffiliatesofforeignenterprises.

Internationalisation Monitor 2010 135
Table C1.1 International trade in goods; foreign controlled versus Dutch controlled enterprises
Import ofwhich Export ofwhich Re-export ofwhich value value value
Dutch foreign Dutch foreign Dutch foreign controlled controlled controlled controlled controlled controlled
billion euro % billion euro % billion euro %
2002* 205.6 60 40 232.7 60 40 98.1 53 472003* 206.9 58 42 234.2 60 40 98.0 54 462004* 228.2 56 44 255.7 59 41 110.9 54 462005* 249.8 49 51 281.3 54 46 122.0 44 562006* 285.4 49 51 319.0 53 47 140.0 44 562007* 307.3 48 52 347.5 54 46 155.3 45 552008* 335.9 46 54 370.5 51 49 154.8 40 60

136 Statistics Netherlands
1.2 International trade in goods organised by size class
Since2002,theexportsofgoodsofbothSMEsandlargeenterprisesincreasedbyabout8percentannually.ImportsoflargeenterprisesincreasedmorestronglythanthatofSMEsbetween2002and2008.
Whentradingenterprisesaredifferentiatedintermsofsize,foreignownershipismostoftenacharacteristicoflargeenterprises.Largeenterprisesimportedgoodstoavalueof65billioneurosin2002.Approximately59percentoftheseimportsbelongedtolargeimportersunderforeigncontrol.Theremaining41percentwereimportedbyDutchownedenterprises.Between2002and2008theshareofforeignowned importers in the total imports of large enterprises (115billion euros)increasedslightly.
SMEsimportedgoodstoavalueof109billioneurosin2002.Themajorityoftheseimports were imported by Dutch owned SMEs. Only 30percent of these SMEimportswerecarriedoutbySMEsunder foreigncontrol. In2008 thissharewassignificantlyhigher,namely44percent.
Theshareofexportscarriedoutbyforeigncontrolled,largeenterprisesdecreasedbetween2002and2008.In2002,approximately59percentoftheexportsoflargeenterprises belonged to large foreign controlled enterprises. Subsequently thissharedecreasedto54percentin2008.Thiswasnotduetoadecreaseinthenumberof foreigncontrolledexporters(onthecontrary)butbecausetheexportscarriedoutbyDutchownedexportershadincreasedinvalue.
ForSMEexportersofgoods,theshareofexportscarriedoutbyforeigncontrolledSMEshasincreasedsince2002.Ofthetotalexportsof157.2billioneurosin2008,roughly58percentwasexportedbydomestically-ownedSMEsand42percentbyforeign controlled SMEs. In2007 there was a slight increase in the amount ofexportsthatcouldnotbeattributedtoeithertypeofenterprise(102billioneuros).Thisisdueachangeinthemethodologyofidentifyinginternationaltradersintheenterprisepopulation.
SME: small and medium-sized enterprises. An SME is an enterprise thatemployslessthan250people.Asmallenterpriseemployslessthan50peopleandamedium-sizedenterpriseemploysbetween50and249people.Enterpriseswithnoemployeeswereexcludedfromtheanalysis.

Internationalisation Monitor 2010 137
Table C1.2 Import and export value of goods by size class and origin of the parent company
SMEs ofwhich Large ofwhich Unknown1)
enterprises
Dutch foreign Dutch foreign controlled controlled controlled controlled
billion euro % billion euro % billion euro
Import value
2002* 109.2 70 30 65.1 41 59 31.32003* 108.4 70 30 63.1 42 58 35.42004* 114.9 66 34 67.0 40 60 46.32005* 125.6 57 43 75.9 39 61 48.32006* 138.4 57 43 87.4 45 55 59.62007* 135.6 59 41 100.2 40 60 71.52008* 151.2 56 44 115.0 37 63 69.7
Export value
2002* 106.5 72 28 80.1 41 59 46.12003* 108.0 72 28 74.1 42 58 52.12004* 114.3 69 31 77.3 42 58 64.12005* 131.5 62 38 79.4 42 58 70.42006* 139.3 60 40 95.2 47 53 84.52007* 140.0 63 37 105.3 46 54 102.22008* 157.2 58 42 120.6 46 54 92.7
1) SeeC1Introduction.
C1.2 Import and export value of goods by size class and origin of the parent company, 2008*
56%
44%
Imports, SMEs Imports, large enterprises
37%
63%
Exports, SMEs Exports, large enterprises
58%
42% 46%
54%
Dutch controlled Foreign controlled

138 Statistics Netherlands
1.3 International trade in goods by industry
TableC1.3.1showsthatenterprisesactiveinwholesaletradeandmanufacturingimported the bulk of goods in the period2002–2008. The total value of goodsimportedbythemanufacturingindustryin2008wasover80billioneuroswhereastheimportvalueofthewholesalesectoramountedtoalmost100billioneuros.
Morethanhalftheimportvalueofthemanufacturingsectorcouldbeattributedtoenterprisesunderforeigncontrol.In2002,Dutchcontrolledwholesalersimportedalmosttwo-thirdsofthetotalimportsofthatsector.By2008theshareofimportscarriedoutbyforeigncontrolledwholesalershadincreasedsignificantlytomorethan50percent. Ingeneral,Dutchcontrolledenterprises imported60percentofgoodsin2002.Thisbalanceshiftedinfavourofforeigncontrolledenterprisesby2008,whichimportedroughly54percentofallimports.
TableC1.3.2 shows that in2002 the total export value of goods amounted to233billioneuros,comparedwith371billioneurosin2008.In2002,about60percentoftheexportvaluecouldbeattributedtodomesticallyownedenterprises,whilein2008thebalancewasalmost50-50.
TheDutchmanufacturingindustryaccountedforroughly40percentofthetotalDutch export value in2008, while wholesalers exported 36percent. In themanufacturing sector, the share of exports carried out by foreign controlledenterprisesremainedrelativelystableintheobservedperiodataround53percent.As for imports, the impact of foreign controlled enterprises on the exports ofwholesalersincreasedsignificantly.

Internationalisation Monitor 2010 139
Table C1.3 Import and export value of goods by economic activity and origin of the parent company
2002* 2008*
Total ofwhich Total ofwhich value value
Dutch foreign Dutch foreign controlledcontrolled controlledcontrolled
billion euro % billion euro %
Import value 205.6 60 40 335.9 46 54
Economic activity (NACE Rev.1.1)
Agriculture,huntingfishing,miningandquarrying 2.0 89 11 1.4 83 17Manufacturing 54.1 42 58 81.2 44 56Energy,construction,retailtrade,hotelsandrestaurants 22.5 66 34 36.7 55 45Wholesaletrade 68.6 67 33 98.8 48 52Transport,storageandcommunications 17.0 56 44 35.4 43 57Financialintermediation 0.8 94 6 1.9 64 36Realestate,rentingandbusinessactivities 8.5 80 20 10.2 55 45Publicadministration,education,healthcare,socialworkandotherservices 0.8 89 11 0.7 90 10Unknown(seeintroduction) 31.3 – – 69.6 – –
Export value 232.7 60 40 370.5 51 49
Economic activity (NACE Rev.1.1)
Agriculture,huntingfishing,miningandquarrying 7.4 96 4 3.5 76 24Manufacturing 83.0 46 54 113.7 47 53Energy,construction,retailtrade,hotelsandrestaurants 8.5 76 24 28.1 77 23Wholesaletrade 64.4 63 37 98.7 50 50Transport,storageandcommunications 12.8 64 36 18.8 56 44Financialintermediation 0.5 98 2 1.1 72 28Realestate,rentingandbusinessactivities 9.8 78 22 13.4 53 47Publicadministration,education,healthcare,socialworkandotherservices 0.3 95 5 0.5 87 13Unknown(seeintroduction) 46.1 – – 92.7 – –

140 Statistics Netherlands
1.4 International goods traders in the Netherlands
Between 2002 and 2008, the enterprise population increased by approximately15percent.Intheobservedperiod,thenumberofenterprisesactiveinrealestate,renting and business activities increased by far the most, namely by more than60thousandenterprises.Theagricultural,hunting,fishing,miningandquarryingindustriesexperiencedadeclineinthenumberofactivefirmsbetween2002and2008.
Of all enterprises active in the Netherlands in2002, roughly 9percent exportedgoods abroad. In2008, this share had increased by one percentage point, to10percentoftheenterprisepopulation.Intermsofexportingenterprises,thiswasanincreaseofmorethan20percent,whichismorethantheaveragegrowthoftheenterprisepopulationbetween2002and2008.
Approximately 14percent of all enterprises imported goods in2002, which hadincreased to 16percent of the enterprise population in2008. The increase in thenumberofimportingfirmswasalsomuchlargerthantheaveragegrowthrateoftheenterprisepopulation.
Inbothyears,mostDutchenterpriseswereactive inenergy, construction, retailtrade, hotels and restaurants. However, only a few of these enterprises hadexportedgoodsabroad in thoseyears. Importingwassomewhatmorecommonpracticefortheseenterprises.Themajorityofgoodstradersarefoundinthewholesalesector(seeTables4and5in chapter B1). TableC1.4 shows that nearly half of all wholesale enterprisesexportedgoodsin2008,while57percentalsoimportedgoods.
Firms in the manufacturing industry comprise about 7percent of the totalenterprise population in2008. Many of these enterprises were involved ininternational trade,namely31percent reportedexportsand39percentalsohadimportsinthatyear.Enterprisesactiveinpublicadministrationoragriculturehadthelowesttradeincidencebetween2002and2008.
General business register: The general business register comprises allenterprisesintheNetherlandsthatmakeacontributiontothedomesticproduct.Severalcharacteristicsare recorded foreachenterprise, suchas theeconomicactivityandsizeclass(intermsofnumberofemployees).
Enterprise population: The number of active enterprises in the Netherlands.Basedonthegeneralbusinessregisterandincludesenterprisesthatemployoneor more people for at least 15hours a week. For certainsectors, such asagriculture,adifferentmethodologyisappliedtoobtainthenumberofactiveenterprises.

Internationalisation Monitor 2010 141
Table C1.4 Share of importers / exporters of goods in the enterprise population by economic activity
2002* 2008*
total impor- expor- total impor- expor- ters ters ters ters
% %
Total 693,430 14 9 797,840 16 10
Economic activity (NACE Rev.1.1)
Agriculture,hunting,fishing,miningandquarrying 103,145 3 3 93,065 6 5Manufacturing 46,440 33 28 47,600 39 31Energy,construction,retailtrade,hotelsandrestaurants 210,545 14 5 237,500 18 5Wholesaletrade 55,965 53 44 59,860 57 47Transport,storageandcommunications 27,850 8 8 29,045 9 8Financialintermediation 14,535 7 5 16,880 15 9Realestate,rentingandbusinessactivities 134,290 7 6 197,725 8 6Publicadministration,education,healthcare,socialworkandotherservices 100,660 4 2 116,165 6 2

Internationalisation Monitor 2010 143
C2 International trade in services by enterprises
Introduction
The aim of the tables and graphs in chapter C2 is to describe the pattern ofinternational trade in services by enterprises in the Netherlands. This is ademonstrationofrecentdevelopmentsintheinternationaltradeinservicesstatisticsandprovidesfurtherinsightintothecompositionandevolutionofthepopulationofresidenttraders.Internationaltradeflowsbetween2006and2008areenrichedwithenterprisecharacteristicssuchaseconomicactivity,sizeclassandforeignordomesticcontrol.Thematchingprocessanditsresultsarestillunderdevelopment,whichimpliesthatthefindingspresentedinthischapterarepreliminary.
ThestatisticsoninternationaltradeinservicesprovideinformationontheDutchimportandexportvaluesofservicesfromandtoaforeigncountryrespectively.Eachquarter,StatisticsNetherlands(SN)usesthebusinesssurveytocollectdataforalargepartoftheinternationaltradeinservices.However,dataon,forinstance,governmentservicesandtravelareobtainedbydifferentdatacollectionmethodsandarethereforenotavailablefortheanalysespresentedhere.
The data of the annotated tables in this chapter are based on integration of themicro data of the business survey of SN and the UCI. The services include:transportationservices,communicationsservices,constructionservices,insuranceservices, financial services, computer and information services, royalties andlicencefees,otherbusinessservicesandpersonal,culturalandrecreationalservices.
The business survey is according to the size value of the international trade inservices,basedontwogroups.Thefirstgroupcontainsenterpriseswithasignificantshareinthetotalsizevalueoftheinternationaltradeinservices.Theseenterprises(n=350) are integrally observed on enterprise group level. The second groupcontains enterprises with a less significant share in the total size value of theinternationaltradeinservices.Theseenterprisesarequestionedbasedonasamplesurveyofapproximately5000companiesatenterpriselevel.
TheUCIisdefinedastheinstitutionalunit,proceedingupaforeignaffiliate’schainofcontrol,whichisnotcontrolledbyanotherinstitutionalunit.Therefore,foreigncontrolledenterpriseshaveacentreofcontroloutsidetheNetherlands,whereasDutchcontrolledmeansthatthelocusofcontrolisintheNetherlands.‘Control’meanstheabilitytodeterminethegeneralandstrategicpolicyofanenterprisebychoosing theappropriatedirectors.TheUCI isdeterminedonayearlybasisbycombiningenterpriseinformationfromvarioussources.

144 Statistics Netherlands
2.1 Overview of international trade in services by origin of the parent enterprise
Graph C2.1 shows the evolution of the overall Dutch imports and exports ofinternational trade in services. In2008, the value of imported services was11percenthigherthanin2006.Forthesameperiod,theexportofservicesincreasedbyalmost12percent.Moreover,thegraphshowsthattheNetherlandshadatradesurplusin2006–2008.
TableC2.1 shows the composition of the share of Dutch and foreign controlledenterprisesinoursample.Forallenterprisesthatimportedservices,theshareofDutchversus foreigncontrolledwasequallydistributedbyvalue.On theotherhand, Dutch controlled enterprises had a larger share in the export value(54percent)thantheforeigncontrolledenterprises.
Furthermore,Dutchandforeigncontrolledenterprisestookequaladvantageoftheincreasing import and export values since the proportion of Dutch and foreigncontrolledenterprisesremainedalmostthesameforthreeyears.
Theimportandexportvaluesfortotal servicesreportedinthissectionarebasedondataintheSN(StatLine)database.AllotherdatapresentedinthischapterarebasedontheintegrateddatasetofthemicrodatabusinesssurveyandtheUCI. Although the total sample does not include all services, it represents55percentofthetotalimportvalueand74percentofthetotalexportvalue.

Internationalisation Monitor 2010 145
C2.1 Total Dutch imports and exports of international trade in services
2006 2007 2008
million euro
Imports Exports
60,000
0
65,000
70,000
75,000
80,000
85,000
90,000
Table C2.1 International trade in services by origin of the parent enterprise
Imports Exports
total Dutch foreign total Dutch foreign controlled controlled controlled controlled
million euro % million euro %
2006 69,199 51 49 77,020 54 462007 71,721 52 48 81,534 55 452008 76,470 50 50 85,935 54 46

146 Statistics Netherlands
2.2 International trade in services organised by size class
Graphs C2.2 give an overview of the share of Dutch and foreign controlledenterprisesbysizeclassfor2008.Overtwothirdsoftradeinservices,forimportandforexport,wasconductedbylargeenterprises.Thesepercentagesweresimilartothosefor2006–2007.
Whereimportsareconcerned,equaldistributionswerefoundbetweenDutchandforeigncontrolledenterprisesinthesmalltomedium-sizeclassaswellasinthelargeenterprisegroup.
Intermsofexports,57percentoftheexportvalueinthesmalltomedium-sizeclassaccountedforDutchcontrolledenterprises.However, inthelargersizeclasstheDutch controlled enterprises were to some extent relatively less represented(53percent).
Asmallormediumenterpriseisanenterprisethatemployslessthan250people.Alargeenterpriseisanenterprisewith250employeesormore.

Internationalisation Monitor 2010 147
C2.2b Share of Dutch and foreign controlled enterprises in the imports of services of large enterprises, 2008
Import value
32%50%
50%68%
C2.2c Share of Dutch and foreign controlled enterprises in the exports of services of small and medium-sized enterprises, 2008
Export value
65%57%
43%35%
C2.2d Share of Dutch and foreign controlled enterprises in the exports of services of large enterprises, 2008
Export value
35%53%
47%66%
C2.2a Share of Dutch and foreign controlled enterprises in the imports of services of small and medium-sized enterprises, 2008
68%50%
50%32%
Import value
Large enterprises Small and medium-sized enterprises
Dutch controlled Foreign controlled

148 Statistics Netherlands
2.3 International trade in services by industry
In2008, 33percent of the import value of international trade in services wasperformedbyenterprisesinthe‘agriculture,miningandmanufacturing’industrysection.Thesecondlargestshareoftrade(31percent)wascarriedoutbyenterprisesinthe‘transport,storageandcommunication’section,seealsoGraphC2.3.
Ascanbeseen inGraphC2.3, theopposite resultswere found forexports.The‘transport,storageandcommunication’industrysectionaccountedfor40percentofthetotalexportvalue,whereastheenterprisesinthe‘agriculture,miningandmanufacturing’industrysectorcontained27percentoftheexportvalue.
InTableC2.3A,asubdivisionwasmadefortheimportsofinternationaltradeinservicesbyoriginoftheparententerpriseandindustrysectionin2008.TheDutchcontrolled enterprises dominated with nearly 56 percent the largest industrysection,containingamongothersthe‘agriculture’and‘manufacturing’industries.Other industry sections in which the Dutch controlled enterprises were in themajoritywere:‘transport,storageandcommunication’,‘financialintermediation’and‘publicadministration,education,healthcare,socialworkandotherservices’.
TableC2.3Bshowsthatat54percenttheforeigncontrolledenterprisesdominatedthelargestexportindustrysectionin2008,containingthe‘transport,storageandcommunication’industries.Thefollowingindustrysectionscontained,relativelyseen,moreDutchcontrolledenterprises:‘agriculture,miningandmanufacturing’,‘financialintermediation’,‘realestate,rentingandbusinessactivities’and‘publicadministration,education,health,socialworkandotherservices’.

Internationalisation Monitor 2010 149
C2.3 International trade in services by industry, 2008
Import value Export value
A + B + C + D
E + F + G + H
I
J
K
L + M + N + O
33%
18%
31%
5%
12% 1%
27%
14% 40%
2%
16% 1%
Table C2.3A Imports of international trade in services by industry and origin of the parent enterprise, 2008
Dutchcontrolled Foreigncontrolled
%
Industry (NACE Rev.1.1)
A+B+C+D Agriculture,miningandmanufacturing 55.8 44.2E+F+G+H Utilities,construction,tradeandhospitality 31.7 68.3I Transport,storageandcommunication 52.9 47.1J Financialintermediation 79.0 21.0K Realestate,rentingandbusinessactivities 42.5 57.5L+M+N+O Publicadministration,education,health,
socialworkandotherservices 65.7 34.3
Table C2.3B Exports of international trade in services by industry and origin of the parent enterprise, 2008
Dutchcontrolled Foreigncontrolled
%
Industry (NACE Rev.1.1)
A+B+C+D Agriculture,miningandmanufacturing 73.9 26.1E+F+G+H Utilities,construction,tradeandhospitality 40.5 59.5I Transport,storageandcommunication 46.0 54.0J Financialintermediation 61.2 38.8K Realestate,rentingandbusinessactivities 50.9 49.1L+M+N+O Publicadministration,education,health,
socialworkandotherservices 52.9 47.1

150 Statistics Netherlands
2.4 International services traders in the Netherlands
InthetableandGraphC2.4theshareof internationalservicestraders isbrokendown by industry section. Of all industries, the ‘transport, storage andcommunication’industrysectioncomprisedthehighestshareofimportingservicestraders(5.6percent)in2008.Inaddition,exportingservicestraderswerealsoforthegreaterpart(7.9percent)presentinthisindustrysection.Therefore,foreveryhundredtradersinthisindustry,5.6and7.9traderswereengagedintheimportand export of international trade in services respectively in2008. Financialintermediation was the second largest industry for import (3.8percent) and forexporttraders(2.7percent).
Whenimportandexportwerecomparedwitheachotheritcanbeconcludedthatthere were slightly more export traders (1.5percent) than import traders(1.3percent)fortheinternationaltradeinservices.
General business register (GBR):ThegeneralbusinessregistercomprisesallenterprisesintheNetherlandsthatmakeacontributiontothedomesticproduct.Foreachenterprise,severalcharacteristicsarerecordedsuchastheeconomicactivityandsizeclass(intermsofnumberofemployees).
Enterprises population:ThenumberofactiveenterprisesintheNetherlands.Basedonthegeneralbusinessregisterandincludesenterprisesthatemployoneor more people for at least 15hours per week. For certainsectors, such asagriculture,adifferentmethodologyisappliedtoobtainthenumberofactiveenterprises.
The share of international services traders is given by industry section as apercentage of the total number of economically active enterprises in the SNgeneralbusinessregister.Eachenterpriseinthesampleisdefinedasauniqueinternationalservicestrader.Itshouldbenotedthattheseresultsgiveagoodindication of the minimum percentage of international services traders byindustrysectionintheNetherlands.Theword‘minimum’isusedbecausewhendesigningtheinternationaltradestatisticssomeenterpriseswereomittedfromthestatisticswhichare indeedinvolvedinthe international tradeinservices.These enterprises are mainly marginal international services traders. It isdesirableinfuturefortheseenterprisestobeidentifiedinordertooptimisetheestimatednumberofservicestraders.

Internationalisation Monitor 2010 151
Table C2.4 Share of international services traders by industry, 2008
GBR Internationalservicestraders
imports export
n %
Total 797,840 1.3 1.5
Industry (NACE Rev.1.1)
A+B+C+D Agriculture,miningandmanufacturing 140,665 1.5 1.2E+F+G+H Utilities,construction,tradeandhospitality 297,360 1.0 1.0I Transport,storageandcommunication 29,045 5.6 7.9J Financialintermediation 16,880 3.8 2.7K Realestate,rentingandbusinessactivities 197,725 1.3 2.1L+M+N+O Publicadministration,education,health,
socialworkandotherservices 116,165 0.5 0.3
C2.4 Share of international services traders by industry, 2008
Imports Exports
0
1
2
3
4
5
6
7
8
9
A + B + C + D E + F + G + H I J K L + M + N + O Total
%

Internationalisation Monitor 2010 153
C3 Foreign Direct InvestmentsIntroduction
The tables in chapter C3 describe patterns in Dutch foreign direct investments.These tables depict both flows and stocks to and from countries and economicsectors. Furthermore, Dutch FDI is placed in an international perspective bycomparingitwiththatofothercountries.Thedatadescribestheperiod2003–2008,andwherepossible,2009.
Foreign direct investment(FDI)isacategoryofcross-borderinvestmentmadebyaresidentinoneeconomy(thedirect investor)withtheobjectiveofestablishingalasting interest in an enterprise (the direct investment enterprise) resident in aneconomyotherthanthatofthedirectinvestor.Themotivationofthedirectinvestorisastrategiclong-termrelationshipwiththedirectinvestmententerprisetoensurea significant degree of influence in the management of the direct investmententerprise. The“lasting interest” is evidencedwhen thedirect investorownsatleast10%ofthevotingpowerofthedirectinvestmententerprise(OECD,2008).
TheleadingauthorityonFDIintheNetherlandsisDeNederlandscheBank(DNB). DNBcollectsandcompilesthedatafollowingtheIMFBalanceofPaymentsManual(BPM5, IMF1993).DNBpublishesonincomingandoutgoingFDIonaggregateleveleveryquarter.Onceayear,DNBpublishesoncountryandeconomicsectorslevel. The Special Purpose Entities (see chapter A3) are excluded from thesedetailedfigures.
Flowsofforeigndirectinvestmentsconsistoftheannualchangesinsharecapital,reinvestedprofitsandotherinvestments(amongothers,loans).
Stocksofforeigndirectinvestmentsaremeasuredattheendoftheyearandconsistof capitalparticipations, loans (including tradecredits, intraconcern loans)andotherliabilities.ThedifferencebetweenstocksattheendoftwosubsequentyearsisequaltotheflowofFDIplusreassessmentsbecauseofchangedexchangerates,changedpricesandotherreasonssuchasgoodwillwrite-downs.
Transactionsofasubsidiaryenterprisetotheparententerprisearenettedoutwiththe transactions of the parent to the subsidiary. This is in accordance with thedirectionalprincipleinBPM5.
Notethatthedirectinvestorisnotnecessarilytheultimatecontrollinginstitutionalunit(UCI).Forexample,supposeaDutchenterpriseowns,andcontrols,aGermanenterprisethatowns,andcontrols,anAustrianenterprise.TheUCIoftheAustrianenterpriseisthenDutch,butthedirectinvestorinAustriaisGerman.

154 Statistics Netherlands
3.1 Foreign direct investment: stocks and flows
EventhoughthevalueofstocksofinwardFDIwasfarhigherin2009thanin2003,itsshareinDutchGDPremainedthesame.ThefactthatthevalueofFDIdidnotchangerelativetothesizeoftheeconomysuggeststhatthelevelofopennessoftheDutcheconomyforforeigneconomiesdidnotriseduringthegiventimeperiod.ThisindicatorispartoftheOECDglobalisationindicators(OECD,2008),justliketheratioofoutwardFDItoGDP.WhileFDIdecreasedduringthecrisis,theeffectonbothglobalisation indicatorswasdampenedbyadecrease inDutchGDPof4percentin2009.
TheratioofoutwardFDItoGDPbehaveddifferently,asitrosesubstantiallyduringthe same period. However, a large part of this increase was caused by therestructuringofShellin2005.InthatyearitchangedfromanenterprisewithtwoheadquartersintheNetherlandsandintheUnitedKingdom,toanenterprisewithasingleheadquarters inTheHague.Theactivities intheUnitedKingdomwerereclassifiedasNetherlandsforeigninvestmentsabroad.
LargeacquisitionshavecausedFDIflowstovarysubstantiallyduringtheperiodunder investigation. One example is the acquisition of ABN AMRO in2007 byforeignenterprisesand the subsequent saleof theDutchpartofBelgium-basedFortistotheDutchstateinthefollowingyear.ThislastsalewasthecauseofthenegativeflowofinwardFDIin2008.Ingeneral,outwardflowswerelargerthaninwardflows,whichyieldedadeficitontheFinancialAccountintheBalanceofPayments.Furthermore,itisoneofthereasonsthatthedifferencebetweenoutwardandinwardFDIstocksincreasedduringtheperiod2003–2009.
ThelargefluctuationsofFDIflowsdiminishtherelevanceoftheindicatorsthatcompare the size of flows to GDP. Previously, these indicators would giveinformation on the relative attractiveness of economies, both that of theNetherlands and that of foreign countries. However, the current decrease inthese indicators cannot be separated from sudden flows caused by largeacquisitionsorfromthedecreaseinFDIcausedbytheeconomiccrisis.

Internationalisation Monitor 2010 155
Table C3.1 FDI stocks and flows: value and share in GDP
2003 2004 2005 2006 2007 2008 2009
million euro
Value
InwardFDI,flows 18,645 3,705 38,430 6,245 84,290 –5,203 19,399OutwardFDI,flows 39,016 23,488 105,996 51,841 20,754 13,696 12,799InwardFDI,stocks 337,776 350,355 382,499 391,561 494,676 459,008 414,181OutwardFDI,stocks 414,257 431,137 521,935 579,652 604,211 590,067 590,416
%
Share in Dutch GDP
InwardFDI,flows 4 1 7 1 15 –1 3OutwardFDI,flows 8 5 21 10 4 2 2InwardFDI,stocks 71 71 75 72 87 77 72OutwardFDI,stocks 87 88 102 107 106 99 103
Source:DeNederlandscheBank(FDI)andStatisticsNetherlands(GDP),calculatedbyStatisticsNetherlands.
C3.1 FDI (stocks) relative to GDP
Source: De Nederlandsche Bank (FDI) and Statistics Netherlands (GDP), calculated by Statistics Netherlands.
%
Inward FDI Outward FDI
0
60
70
80
90
100
110
2003 2004 2005 2006 2007 2008 2009
156 Statistics Netherlands
3.2 Foreign direct investment: by economic sector
TableA3.1showedthattheshareofmanufacturingininwardDutchFDIrosefrom39percentto42percentduringtheperiod2003–2009,whereastheshareofservicesdeclined. For example, while the value of inward FDI in the food products manufacturingsectordoubledduringthisperiod,thevalueofinwardFDIinthetradeservicesectoractuallydeclined.
Ingeneral,itseemsthatinwardinvestmentsbecamemoreconcentratedinspecificsectors.Forexample,foreignenterprisessawevermoreopportunitiesineconomicsectorssuchasmining and quarrying, petroleum and chemical products.Itisimpossibleto say whether this is because that sector became more important in generalworldwide, because that sector is particularly interesting in the Netherlands,because of specialisation, or because of the general investment climate.Yet it isnoteworthythatbothVattenfallandRWEinvestedinDutchenterprises(NuonandEssentrespectively)afterliberalisationoftheDutchenergymarket.
The mining and quarrying, petroleum and chemical products economic sector alsoconsiderablyincreaseditsoutwardFDI.Again,TableA3.1showsthattheshareofmanufacturinginoutwardDutchFDIroseduringtheperiod2003–2009,namelyfrom39to50percent,whereastheshareofservicesinoutwardDutchFDIdeclined.The value of investments in the monetary intermediation and insurance sector inparticulardeclinedduringthatperiod,justasitdidinthetradesector.Therewasalarge increase in outward FDI in other services, mainly because of increasingfinancialintermediation.
Justasforinwardinvestments,outwardinvestmentsbecamemoretargetedandspecialised. Investments are increasingly more concentrated in specific sectors,suchasmining and quarrying, petroleum and chemical products,whichhadashareof30percentintotaloutwardFDIin2009.
DNBdividesFDIintotwocategories:manufacturing(thesectorsAthroughFinNACERev.2)andservices(thesectorsGuptoS,excludingO).Manufacturingconsists of agriculture, mining, quarrying, utilities, construction and othermanufacturing activities, for example in the food, petroleum or chemicalindustry.Servicesconsistoftradeandrepair,transport,storage,communication,financialintermediation,realestate,rentingandbusinessactivities,education,health, social work, entertainment and recreation, and other services. Publicadministrationisnotincluded.

Internationalisation Monitor 2010 157
Table C3.2 FDI (stocks), by economic sector
Value Sharein2008
2003 2004 2005 2006 2007 2008
million euro %
Inward FDI
Total 337,776 350,355 382,499 391,561 494,676 459,008 100Manufacturing 131,111 158,179 150,371 152,661 183,610 193,164 42
Miningandquarrying,petroleumandchemicalproducts 68,552 84,850 78,839 77,911 99,221 103,849 23Electrotechnicalandmetalproducts 21,350 21,894 21,866 21,526 19,362 24,000 5Food,beveragesandtobacco 23,732 33,924 30,794 33,842 45,568 44,413 10Other 17,477 17,511 18,872 19,383 19,459 20,901 5
Services 206,666 192,175 232,128 238,899 311,065 265,843 58Trade 46,448 36,883 40,446 41,173 40,094 34,283 7Transport,storageandcommunication 11,921 10,524 12,693 12,854 15,184 13,035 3Monetaryintermediationandinsurance 12,268 10,568 13,031 14,222 27,203 14,268 3Other 136,028 134,201 165,957 170,650 228,584 204,257 44
Outward FDI
Total 414,257 431,137 521,935 579,652 604,211 590,067 100Manufacturing 163,188 178,801 227,817 244,145 262,530 292,736 50
Miningandquarrying,petroleumandchemicalproducts 93,707 107,884 142,953 147,522 161,794 174,385 30Electrotechnicalandmetalproducts 29,920 25,372 32,858 41,298 39,340 43,158 7Food,beveragesandtobacco 26,626 30,258 35,552 35,712 41,303 50,820 9Other 12,935 15,287 16,455 19,614 20,094 24,373 4
Services 251,068 252,336 294,117 335,507 341,681 297,332 50Trade 42,274 33,057 38,674 42,540 37,040 29,444 5Transport,storageandcommunication 21,966 31,158 33,798 31,409 29,613 29,750 5Monetaryintermediationandinsurance 26,629 29,514 36,520 40,856 42,497 22,650 4Other 160,199 158,607 185,125 220,702 232,531 215,487 37
Source:DeNederlandscheBank(FDI),calculatedbyStatisticsNetherlands.
C3.2 FDI per sector
Source: De Nederlandsche Bank (FDI), calculated by Statistics Netherlands.
%
0
20
40
60
80
100
2003 2004 2005 2006 2007 20082003 2004 2005 2006 2007 2008
Outward FDIInward FDI
ManufacturingServices

158 Statistics Netherlands
3.3 Foreign direct investment: by country
ThemaininvestorsintheNetherlandsarethecountriesintheeurozone,andtheUS and the United Kingdom. Together they account for 379billion euros, or83percent of stocks of total inward Dutch FDI in2008. This is almost the sameshare as in2003. The investments of emerging countries such as China or thecountriesthataccededtotheEuropeanUnionin2004or2007remainedrelativelysmall.
ThetotalshareoftheEuropeanUnionininwardDutchFDIrosefrom58percentin2003 to 64percent in2008. The shares of Luxembourg and France doubledduringtheperiod2003–2008,whereasGermany’ssharegraduallydecreased.Theaccession of new member states only had a small effect on inward Dutch FDIcomingfromtheEuropeanUnion.
AsfarasoutwardFDIisconcerned,stocksarealsoconcentratedinthecountriesinthe euro zone, the United Kingdom and the US. Together they accounted for404billioneuros,or68percent,ofstocksoftotaloutwardDutchFDIin2008.Thisis almost the same share as in2003. The shares of emerging economies such asBrazil,Russia,IndiaandChina(theBRICcountries)arestillrelativelysmall,buttheygenerallyincreasedbetween2003and2008.
The US share decreased from 17percent in2003 to 11percent in2008, but thesharesofGermanyandLuxembourgincreased.TheshareoftheEuropeanUnionin outward Dutch FDI increased from 58percent in2003 to 62percent in2008.However,alargepartofthisincreaseisattributabletotheaccessionofnewmemberstates.ItshouldalsobetakenintoaccountthatpartoftheshiftfromtheUStotheEuropeanUnioniscausedbyachangingexchangerate.Duringtheperiod2003–2008theeuro-dollarexchangeratedepreciatedby17percent,soevenifinvestmentsin the US had retained their value in dollars, their value in euros would havedecreased.
NotethatoutwardDutchFDIisdistributeddifferentlyamongthecountriesthaninwardDutchFDI.Forexample,Switzerland,CanadaandseveralAsiancountriessuchasChinahave larger shares foroutwardFDI than for inwardFDI.On theotherhand,thesharesofoutwardFDItotheUSandtheUnitedKingdomarefarsmaller.

Internationalisation Monitor 2010 159
Table C3.3 Dutch FDI (stocks), by country of origin or destination
Value Sharein2008
2003 2004 2005 2006 2007 2008
million euro %
Inward FDI
Total 337,776 350,355 382,499 391,561 494,676 459,008 100TotalEuropeanUnion 195,104 205,676 227,942 235,525 326,378 294,328 64
Belgium 33,207 31,324 35,706 46,365 56,958 34,943 8Germany 43,796 41,433 40,238 39,788 42,397 34,464 8France 12,902 17,637 27,048 20,582 40,684 43,094 9Ireland 10,942 11,310 14,411 15,876 17,376 19,221 4Italy 2,363 895 1,828 2,593 2,020 2,047 0Luxembourg 20,376 26,090 33,989 35,917 51,127 51,307 11Spain 5,297 7,973 8,445 8,843 24,024 8,799 2UnitedKingdom 56,286 58,326 53,247 53,378 78,768 87,042 19Sweden 6,266 3,674 3,740 3,661 4,058 4,109 1OtherEUcountries 3,669 7,014 9,290 8,522 8,966 9,302 2
Russia 70 93 117 40 230 274 0Switzerland 14,753 18,101 17,652 18,763 16,618 11,379 2OtherEuropeancountries 11,381 11,141 18,587 15,315 9,860 12,779 3UnitedStates 69,258 68,972 73,181 73,841 90,032 91,968 20DutchAntillesandAruba 8,055 6,816 7,680 7,805 8,569 9,628 2Japan 13,007 10,654 6,969 9,073 8,119 9,092 2Brazil 43 334 837 960 859 314 0China 56 30 21 35 74 176 0India 628 51 1 1 7 8 0Othercountries 25,421 28,487 29,512 30,203 33,930 29,062 6
Outward FDI
Total 414,257 431,137 521,935 579,652 604,211 590,067 100TotalEuropeanUnion 241,275 260,159 318,320 357,584 390,520 368,105 62
Belgium 35,869 34,710 36,410 57,932 69,502 60,930 10Germany 30,271 44,622 54,670 55,970 61,579 59,660 10France 29,150 25,865 30,951 34,501 34,998 31,546 5Ireland 11,438 10,585 11,155 9,916 10,405 10,786 2Italy 9,966 12,200 14,648 20,256 20,983 19,394 3Luxembourg 19,474 24,128 17,194 22,945 32,529 40,277 7Spain 17,672 16,794 23,556 24,661 28,240 25,786 4UnitedKingdom 54,633 60,857 95,186 87,692 87,337 77,749 13Sweden 6,598 5,775 6,827 6,862 5,515 5,423 1OtherEUcountries 26,204 24,623 27,723 36,849 39,432 36,554 6
Russia 3,092 4,663 5,643 11,726 8,593 7,243 1Switzerland 33,634 30,041 34,873 38,629 40,796 40,049 7OtherEuropeancountries 6,390 5,310 4,433 8,148 7,655 7,374 1UnitedStates 70,881 70,038 83,855 76,439 56,829 62,815 11DutchAntillesandAruba 3,119 1,616 1,794 1,861 2,506 2,422 0Japan 1,039 805 1,117 1,882 2,810 4,925 1Brazil 4,721 6,189 8,228 8,814 11,623 6,340 1China 1,758 1,252 1,825 2,182 4,345 5,197 1India 680 1,067 1,251 1,607 2,161 1,945 0Othercountries 47,668 49,997 60,596 70,780 76,373 83,652 14
Source:DeNederlandscheBank(FDI),calculatedbyStatisticsNetherlands.

160 Statistics Netherlands
C.3.3 Origin of inward FDI and destination of outward FDI
Source: De Nederlandsche Bank, calculated by Statistics Netherlands.
%
0
20
40
60
80
100
2003 2004 2005 2006 2007 2008 2003 2004 2005 2006 2007 2008
Origin of inward FDI Destination of outward FDI
Intra EU Extra EU

162 Statistics Netherlands
3.4 Share of the Netherlands in worldwide FDI
TheshareoftheNetherlandsinworldwideinwardFDIisdecreasing.In2003thisshare was 5.2percent and it decreased to 4.3percent in2008. Belgium and theUnited Kingdom experienced similar drops, but France and Germany retainedtheirshares.ThesedevelopmentshaveledtoadecreaseintheshareoftheEuropeanUnioninworldwideinwardFDI.TheshareofthestatesthatjoinedtheEuropeanUnionin2004or2007wassmall,butisincreasingsteadily.
OutsidetheEuropeanUnion,therehasbeenasubstantialdecreaseintheshareoftheUSintotalworldwideinwardFDI.ThesharesofBrazil,RussiaandIndiaareonthe rise, but surprisingly China’s share decreased during the period2003–2008.NotethattheshareofRussiaincreasedrapidlyduring2004–2007,butwashalvedin2008. This might be related to the rapid decrease in the price of oil and rawmaterials at the end of 2008, because mining and mineral extraction industriesaccountforalargepartofRussianinwardFDI.
TheshareoftheNetherlandsinworldwideoutwardFDIalsodecreased.In2003thissharewas6.1percentanditdecreasedto5.2percentin2008.TheBelgianshareremainedthesame.Othercountries thataresimilar to theNetherlands,suchasAustriaandDenmark,evenincreasedtheirshareofworldwideoutwardFDI.TheshareoftheEuropeanUnionslowlydecreasedduringtheperiod2003–2008,butstillaccountedforalmosthalfworldwideoutwardFDI.OutsidetheEuropeanUnion,theshareoftheUSdecreasedslowly.Thesharesofemergingcountries,suchasBrazil,Russia,IndiaandChina,areallrising.
Again,therearelargedifferencesindistributionofinwardandoutwardFDIforthedifferentcountriesaroundtheworld.TheshareoftheEuropeanUnionplusthatoftheUSissmallerforinwardFDIthanforoutwardFDI.Itistheoppositecaseforemergingcountries.
ApossibleexplanationforthedecreasingshareoftheNetherlandsinworldwideFDI is a different treatment of the Special Purpose Entities (SPEs). TheNetherlandsgenerallydoesnotincludetheSPEsinFDI,butmostothercountriesdo. If SPEs are included in Dutch FDI, then the share of the Netherlands inworldwideoutwardFDIincreasedduringtheperiod2003–2008,whereasthatforinwardFDIremainedthesame.

Internationalisation Monitor 2010 163
Table C3.4 Share in worldwide FDI
2003 2004 2005 2006 2007 2008
%
Inward stocks
Total 100 100 100 100 100 100
EU27 45.8 46.9 44.0 45.0 44.1 43.1EU15 43.2 43.8 40.8 41.3 40.2 39.2
TheNetherlands 5.2 5.0 4.5 4.1 4.6 4.3Austria 0.7 0.7 0.8 0.9 1.0 0.9Belgium 4.3 4.9 3.8 3.9 3.8 3.5Denmark 0.8 0.9 0.9 0.9 0.8 1.0France 6.5 6.7 6.2 6.1 6.1 6.6Germany 4.8 5.3 4.7 4.8 4.3 4.7Sweden 1.9 2.0 1.7 1.8 1.9 1.7UnitedKingdom 7.4 7.3 8.4 9.2 8.1 6.6
Switzerland 2.0 2.1 1.7 2.1 2.2 2.5
Brazil 1.6 1.7 1.8 1.8 2.0 1.9China 2.8 2.6 2.7 2.4 2.1 2.5India 0.4 0.4 0.4 0.6 0.7 0.8Russia 1.2 1.3 1.8 2.1 3.1 1.4
UnitedStates 17.1 15.8 16.3 14.8 13.5 15.3
Outward stocks
World 100 100 100 100 100 100
EU27 53.1 51.9 51.0 51.3 51.2 49.9EU15 52.9 51.7 50.7 50.9 50.8 49.4
TheNetherlands 6.1 5.8 5.8 5.9 5.4 5.2Austria 0.6 0.7 0.7 0.8 1.0 0.9Belgium 3.5 3.7 4.5 4.8 4.6 3.6Denmark 0.8 0.9 1.0 1.0 0.9 1.2France 8.4 8.4 8.2 8.1 8.0 8.6Germany 9.6 9.2 8.7 8.3 8.0 9.0Sweden 2.1 2.1 2.0 2.0 2.0 2.0UnitedKingdom 13.7 12.4 11.3 11.2 11.3 9.3
Switzerland 4.0 4.0 4.1 4.3 4.1 4.5
Brazil 0.6 0.7 0.7 0.9 0.8 1.0China 0.4 0.4 0.5 0.6 0.6 0.9India 0.1 0.1 0.1 0.2 0.3 0.4Russia 1.1 1.1 1.4 1.7 2.3 1.3
UnitedStates 20.5 21.4 21.1 19.1 18.0 19.5
Source:UNCTAD.

164 Statistics Netherlands
References
IMF Balance of Payments Manual (1993), fifth edition, International MonetaryFund.
OECD(2008).OECDBenchmarkDefinitionofForeignDirectInvestment,fourthedition.

Internationalisation Monitor 2010 165
C4 Internationalisation of research and development (R&D)
Introduction
ThissetofannotatedtablesontheinternationalisationofR&DpresentsinformationonthecontributionofforeigncontrolledenterprisestotheR&DandinnovationactivitiesintheDutchbusinesssector.DataisbasedontheCommunity Innovation Survey(CIS),whichisconductedeveryevenyear.Thedataiscategorisedbysectorandbysizeclass.Thesurveyenables thecompilationof innovationprofiles forspecific types of enterprises, and compares firms by their R&D expenditures,innovationactivitiesandcooperation.Thelasttableinthischapterisabenchmarktable inwhichDutchR&DinputsarecomparedwiththoseofseveralEuropeanmemberstatesandtheEU27.The distinction between Dutch controlled and foreign controlled enterprises isbasedonwheretheUltimateControllingInstitutionalUnit(UCI)resides.TheUCIis defined as the institutional unit, proceeding up a foreign affiliate’s chain ofcontrol,whichisnotcontrolledbyanotherinstitutionalunit.Accordingly,foreigncontrolledenterpriseshaveacentreofcontroloutsidetheNetherlands,whereasDutchcontrolledmeansthatthelocusofcontrolisintheNetherlands.‘Control’meanstheabilitytodeterminethegeneralandstrategicpolicyofanenterprisebychoosing appropriate directors. The UCI is determined on an annual basis bycombiningenterpriseinformationfromvarioussources.PleasenotethatasthedistinctionbetweenDutchandforeigncontrolledenterprisesintheInternationalisation Monitor 2009 wasstillbasedsolelyonaquestionintheCommunityInnovationSurveyitself,anddefinedbythelocationoftheenterprise’smain office, the figures presented in this chapter differ somewhat from figurespublishedinformereditionsofthispublication.
ClassificationFor2008theclassificationofenterprisesisbasedonNACERev.2.Forprecedingyears the classification used was NACE Rev.1.1. Subsequently, ManufacturingbasedonNACERev.1.1isnotcompletelycomparablewithManufacturingbasedonthenewclassificationNACERev.2.
Therearethreesectorsintheannotatedtables(NACERev.2):– Manufacturing:NACERev.2SectionC– Services sector:NACERev.2SectionsG,H,I,J,K,L,M(excludingclass72)andN.– Other:NACERev.2SectionsA,B,D,EandF
Data for the Other sector are not shown separately because the number ofenterprisesinthiscategoryistoosmall.

166 Statistics Netherlands
4.1 R&D expenditures of foreign controlled enterprises in the Dutch business sector
In2008 one third of the R&D expenditures were realised by foreign controlledenterprises.In2002thiswasjustoveronequarter.TheshareofR&Dexpendituresof foreign controlled enterprises in the total R&D expenditures of the DutchbusinesssectorisanindicationofthelevelofinvolvementofforeignmultinationalsorinvestorsinR&DperformedintheNetherlands.In2008theshareofforeigncontrolledR&Dwasaboutthesameinthemanufacturingandtheservicessectors.However,theabsoluteamountsoftheR&Dexpendituresdifferconsiderably:75percentoftotalforeigncontrolledR&Dexpendituresaretobefoundinmanufacturing.In all size classes the contribution of foreign controlled enterprises to the R&Dperformed in the Netherlands is substantial. Over the years the share of R&Dperformedbyforeigncontrolledenterprisesseemstobethelargestinthemedium-sizedenterprises(50–249personsemployed)withashareof43percent.ThevalueofDutchcontrolledenterprisesdecreasedinallsizeclassesin2008.With 1.7billion euros of investments in R&D activities by foreign controlledenterprises,theNetherlandssustainsasuitablelocationforperformingR&D.ThisforeigncontrolledR&Dmaybe the resultofgreenfield investments i.e. startingnewR&Dactivities,whichincreasestheR&DperformedintheNetherlands,andhaspositiveeffectsontheDutchknowledgeeconomy.Yetitmayalsobetheresultof mergers and acquisitions, meaning that existing R&D activities of Dutchenterprisesaretakenoverbyforeignenterpriseswithaviewtotheirgainingaccesstospecificknowledgeortechnologies.ThelatterdoesnotincreasetheamountofR&D performed in the Netherlands. It just changes the ratio between R&Dperformed by Dutch controlled enterprises and R&D performed by foreigncontrolledenterprises.ThepoliticalinterestisinexpandingtheR&DactivitiesofexistingforeigncontrolledenterprisesandgreenfieldinvestmentandnotsomuchinmergersandacquisitionsofexistingR&DactivitiesofDutchenterprises.TherearerecentexamplesofforeigncontrolledenterprisesthathavetakenoverDutchenterprises and after just a few years put a stop to the R&D activities of thisenterpriseintheNetherlands.
The ratio between Dutch controlled and foreign controlled R&D is verysensitivetoalimitednumberorevenjustonemergerortakeoverofa(large)enterprise.R&DexpendituresintheNetherlandsaredominatedbyarestrictednumberoflargeenterprises.IfoneoftheseenterpriseschangesfromDutchtoforeign controlled it immediately has an impact on this ratio. This is whathappened in2008 when foreign controlled R&D increased substantiallycomparedwith2006.Itisnotcausedbyawidespreadphenomenon,butbyjustafewmergersandacquisitions.

Internationalisation Monitor 2010 167
Table C4.1 R&D expenditure of foreign and Dutch controlled enterprises in the business sector
2002 2004 2006 20081)
mln euro % mln euro % mln euro % mln euro %
Total 4,543 100 5,071 100 5,480 100 5,263 100
Dutchcontrolled 3,322 73 3,791 75 4,124 75 3,546 67Foreigncontrolled 1,221 27 1,281 25 1,357 25 1,717 33
Industry
Manufacturing 3,454 100 3,898 100 4,094 100 3,758 100Dutchcontrolled 2,555 74 2,881 74 3,202 78 2,464 66foreigncontrolled 899 26 1,017 26 892 22 1,294 34
Servicessector 884 100 974 100 1,200 100 1,307 100Dutchcontrolled 576 65 730 75 830 69 892 68foreigncontrolled 308 35 244 25 370 31 415 32
Size class
Small(10–49personsemployed) 422 100 431 100 421 100 390 100Dutchcontrolled 404 96 402 93 374 89 335 86foreigncontrolled 18 4 29 7 47 11 54 14
Medium(50–249personsemployed) 830 100 934 100 992 100 862 100Dutchcontrolled 565 68 636 68 682 69 494 57foreigncontrolled 265 32 298 32 310 31 367 43
Large(250ormorepersonsemployed)3,291 100 3,707 100 4,068 100 4,012 100Dutchcontrolled 2,353 71 2,753 74 3,068 75 2,717 68foreigncontrolled 938 29 954 26 1,000 25 1,296 32
1) BasedonthenewNACERev.2classificationofthebusinessenterprisesector.

168 Statistics Netherlands
4.2 Technological innovation profile
Foreign controlled enterprises in the Netherlands are much more involved ininnovationthandomesticallycontrolledenterprises.Overall,23percentofDutchenterprises and 48percent of foreign controlled enterprises innovated in theperiod2006–2008.Monitoringthewholeperiod2002–2008,theshareofinnovativeforeigncontrolledenterprises isat least twiceas largeas theshareof innovativeDutchenterprises.ThedifferenceininnovationactivitybetweenDutchandforeigncontrolledenterprisesisreflectedinboththemanufacturingandtheservicessectors.
ThedifferencesininnovationbetweenDutchandforeigncontrolledenterprisesareless pronounced, but still persistent when broken down by the size class of theenterprisesconcerned.Thisdifferenceisrelativelythegreatestinthe10–49personsemployedsizeclass.ThetablerevealsthatinnovationbyDutchenterprisesinthissizeclassisbelowaverage.ThedifferenceininnovationactivitybetweenDutchandforeignenterprisesislessextremeinthe250andmorepersonsemployedsizeclass.Furthermore, foreign controlled enterprises are more active in implementingproduct and process innovation. For example, in the period2006–2008 about37percent of foreign controlled enterprises were product innovators, while theshareof enterprisesactive inprocess innovation is 27percent.This is a strikingdifferencecomparedwiththenumberofDutchcontrolledenterprises.Subsequently,it shows that foreign controlled enterprises are more often product innovatorsratherthanprocessinnovators,whilethesesharesaremoreorlessthesamefortheDutchcontrolledenterprises.
Fromthedivergencein2008mentionedabove,thedifferencebetweenthesharesofproduct innovators is relatively the largest in the services sector. However, theshareofinnovatorsisalwaysthehighestinthemanufacturingsector.
Theseobservationsillustratethatforeigncontrolledenterprisesaremoreinnovativethan Dutch controlled enterprises. However, this is also influenced by thecharacteristics of these foreign controlled enterprises. They are larger and moreproductivethantheaverageDutchenterprise,almostalwayspartofanenterprisegroup,andmoreoftenactiveoninternationalmarketsandsoon.Butifallthesefactors are taken into account, the fact still remains that foreign controlledenterprisesmakeapositivecontributiontotheoverallinnovationofthebusinessenterprisesectorintheNetherlands(seealsopartB3ofthispublication).
Innovation
Theconceptofinnovationcanbesplit intotechnological innovation(productandprocessinnovation)andnon-technologicalinnovation(organisationalandmarketinginnovation).Thispartrefersonlytotechnologicalinnovation.

Internationalisation Monitor 2010 169
Table C4.2 Technological innovation profile; foreign and Dutch controlled enterprises
Innovation Productinnovation Processinnovation
2002 2004 2006 20081) 2002 2004 2006 20081) 2002 2004 2006 20081)
% of enterprises
Total 20 25 25 25 15 17 16 17 10 17 16 15
Dutchcontrolled 18 23 22 23 13 15 14 15 916 15 15Foreigncontrolled 42 46 50 48 34 35 39 37 21 31 28 27
Industry
Manufacturing 40 42 42 42 30 29 32 30 23 29 28 28Dutchcontrolled 37 39 39 39 28 27 29 27 21 27 26 26foreigncontrolled 61 63 65 65 51 48 53 51 38 44 44 42
Servicessector 17 23 22 22 12 15 14 15 815 14 13Dutchcontrolled 16 22 20 21 1114 13 14 814 14 13foreigncontrolled 30 35 40 36 24 26 31 28 1122 20 18
Size class
Small(10–49personsemployed) 16 22 21 21 12 14 14 14 814 14 13Dutchcontrolled 16 21 20 21 1114 12 14 814 13 13foreigncontrolled 27 31 40 34 24 24 31 27 10 21 19 16
Medium(50–249personsemployed) 35 38 38 37 26 26 26 26 18 26 25 25Dutchcontrolled 33 35 35 34 23 23 23 23 17 24 23 23foreigncontrolled 48 53 51 52 38 41 40 41 24 33 32 32
Large(250ormorepersonsemployed) 51 59 56 54 38 42 43 41 33 46 42 39Dutchcontrolled 47 55 52 52 34 40 37 39 29 42 40 39foreigncontrolled 61 67 63 58 46 46 53 44 43 52 46 39
1) BasedonthenewNACERev.2classificationofthebusinessenterprisesector.

170 Statistics Netherlands
4.3 Cooperation profile of innovators
Theshareofenterprisesthatcooperateinordertoinnovateishigherforforeigncontrolledenterprises,thanforDutchcontrolledenterprises:43percentandonly37percentrespectively.Thisdifferencehasdeclinedsteadilysince2002asaresultof increasing cooperation among Dutch enterprises and decreasing cooperationamongforeigncontrolledenterprises.
ThegreatestdifferencebetweenDutchandforeigncontrolledenterprisesisinthemanufacturingsector. Just41percentof theDutchcontrolledfirmscooperate ininnovation, compared with 56percent of foreign controlled enterprises in themanufacturingsector.Andthisdifferencehasbeenpersistentovertime.ThereisnosignificantdifferencebetweenforeignandDutchcontrolledenterprisesintheservicessector.
Compared with Dutch controlled enterprises, foreign controlled firms are morelikely to cooperatewithconsultants, commercial labs,orprivateR&D institutesandwithuniversities.Theyalsocooperatemorewithsuppliersandcustomers,butDutchcontrolledenterprisestendtopartnermorewithcompetitors.Thereisnodifference between Dutch and foreign controlled enterprises with respect tocooperationwithgovernmentpartners,asshowninGraphC4.3.
Foreign controlled enterprises often cooperate with foreign partners. Evenexcluding cooperation within an enterprise group, a large majority (69percent)cooperatewithpartnersabroad,comparedwithonly41percentofDutchcontrolledenterprises. Dutch controlled enterprises cooperate more frequently within theNetherlands,butthedifferencewithforeigncontrolledenterprisesismuchsmaller:93percentversus84percent.
Overall, foreign controlled enterprises cooperate during the innovation processandtherebycontributetoknowledgeflowsbetweenthedifferentpartnersinvolved.
The cooperation profile describes how many of the innovating enterprisescooperateandwithwhom.
Inadditiontotheparentcompanyorenterprisegroupitself,innovationpartnersinclude suppliers and customers. Other possible external partners arecompetitors,consultants,universities,otherresearchinstitutesorgovernments.

Internationalisation Monitor 2010 171
Table C4.3 Cooperation profile; foreign and Dutch controlled enterprises
2002 2004 2006 20081)
% of innovators
Total 33 37 36 38
Dutchcontrolled 30 36 35 37foreigncontrolled 50 46 42 43
Industry
Manufacturing 33 44 44 44Dutchcontrolled 29 41 40 41foreigncontrolled 52 60 58 56
Servicessector 33 34 32 34Dutchcontrolled 30 34 32 34foreigncontrolled 48 36 33 35
Size class
Small(10–49personsemployed) 27 32 32 34Dutchcontrolled 26 32 31 34foreigncontrolled 44 36 33 30
Medium(50–249personsemployed) 38 47 43 46Dutchcontrolled 35 46 42 45foreigncontrolled 49 51 46 49
Large(250ormorepersonsemployed) 59 65 64 63Dutchcontrolled 56 65 63 63foreigncontrolled 63 64 66 64
1) BasedonthenewNACERev.2classificationofthebusinessenterprisesector.
C4.3 Cooperating innovators and their partners; foreign and Dutch controlled enterprises, 2008
1) Excluding cooperation within the enterprise group.
% of cooperating innovators 1)
0
20
40
60
80
100
Dutch controlled Foreign controlled
Suppliers Customers Competitors Consultants Universities Government Partnersabroad
Domesticpartners

172 Statistics Netherlands
4.4 Gross domestic expenditure on research and development (GERD)
TableC4.4AshowsthatwhencomparinggrossdomesticexpendituresonR&D,theNetherlandsspendsrelativelylittlecomparedwithmanyothercountries.In2008,the R&D intensity of the Dutch economy was the lowest of the countries inFigureC4.4B,includingtheEU27.Inaddition,theNetherlandsisoneofthetwocountriesforwhichtheR&Dexpendituresdidnotincreasebetween2003and2008.ThegrossdomesticexpenditureonR&D(GERD)isoneofthekeyvariableswhencomparingR&Dperformanceorintensitybetweencountries.AnexplicittargetoftheLisbonstrategyoftheEuropeanCommissionfor2010wastospend3percentofGDPonR&DintheEU.Sinceitislikelythatthistargetwillnotbemet,newtargetsforR&DexpenditureintheEUwillbedefinedfor2020.Itisexpectedthatthe targetwillstayat3percent (Europe 2020. A strategy for smart, sustainable, and inclusive growth, COM (2010) 2020).ThelowlevelofGERDintheNetherlandsisprimarilyexplainedbytheroleoftheDutchbusinessenterprisesector.OnlyhalfofDutchGERDisperformedbythebusiness enterprise sector,whichislowcomparedwiththeothercountriesandtheEU27. R&D expenditure in the higher education sector and the other sectors (governmentandprivatenon-profitsectors)intheNetherlandsisnotsufficientlyhightocompensateforthelowbusinessenterprisesectorexpendituresuptotheleveloftheLisbontarget.
Gross domestic expenditure on R&D (GERD)GERDistotalintramuralexpenditureonR&Dperformedonnationalterritoryinagivenperiod.IntramuralexpendituresareallR&Dexpenditureswithinastatisticalunitorsectoroftheeconomyduringaspecificperiod,irrespectiveofthesourceoffunds.GERDincludesR&DperformedwithinacountryandfundedfromabroadbutexcludespaymentsforR&Dperformedabroad.GERDisconstructedbyaddingtogethertheintramuralexpendituresofthefourperformingsectors.Thesefoursectorsare:– Businessenterprisesector(BES)– Privatenon-profitsector(PNP)– Governmentsector(GOV)– Highereducationsector(HES)
Sweden,Finland,Switzerland,Denmark,AustriaandBelgiumarecomparabletotheNetherlandsineconomicdevelopmentandsizebutmayhaveadifferenteconomicstructure.
Source:OECD,Frascati Manual 2002.

Internationalisation Monitor 2010 173
C4.4A Gross domestic expenditure on research and development (GERD)
Source: Statistics Netherlands and OECD.
0 0.5 1.0 1.5 2.0 2.5 3.0 3.5 4.0
Sweden
Finland
Switzerland 1)
Denmark
Austria
Belgium
EU 27
The Netherlands
% of GDP
2003 2008
C4.4B Gross domestic expenditure on research and development by performing sector, 2008
Source: Statistics Netherlands and OECD.
% of GERD
0
20
40
60
80
100
Other sectors Higher education sector Business enterprise sector
The Netherlands
EU 27 Belgium Denmark Austria Switzerland Sweden Finland
Internationalisation Monitor 2010 175
C5 International traffic and transport flows
Introduction
Theongoing innovationanddiffusionof technology in the transport sectorhasloweredtransactioncostsandincreasedthedemandandsupplyfortransportationcapacity.Thedevelopmentsaremostpronouncedinthecontainertrade,whichhasgrowntremendouslysincethemid-1970s.Vesselshavebecomegigantic,withthelatestcapableofcarrying15thousandstandardcontainers.Containerisationhasreduced the costs of shipping goods, facilitating the creation of global supplychains,andspurringinternationaltrade.TheNetherlandshasbecomeanimportantlinkinthehub-and-spokemodelofoverseastransportflowsofgoodstoandfromEurope, feeding into other modes of transport and creating a variety of relatedeconomic activities and network effects. Associated commercial partners andsuppliersarebenefitingfromeachother’spresenceandcompetingwitheachotherforashareofthemarket.
Overallin2008,theland,water,airandsupportingtransportactivitiesgenerated3.7percent of the total added value of the Dutch economy and employed over371thousandpersons.Thetotaloutputofthissectorwas55billioneurosofwhich39percent was produced by land transport, 12percent by water transport, and16percentbyairtransportactivities.
ThetablesandgraphsinchapterC5illustratethepatternof internationaltrafficandtransportflowsintheNetherlands,demonstratinghowrecentdevelopmentsin the international transport statistics help to provide further insight into thecomposition and evolution of transport flows. More information on the value,originanddestinationsofinternationaltradeofgoodscanbefoundinchaptersA1andC1.SeeA2andC2forinternationaltradeintransportservices(suchascargohandlingandstorage,warehousing,customsclearanceandportservices).
SectionC5.1startswithanoverviewofinternationalairpassengerflowfromandtotheNetherlandsandcontinueswithabenchmarktop10ofEuropeanairportsinorder to measure the relative comparative position of the Dutch market area.SectionC5.2monitorstheDutchpositionininternationalgoodstransportbyairinaEuropeancomparativeperspective.SectionC5.3examinesthetransportflowsofgoodstoandfromtheNetherlandsbymodalityandnationalityofthetransportequipment.SectionC5.4surveysthecontainerflowfromandtotheNetherlandsbysea.
176 Statistics Netherlands
Definitions
EU 15 includes member states Austria, Belgium, Denmark, Finland, France,Germany, Greece, Ireland, Italy, Luxembourg, Portugal, Spain, Sweden, UnitedKingdomandtheNetherlands.EU 27 includes EU15 plus the new member states Bulgaria, Cyprus, the CzechRepublic,Estonia,Hungary,Latvia,Lithuania,Malta,Poland,Romania,Slovakia,andSlovenia.

178 Statistics Netherlands
5.1 International air passenger transport
In2008,theNetherlandsrankedsixthamongtheEU15memberstateswithrespecttointernationalairpassengertransport,with50.4millionpassengers.In2000,aircraftcarriedover600millionpassengersto,fromorbetweentheEU15member states (national air transport excluded). Eight years later close to856millionpassengerswerecarried.This4.5percentannualgrowthrateispartlyduetoairtransportliberalisation,whichresultedinanexplosiveriseinthenumberof low-cost carriers that made air transport increasingly competitive comparedwithothermodesof transport.Measured inpassenger-kilometres,EUair travelboomedinthe2003–2007period.Inmid2008theNetherlandsintroducedaflighttaxonticketsfordepartingpassengers,collecting127millioneurosintaxrevenue.Since2000,theUnitedKingdom,Germany,Spain,France,Italy,andtheNetherlandshaveall ranked in the topsix countries,with theUnitedKingdomtheabsolutenumberoneeveryyear,with22percentin2008.TheDutchairpassengermarketsharedropped1percentagepointto6percentinthisperiod,indicatingthatalargepartoftherapidgrowthinthenumberofairpassengersintheEUsince2003hasbeenabsorbedbyothermemberstates.Moreover, in2008, at the EU27 level, 55percent of international air passengertransportisintra-EUtransport.Overthelastnineyears,thistypeofairpassengertransport has grown twice as fast (+50percent) than extra-EU air passengertransport(+25percent).In terms of absolute number of international passengers handled in2008,Amsterdam/Schiphol (48million) is the third airport after London Heathrow(61million)andParis/CharlesdeGaulle(55million);andjustaheadofFrankfurt/Main(47million).94percent of all international air passengers in the Netherlands fly to or fromAmsterdam/Schiphol.Basedonabsolutepassengernumbers,Schipholstillleadsthetop30forintra-EUpassengertransportwithmorethan26.5millionpassengersin2008. In second and third place are Paris/Charles de Gaulle and LondonHeathrow,with25.7and22.3millionpassengersrespectivelyin2008.Most air passengers flying beyond the EU27 region pass through LondonHeathrowwhichhandles39millionairpassengersin2008.Withnearly21millionpassengerstoorfromAmsterdam/Schiphol,thisairportisrankedfourth.
TheinformationpresentedinthistableisprimarilybasedonOnFlightOrigin/Destination (OFOD) data and supplemented by Flight Stage (FS) data andairport declaration forms. Data is collected on the basis of the first origin/destinationofpassengers,andnotonthefinalorigin/destinationinthecaseofflightconnections.

Internationalisation Monitor 2010 179
Theflighttaxonticketsfordepartingpassengerswasabolishedon1July2009.Therearetwofixedrates.Alevyof11.25euroswasaddedtotheticketpriceofdestinations within the European Union and/or a distance no greater than2500kilometres,andachargeof45eurosfordestinationsbeyondthisdistance.Totalrevenueswere127millioneurosin2008(6months)and101millionin2009(6months).
Table C5.1 International passenger transport through EU 15 airports
2000 2001 2002 2003 2004 2005 2006 2007 2008
million air passengers
EU-15 605.2 603.7 602.7 630.3 694.1 747.0 794.2 847.7 855.5
UnitedKingdom 142.8 142.2 146.1 153.5 166.6 177.3 184.6 191.2 189.0Germany 98.6 97.2 94.0 99.9 114.5 124.1 131.3 139.5 140.9Spain 81.1 83.3 83.2 88.9 95.8 104.7 110.2 119.4 120.6France 65.6 65.8 68.6 69.6 76.0 81.3 86.2 92.8 95.8Italy 44.3 43.4 42.7 49.4 57.0 63.2 69.5 77.6 76.9TheNetherlands 40.4 39.4 40.6 41.0 44.4 46.4 48.5 50.4 50.4Ireland 24.6 24.9 24.8 23.2 24.0 25.0 26.6 28.1 29.2Greece 16.0 16.7 17.6 18.8 20.2 23.6 26.8 29.0 27.8Austria 14.2 14.1 14.4 15.2 17.7 19.1 20.2 22.3 23.2Denmark 17.1 18.0 18.2 17.8 19.4 20.5 21.2 22.1 22.6Portugal 13.4 13.3 14.5 14.9 16.0 17.3 19.0 21.4 22.3Belgium 21.6 19.8 14.3 15.1 17.5 17.8 19.1 20.7 21.9Sweden 16.3 16.2 14.6 13.6 14.7 15.6 18.7 20.1 21.1Finland 7.6 7.7 7.5 7.8 8.9 9.5 10.5 11.6 12.1Luxembourg 1.7 1.6 1.5 1.4 1.5 1.5 1.6 1.6 1.7
Source:Eurostat/StatisticsNetherlands.
C5.1 International passenger transport through EU 27 airports, top 10 airports 2008
Source: Eurostat.
Within the EU 27 Beyond the EU 27
0 10 20 30 40 50 60 70
London Heathrow
Paris/Charles de Gaulle
Amsterdam/Schiphol
Frankfurt/Main
London Gatwick
Madrid/Barajas
München
Roma/Fiumicino
Barcelona
Paris/Orly
million air passengers

180 Statistics Netherlands
5.2 International air freight and mail transport
Inspiteoftheeconomiccrisisin2008,thetotalvolumeoffreightandmailbetweentheEU15memberstatesandtherestof theworld increasedby2.8percent toatotalof13milliontonnes in2008.However,over thisperiodthevolumefor theNetherlandsdecreasedby3.6percenttolessthan1.7milliontonnes,whichmeanttheNetherlandscontinuedtobethethirdlargesttransporterofairfreightandmailamongthe15EUmemberstateswithamarketshareof13percent.TheNetherlands,GermanyandUnitedKingdomtogetheraccountedforover56percentofthetotaltonnageofairfreightandmailhandledbytheEU15in2008(includingintra-EU15double-counting).
Theextra-EUairfreightmarketisbyfarthemostimportantsegmentandrepresents80percentofthetotalvolume.Amsterdam(Schiphol)isanimportanthubairportfor the transport of intercontinental goods. Most of the total volume of freighthandledbytheNetherlandsistoandfromAsiaandAustralasiaandaccountsfor54percentofallDutchtransportofgoodsbyair.
ThevolumeoffreightandmailbetweentheNetherlandsandtheotherEuropeancountriesisrelativelysmall.Only6percentofthetotalDutchairtransportvolumehasaEuropeanpartner–comparedwithaEuropeanaverageof25percent.
Ofallcontinentsin2008,theflowofairfreightviatheNetherlandstoandfromAfricagrewbysixpercent,whichmeanttheNetherlandscontinuedtoberankednumber one of all 27EU member states in air freight volume destined for ororiginatedinAfrica.
Airfreightandmailtransportareregisteredaccordingtotheprincipleofloadedandunloadedbycountry,notincludingnationalmovements.Themailvolumeislessthan2.5percentofthetotalDutchairtransportweight.Theimportanceofairfreightandmailtransportgenerallyincreaseswiththedistancecovered.
Sincethesamemovementofgoodsisreportedasadeparturebyoneairportandasanarrivalbythepartnerairport,theEUtotalsexcludedouble-countingforintra-EU international transport. Data collection is based on the first origin/destinationoffreight,andnotontheactualorigin/destinationifthereareflightconnections.Inaddition,dataforFranceareunderestimatedsincethetwoParisairports,CharlesdeGaulleandOrly,donotreportallfreightandmailhandled;2007dataforDenmarkdonotincludeCopenhagenKastrupairport.

Internationalisation Monitor 2010 181
Table C5.2 International transport of freight and mail through EU 15 airports by continent of origin or destination, 2008
Europe North Centraland Africa Asiaand Total Growth America South Australasia 2007-2008 America
1,000 tonnes %
Germany 1,027.3 674.4 119.4 133.0 1,485.0 3,439.0 3.8UnitedKingdom 451.7 776.5 45.8 173.0 839.2 2,286.1 –1.6TheNetherlands 99.9 277.4 139.6 235.3 896.3 1,648.5 –3.6France 309.6 347.1 121.5 202.8 541.6 1,522.6 –1.5Belgium 355.7 145.9 16.7 177.2 375.3 1,070.8 –11.0Luxembourg 54.4 145.2 45.7 88.9 420.1 788.2 12.2Italy 288.1 116.4 22.5 19.1 298.3 746.7 –10.0Spain 175.6 65.2 119.4 17.1 60.9 438.3 9.3Denmark 138.1 35.2 0.0 0.1 78.0 251.5 .Austria 67.2 20.1 0.0 1.7 116.3 205.3 –0.2Sweden 107.3 17.4 0.0 0.3 59.3 184.4 .Finland 67.2 7.5 0.0 0.1 69.4 144.2 1.8Ireland 76.2 36.5 0.0 0.2 6.0 119.1 –2.3Portugal 63.3 5.5 28.7 16.5 0.2 114.3 5.3Greece 65.1 8.2 0.0 2.8 18.4 94.5 5.6
Source:Eurostat.
C5.2 International transport of freight and mail through EU 15 airports by continent of origin or destination; top 5 member states, 2008
Source: Eurostat.
Africa Asia and Australia
Europe North America Central and South America
0 20 40 60 80 100
Belgium
Germany
France
United Kingdom
The Netherlands
%

182 Statistics Netherlands
5.3 Internationalisation of goods transport flow by modality and by nationality of the transporters
Apartforasmalldeclinein2003,thetransportofgoodstoandfromtheNetherlandsincreasedby37percentsince2000toalmost1.1billiontonnesin2008.Themajorityofgoodsaretransportedbynon-Dutchtransportequipmententerprises.In2008,76percent of the total unloaded weight in the Netherlands was transported byforeigntransport-equipmententerprises.Ofthetotalloadedweight,42percentistransportedbynon-Dutchtransport-equipmententerprises.56percent of transportation of goods by road is handled by Dutch registeredvehicles.This is a threepercentagepointdecrease since2006.Over thepast fewyearswehaveobservedanincreaseinroadtransportbyvehiclesfromGermanyandPoland.TheweightofunloadedgoodsbyGermanregisteredvehiclesincreasedby21percentsince2006andloadedgoodsby13percent.Thisincreasewas24and41percentrespectivelyforPolishregisteredvehicles.Together,German(42percent),Belgian(22percent)andPolishtrucks(11percent)accountforthreequartersoftheforeignregistrationplatesonDutchroads,expressedintonneshauled.Comparedwithallothermodesoftransport,Dutchsea-shippingisverysmall.Just3percent of all goods to and 10percent of all goods from the Netherlands aretransportedbyshipsflyingtheDutchflag.The transport of goods on inland waterways mainly uses Dutch registeredtransportequipment.Two thirdsofall carriedgoods loaded in theNetherlandswere transported by a Dutch vessel. Over70percent of the goods on inlandwaterwaysunloadedintheNetherlandsthatcrossedtheborderwithGermanyorBelgium were shipped by inland vessels flying the Dutch flag. Because of theNetherlands’ geographical position, most foreign transporters in this mode ofgoodscarriagewereBelgianorGerman.Goodstransportedbyrailandpipeline,bothmodesoftransportunder‘other’,are100percentDutchbusiness.Yetabout54percentoftheairfreightandmailweightis transportedbyplanes registered in theNetherlands.Air transport-equipmentregistrations from Asian (25percent), American (11percent) and European(9percent)countriesaccountfortheremainder.
TransportinggoodstoandfromtheNetherlandsisnottheexclusivedomainofDutchenterpriseswithtransportequipment.ForeignenterpriseswithtransportequipmentalsocompetetoloadandunloadgoodsintheNetherlands.
The nationality of seagoing transport equipment is not specified by vesselowner,butbythecountryofregistration.Aship issaidtobeflyingaflagofconvenience if it is registered ina foreigncountry.Themostpopularflagsofconvenience as identified by the International Transport Workers’ Federation(ITF)arethoseofPanama,Liberia,theBahamas,andtheMarshallIslands.

Internationalisation Monitor 2010 183
Table C5.3 Weight of transported goods by nationality of transport equipment, 2008
UnloadedintheNetherlands LoadedintheNetherlands
total sea- inland road others1) total sea- inland road others1)
ship- water- trans- ship- water- trans- ping ways port ping ways port
1,000 tonnes
Total 600,823 412,164 66,057 88,264 34,338 491,317 148,193 122,427 92,986 127,711
Dutch transport equipment 145,851 14,239 48,003 49,709 33,900 283,716 14,278 84,314 57,731 127,393
Foreign transport equipment 454,971 397,925 18,054 38,555 437 207,601 133,916 38,113 35,254 318
Europe 239,857 183,156 18,048 38,555 98 142,634 69,221 38,113 35,254 46EU14 154,509 106,133 17,007 31,295 74 108,915 46,006 36,238 26,643 28incl.
Belgium 21,522 3,383 9,389 8,729 21 23,930 2,279 14,282 7,354 15Denmark 10,364 10,022 342 0 6,904 6,583 321 0Germany 34,704 10,754 6,266 17,684 0 42,377 8,471 20,099 13,807 0France 6,374 4,394 985 995 0 4,852 2,174 1,204 1,474 0Greece 32,948 32,848 – 100 0 3,965 3,822 – 143 0UnitedKingdom 32,519 32,519 – – – 16,235 16,235 – – –Sweden 4,528 4,428 – 100 0 2,025 1,923 – 102 0
otherEuropeancountriesincl. 85,349 77,023 1,042 7,260 24 33,719 23,215 1,875 8,611 18Cyprus 13,543 13,543 – 0 – 5,736 5,734 – 1 1Malta 25,907 25,907 – – – 6,501 6,501 – – 0Norway 26,850 26,775 – 75 0 6,474 6,356 – 118 0Poland 3,806 99 41 3,666 – 4,906 267 58 4,581 0Russia 2,828 2,828 – – 0 1,012 1,011 – – 1
Africa 44,422 44,414 – – 8 11,830 11,825 – – 5incl.Liberia 44,078 44,078 – – – 11,598 11,598 – – –
America 110,051 109,945 8 – 98 36,893 36,806 – – 87incl.
AntiguaandBarbuda 10,987 10,987 – – – 13,466 134,66 – – –Bahamas 30,893 30,893 – – – 5,277 5,277 – – –Panama 58,481 58,481 – – – 13,416 13,416 – – –
Asia 44,392 44,159 – – 233 10,690 10,510 – – 180incl.
Singapore 14,086 14,042 – – 44 5,133 5,097 – – 36HongKong 14,574 14,565 – – 9 2,251 2,240 – – 11
Oceaniaandothers 16,250 16,250 – – 0 5,554 5,554 – – 0incl.
MarshallIslands 14,963 14,963 – – – 5,493 5,493 – – –
%
Total 100 100 100 100 100 100 100 100 100 100
Dutch transport equipment 24 3 73 56 99 58 10 69 62 100
1) Transportbyair,railwayandpipelines.
Source:StatisticsNetherlands,Eurostat.

184 Statistics Netherlands
C5.3 Share of Dutch road transport by vehicle registration
%
2006
Source: Eurostat, Statistisch Netherlands.
2007 2008
0
10
20
30
40
50
60
70
Dutch vehicle German, Belgianand Polish vehicles
Other vehicles Dutch vehicle German, Belgianand Polish vehicles
Other vehicles
Unloaded in the Netherlands Loaded in the Netherlands

186 Statistics Netherlands
5.4 International sea container flow by origin and destination
Since its introduction in themid-sixties, thecontainerhasbecomecrucial to thedevelopment of international trade. Container traffic along the European coasts(SSS) and long distance container traffic (DSS) are developing fast. Over theperiod2000–2008SSScontainer transport through theNetherlands increasedby61percent,whileDSStransportgrewby72percent.
Notalltheoriginsanddestinationsdisplaythesamegrowthrate.Inshortrangetransport Russia grew the fastest in absolute (+114thousand containers) andrelativeterms(+600percent)intheperiod2000–2008.Morethan50percentoftheSSS containers handled in the Netherlands came from and went to the UnitedKingdomandIreland.Theshareoftrafficfromandtothetop10countriesincreasedinthisperiodattheexpenseofthe‘othercountries’.
ContainertransporttoandfromsmallEuropeancountrieslikeIcelandissizeable.Icelandproducesalotofaluminium,andthefishingindustryisalsoasignificantsupplier.FinlandandSwedenexportpaperandwoodtotherestoftheworld.TheDutchportsplayanimportantroleinthedistributionoftheseproducts.
ChangesintradevolumesbetweenEuropeandEasternAsiaarewellreflectedinthedata.LongdistancetransportationinbothdirectionsisdominatedbyChina.Volume increased by 400percent and 640percent respectively. This flow took a33percentshareoftheDSStransportin2008(excludingHongKong).MalaysiaisanothereasternAsiancountrywithamassivegrowthof350percentto121thousandcontainers.Almost4ofevery5thecontainershaveAsiaasoriginordestination.Theshareofthetoptenloadingandunloadingcountriescontinuestoincrease.IntheshortseatraffictowardtheNetherlands,thesharewentupfrom83to90percent.Thedestinationtop10hasalsoincreaseditssharefrom80to88percent.TheDeepSeaShippingtop10hadashareofmorethan83percentin2008.
Containers are registered according to the principle of loaded in NL andunloaded inNL.“ShortSeaShippingorCoastalShipping” (SSS) includesallpartnerportssituated ingeographicalEurope,on theMediterraneanandtheBlack Sea. “Deep Sea Shipping” (DSS) is the complementary geographicalaggregate.ShortSeaShippingincludes“feederservices”:ashortseanetworkbetweenportsinorderforthefreighttobeconsolidatedorredistributedtoorfromadeepseaserviceinoneoftheseports(“hubports”).

Internationalisation Monitor 2010 187
Table C5.4 Container transport to and from the Netherlands in Short Sea Shipping and Deep Sea Shipping, 2000-2008
2000 2001 2002 2003 2004 2005 2006 2007 2008
1, 000 containers
Total 4,006 3,875 4,143 4,490 5,161 5,710 6,138 6,809 6,737
Unloaded in the Netherlands 2,001 1,982 2,100 2,293 2,660 2,974 3,205 3,510 3,485
Short Sea Shipping 679 647 701 742 897 987 1,059 1,168 1,127
UnloadedintheNetherlandsandloadedin:top10countries: 562 542 596 636 785 857 933 1,042 1,018
UnitedKingdom 250 243 274 298 350 378 378 382 354Ireland 100 115 116 145 186 162 181 180 165Russia 19 16 17 23 53 74 90 112 133Finland 25 17 17 18 16 22 43 73 95Spain 41 43 53 44 51 60 62 77 65Iceland 20 18 23 20 21 27 35 45 47Sweden 29 17 19 14 20 29 30 48 44Norway 37 32 33 32 37 39 46 48 43Portugal 23 26 30 26 34 47 39 42 40Germany 19 17 13 15 17 20 29 36 32
othercountries 117 104 105 107 112 129 126 126 109shareoftop10countries(%) 82.8 83.8 85.0 85.7 87.5 86.8 88.1 89.2 90.3
Deep Sea Shipping 1,322 1,336 1,399 1,550 1,763 1,987 2,147 2,342 2,358
UnloadedintheNetherlandsandloadedin:top10countries 1,066 1,069 1,129 1,229 1,405 1,485 1,776 1,949 1,966
China 157 168 228 304 398 533 601 755 768UnitedStates 207 220 228 218 177 231 247 254 262Singapore 206 160 169 170 191 149 254 239 236Japan 131 128 119 118 144 105 134 137 156HongKong 145 133 120 129 148 141 154 152 136Malaysia 27 48 67 68 94 78 100 121 121Brazil 45 51 52 68 87 86 87 97 96Taiwan 61 51 47 54 59 59 79 77 72SouthKorea 64 60 59 58 63 58 71 76 66SouthAfrica 23 50 41 42 44 47 48 43 52
othercountries 257 267 270 321 358 503 370 393 392shareoftop10countries(%) 80.6 80.0 80.7 79.3 79.7 74.7 82.7 83.2 83.4

188 Statistics Netherlands
Table C5.4 (cont’d)
2000 2001 2002 2003 2004 2005 2006 2007 2008
1, 000 containers
Loaded in the Netherlands 2,005 1,893 2,043 2,197 2,500 2,736 2,933 3,299 3,252
Short Sea Shipping 783 743 799 865 980 1,141 1,266 1,294 1,225
LoadedinintheNetherlandsandunloadedin:top10countries 626 620 675 736 827 968 1,063 1,117 1,082
UnitedKingdom 250 253 285 313 350 406 421 424 390Ireland 99 110 132 144 154 162 169 175 151Russia 19 16 26 25 44 73 100 104 121Spain 54 52 55 63 73 90 101 113 112Finland 31 26 28 31 30 29 35 66 74Portugal 46 47 43 47 58 68 63 54 65Sweden 46 34 28 31 30 32 33 66 57Norway 34 32 31 35 39 34 42 40 45Germany 30 30 27 27 28 48 64 38 35Iceland 17 20 18 21 22 27 34 37 33
othercountries 156 123 124 129 153 173 203 177 143shareoftop10countries(%) 79.9 83.4 84.5 85.1 84.4 84.8 84.0 86.3 88.3
Deep Sea Shipping 1,222 1,150 1,245 1,333 1,520 1,595 1,667 2,005 2,026
LoadedinintheNetherlandsandunloadedin:top10countries 922 852 965 1,035 1,229 1,281 1,367 1,661 1,694
China 81 98 107 140 247 305 369 561 601UnitedStates 233 233 256 231 240 250 228 226 231Singapore 172 112 138 145 152 178 197 183 215HongKong 102 102 97 95 113 119 158 181 131Japan 123 107 120 122 112 98 111 125 125Malaysia 27 40 53 64 80 74 78 113 112Brazil 18 23 28 42 60 42 38 76 81Taiwan 70 59 78 97 111 94 76 70 78SouthKorea 53 38 45 47 66 74 76 84 69UnitedArabEmirates 43 39 43 51 49 48 37 42 51
othercountries 300 298 279 298 290 314 300 345 333shareoftop10countries(%) 75.5 74.1 77.5 77.6 80.9 80.3 82.0 82.8 83.6
Source:StatisticsNetherlands,MaritimeStatistics.

Internationalisation Monitor 2010 189
C5.4A Sea container transport to and from the Netherlands
1,000 containers
Deep Sea Shipping (unloaded)
Source: Statistics Netherlands.
Short Sea Shipping (unloaded)
Deep Sea Shipping (loaded) Short Sea Shipping (loaded)
0
1,000
2,000
3,000
4,000
5,000
6,000
7,000
8,000
2000 2001 2002 2003 2004 2005 2006 2007 2008
C5.4B Growth of sea container transport to and from the Netherlands
Source: Statistics Netherlands.
Short Sea Shipping Deep Sea Shipping
0
20
40
60
80
100
120
140
160
180
200
2000 2001 2002 2003 2004 2005 2006 2007 2008
index 2000 = 100

190 Statistics Netherlands
C6 Internationalisation and employment
Introduction
The linked employer-employee dataset: methodological improvements
Thelinkedemployer-employeedataset(LEED)complementsexistingSNdatabymaking a distinction between foreign and Dutch controlled enterprises in theNetherlands.Foreign controlledenterpriseshavea centreof controloutside theNetherlands;Dutchcontrolledenterprisesarenationallyowned.Thedistinctionenablesananalysisoftheconsequencesofinwardforeigndirectinvestment(FDI)ontheemploymentsituationintheNetherlandsatthemicrolevel.
Thedatasethasbeencreatedbylinkingbusinessandsocialdatawiththeuniqueenterpriseidentifier(BEID)asthekeyvariable.ThevariableUltimateControllingInstitute (UCI), which identifies the country in which strategic decision-makingtakesplace,hasbeenusedtodescribethedifferencesbetweenDutchandforeigncontrolledenterprises.TheUCI isdeterminedonanannualbasisbycombiningenterpriseinformationfromvarioussources.TwosurveysconductedbySN,whichwereusedtodeterminethelocationofcontrol,aretheFinancialStatisticsofLargeEnterprise Groups (SFGO) and the Community Innovation Survey (CIS). Theymainlytargetlargefirms,therebyleadingtoaslightunderrepresentationofsmallto medium-sized firms in the original LEED dataset (see TableSection B5,Internationalisation Monitor 2009,foranoverview).However,from2006onwards,theUCIlistofenterprisesintheGeneralBusinessRegister (GBR), which is based on SFGO and CIS information at SN, has beencompletedbytheadditionofinformationfromanexternalsource(Dun&Bradstreetdatabase),providingabetterinsightintothetotalshareofforeignenterprisesintheNetherlands.Inaddition,aredesignoftheSocialStatisticalDatabaseinthatyearhasresultedinabettermatchofthekeyindicatorsonemployment,viatheuniqueenterprise identifier (BEID), with the concurrent economic indicators. Theseimprovements mean that the locus of control can now be established for over90percentofthetotalpopulationofenterprises(withregisteredjobsintheSocialStatisticalDatabase)intheNetherlands.AweightingprocedurewasdevelopedfortheremainingshareofenterprisesthatcouldnotbematchedtotheGBR.
TablesC6.0aandC6.0bpresentanoverviewoftheestimatedshareofforeignandDutchcontrolledenterpriseswithregisteredjobsintheNetherlands,basedontheextendedemployer-employeedataset.Weightedfiguresarebrokendownbysizeclassandindustryfortheyears2006–2007.

Internationalisation Monitor 2010 191
Table C6.0A Dutch controlled and foreign controlled enterprises in the linked employer-employee dataset (weighted) by size class
2006 2007
Total 444,162 466,561
Dutch controlled 437,653 460,510
0–4employees 308,790 313,1755–9employees 62,431 73,54910–19employees 34,307 38,74220–49employees 20,310 22,24450–99employees 5,922 6,335100–249employees 3,469 3,908250ormoreemployees 2,425 2,557
Foreign controlled 6,509 6,051
0–4employees 1,255 1,0625–9employees 804 72010–19employees 992 91220–49employees 1,318 1,21450–99employees 796 781100–249employees 787 798250ormoreemployees 558 565
Table C6.0B Dutch controlled and foreign controlled enterprises in the linked employer-employee dataset (weighted) by industry
2006 2007
Total 444,162 466,561
Dutch controlled 437,653 460,510
Agriculture,miningandquarrying 18,641 18,912Foodandbeverages 3,607 3,600Paper,paperproductsandpublishers 4,221 4,260Chemicalsandplasticproducts 1,560 1,624Metalproducts 4,869 5,139Machineryandequipment 3,112 3,241Othermanufacturingandutilities 10,199 10,525Construction 29,010 31,148Tradeandrepairs 93,508 97,599Hotelsandrestaurants 26,893 27,959Transport,storageandcommunication 14,086 15,004Financialintermediation 69,957 71,279Realestate,rentingandbusinessservices 95,646 105,562Otherservices 62,345 64,658
Foreign controlled enterprises 6,509 6,051
Agriculture,miningandquarrying 58 57Foodandbeverages 107 100Paper,paperproductsandpublishers 155 146Chemicalsandplasticproducts 305 297Metalproducts 110 99Machineryandequipment 248 215Othermanufacturingandutilities 385 383Construction 121 107Tradeandrepairs 2,530 2,334Hotelsandrestaurants 67 57Transport,storageandcommunication 493 444Financialintermediation 526 461Realestate,rentingandbusinessservices 1,251 1,212Otherservices 152 140

192 Statistics Netherlands
6.1 Employment in foreign and Dutch controlled enterprises
Bysettingupaffiliatesandhiringworkers, inward investmentbymultinationalenterprises(MNEs)maydirectlyaffectemployment,wages,andlabourconditionsin host countries. Our linked employer-employee data indicate that foreignownershiphasapositiveeffectonemploymentintheNetherlands.Otherempiricalstudies on the effects of inward investment have also indicated that foreignenterprisescreateemployment(forrecentcontributionsseee.g.Driffield,1999;FuandBalasubramanyam,2005;Görg,2000;Radosevicetal.,2003).
AsGraphC6.1shows,foreigncontrolledenterprises(mostlyMNEs)areconsistentlylarger and therefore generally have a bigger workforce than Dutch controlledenterprises.From2006onwardsthereisageneralupwardtrendintermsofaveragenumberofjobswithforeigncontrolledenterprisescomparedwithDutchcontrolledcounterparts.Accordingly,foreigncontrolledenterpriseshaveapositiveimpactonthejobsituationintheNetherlands.
TableC6.1 presents a more detailed overview of the employment situation atforeign and Dutch controlled enterprises in the Netherlands for 2006 and 2007,brokendownbyactivitysector.Therearemorejobsatforeignenterprisesacrossallindustries.However,thegreatestdifferencesbetweenDutchandforeigncontrolledenterprisesaretobefoundinthehotelsandrestaurantssector,andalso,toasimilarextent,inthefoodandbeveragessectorandtransport,storageandcommunicationsectors.
Theincreaseintheaveragenumberofforeigncontrolledjobsfrom2006to2007isalsothehighestintheabovementionedindustries,aswellasinthemachineryandequipmentandotherservicessectors.Incontrast,Dutchcontrolledenterprisesdidnotgrowasfastasforeigncontrolledenterprisesinthatperiod,andonlyshowedaslight increase in the machinery and equipment and transport, storage andcommunicationsectors.Withregardtoallothersectors,thenumberofjobsin2006–2007inDutchcontrolledenterpriseseitherstabilisedorshowedamodestdecline.
In TableC6.1 average employment was calculated as the (weighted) averagenumberofjobsperyear,bylocusofcontrol(foreignvs.Dutch)andindustryoftheenterprise.

Internationalisation Monitor 2010 193
Table C6.1 Average employment in foreign and Dutch controlled enterprises by industry, 2006–2007 (weighted)
2006 2007
foreign Dutch foreign Dutch controlled controlled controlled controlled
average number of employees
Total 120 15 125 15
Industry
Agriculture,miningandquarrying 76 6 75 6Foodandbeverages 227 27 246 27Paper,paperproductsandpublishers 151 16 153 17Chemicalsandplasticproducts 144 34 147 33Metalproducts 130 16 133 16Machineryandequipment 97 21 109 23Othermanufacturingandutilities 190 29 195 29Construction 142 12 147 12Tradeandrepairs 75 11 81 11Hotelsandrestaurants 475 9 552 10Transport,storageandcommunication 205 21 199 23Financialintermediation 74 4 66 4Realestate,rentingandbusinessservices 144 13 149 13Otherservices 98 37 115 36

194 Statistics Netherlands
6.2 Labour turnover rate at foreign and Dutch controlled enterprises
Labourturnover,orthejobseparationrateperenterprise,isanimportantindicatoroflabourdynamics.Itisdeterminedbytheoutflowofjobsasashareoftheaveragenumber of jobs per enterprise per year. Labour turnover gives an indication ofemployees’ willingness or ability to change jobs. Outflow might be caused byinvoluntary employee loss (firing, layoffs), termination of seasonal jobs, or bydischarges resulting from mergers or downsizing.Additionally, outflow of jobswithinanenterprisemayalsobedrivenbyretirementorvoluntaryjobchanges.Informationonlabourturnoveristhereforeavaluableindicatorinlabourmarketanalysisandservesasacomplementtotheunemploymentrate.
Dutchcontrolledenterprisesingeneralshowahigherlabourturnover,intermsofoutflowofjobs,thanforeigncontrolledenterprisesintheNetherlands.Thisalsoapplies to theenterprises included inour linkedemployer-employeedataset,asshowninGraphC6.2.However,foreignenterprisesdidachievealowerretentionrate,withlabourturnoverincreasingby5percentagepoints,from2006to2007.
TableC6.2 specifies the labour turnover rate at foreign and Dutch controlledenterprisesbrokendownbysectorofactivity.Acrosstheboard,inallindustries,Dutchcontrolledenterprisesshowahigherturnoverratethanforeigncontrolledenterprises,in2006andin2007.Firmsize,however,doesplayasignificantroleinlabourturnoverratesatDutchcontrolledenterprises.Overall,theratetendstobelowerasDutchcontrolledenterprisesarelarger(averagenumberofemployees).
ThereisaparticularlyhighturnoverofemployeesatDutchcontrolledenterprisesinthehotelandrestaurantindustries,andintheagriculture,miningandquarryingsectors. This also applies to some extent to foreign controlled enterprises withactivitiesinthesesectors.Itislikelythatthisisduetoshort-termworkcontractsandseasonalemployment,whichleadstoagreateroutflowofjobsinthesesectorsperyear.
The mean labour turnover rate in the Netherlands was calculated as the(weighted) average number of outgoing employees, asa percentage of theaverage number of jobs per year, by locus of control (foreign versus Dutchcontrolledenterprises).Inaddition,separateturnoverratioswerethencalculatedforeachcategoryofinterest,i.e.industryandsizeclass.

Internationalisation Monitor 2010 195
Table C6.2 Labour turnover at foreign and Dutch controlled enterprises by industry and size class, 2006-2007 (weighted)
2006 2007
foreign Dutch foreign Dutch controlled controlled controlled controlled
outflow / average number of jobs (%)
Total 30 40 35 41
Industry
Agriculture,miningandquarrying 19 83 21 82Foodandbeverages 17 26 16 27Paper,paperproductsandpublishers 27 24 24 23Chemicalsandplasticproducts 12 17 12 19Metalproducts 13 20 13 22Machineryandequipment 13 18 15 19Othermanufacturingandutilities 13 14 12 14Construction 19 22 18 23Tradeandrepairs 27 34 28 38Hotelsandrestaurants 42 77 45 83Transport,storageandcommunication 19 31 23 33Financialintermediation 15 17 17 18Realestate,rentingandbusinessservices 58 87 74 84Otherservices 44 24 41 24
Size class
0–4employees 25 43 24 465–9employees 29 46 33 5010–19employees 28 43 28 4620–49employees 33 42 26 4350–99employees 24 43 23 44100–249employees 23 37 24 40250ormoreemployees 33 38 40 36

196 Statistics Netherlands
6.3a Share of high and low-paid employees in foreign and Dutch controlled enterprises
Theratioofskilledversusunskilledwageisreferredtoastherelativewageandmayserveasaproxyforoverallincomeinequality.Foreignenterprisestendtopayhigher wages, attract more highly-educated employees, and at the same timepreventlabourmigrationtonearby(domestic)enterprisesorpreventpeoplefromsettingup theirownenterprises.Furthermore, foreignenterprisesmaybemoreproductiveingeneral,substantiatingahigherwagelevel.
In line with this, foreign controlled enterprises in the Netherlands have asubstantially higher share of high-paid employees in their workforce than theirDutchcontrolledcounterparts;andconversely,Dutchcontrolledenterpriseshaveahighershareoflow-paidemployees.GraphC6.3aillustratesinmoredetailthatDutchandforeigncontrolledenterpriseshavearelativelystableshareofhigh-paidandlow-paidworkersbothin2006and2007;foreigncontrolledenterprisesintheNetherlandsemployapproximately0.8timesmorehigh-paidworkersandDutchenterprisesemploy0.6–0.7timesmorelow-paidworkers.
ThedifferencebetweenforeignandDutchcontrolledenterprisesintermsofhighlypaidworkersmightbearesultofFDIdemandingmorehighly-skilledfunctionstocoordinate the new foreign venture in the Netherlands. Another reason whyforeign enterprises pay higher wages might be to attract highly-educatedemployees,whilesimultaneouslypreventinglabourmigrationtonearby(domestic)enterprisesortopreventpeoplefromsettinguptheirownenterprises.Furthermore,foreignenterprisesmaybemoreproductive ingeneral,whileoperating innew,innovativesectors,therebysubstantiatingahigherwagelevel.
Employees and their jobs are classified as high-paid if their wage is inthe81stpercentileorhigherofallregistered jobsintheNetherlands.Jobsareclassifiedaslow-paidiftheyareinthe30thwagepercentileorlower.
The mean share of high-paid employees was calculated as the (weighted)averagenumber of high-paid jobs, as a percentage of the average number oftotal jobs registered in the Netherlands per year, by locus of control (foreignversusDutchcontrolledenterprises).Asimilarapproachwastakentodeterminethemeanshareoflow-paidemployees.

Internationalisation Monitor 2010 197
C6.3a Share of high and low-paid employees at foreign and Dutch controlled enterprises (weighted)
40
30
20
10
0Low-paid High-paid Low-paid High-paid
2006 2007
%
Dutch controlled Foreign controlled

198 Statistics Netherlands
6.3b Share of high and low-paid employees in foreign and Dutch controlled enterprises, by industry and size class
TableC6.3bshowsthatforeignenterprises intheNetherlandspaidsubstantiallyhigher wages in2007 than Dutch controlled enterprises, across all industries.Conversely,Dutchenterprisesconsistentlyhaveahighershareoflow-paidworkersthanforeignenterprises.
When comparing the ratio of high versus low-paid workers by industry, thedifferencesbetweenDutchandforeigncontrolledenterprisesaremostpronouncedintheagriculture,miningandquarrying,foodandbeverages,othermanufacturing,hotel and restaurant and trade and repair sectors. The agriculture sector inparticular stands out, where foreign enterprises employed about 5times morehighly paid workers than Dutch controlled enterprises in2007. The hotels andrestaurantsectoralsostandsout,forbothforeignandDutchcontrolledenterprisesalike,inhavingadisproportionateshareoflow-paidworkers,andveryfewhigh-paidworkers.
ForeignenterprisesintheNetherlandsalsopaidsubstantiallyhigherwagesin2007thanDutchcontrolledenterprises,acrossallsizeclasses,asGraphC6.3bshows.Evenverylargeforeigncontrolledenterprises(250+employees),oftenreferredtoasMNEs,haveasubstantiallylargershareofhigh-paidworkerscomparedwiththeirDutchcounterparts.
Furthermore,forDutchcontrolledenterprisesthereisastrongpositivecorrelationbetweenenterprisesizeandtherelativeshareofhigh-paidworkers.Conversely,inforeigncontrolledbusinesses,thehighestshareofhigh-paidworkerscanbefoundinverysmallbusinesses,consistingoftheownerandoneortwoemployees.Thismightbeexplainedbythefact that foreignbusinessownerspayoutpartof thefirm’sprofitastheirownsalaryandthattheyaregenerallymorehighlyeducated.
Employees and their jobs are classified as high-paid if their wage is inthe81stpercentileorhigherofallregistered jobsintheNetherlands.Jobsareclassifiedaslow-paidiftheyareinthe30thwagepercentileorlower.
The mean share of high-paid employees was calculated as the (weighted)averagenumber of high-paid jobs, as a percentage of the average number oftotal jobs registered in the Netherlands per year, by locus of control (foreignversusDutchcontrolledenterprises).Asimilarapproachwastakentodeterminethemeanshareoflow-paidemployees.Inaddition,separateratioswerethencalculatedforeachcategoryofinterest,i.e.industryandsizeclass.

Internationalisation Monitor 2010 199
Table C6.3b Share of high and low-paid employees working at foreign and Dutch controlled enterprises by industry, 2007 (weighted)
High-paid Low-paid
foreign Dutch foreign Dutch controlled controlled controlled controlled
Total 34 18 18 31
Industry
Agriculture,miningandquarrying 51 10 5 44Foodandbeverages 45 19 4 27Paper,paperproductsandpublishers 39 26 6 15Chemicalsandplasticproducts 53 37 4 9Metalproducts 26 17 4 14Machineryandequipment 34 29 5 11Othermanufacturingandutilities 46 19 4 15Construction 39 22 4 11Tradeandrepairs 30 11 25 46Hotelsandrestaurants 6 2 46 72Transport,storageandcommunication 31 19 11 26Financialintermediation 56 49 6 14Realestate,rentingandbusinessservices 30 22 28 35Otherservices 22 16 21 29
C6.3b Share of high-paid employees at foreign and Dutch controlled enterprises by size class, 2007 (weighted)
0 10 20 30 40 50
250 or more employees
100–249 employees
50–99 employees
20–49 employees
10–19 employees
5–9 employees
0–4 employees
Dutch controlled
%
Foreign controlled

200 Statistics Netherlands
6.4 Labour force composition in foreign and Dutch controlled enterprises
ForeignandDutchcontrolledenterprisesdonotdifferdramaticallywithrespecttothemake-upoftheirworkforceintermsofgender,ageandnationality.However,thereareafewsmalldifferences,someofwhichbecomemorepronouncedwhenlookingatthebreakdownbyindustryorsizeclass,asshowninTableC6.4.Onaverage,foreignandDutchcontrolledenterpriseshaveanequalshareofolderworkers,asshowninGraphC6.4.However,asubstantiallyhighershareofolderemployeesworkforforeigncontrolledenterprisesintheagriculture,miningandquarryingandhotelandrestaurantsectorscomparedwiththeirDutchcounterparts,seeTableC6.4.Conversely,thereisasubstantiallyhighershareofolderemployeesworking for Dutch controlled companies in the transport, storage andcommunicationandotherservicessectors.ThereisasignificantdifferencebetweenforeignandDutchenterpriseswithregardto their share of female workers, as shown in TableC6.4. In general, Dutchcontrolledenterprisesemploymorefemales:almostoneintwoworkerscomparedwithoneinthreeatforeigncontrolledcounterparts.Thismightbeexplainedbythefactthatpart-timeworkingcontractsaremorecommonamongDutchcontrolledenterprisesandthisinturnmightattractmorefemaleworkers.Overall,theshareoffemaleworkersishighestinthetradeandrepair,hotelsandrestaurants,financialintermediation,realestate,renting,businessandotherservicessectors.Perhaps not surprisingly, there is a substantially lower share of native Dutchemployeesworkingatforeigncontrolledenterprises.Thiscouldbeduetoalargershareofexpatriateworkersacquiredthroughtakeoversandoffshoring,orsimplybecausetheworkinglanguageor internationalorientationofforeignenterprisesattractsornecessitatesmoreforeignemployees.Nevertheless,theshareofnativeDutchworkersisstillrelativelyhigh,around75percentin2007,whereasatDutchcompaniestheshareofnativeDutchemployeesisonly10to15percenthigher.Thedifference in the relativeshareofDutchnativeworkers ismostpronounced forverysmallenterprises.
The composition of the workforce describes the characteristics of employeeswithinanenterprise.Bylinkingcharacteristicsofemployeesusefulinformationisgatheredaboutdifferent,moreorlesshomogeneous,groupsofemployees.Fromtheperspectiveofglobalisationitisofinterestwhetherthegroupsdifferdependingonthelocusofcontrolofanenterprise(foreignversusDutchcontrolled).ThemeanshareoffemaleemployeesintheNetherlandswascalculatedasthe(weighted) averagepercentage of women in the total workforce in theNetherlandsattheendoftheyear,bylocusofcontrol.Similarcalculationsweremadefortheshareofolder(50yearsandover)andnativeDutchemployees.Inaddition,separateratioswerethencalculatedforeachcategoryofinterest,i.e.industryandsizeclass.

Internationalisation Monitor 2010 201
Table C6.4 Share of female, older (50+) and native Dutch employees working at foreign and Dutch controlled enterprises by industry and size class, 2007 (weighted)
Femaleemployees Older(50+)employees NativeDutchemployees
foreign Dutch foreign Dutch foreign Dutch controlled controlled controlled controlled controlled controlled
%
Total 33 47 20 23 74 81
Industry
Agriculture,miningandquarrying 22 28 28 17 79 84Foodandbeverages 24 36 24 23 76 83Paper,paperproductsandpublishers 29 35 25 27 80 85Chemicalsandplasticproducts 21 24 26 25 79 81Metalproducts 10 11 27 24 79 82Machineryandequipment 13 12 26 24 80 86Othermanufacturingandutilities 12 22 31 32 78 83Construction 12 9 25 25 81 90Tradeandrepairs 44 47 16 17 77 84Hotelsandrestaurants 61 52 21 10 68 72Transport,storageandcommunication 31 25 21 29 73 84Financialintermediation 42 40 23 26 76 85Realestate,rentingandbusinessservices 37 40 16 17 65 69Otherservices 41 67 17 29 77 85
Size class
0–4employees 31 43 23 23 67 815–9employees 30 45 20 19 71 8310–19employees 31 39 19 19 76 8320–49employees 28 38 18 20 75 8250–99employees 27 40 19 22 77 81100–249employees 27 43 21 25 74 81250ormoreemployees 36 54 21 26 73 81
C6.4 Share of female, older (50+) and native Dutch employees working at foreign and Dutch controlled enterprises (weighted)
9080706050403020100
Native 50+ Female Native 50+ Female
2006 2007
%
Dutch controlled Foreign controlled
Internationalisation Monitor 2010 203
Contributors to the Internationalisation Monitor 2010
Anne-PeterAlberdaPietBoersmaRenéBongardFabienneFortanierSandraGeneeMarjolijnJaarsmaMarjoleinKorvorstAndriesKuipersChantalLemmens-DirixOscarLemmersMartinLuppesFritsMullendersEugenevanderPijllPeterSmeets