International Workshop on Spatial Data Quality (SDQ 2020 ...
84
Workshop Report European Spatial Data Research December 2020 Joint Workshop of EuroGeographics - EuroSDR - OGC - ISO TC 211 - ICA 3 rd International Workshop on Spatial Data Quality (SDQ 2020) Jonathan Holmes, Carol Agius, Joep Crompvoets January 28 th - 29 th 2020 - Valletta, Malta
Transcript of International Workshop on Spatial Data Quality (SDQ 2020 ...

Workshop Report
European Spatial Data Research
December 2020
Joint Workshop of EuroGeographics -EuroSDR - OGC - ISO TC 211 - ICA
3rd International Workshop onSpatial Data Quality (SDQ 2020)
Jonathan Holmes, Carol Agius, Joep Crompvoets
January 28th - 29th 2020 - Valletta, Malta

The present publication is the exclusive property of
European Spatial Data Research
All rights of translation and reproduction are reserved on behalf of EuroSDR.
Published by EuroSDR

EUROPEAN SPATIAL DATA RESEARCH
PRESIDENT 2020 – 2022:
Michael Hovenbitzer, Germany
VICE-PRESIDENT 2019 – 2021:
Fabio Remondino, Italy
SECRETARY – GENERAL 2019 – 2023:
Joep Crompvoets, Belgium
DELEGATES BY MEMBER COUNTRY:
Austria: Wolfgang Gold, Gottfried Mandlburger
Belgium: Eric Bayers
Croatia: Ivan Landek, Željko Bačič
Cyprus: Andreas Sokratous, Georgia Papathoma, Andreas Hadjiraftis, Dimitrios Skarlatos
Denmark: Jesper Weng Haar, Tessa Anderson
Estonia: Tambet Tiits, Artu Ellmann, Evelyn Uuemaa
Finland: Juha Hyyppä, Juha Kareinen
France: Bénédicte Bucher, Yannick Boucher
Germany: Michael Hovenbitzer, Lars Bernard
Ireland: Paul Kane, Audrey Martin
Norway: Jon Arne Trollvik, Ivar Maalen-Johansen
Poland: Adam Andrzejewski, Krzysztof Bakuła
Slovenia: Dalibor Radovan, Peter Prešeren, Marjan Čeh
Spain: Julián Delgado Hernández
Sweden: Tobias Lindholm, Thomas Lithén, Heather Reese
Switzerland: André Streilein, François Golay
The Netherlands: Jantien Stoter, Martijn Rijsdijk
United Kingdom: Sally Cooper, Claire Ellul
ASSOCIATE MEMBERS AND THEIR REPRESENTATIVES:
Esri: Nick Land
Hexagon: Simon Musaeus
Informatie Vlaanderen: Jo Van Valckenborgh
nFrames: Konrad Wenzel
Terratec: Leif Erik Blankenberg
Vexcel: Michael Gruber
1Spatial: Dan Warner

COMMISSION CHAIRPERSONS:
Data Acquisition: Jon Mills, United Kingdom
Modelling and Processing: Norbert Haala, Germany
Updating and Integration: Martijn Rijsdijk, The Netherlands
Information Usage: Bénédicte Bucher, France
Business Models and Operation: Joep Crompvoets, Belgium
Knowledge Transfer: Markéta Potůčková, Czech Republic
OFFICE OF PUBLICATIONS:
Bundesamt für Eich- und Vermessungswesen
Publications Officer: Christine Ressl
Austria
Contact via EuroSDR secretariat
CONTACT DETAILS:
EuroSDR Secretariat
KU Leuven Public Governance Institute
Faculty of Social Sciences
Parkstraat 45 bus 3609
3000 Leuven
Belgium
Tel.: +32 16 37 98 10
Email: [email protected]
Web: www.eurosdr.net
The official publications of EuroSDR are peer-reviewed.

4
Jonathan Holmes, Carol Agius, Joep Crompvoets
“3rd International Workshop on Spatial Data Quality (SDQ 2020)”
joint workshop of EuroGeographics, EuroSDR, OGC, ISO TC 211, ICA
Table of contents
1 INTRODUCTION ........................................................................................................................... 6
2 CONTRIBUTIONS ......................................................................................................................... 7
Evaluation of Height Models .............................................................................................................. 8
Motivation and the Need for the Revision of ISO 19157:2013 Geographic Information –
Data Quality ...................................................................................................................................... 20
Data Quality for Use: A Linked Data Approach ............................................................................... 22
Data Quality in an e-Government Perspective .................................................................................. 26
Building Register – Basis for 3D Cadastre........................................................................................ 37
Rebuilding the Cadastral Map of The Netherlands, overall Concept & Communication on
Geometric Quality ............................................................................................................................. 49
The Quality Control Column Set: An Alternative to the Confusion Matrix for Thematic
Accuracy Quality Controls ................................................................................................................ 51
Count Based Quality Control of “As Built” BIM Datasets using the ISO 19157 Framework .......... 56
Solutions for Encouraging Spatial Data Producers to Co-Operate in Harmonizing National
Topographic Data .............................................................................................................................. 61
Evaluating Quality of Spatial Data Coming from Multiple Suppliers Case Finnish National
Topographic Database ....................................................................................................................... 63
Understanding the Importance of Provenance from the Perspective of a
Geospatial Decision-Maker ............................................................................................................... 66
Collaborative User Oriented Metadata Production on EuroSDR Geometadatalabs Platform .......... 69
Authoritative Geospatial Data and its Quality................................................................................... 73

5
3rd
INTERNATIONAL WORKSHOP ON SPATIAL DATA QUALITY
(SDQ 2020)
joint workshop of
EuroGeographics, EuroSDR, Open Geospatial Consortium (OGC),
International Organisation for Standardisation Technical Committee 211 (ISO TC 211),
International Cartographic Association (ICA)
January 28th - 29th 2020 - Valletta, Malta
Workshop Report and Contributions
Jonathan Holmes a, Carol Agius
b, Joep Crompvoets
c
a Ordnance Survey Great Britain
Adanac Drive, Southampton
SO16 0AS, United Kingdom
b EuroGeographics
Rue du Nord 76 / Noordstraat 76
1000 Brussels, Belgium
c EuroSDR / KU Leuven Public Governance Institute
Parkstraat 45
3000 Leuven, Belgium

6
1 INTRODUCTION
Demands for spatial data are ever increasing, outstripping the capabilities of the methods by which
they have traditionally been provided. New capture methods, improved technology and an increasingly
diverse customer base are driving the geospatial industry forward at an alarming rate. Consumers of
data recognise the importance of location and expect geospatial information to be readily available,
accurate, trustworthy and free.
This fast-evolving landscape necessitates that data quality and quality management must evolve to
embrace the new technologies, methods of data capture and date use. To maintain their long-standing
role of providers of trusted official data, National Mapping and Cadastral Agencies (NMCAs) have to
keep up with these evolving needs and trends.
The international workshops on Spatial Data Quality are organised specifically to bring together
producers, users, academia and software suppliers into one event to provide innovative and original
contributions to the ongoing debate on spatial data quality. They are organised and hosted by two not-
for profit entities: EuroGeographics, the association for Europe’s National Mapping, Cadastral and
Land Registry Authorities, and EuroSDR, the network of European geographic information
organisations and research institutes.
Following previous successful workshops in 2015 and 2018, EuroGeographics and EuroSDR, in
conjunction with OGC, ISO and ICA, organised a third workshop on spatial data quality in Valletta,
Malta in January 2020. The workshop was sponsored by 1Spatial.
The topics presented at the workshop were many and varied, as demonstrated by the papers and
abstracts provided in this publication. The richness of the discussion and debate is illustrated by the
broad scope of the topics and subject matter of these papers. Quality issues are varied and must be
considered from different points of view. EuroGeographics and EuroSDR are proud of the range of
themes covered in this publication.
Highlights include examples of how national data providers are meeting the challenge of managing
quality from multiple suppliers and how new methods are enabling them to do so. Several papers
cover these areas. Users are interested in locating and using data and we have examples of how data
suppliers can communicate this information to end-users in new and informative ways. Authoritative
data and its provenance are discussions close to the hearts of both national geospatial data providers
and users as demonstrated in two papers presented here. Also included are case studies of good
practice in implementing quality at the heart of production, whilst other papers provide an overview of
data quality perspectives in e-Government. No discussion covering spatial data quality is complete
unless it touches on standards, the topic here being the motivation for revising ISO 19157:2013
Geographic Information – Data Quality.
These papers are provided as an illustration of the rich and broad conversation around quality which is
engaging data providers, researchers and users of geospatial data. We hope that their publication will
contribute to the ongoing debate around spatial data quality and how best to measure it.
Jonathan Holmes – SDQ 2020 Conference Chair
and
Carol Agius – SDQ 2020 Organising Committee

7
2 CONTRIBUTIONS
Topics presented during the workshop were:
1. Evaluation of Height Models
2. Motivation and the Need for the Revision of ISO 19157:2013
Geographic Information – Data Quality
3. Data Quality for Use: A Linked Data Approach
4. Data Quality in an e-Government Perspective
5. Building Register – Basis for 3D Cadastre
6. Rebuilding the Cadastral Map of The Netherlands, overall Concept & Communication
on Geometric Quality
7. The Quality Control Column Set: An Alternative to the Confusion Matrix for Thematic
Accuracy Quality Controls
8. Count Based Quality Control of “As Built” BIM Datasets using the ISO 19157 Framework
9. Solutions for Encouraging Spatial Data Producers to Co-Operate in Harmonizing
National Topographic Data
10. Evaluating Quality of Spatial Data Coming from Multiple Suppliers
Case Finnish National Topographic Database
11. Understanding the Importance of Provenance from the Perspective of a
Geospatial Decision-Maker
12. Collaborative User Oriented Metadata Production on EuroSDR Geometadatalabs Platform
13. Authoritative Geospatial Data and its Quality
14. Ohsome – OpenStreetMap data quality analysis
15. Thematic accuracy and completeness of topographic maps
16. Data Maturity – Geo data growing up
17. Creating Data Quality Models
18. The Malta experience
19. New common method for declaring data quality in Denmark
For the first 13 presentations a paper or an (extended) abstract is included in this report.
All 19 presentations are available for download at
http://www.eurosdr.net/workshops/3rd-international-workshop-spatial-data-quality.

8
Evaluation of Height Models
Karsten Jacobsen
Leibniz University Hannover, Institute of Photogrammetry and Geoinformation, Hannover, Germany
Abstract
Height models are a basic requirement for spatial data. For qualified use, it is necessary to have
information about the geometric data quality. Several investigations of height models exist, but only
very few are really qualified. It is not enough to determine just the accuracy for a terrain up to a
threshold of 10% or 20% slope and above it, also shifts of the height model in X, Y and Z are required
as well as more complex accuracy dependencies, higher degree systematic errors and the morphologic
quality. Standard commercial programs usually do not allow a detailed analysis.
Several height models, based on LiDAR, aerial images, satellite images and satellite based
Interferometric Synthetic Aperture Radar (InSAR) have been evaluated with specially developed
programs. Reference height models with the same or a better accuracy have been used. The required
detailed analysis and the achieved results for some typical height models are described.
Keywords: evaluation, DSM, DTM, accuracy functions, systematic errors
1. Introduction
The quality of height models cannot be described just by one or two accuracy numbers. At first,
different accuracy numbers are available, as Root Mean Square (RMS), standard deviation of the
height (SZ), Median Absolute Deviation (MAD) and Normalized Medium Absolute Deviation
(NMAD) and Linear Error with 90% (LE90) or 95% (LE95) probability; secondly, the accuracy
depends on the terrain inclination and other parameters; at third, systematic errors exist, as constant
height shifts and more complex systematic errors and at fourth, the relative accuracy – the accuracy of
a height value in relation to the neighbored one – may not be the same as the absolute accuracy. In
addition, also the horizontal accuracy of a height value has to be respected. In addition to the location
accuracy, horizontal shifts of the height models are common. A height model may be a Digital Surface
Model (DSM), describing the height of the visible surface or a Digital Terrain Model (DTM),
describing the bare ground. A Digital Elevation Model (DEM), as general term for a height model,
may be based on a raster of height data with optionally additional information as break lines or it may
be based on randomly distributed height values, handled as Triangulated Irregular Network (TIN). The
morphologic quality, describing the local variation of the terrain is important; it depends on the
relative accuracy and the point spacing.
Nearly worldwide covering height models are available free of charge or commercially; their
evaluations have been published. Especially the SRTM height model, based on InSAR, is used today
as standard for several applications; it was investigated in detail, e.g. (Rodriguez et al. 2003, 143
pages). Also the improvement of SRTM to 1 arcsec point spacing (~30m) was analyzed (Mukul et
al. 2016). The ASTER GDEM2 DSM, based on all stereo combinations of the optical satellite
ASTER, was investigated by (Tetsushi et al. 2011, Gesch et al. 2016). A strong improvement came
with the ALOS World 3D (AW3D), based on all usable optical stereo combinations of ALOS PRISM
having 2.5 m GSD (ALOS World DEM, http://alosworld3d.jp/en/). This was investigated by Tadono
et al. (2014) and Takaku et al. (2014). From the commercial version AW3D with 5 m point spacing
the free of charge version AW3D30 with 1 arcsec point spacing – approximately 30 m at the equator –

9
is available and was analyzed by Tadono et al. (2014) and Takaku et al. (2014). As for the other height
models a gap filling has been made with other height data. (Jacobsen 2016) gives an overview about
the preceding listed height models and (Aldosari, Jacobsen 2019) are including also the following
height models. The most homogenous and really worldwide height model is now available from the
TanDEM-X InSAR which is commercially distributed as WorldDEM; it has been investigated in
detail by the German Aerospace Center (DLR) (Rizolli et al. 2017, Wessel et al. 2018) and (Baade and
Schmullius 2016). A reduced version of this is freely available as TDM90 with 3 arcsec point spacing
(~ 90m).
DEM generation from aerial imagery is a standard process, described very often, so a naming of all
references is not possible. As in all other areas of DEM generation the pixel wise Semi Global
Matching (SGM) (Hirschmüller 2005 is used more often (Haala 2014) ), especially in built up areas.
An overview about the ISPRS/EuroSDR benchmark test about the use of penta-cameras for 3D-
evaluation is given in Gerke et al. 2016. The use of penta-cameras is growing. The complex matching
of images with quite different view directions usually is based on Scale Invariant Feature Transform
(SIFT) (Lowe, 2004). Penta-cameras often do not have very stable camera geometry, requiring an
image orientation with self calibration for a satisfying ground coordinate determination (Jacobsen and
Gerke 2016).
Similar it is with the Unmanned Aerial Vehicles (UAV), they also require a proper camera calibration
and the matching usually is based on SIFT (Bakula et al. 2018). With UAV only small areas can be
mapped opposite to the other methods. Commercial programs should be used for the orientation,
allowing a block adjustment with self calibration and ground control points.
The height model determination by airborne LiDAR is a standard procedure based on calibrated
systems with post-processing by commercial programs to compensate orientation uncertainties by
overlapping flight lines and ground control points (Davidson et al. 2019).
InSAR from space allows the generation of height models for large area up to global coverage. The
Shuttle Radar Topography Mission (SRTM) in 2000 was the first attempt to reach height accuracy,
better as available for several national survey administrations by the classical methods. Now with the
TanDEM-X Mission, available as commercial WorldDEM or with reduced spacing freely as TDM90,
the accuracy and morphologic quality has been strongly improved (Rizolli et al. 2017, Wessel et al.
2018).
A number of benchmarks about DEM generation with the different methods exist (Bakula, Mills,
Remondino, 2019).
2. Horizontal Accuracy and Improvement
Before the analysis of the vertical accuracy, the horizontal location of the height model has to be
checked.

10
Figure 1: Horizontal shift between LiDAR height models
Figure 2: Horizontal shift between a DSM based on Kompsat-2 and the Turkish DTM
Horizontal shifts between height models are typical. In figure 1 a horizontal shift between two aerial
LiDAR DTMs is shown. The horizontal shift of 4m up to 5m can be seen in inclined areas. The shift
corresponds to DX=DZ / tan ax respectively DY=DZ / tan ay, with ax=slope in X-direction and
ay=slope in Y-direction. Figure 2 shows a height profile of a DSM generated by images of the optical
satellite Kompsat-2 (1m GSD) and the national Turkish DTM. On right hand side the height profile is
not influenced by vegetation, while on left hand side the area is covered by forest. Nevertheless the
Hannover program DEMSHIFT determined the horizontal shift correctly in X with 48m and in Y with
195m. Such large shifts are caused by datum problems of the Turkish reference. The DEM shift
reduces the RMSZ from 27.09m to 10.35m. Also a tilt of the height models can be detected by this
investigation.
3. Accuracy figures
Different accuracy figures are in use. The RMSZ is influenced by the bias (constant shift in Z), which
is split of for the standard deviation. The Median Absolute Deviation (MAD) is the median of the
height differences and corresponding to this it has 50% probability. For comparison with the standard
deviation MAD is multiplied with the relation of the normal distribution for 68% to 50% probability
the factor 1.4828, resulting to NMAD (Höhle and Höhle 2009). Under the condition of normal
distributed height differences NMAD is identical to SZ. SZ is based on the square mean of the
differences, while NMAD is a linear value. Very often the height discrepancies of a DEM against a

11
reference DEM are not normal distributed and larger discrepancies are more frequent as corresponding
to the normal distribution (figure 3, left, frequency distribution > |14m|). This is enlarging SZ more as
NMAD.
Abbreviation Accuracy figures
RMSZ Root mean square height differences
SZ Standard deviation of height differences (based on discrepancies minus bias), 68% probability
MAD Median absolute deviation for height (median value of absolute differences), 50% probability
NMAD Normalized median absolute deviation for height (MAD ˟ 1.4826), 68% probability
LE90 Threshold including 90% of absolute values of discrepancies (90% median), 90% probability
LE95 Threshold including 95% of absolute values of discrepancies (95% median), 95% probability
Table 1: Accuracy figures
Figure 3: Overlay of frequency distribution and normal distribution based on SZ and
NMAD Cartosat-1 DSM – national DTM, east of Warsaw
Whole area not filtered Open area filtered Not filtered / filtered
RMSZ 3.77m 2.56m 1.47
bias 0.61m 0.50m
SZ 3.72m 2.51m 1.48
MAD 1.75m 1.53m 1.14
NMAD 2.59m 2.27m 1.14
LE90 5.43m 4.09m 1.33
LE95 7.65m 5.21m 1.47
Table 2: Accuracy numbers corresponding to figure 3

12
In figure 3 and table 2 the analysis of a Cartosat-1 (2.5m GSD) DEM with a precise reference DTM
based on the Hannover program DEMANAL is shown. On left hand side of figure 3 the not filtered
DSM with influence of small forest parts and buildings can be seen, while on right hand side the
Cartosat-1 DSM was filtered to a DTM. The influence of the small forest parts and buildings is
obvious at the higher number of large discrepancies (left side of figure 3, blue line). Corresponding to
this, NMAD with 2.59m is clearly below SZ with 3.72m. The filtered data (right hand side of figure 3)
are closer to a normal distribution. Nevertheless also here NMAD with 2.27m is still smaller as SZ
with 2.51m. In both cases the normal distribution based on NMAD (green line) is closer to the
frequency distribution (blue line) as the normal distribution based on SZ. This is a typical result – in
most cases the normal distribution based on NMAD is closer to the frequency distribution as the
normal distribution based on SZ. This justifies the use of NMAD instead of SZ as accuracy criteria.
Safe information of NMAD requires a satisfying high number of discrepancies, if only a limited
number of discrepancies are available, SZ should be preferred.
Often also LE90 or even LE95 (90%, respectively 95% probability) are used. They are just based on
the threshold of the largest 10%, respectively 5%, of the differences. Of course if a higher security for
the height values is required, there is a reason for these threshold numbers, but they are presenting
only 10%, respectively 5%, of the differences and not the large number of discrepancies, so LE90 or
LE95 should not be used as the only accuracy criteria.
4. Filtering from DSM to DTM
By automatic image matching DSMs with the height of the visible surface are generated. Often a
DTM with the height of the bare ground is required. In addition it is not correct to compare a DSM
with a DTM, this would be dominated by the height of vegetation and buildings. Also the comparison
of a DSM with a reference DSM is not as simple due to the fact that a DSM is changing faster as a
DTM. In case of InSAR based on C- or X-band the canopy height is slightly below the height based on
optical stereo pairs. Long wave length radar, as the L-band, is penetrating the vegetation, but there are
only few L-band SAR-data available – it has also the disadvantage of a lower ground resolution.
Manual elimination of the height point groups not belonging to bare ground may be very time
consuming, requiring programs for automatic filtering. Nevertheless by automatic filtering not all
elements belonging to vegetation and manmade constructions can be removed. The elimination of
buildings is not a problem if the GSD is not too small, but if in a forest no points are on the bare
ground, the height of the bare ground cannot be estimated correctly. It has to be respected that the
canopy height is equalizing the ground height and at the forest borders the trees are not as large as in
the center, limiting the possibility to get the ground height just by subtracting an average tree height
from the canopy height. Despite these limitations, in operational use by a large photogrammetric
company the required time for the generation of a DTM based on a DSM could be reduced by 90%
with the Hannover program RASCOR (Pasini, Betzner, Jacobsen 2002). This includes the manual
measurements of break lines in few cases.
5. Analysis of height models
5.1 Dependency on terrain inclination
Under usual conditions the accuracy of the height models depends on the terrain inclination
corresponding to formula (1).
SZ = A + B * tan (slope) NMAD = A’ + B’ * tan (slope) (1)

13
Figure 4: SZ and NMAD depending on slope groups Cartosat-1 DSM against AW3D30
Figure 4 shows the clear linear functions of SZ and NMAD on the tangent of the terrain slope for the
comparison of a Cartosat-1 (2.5m GSD) DSM and AW3D30 in an area without forest and buildings
(open area). The small uncertainties at higher slope are caused by the smaller number of compared
points. In total 383 000 points have been compared. In the flat area approximately ~35000 points and
in the steepest part ~ 700 points are in the slope groups. The adjusted function on the terrain slope is
for SZ = 2.70m+1.48m*tan(slope) and for NMAD = 2.25m + 1.49*tan(slope). The linear dependency
of the accuracy from the tangent of terrain slope is typical for all height models.
Due to this reason the accuracy of a height model should not be determined against ground control
points (GCPs). Usually the terrain around GCPs is flat and open, leading to too optimistic results for
steeper terrain.
Figure 5: Frequency distribution of height values Figure 6: Frequency distribution of
Percentage for height group + accumulated terrain slope
Cartosat-1 DSM against AW3D30 DSM, Nairobi
Aspects include the information about height accuracy as function of the slope direction (figure 7).
Due to radar layover InSAR has a lower accuracy in inclined parts perpendicular to the satellite orbit.
This causes larger standard deviations in the north-west and south-east direction. Especially the factor
B in formula (1) – the accuracy dependency on the slope – is quite larger in this direction. For the
average SZ the dependency on the slope direction is not as large, but it is still visible, it is ~ 10%
larger as the overall accuracy, while it is in the north- east and south-west direction ~ 10% below the
overall accuracy. In this case the data acquisition was made from descending satellite orbit (from
north-north-east to south-south- west).

14
Figure 7: Aspects – SRTM against LiDAR reference
Not in any case the dependency on the aspects is so clear, but especially InSAR shows this effect in
mountainous areas, while a height model based on digital images does not show this.
5.2 Point spacing and terrain roughness
The statistic about the height values (figure 5) and the frequency distribution of the terrain slope
(figure 6) are supporting the analysis.
The loss of accuracy by interpolation is shown for some examples, based on SRTM in table 3.
Zonguldak is a rough mountainous area, partially covered by not dense forest, Arizona is smoothly
mountainous, without vegetation, and New Jersey is flat, partly with buildings and few trees. The
roughness of the areas can be identified at the average change of the terrain inclination from one point
spacing to the next (cα) (table 3, figure 8). The influence of the interpolation was determined by
interpolation between the left and the right neighbored points and compared with the height of the
center points. As a rule of thumb, the loss of accuracy by interpolation usually is reduced by the
factor 4 if the point spacing is reduced by factor 2; in other words, it depends usually approximately
on the square of the point spacing.
Table 3: Loss of accuracy by interpolation Figure 8: Height value interpolation
With α = terrain inclination, cα = change of inclination, dZi = Z-discrepancy caused by interpolation
5.3 Frequency distribution
Figure 9 shows the frequency distribution for all height discrepancies (SZ=11.1m, NMAD=7.3m),
while figure 10 shows the frequency distribution of the same data set, but only for the height points
with slope < 10% (SZ=7.7m, NMAD=5.0m). The characteristics are not so different, with the
exception that the overlaid normal distribution based on SZ and on NMAD are closer to the frequency
From center to outside Standard deviation of height:
Green line: for slope = 0.0
Red line: for average inclination
Dark blue line: mean value
Dark blue circle: SZ
Light blue-green line: factor for
multiplication with tangent (slope),
B in formula (1)
above = north direction
Mountainous area at Black Sea coast north- west of Istanbul

15
distribution. In both cases NMAD is clearly smaller as SZ and the normal distribution based on
NMAD is closer to the frequency distribution. In the partly rough area larger discrepancies may be
caused by the interpolation of TDM90 (~90m point spacing), while the DSM based on SPOT-6
(1.5m GSD) has just 4.5m point spacing.
Figure 9: Frequency distribution all data Figure 10: Frequency distribution for slope<0.1
SPOT-6 DSM against TDM90 – Bolivia, Sajama – mountainous, no vegetation
The frequency distribution and the overlaid normal distributions are indicating if a group of height
differences are not belonging to the same population, as it is the case if a DSM with points on top of
trees and buildings is compared with a DTM, including points only on bare ground. A tendency can be
seen in figure 9 where the frequency distribution has more points on the left hand side as on the right
hand side.
5.4 Color coded presentation and systematic errors
A visual interpretation of the height discrepancies is important. The comparison of a WorldDEM DSM
(12m point spacing) with a LiDAR DSM (SZ=3.45m, NMAD=2.96m), shown by color coded height
differences in figure 11, clearly indicates larger differences in the northern part. This is caused by
forest, which has been eliminated by a forest layer (figure 11, right). The LiDAR DSM describes the
canopy height different to InSAR based on X-band. In the open area without forest the differences are
clearly smaller (SZ=2.50m NMAD=2.00m, NMAD= 1.55m + 5.76m * tan(slope)). The strong
dependency of the accuracy from the slope is typical for InSAR height models, for DEMs based on
optical images it is smaller.
The color coded height differences may highlight also systematic DEM-errors as tilts or more complex
deformations. As shown in figure 12, the height differences of LiDAR DSM against WorldDEM DSM
have some systematic errors. In this case the influence is not too high, but also not negligible. Such
systematic errors may be caused by image orientations or not optimal system calibrations. The
determined systematic effects in relation to the reference DEM can be removed by adjusted linear
functions (figure 12) of X, Y or Z, or even with the smoothened functions as shown in figure 12. The
degree of smoothening can be chosen. X and Y may be correlated with the corrections in Z, requiring
an iterative improvement.

16
Figure 11: LiDAR DSM – WorldDEM, all points LiDAR – WorldDEM without forest area
Dücze, Turkey, 25 km x 21 km
Figure 12: Systematic height errors as funktion of Z (upper left), X (upper right) and Y (lower left)
together with linear functions of DZ depending on Z, X, respectively Y
LiDAR DSM – WorldDEM, all points, Dücze, Turkey
Height models may have a good relative accuracy, but a limited absolute accuracy due to systematic
problems of the images, as it is the case for CORONA height models where the GSD of 2m allows a
high morphologic quality, but systematic image errors influence the absolute height values. With a
comparison of the high absolute accuracy of TDM90, having limited morphologic details due to the
point spacing of 90m, with a CORONA height model the systematic height errors can be determined
and corrected without loss of the morphologic details of the CORONA height model.

17
5.5 Relative accuracy and morphologic quality
Closely neighbored points are correlated, causing the relative standard deviation of Z (RSZ) to be
better as the absolute accuracy (figure 13), (2). For larger distances between height points the
correlation is smaller, causing that RSZ will reach SZ. This fact influences the morphologic quality
which is based on the relative accuracy.
Figure 13: Relative SZ as function of the point distance [m] – SPOT-6 DSM against TDM90
+ = SZ * = relative SZ; distance of point groups = 80m (to be multiplied with line index)
(2) Relative standard deviation (RSZ)
with nv = number of point combinations in the distance group
and DZi, DZj = closely neighbored height points
With the analyzed DEM contour lines can be generated. They are optimal for morphologic analysis.
Of course with a point spacing of 5m and the high accuracy of LiDAR the corresponding contour lines
(figure 14 left) are more detailed as for data sets with 27m point spacing (figure 14, 2nd
and 3rd
from
left). AW3D30 has with 1 arcsec the same spacing as SRTM, nevertheless there are more morphologic
details in AW3D30 and it is closer to the LiDAR contour lines. Even with 90m spacing TDM90 is
close to the details of SRTM (figure 14, right).
Figure 14: Contour lines with 50m equidistance, 6km x 5km, with different point spacing
LiDAR 5m AW3D30 ~27m SRTM ~27m TDM90 ~90m
Gross errors in a height model cannot be avoided. They may influence the accuracy numbers strongly.
Due to this a threshold for the respected height differences has been used. The threshold has to be
realistic to avoid a manipulation of the results – at least it should be 5 times SZ or better even 10 times
SZ.

18
DEM-generation from aerial images is a standard procedure supported by GCPs and GNSS-
coordinates of the projection centers avoiding orientation problems. Large format digital cameras
today have only limited systematic image errors; this was not always the case (Spreckels, Schlienkamp
& Jacobsen, 2007) are reporting about not negligible model deformations caused by systematic image
errors. Special additional parameters were required for the UltraCam-D. This problem still exists today
for mid-format cameras which have to be handled with self-calibration by additional parameters.
Stepwise scanning cameras are not resulting in the required geometric quality of height models.
6. Conclusion
As mentioned in the introduction, the accuracy and quality of a height model is more complex as just
to be described by one or two accuracy numbers. The analysis of a DEM has to be done by
comparison with another DEM. The use of a limited number of ground control points instead of a
reference DEM should be avoided. Ground control points are located on flat ground and do not present
the DEM properly by avoiding rough and inclined area, so the analysis results would be too optimistic.
The evaluation has to be made in the same coordinate and datum system. Shifts between the reference
and the compared DEM have to be determined and respected - in few cases also tilts are available.
The correct accuracy number has to be used – the Hannover program DEMANAL computes all above
listed accuracy numbers and quality criteria. The threshold values CE90 or CE95 do present only the
accuracy of the 10%, respectively 5% largest differences; nevertheless they can be used as quality
criteria.
The evaluation cannot be based on the comparison of a DSM with a DTM – such results would be
dominated by the height of the vegetation and the buildings. If a DTM is required from an original
DSM, it has to be filtered and closed forest areas have to be excluded from the analysis, optimally
made by a layer indicating the forest area. The comparison of a DSM from optical images or InSAR
with a LiDAR DSM has limitations in forest areas due to different definition of the canopy height.
The evaluation should include the dependency of the accuracy from the terrain slope. Especially for
InSAR-data in mountainous areas aspects have to be computed. An analysis of the frequency
distribution of the height differences and a rough estimation of the influence of point interpolation
should be included as well as the determination of the relative accuracy. The latter influences also the
morphologic quality what can be checked with the generation of contour lines. In general a color
coded presentation of the height differences is required; it shows areas with problems and may
indicate systematic DEM errors. Systematic errors as Function of X, Y and Z have to be analyzed and
may be respected by iteration.
References
Aldosari, A., Jacobsen, K., 2019: Quality of Height Models Covering Large Areas, PFG Volume 87,
Issue 4, pp 177–190, https://link.springer.com/article/10.1007/s41064-019-00072-00072-11
Baade, J., Schmullius, C., 2016. TanDEM-X IDEM precision and accuracy assessment based on a
large assembly of differential GNSS measurements in Kruger National Park, South Africa, ISPRS
JPRS, Vol. 119, pp 496-508
Bakuła, K. , Ostrowski,W. , Pilarska, M., Szender,M. , Kurczyński,Z., 2018. Evaluation and
Calibration of Fixed-Wing UAV Mobile Mapping System Equipped with LiDAR and Optical Sensors,
IAPRS XLII-1, 2018
Bakuła, K., Mills, J.P., Remondino, F., 2019. A Review of Benchmarking in Photogrammetry and
Remote Sensing, IAPRS, XLII-1/W2, 2019

19
Davidson, L., Mills, J.P., I. Hayne, I., Augarde, C., Bryan, P., Douglas, M., 2019. Airborne to UAS
LiDAR; an Analysis of UAS LiDAR Ground control Targets, IAPRS XLII-2/W13, 2019
Gesch, D.B., Zhang, M.J., Meyer, D., Danielson, J.H., 2016: Validation of the ASTER Global Digital
Elevation Model Version 2 over the conterminous United States, IAPRS, XXXIX-B4, 281-286,2016
Gerke, M., Nex, F., Remondino, F., Jacobsen, K., Kremer, J., Karel, W., 2016: Orientation of Oblique
Airborne Image Sets - Experiences from the ISPRS Benchmark on Multi-Platform Photogrammetry,
IAPRS XLI-B1, 2016
Haala, N., 2014. Dense Image Matching Final Report. EuroSDR Publication Series, Official
Publication No. 64, 115-145.
HIRSCHMÜLLER, H., 2005. Accurate and Efficient Stereo Processing by Semi-Global Matching and
Mutual Information. IEEE CVPR, San Diego, USA, June 2005.
Höhle, J., M. Höhle. 2009. Accuracy assessment of digital elevation models by means of robust
statistical methods, ISPRS JPRS, 64, pp. 398-406
Jacobsen, K., 2016. Analysis and correction of systematic height model errors, ISPRS IAPRS XLI-B1,
333-339
Jacobsen, K., Gerke, M., 2016. Sub-camera calibration of a penta-camera, EuroCOW 2016, IAPRS
XL-3-W4
Lowe, S., 2004. Distinctive Image Features from Scale Invariant Key points. International Journal of
Computer Vision pp. 91-110
Mukul, M., Srivastava V., Mukul, M., 2016. Accuracy analysis of the 2014–2015 Global Shuttle
Radar Topography Mission (SRTM) 1 arc-sec C-Band height model using International Global
Navigation Satellite System Service (IGS) Network, Journal of Earth System Science, Vol. 125, pp
909-917
Rodríguez, E., Morris,C.S., Belz, J.E., Chapin, E.C., Martin, J.M.,Daffer, W., Hensley, S. 2003. An
Assessment of the SRTM Topographic Products, https://www2.jpl.nasa.gov/srtm/SRTM_D31639.pdf
143 pages (September 2019)
Passini, R., Betzner, D., Jacobsen, K. (2002). Filtering of Digital Elevation Models, ASPRS annual
convention, Washington 2002
Spreckels, V., Schlienkamp, A., Jacobsen, K., 2007: - Model Deformation – Accuracy of Digital
Frame Cameras, IAPRS XXXVI-1/W51
Tadono, T., H. Ishida, F. Oda, S. Naito, K. Minakawa, H. Iwamoto. 2014. Precise Global DEM
Generation by ALOS PRISM, ISPRS Annals of the Photogrammetry, Remote Sensing and Spatial
Information Sciences, Volume II-4, 2014
Takaku, J., T. Tadono, K. Tsutsui. 2014. Generation of High Resolution Global DSM from ALOS
PRISM, IAPRS XL-4, 2014
Tetsushi, T., Manabu, K., Akira, I., Gesch, D., Oimoen, M., Zhang, Z., Danielson, J., Krieger, T.,
Curtis, B., Haase, J., Abrams, M., Crippen, R., Carabajal, C., 2011. ASTER Global Digital Elevation
Model Version 2 – Summary of Validation Results,
https://lpdaacaster.cr.usgs.gov/GDEM/Summary_GDEM2_validation_report_final.pdf (Sept. 2019)

20
Motivation and the Need for the Revision of ISO 19157:2013
Geographic Information – Data Quality
Ivana Ivánová 1, 4
, Torsten Svärd 2, 4
and Mats Åhlin 3
1 Spatial Sciences, School of Earth and Planetary Science, Curtin University, Kent St, Bentley, Australia
2 Landmäteriet – The Swedish mapping, cadastral and land registration authority, Lantmäterigatan 2C,
Gävle, Sweden, [email protected]
3 Swedish Institute for Standards, Solnavägen 1 E/Torsplan, Stockholm, Sweden [email protected]
4 ISO/NP 19157-1 Project lead, ISO/TC211 Geographic information/Geomatics,
Secretariat: Landmäteriet, Sweden
ISO 19157:2013 Geographic information – Data quality (ISO 19157) is the standard published by the
International Organization for Standardization (ISO) and its Technical Committee 211 on Geographic
information/Geomatics (ISO/TC211). The purpose of this standard is to provide framework for
defining, measuring and reporting spatial data quality (ISO, 2013). For each standard ISO/TC executes
a systematic review at least every five years, and for ISO 19157 a ballot has been opened in the period
between October 2018 and March 2019. As a result, from all national standardization bodies or
liaisons eligible to vote, 19 confirmed the standard, 3 suggested to revise it, and 14 abstained from
voting on standard’s revision process. In most cases, such result would not lead to a revision of a
standard, but the reasons given in the three suggestions for revision convinced the ISO/TC211
committee to put the ISO 19157 up on the agenda for the project management group (PMG) during the
plenary meeting week in Maribor in May/June 2019. Based on PMG’s suggestion, the ISO/TC211 has
resolved to revise ISO 19157 and started a new ISO/NP 19157-1 Geographic information – Data
quality – Part 1: General requirements in July 2019.
One of the main reasons iterated through various comments supporting the call for revision, was the
need to update the definition and the use of standard’s terminology. Terms such as accuracy,
uncertainty and correctness seem to have confusing definition, and use throughout the standard, and
other terms, such as ‘trustworthiness’ or ‘trueness’ were suggested for consideration. Interestingly, a
comment has been made that the main term from ISO 19157’s title – data quality – has never been
defined in the standard, and suggestion has been made that it should be included. However, perhaps it
is now time to discuss whether the very term ‘data quality’ and related evaluation framework
sufficiently covers the need of the main spatial exchange currency: the ‘spatial resource’. Spatial
resources are spatial data and metadata (e.g. found through spatial data portals), spatial services (e.g.
used in cloud-based spatial applications), sensors for spatial observations and measurements (e.g.
deployed in sensor observation networks), or other spatial things published to the web in the form of
spatial vocabularies, spatial ontologies, linked spatial data.
Hence, one of the most important work during the revision will be the terminology harmonization. In
this respect, the project team will not only be reviewing information resources available within ISO,
such as ISO 8000-2:2018, ISO/IEC 98-3:2008 or ISO/IEC 25000 series (ISO, 2018; ISO/IEC, 2008;
ISO/IEC, 2019), but we will also reach for related standardization efforts among ISO’s direct liaisons
and outside ISO. Among the most prominent of these efforts are: the World Wide Web Consortium
(W3C)’s Data Quality Vocabulary (W3C, 2016) and Open Geospatial Consortium (OGC)’s Geospatial
User Feedback (OGC, 2016).
But the terminology is not the only aspect of the revision. We aim at reviewing ISO 19157’s ability to
support the best practices in publishing resources on the web (van den Brink et al., 2019) and

21
approaches to define and assess quality of these web resources (Debattista et al., 2016; 2017; Zaveri et
al. 2016). Moreover, we aim at critically revise the ‘usability’ of ISO 19157 both, the term ‘usability’,
which is currently defined too briefly and, at the same time, too widely (which impedes its
applicability), and also documented ‘usability’ of the standard itself , for instance as demonstrated by
OGC’s Testbed 13 experiments (OGC, 2018a; 2018b).
In this presentation we will summarize the main reasons for revision of the ISO 19157 and provide
participants with the outline and timetable for the revision. During the discussion we hope to elicit
participants view and opinion about current state of ISO 19157 and receive valuable suggestion to
include into the list for consideration during the initial phases of this standard’s revision.
References
van den Brink, L. Barnaghi, P., Tandy, J., Atemezing, G., Atkinson, R., Cochrane, B., …Troncy, R.
(2019) Best practices for publishing, retrieving and using spatial data on the web, Semantic Web
10(1), 95-114, http://www.semantic-web-journal.net/system/files/swj1785.pdf [25 September 2019]
Debattista, J., Auer, S. and Lange, Ch. 2016. Luzzu - A framework for linked data quality assessment,
Proceedings of the Tenth IEEE International conference on Semantic computing, ICSC 2016,
Laguana Hills, CA, USA, 2016
Debattista, J., Lange, Ch. and Auer, S. 2014. daQ, an Ontology for Dataset Quality Information,
Proceedings of the Workshop on Linked Data on the Web collocated with the 23rd International
World Wide Web Conference (WWW 2014), Seoul, Korea, 2014
International Organization for Standardization (ISO). 2013. ISO 19157 Geographic Information –
Data Quality, ISO: Geneva
ISO. 2018. ISO 8000-2: 2018 Data quality – Part 2: Vocabulary, ISO: Geneva
ISO/International Electrotechnical Commission (ISO/IEC). 2008 Guide 98-3:2008 Uncertainty of
measurement – Part 3: Guide to the expression of uncertainty in measurement (GUM: 19950, ISO:
Geneva
ISO/IEC. 2019. ISO/IEC 25020: 2019(en) Systems and Software Engineering – Systems and software
Quality Requirements and Evaluation (SQuaRE) – Quality measurement framework, ISO: Geneva
Open Geospatial Consortium (OGC). 2016. OGC® Geospatial User Feedback: Conceptual Model,
http://docs.opengeospatial.org/is/15-097r1/15-097r1.html [25 September 2019]
OGC. 2018a. OGC Testbed-13: Aviation Abstract Quality Model Engineering Report,
http://www.opengis.net/doc/PER/t13-FA001 [25 September 2019]
OGC. 2018b. OGC Testbed-13: Quality Assessment Service ER,
http://www.opengis.net/doc/PER/t13- FA003 [25 September 2019]
World Wide Web Consortium (W3C). 2016 Data on the Web Best Practices: Data Quality
Vocabulary, W3C Working Group Note, 15 December 2016, https://www.w3.org/TR/vocab-dqv/
[25 September 2019]
Zaveri, A., Rula, A., Maurino, A. Pietrobon, R., Lehman, J. and Auer, S.: Quality Assessment for
Linked Data: A Survey, Semantic Web Journal 7(1), 2016

22
Data Quality for Use: A Linked Data Approach
Erwin Folmer 1,2
and Wouter Beek 1,3
1 Kadaster, Apeldoorn, the Netherlands
2 University of Twente, Enschede, the Netherlands
3 Triply, Dordrecht, the Netherlands
Introduction
Quality has a long standing history, mainly from product engineering (such as automotive) and is a
broad concept. Literature and practitioners have a tendency to focus on intrinsic quality, which is more
or less demarcated and measurable. But in addition to intrinsic (product) quality, there are two other
notions of quality. Firstly, there is process quality, which deals with organizational aspects such as
maintenance processes. Secondly, there is quality in practice, i.e., quality as observed/experienced
within the use of a concrete application.
Organizations such as Kadaster, have a tendency to focus on intrinsic quality, but this focus can be
questioned. Juran, one of the quality guru’s, defined quality as “Fitness for use”. Following this
definition, one would expected a focus on quality in practice. Unfortunately this is less demarcated,
especially when compared to the focus on intrinsic quality. One explanation for the lack of focus on
quality in practice is that this notation makes quality situation-dependent. For example, when quality
in practice is applied to datasets, this means that a dataset can have a high quality in one usage
scenario, yet a low quality in another usage scenario.
In this paper we look into this more situational notion of quality in practice.
Quality related Problems for Datasets
Within the practice of being one of the main suppliers of open governmental data in the Netherlands,
Kadaster has identified the following two main quality-related problems for its datasets.
1. (Spatial) datasets cannot be found
One main quality issue is that open governmental datasets, while published under an open license,
cannot be easily found by developers and other potential users. As a result, open governmental
datasets are not currently used to their full potential. Let us take the Key Register Topography (in
Dutch abbreviated as BRT) as an example case: it is the authoritative dataset about topography in The
Netherlands, and contains many object types, such as schools, churches, castles, and many others. A
user who searches the Dutch National Geospatial Register (in Dutch abbreviated as NGR) for schools,
churches, or castles will not find the BRT, even though it is one of the most comprehensive dataset for
churches in The Netherlands. The reason for this is that the object types that are present in the BRT
dataset are not mentioned in the metadata description of the BRT. In general, concepts that occur
within geospatial datasets are currently not (automatically) part of the dataset metadata.
Because of the above described issues, a user will only find the BRT dataset if she searches for the
title of the dataset (e.g., “BRT”). This means that Kadaster datasets are typically found by people who
are already aware of their existence, but not by people who are searching for concepts that appear
within Kadaster datasets. What is more, one could argue that many potential users of Kadaster data
will not start their search at the National Geospatial Register for Datasets at all, but will be searching

23
from a generic search engine and/or will use a voice assistant for information about schools, churches,
castles, etc.
This situation is not unique for Kadaster. The idea that geospatial datasets should be exposed through,
and searched for on, a special geospatial platform is more or less the INSPIRE vision and approach.
It is our belief that a new user, unaware of the name of the dataset but with a specific and articulable
need for (geospatial) data, will start his search using a popular web browser or a personal voice
assistant. A more advanced user may use a dedicated, dataset-specific search engine like Google
Dataset Search or a national data portal (e.g., https://data.gov.uk or https://data.overheid.nl). Ideally,
when a user searches for churches in The Netherlands, he will find the BRT among the top results of
his search operation. From these search results, the user will dive directly into the NGR page that
specifically describes the BRT dataset. While we recognize that there are many different users with
different competencies and capabilities, we believe that what we describe above will be the ‘happy
flow’ that a large number of users that are not being served today will follow.
Unfortunately, the current situation is very far removed from what the ‘happy majority flow’ that we
describe above. Many of the open datasets published by Kadaster today are not found at all in popular
and generic search engines. Even in search engines that specifically focus on datasets, like Google
Dataset Search, authoritative Kadaster datasets like the BRT cannot be found. we find several outdated
copies of our data (by commercial organizations, or universities), but not the authoritative source.
From user perspective a big quality issue.
We here enumerate the three sub-problems that can be distinguished with respect to the findability of
spatial datasets:
Metadata descriptions for datasets often contain insufficient detail (e.g., the BRT cannot be found
when searching for churches in The Netherlands).
Governmental agencies focus on search from within dedicated portals, but users use
generic search engines.
Spatial datasets published in dedicated portals are often not findable through generic
search engines.
2. Fitness for Use is Unclear
When we apply the definition of fitness for use, we need to know the use case in order to make the
quality assessment to find out if the datasets is “fit” for this intended usage. However in the context of
our role as publisher of open geospatial data, we most of the time do not know the usage of open data.
What is more, the stated purpose of open data is that new users that are currently unknown to the data
publisher should be able to use data in different contexts and in originally unanticipated ways.
However, if a data supplier does not know how their (open) data is being used, then it logically
follows that they cannot define fitness for use (and therefore the practical quality) of a dataset either.
Indeed, when a data supplier assigns quality statements or labels to its datasets, its potential users may
misinterpret these static quality indicators as fitness for all use cases, but the latter may not be correct.

24
Solutions
We present three solutions for the issues identified in the previous section.
1. Attitude change
We need an attitude change (mind shift) from quality as a static concept that is determined by data
publishing organizations, to a dynamic concept that is ultimately determined by the data consumer.
Quality is always situational: for a certain user, within a certain use case, working from within a
certain context. While it may still be useful to formulate and implement generic data quality metrics,
such generic metrics can never capture dataset quality in its totality.
In practice we often notice that dataset owners hold on to a Boolean notion of dataset quality, resulting
in two unrealistic ‘all or nothing’ attitudes. One extreme attitude is that the dataset already has good
quality: the dataset is published in a governmental (geospatial) data portal and fulfills the currently
formulated quality requirements. The fact that the dataset is not often used in practice is sometimes
lamented, but is not recognized as a dataset quality problem. The other extreme attitude is that the
dataset does not yet have good quality. The fact that the dataset is not often used by others is by
design: the users must wait for a new version, a new data model, or a data cleaning initiative. Only
once those have been completed will the dataset be ready for use.
Our notion of practical dataset quality opposes both views. A dataset publisher may believe that their
dataset has good quality, but if a dataset is not often used then this is an indicator that the dataset may
not be fit for use. Similarly, a dataset publisher may believe that their dataset does not yet have good
quality, but a data consumer may disagree with this, and may already be satisfied with the dataset as it
currently is.
2. Quality Dashboards
We need transparency, and the first step is publishing quality dashboards, which many organizations –
including Kadaster – have been doing for quite some time. In the early days, custom dashboard
applications were developed within the organizations. Since this is a relatively expensive process, such
an approach is only feasible when the intrinsic notion data quality is used.
In recent years we have noticed an increasing need to change and redesign quality dashboard. This
reflects a change in the notion of quality that is embraced by the organization: one that is based on a
changing practical need. With this more fluid notion of quality for use, it becomes more economical to
use standard Business Intelligence (BI) tools like Tableau to create quality dashboards.
Another generic trend is that static reports (often in the form of PDF documents) are slowly being
replaced by interactive dashboards. In the near future this will be merged with quality dashboards, into
one integrated dashboard, containing a viewer, data model, quality, use case descriptions etc.
3. Transparency
In the absence of a static notion of intrinsic quality, it does not make sense to advertise dataset quality
in absolute terms. Instead, we want datasets to anticipate the fact that users will make use of the
dataset in different and potentially unanticipated ways.
In order to achieve the latter, a dataset must seek to transparently communicate its potential for use. A
dataset must communicate its potential for use in a multi-faceted and pluriform way, so that individual
users are able to determine for themselves whether the dataset is fit for their use.

25
In the context of Kadaster, Linked Data is used in order to express the multi-faceted potential for data
use. Linked Data offers a wide variety of off-the-shelf metadata vocabularies that can be utilized for
this purpose. Furthermore, the open-endedness of Linked Data allows new metadata aspects and new
vocabularies to be formulated, not replacing but augmenting existing initiatives.
Examples of Linked Data vocabularies that are used to express data quality aspects at Kadaster
include:
Dublin Core: allows generic dataset properties like creator and creation data to be specified.
DCAT: allows more detailed dataset properties to be specified, including the temporal range
covered by a dataset, the spatial range, the update frequency, and the accuracy of its measures.
PROV: allows a detailed specification of how the dataset was created, curated, and published;
including the specific sequence of data operations that was taken.
Schema.org: allows an increasingly large number of metadata properties to be communicated
in a format that is processed by a large number of search engines, web crawlers, and other
web- based tools.
OGP: similar to Schema.org, but mostly focused on metadata that can be used in social media
platforms.
BRT: in addition to the above existing vocabularies, Kadaster datasets introduce their own
Linked Data vocabulary. For example, the BRT vocabulary describes the types of objects it
contains, including schools, churches, and castles.
Since Linked Data is a web-native metadata paradigm, descriptions of data quality for use can be
published online, as part of regular web pages (using JSON-LD snippets). Furthermore, popular web
search engines like Google actively look for and index such metadata properties. This allows a wider
range of users to determine for themselves whether a dataset that Kadaster publishes on the web is fit
for their use.
Kadaster is currently experimenting with exposing its dataset metadata using the above Linked Data
vocabularies. Early results already show that the Linked Data approach allows Kadaster datasets to
become better findable on the generic web, i.e., outside of (spatial) data portals.
Conclusion
In this paper we propose a shift of focus in the quality domain. In addition to a different attitude and
more quality dashboards, we propose is to put more effort in publishing metadata that follows modern
web standards. This results in a higher level of transparency and fosters insight into data practical
quality for use. The result will be that in the future more people will be able to find datasets on the
web, and can make a quality assessment that is more tailored towards their specific use case.

26
Data Quality in an e-Government Perspective
Jim J. Yang 1, Anne Karete Hvidsten
1, Morten Borrebaek
2
1 Norwegian Digitalisation Agency, Oslo, Norway
2 Norwegian Mapping Authority, Hønefoss, Norway
Abstract
Data sharing and reuse is one of the key prerequisites for digitalization of public administration (e-
Government). In order to reuse data, one needs to know which data already exist, the meaning of the
data, whether it is open or restricted access to the data, and last but not least, the quality of the data. As
a first step towards more data sharing and reuse across the public administration and with the private
sector, we have established a national data catalog which gives an overview of the datasets that the
public administration collects and produces.
In this paper we will present our approaches to cope with the major challenges that we met when
establishing our national data catalog, regarding 1) making available standardized and machine-
readable data quality descriptions and 2) ensuring unified understanding of the data quality
descriptions across the public administration.
Introduction
Quality of data is becoming increasingly important, also accelerated by digitalization of public
administration (e-Government).
Norway’s National geospatial strategy towards 2025 ([1]) states that “Society needs good, up-to-date
data in private and public activities, within all the specialist areas and sectors. Data must be available
in ways that meet the needs. The data must have known coverage and a quality adapted to the needs of
the various actors, so that it can support their specific applications and be part of the relevant decision-
making processes.”
The Norwegian Government white paper Digital agenda for Norway ([2]) emphasizes a user-centric
and efficient public administration. Both Digital agenda for Norway and the follow-up Digitalization
strategy for public sector 2019-2025 ([3]) also emphasize the importance of sharing and reusing data
across the public administration and with the private sector. Using and reusing correct and updated
information is crucial for the provision of seamless public services across the public sector and for the
exercise of authority. Using correct information increases the quality of the public services and
strengthens the rule of law for citizens. Public services can be improved and automated through access
to quality-controlled information from all public authorities.
The quality of data may affect how suitable the data is for other uses than first intended.
Documentation of data quality is therefore useful in the process of evaluating whether a dataset is fit for
purpose, thereby increased ability for potential users to reuse the dataset. The Norwegian government
Guidance on sharing and reuse of public administration’s data ([4]) therefore requires that the quality
of the data should be documented and known challenges should be explicitly described.
As a first step towards more data sharing and reuse across the public administration and with the
private sector, we have established a National data catalog ([5]), which contains not only descriptions
of open data but also descriptions of data with restricted access. The national data catalog is actually a
portal of catalogs that are interlinked. It consists currently of a catalog of datasets, a catalog of
concepts, a catalog of APIs and a catalog of information models. It gives an overview of the datasets

27
that the public administration collects and produces (datasets), the meaning of the datasets (concepts),
the distribution of the datasets (APIs) and how the datasets/concepts are modeled (information models).
If needed, more catalogs may be included in the catalog portal in the future. In addition to the aspects
as the purpose of the datasets, the meaning of the data elements in the datasets, the legal basis for non-
disclosure or disclosure of the datasets, distributions of the datasets etc., the data catalog also contains
descriptions of the quality of the datasets.
In this paper we will present the challenges that we met in achieving standardized and machine-
readable data quality descriptions in our national data catalog, and our approaches and solutions to
cope with those challenges.
Standardized and machine-readable descriptions of data quality
When we started to develop our national data catalog in early 2016 regarding the inclusion of
descriptions of data quality into the data catalog, the first challenge that we met was the lack of
suitable standards. Our national data catalog is based on a distributed architecture. The national data
catalog should be able to automatically harvest data descriptions provided by various sectors and
agencies. One crucial aspect is thus standardized and machine-readable descriptions.
The national data catalog is in compliance with the national Standard for description of datasets and
data catalogs DCAT-AP-NO ([6]) which is based on DCAT-AP ([7]), a European application profile of
the W3C recommendation DCAT (Data Catalog Vocabulary) ([8]). Using the same standard, the
national data catalog automatically harvests from other sources, e.g. the national portal for metadata of
geospatial data ([10]) which is in compliance with the INSPIRE legislation ([9]) (as for member states
of the European Union).
However, except for a few data quality aspects, current versions of DCAT from W3C and DCAT-AP
from the European Commission, do not yet specify or recommend specifically how to describe quality
of data in a machine-readable way. As presented at the 2nd International Workshop on Spatial Data
Quality by Borrebaek and Buskerud ([11]), a national working group got the mandate to establish
suitable standards for machine-readable descriptions of data quality, based on the needs from the
Norwegian public administration. The working group delivered a Specification for description of
quality of datasets ([12]). The working group concluded to extend our Norwegian application profile
DCAT-AP-NO with relevant parts of DQV (Data Quality Vocabulary) ([13]) from W3C. DQV
provides a framework in which the quality of a dataset can be described, whether by the dataset
publisher or by a broader community of users.
Figure 1: Simplified data model for extending DCAT-AP-NO with DQV
for describing quality of datasets.

28
As shown in Figure 1, the working group suggested to start with the following types of quality
descriptions based on the needs that were identified:
Description of quantitative data quality: One or more quantitative data quality measurements
(dqv:QualityMeasurement) may be included in the description of a dataset (dcat:Dataset) using the
property dqv:hasQualityMeasurement. Furthermore, using dqv:isMeasurementOf, one may specify
which data quality metric (dqv:Metric) the data quality measurement is a measurement of, and using
dqv:inDimension one may specify which quality dimension (dqv:Dimension) the data quality metric is
within. E.g., “2%” as a measurement of the metric “rate of missing objects” in the quality dimension
“completeness”.
Description of data quality that conforms to given quality standards or specifications: Using the
property dct:conformsTo one may specify that the quality of a dataset conforms to one or more given
standards or specifications (dct:Standard). Similarly, using dqv:inDimension one may relate a
standard/specification to one or more quality dimensions (dqv:Dimension).
Description of data quality in plain text: Using dqv:hasQualityAnnotation one may include one or
more plain text descriptions of data quality in the description of a dataset, and relate the description to
a quality dimension (dqv:Dimension) using dqv:inDimension. E.g. “2% missing objects” as a plain
text description in the quality dimension “completeness”.
Plain text user feedback on data quality: This is considered as a special case of plain text description
mentioned above. The plain text description here is given by a user of the dataset, instead of the
publisher of the dataset in the previous case.
The working group also identified the need to divide a quality dimension into “subdimensions”, e.g. to
divide the quality dimension “completeness” into “over-coverage” (“commission”), “under-coverage”
(“omission”) etc. “Subdimension” is not explicitly defined as a class in DQV but is possible to
implement using DQV.
DQV is currently not yet a recommendation from W3C but a “Working Group Note”. DQV is
however the best specification that we found for machine-readable data quality descriptions covering
the requirements from different domains. Nevertheless, based on the needs from Norway and several
other European countries who are also using DQV, DQV is now indeed explicitly included in the
upcoming European application profile of DCAT for base registries BRegDCAT-AP1 ([14]).
Our national data catalog has already partially implemented DQV for describing quality of datasets.
Common definitions of data quality dimensions, quality subdimensions and quality metrics
The Data Quality Vocabulary (DQV) provides a generic framework, a vocabulary, for describing data
quality. “The goal of the Data Quality Vocabulary is not to define a normative list of dimensions and
metrics.” ([13])
The second challenge that we met concerning data quality descriptions, was thus how to ensure that
we have a unified understanding of the data quality descriptions in the data catalog, in order to achieve
and increase semantic interoperability across the public administration.
The Norwegian geospatial community has assigned quality information to spatial datasets for several
years, based upon ISO 19157 Data Quality ([15]) and ISO 19115-1 Metadata ([16]), the latter
according to the European directive of INSPIRE. In the early days before we had international
1 At the time of submitting this paper, BRegDCAT-AP is not yet finalized but a “stable draft”.

29
standards suitable for this purpose, we used a simple quality assignment in the form of measurement
method (horizontal and vertical), positional accuracy (horizontal and vertical) and a rough statement
on the visibility of the features from a photogrammetric point of view.
Other government agencies in Norway have been using standards such as ISO/IEC 25012:2008 Data
quality model ([17], [18]) and ISO/IEC 25024:2015 Measurement of data quality ([19]). Some
government agencies have similar quality elements specified in other specifications and regulations,
such as Eurostat’s RAMON ([20]), Regulation (EC) No 223/2009 ([21]) of the European Union.
In 2019, we had a working group with the mandate to establish a set of common definitions based on
ISO standards and other relevant standards and specifications, and to map the resulting definitions into
the framework of DQV. The focus was standardized quality metrics. Since quality metrics should be
related to quality dimensions, the working group had also the mandate to establish common definitions
of the relevant quality dimensions and subdimensions.
The working group used the following criteria to decide what to define:
1. The mandate for the working group was to define metrics (dqv:Metric), i.e., only quantitative
quality descriptions are included in the work.
2. Quality metrics that are only relevant for the data production phase are not included in the
work, because it is about the quality of the datasets that are made available for reuse. E.g.
metrics like “punctuality” are not included in the work.
3. Quality metrics that are already defined in existing standardized vocabularies are not
included in the work. Examples of metrics that are already defined elsewhere and thus not
included in the work are: “frequency at which dataset is published” (dcat:accrualPeriodicity)
and “spatial/geographical coverage” (dct:spatial).
4. Sector specific quality metrics are not included in the work. Later in the process we became
aware of that according to recommendations from ISA2, geospatial should not be considered
as sector specific, but generic.
5. Only inherent data quality metrics ([17], [18]) are included in the work. E.g. quality metrics
like “accessibility” are not included in the work.
As shown in Table 1, the working group established a set of common definitions of quality metrics
within the quality dimensions “completeness”, “currentness”, “consistency” and “accuracy”. The
definitions of the mentioned quality dimensions, quality subdimensions and quality metrics, with
examples, are listed in Appendix B of this paper. The definitions together with a guideline for how to
use them, have been through a broad national commenting process.
2 Interoperability solutions for public administrations, businesses and citizens, https://ec.europa.eu/isa2/home_en

30
Quality
dimension
Quality
subdimension
Quality metrics (with data type)
completeness under-
coverage
missing objects (boolean)
number of missing objects (integer)
rate of missing objects (percentage)
number of objects with missing value for a given property (integer)
rate of objects with missing value for a given property (percentage)
over-coverage excess objects (boolean)
number of excess objects (integer)
rate of excess objects (percentage)
imputation number of objects with imputed value for a given property (integer)
rate of objects with imputed value for a given property (percentage)
currentness delay overall time difference (xsd:duration)
consistency consistency
within the
dataset
rate of objects with inconsistent properties (percentage)
rate of objects with inconsistency between given properties
(percentage)
accuracy identifier
correctness
number of objects with incorrect identifiers (integer)
rate of objects with incorrect identifiers (percentage)
classification
correctness
number of incorrectly classified objects for a given property (integer)
rate of incorrectly classified objects for a given property
(percentage)
Table 1: Quality dimensions, quality subdimensions and quality metrics defined by the working group.
Summary and future work
One of the key prerequisites for digitalization of public administration (e-Government) is data sharing
and reuse. In order to reuse data, one needs to know which data already exist. Furthermore, quality of
data is one of the aspects that is important for potential users of a dataset, to evaluate whether the
dataset is reusable or not.
As a first step towards more data sharing and reuse, we have established a national data catalog which
contains standardized and machine-readable descriptions of datasets that are collected and produced by
the public administration. Among of the aspects that are described in our national data catalog is the
quality of datasets.

31
As illustrated and summarized in Figure 2:
In order to have standardized and machine-readable data quality descriptions in our national
data catalog, we have chosen to incorporate Data Quality Vocabulary (DQV) into our national
standard for description of datasets and data catalogs (DCAT-AP-NO).
In order to ensure unified understanding of the quality descriptions across the public
administration, we have chosen to establish common definitions of quality dimensions, quality
subdimensions and quality metrics.
Figure 2: Incorporating DQV into DCAT-AP-NO for describing the quality of datasets, referring to
common definitions of quality metrics, quality subdimensions and quality dimensions.
Future work
Our national standard DCAT-AP-NO will be revised (probably during spring 2020), with
DQV explicitly incorporated, and aligned with DCAT-AP which was recently revised.
The definitions from the working group will soon be published, with the preferred terms and
definitions in both Norwegian and English, also in machine-readable formats (e.g. RDF).
When and if needed, more definitions will be established and published bilingually and
machine- readably. Geospatial quality is among the domains that will be prioritized.
When and if needed, we will also establish a solution for making accessible and machine-
readable sector specific metric definitions.
References and links to online resources
[1] Everything happens somewhere - National geospatial strategy towards
2025,https://www.regjeringen.no/contentassets/6e470654c95d411e8b1925849ec49
18d/en-gb/pdfs/en_nasjonal_geodatastrategi.pdf
[2] Digital agenda for Norway in brief, https://www.regjeringen.no/en/dokumenter/digital-
agenda-for-norway-in-brief/id2499897/

32
[3] (title freely translated from Norwegian) One digital public sector: Digitalization strategy for
public sector 2019-2025, https://www.regjeringen.no/no/tema/statlig-forvaltning/ikt-
politikk/digitaliseringsstrategi-for-offentlig-sektor/id2612415/ (in Norwegian).
[4] (title freely translated from Norwegian) Guidance on sharing and reuse of public
administration’s data, https://www.regjeringen.no/no/dokumenter/retningslinjer-ved-
tilgjengeliggjoring-av-offentlige-data/id2536870/ (in Norwegian).
[5] The National Data Catalog, https://fellesdatakatalog.brreg.no/about
[6] (title freely translated from Norwegian) Standard for description of datasets and data
catalogs (DCAT-AP-NO), https://doc.difi.no/dcat-ap-no/ (in Norwegian).
[7] DCAT Application Profile for data portals in Europe (DCAT-AP),
https://joinup.ec.europa.eu/solution/dcat-application-profile-data-portals-
europe
[8] Data Catalog Vocabulary (DCAT), https://www.w3.org/TR/vocab-dcat-2/
[9] INSPIRE Legislation, https://inspire.ec.europa.eu/inspire-legislation/26
[10] Map Catalogue, the national portal for metadata of geospatial
data, https://www.geonorge.no/en/
[11] Morten Borrebaek and Magni Busterud, From quality on spatial data to data quality
vocabulary (DQV) for the Semantic Web – the Norwegian experience of aligning ISO
19157 Data Quality to DQV, https://eurogeographics.org/wp-content/uploads/2018/06/11-
ISO19157.pdf.
[12] (title freely translated from Norwegian) Specification for description of quality of
datasets, https://doc.difi.no/data/kvalitet-pa-datasett/ (in Norwegian).
[13] Data on the Web Best Practices: Data Quality Vocabulary (DQV),
https://www.w3.org/TR/vocab-dqv/
[14] Specification of Registry of Registries, https://joinup.ec.europa.eu/solution/abr-
specification-registry-registries/news/stable-draft-bregdcat-ap
[15] ISO 19157:2013 Geographic information — Data
quality, https://www.iso.org/standard/32575.html
[16] ISO 19115-1:2014 Geographic information — Metadata — Part 1:
Fundamentals, https://www.iso.org/standard/53798.html
[17] ISO/IEC 25012:2008 Software engineering — Software product Quality
Requirements and Evaluation (SQuaRE) — Data quality model,
https://www.iso.org/standard/35736.html
[18] ISO 25012, ISO 25000 Portal, https://iso25000.com/index.php/en/iso-25000-standards/iso-
25012
[19] ISO/IEC 25024:2015 Systems and software engineering — Systems and software
Quality Requirements and Evaluation (SQuaRE) — Measurement of data quality,
https://www.iso.org/standard/35749.html
[20] EuroStat RAMON - Reference And Management Of Nomenclatures,
https://ec.europa.eu/eurostat/ramon/index.cfm?TargetUrl=DSP_PUB_W
ELC
[21] Regulation (EC) No 223/2009 of the European Parliament and of the Council,
https://eur-lex.europa.eu/legal-content/EN/ALL/?uri=CELEX%3A32009R0223

33
[22] BLUE-ETS, BLUE-Enterprise and Trade Statistics,
http://www.pietdaas.nl/beta/pubs/pubs/BLUE-ETS_WP4_Del2.pdf
[23] (title freely translated from Norwegian) Standards for Geographic Information – Geodata
quality, https://kartverket.no/globalassets/standard/bransjestandarder-utover-
sosi/geodatakvalitet.pdf (in Norwegian).
Appendix A – Prefixes used in this paper
Table 1: Prefixes used in this paper.
Prefix Namespace Name of the vocabulary
dcat http://www.w3.org/ns/dcat# Data Catalog Vocabulary
dct http://purl.org/dc/terms/ (Dublin Core) DCMI Metadata Terms
dqv http://www.w3.org/ns/dqv# Data Quality Vocabulary
oa http://www.w3.org/ns/oa# Web Annotation Ontology
xsd http://www.w3.org/2001/XMLSchema# XML Schema
Appendix B – Quality metrics and the relevant quality subdimensions and quality dimensions
that are defined
Note: At the time of submission of this paper, the definitions listed in this appendix are not yet
publicly published. There might therefore be some minor changes in the final published version.
Table 2: Definitions of quality metrics and the relevant quality subdimensions and
quality dimensions.
Quality dimension Quality subdimension Quality metric (with data type)
completeness
the degree to which
subject data
associated with an
entity has values for
all expected attributes
and related entity
instances in a specific
context of use (ISO
25012, [18])
under-coverage
data absent from a
dataset (ISO
19157,[15])
Alternative term:
omission
missing objects (boolean)
whether objects are missing in the dataset (based on ISO
19157, [15])
Example: “false” (the dataset contains all buildings)

34
Quality dimension Quality subdimension Quality metric (with data type)
number of missing objects (integer)
number of objects that are not present in the dataset but
are expected to be (based on ISO 19157, [15])
Example: “2” (Two buildings are missing in the
dataset)
rate of missing objects (percentage)
number of missing objects in relation to the number of
objects that should be present in the dataset (based on ISO
19157, [15])
Example: “0.02%” (0.02% of buildings are missing in the
dataset)
number of objects with missing value for a given
property (integer)
number of objects in the dataset with missing value for a
given property (our own definition)
Example: “2” (Two buildings in the dataset do not
have value for the property “usable area”)
rate of objects with missing value for a given
property (percentage)
number of objects with missing value for a given
property in relation to the number of objects in the
dataset (our own definition)
Example: “0.02%” (0.02% of buildings in the dataset
do not have value for the property “usable area”)
over-coverage excess objects (boolean)
excess data present in a
dataset (ISO 19157,
[15])
Alternative term:
commission
whether there are objects incorrectly present in the dataset
(based on ISO 19157, [15])
Example: “true” (some buildings in the dataset are not
supposed to be there)
number of excess objects (integer)
number of objects in the dataset that should not have
been present (based on ISO 19157, [15])
Example: “3” (Three buildings in the dataset are not
supposed to be there)

35
Quality dimension Quality subdimension Quality metric (with data type)
rate of excess objects (percentage)
number of excess objects in the dataset in relation to the
number of objects that should have been present (based
on ISO 19157, [15])
Example: “0.03%” (0.03% of the buildings in the
dataset are not supposed to be there)
imputation
entering a value for a
specific data item
where the value is
missing or unusable
(EuroStat RAMON,
[20])
number of objects with imputed value for a given
property (integer)
number of objects in the dataset with imputed value for a
given property (our own definition)
Example: “4” (Four buildings in the dataset have
imputed value for the property “year of
construction”)
rate of objects with imputed value for a given
property (percentage)
number of objects with imputed value for a given
property in relation to the number of objects in the
dataset (our own definition)
Example: “0.04%” (0.04% of the buildings have
imputed value for the property “year of
construction”)
currentness delay overall time difference (xsd:duration)
the degree to which
data has attributes that
are of the right age in
a specific context of
use (ISO 25012, [18])
age of the dataset
described as the
difference between
two points in time
(our own definition)
length of time between data availability and the event
or phenomenon they describe (EuroStat RAMON,
[20])
Example: “24 days” (On average there will be 24 days
from a building is completed or demolished, to it is
included in or excluded from the dataset)
consistency
the degree to which
data has attributes that
are free from
contradiction and are
coherent with other
data in a specific
context of use. It can
be either or both
among data regarding
one entity and across
similar data for
comparable entities.
(ISO 25012, [18])
consistency within the
dataset
the degree to which
there is consistency
between the properties
in the dataset (our
own definition)
rate of objects with inconsistent properties
(percentage)
number of objects with inconsistent properties in relation
to the number of objects in the dataset (our own
definition)
Example: “0.03%” (0.03% of the buildings have
inconsistency between some properties)
rate of objects with inconsistency between given
properties (percentage)
number of objects with inconsistency between given
properties in relation to the number of objects in the
dataset (our own definition)
Example: “0.03%” (0.03% of the buildings in the
dataset have “usable area” larger than “gross area”)
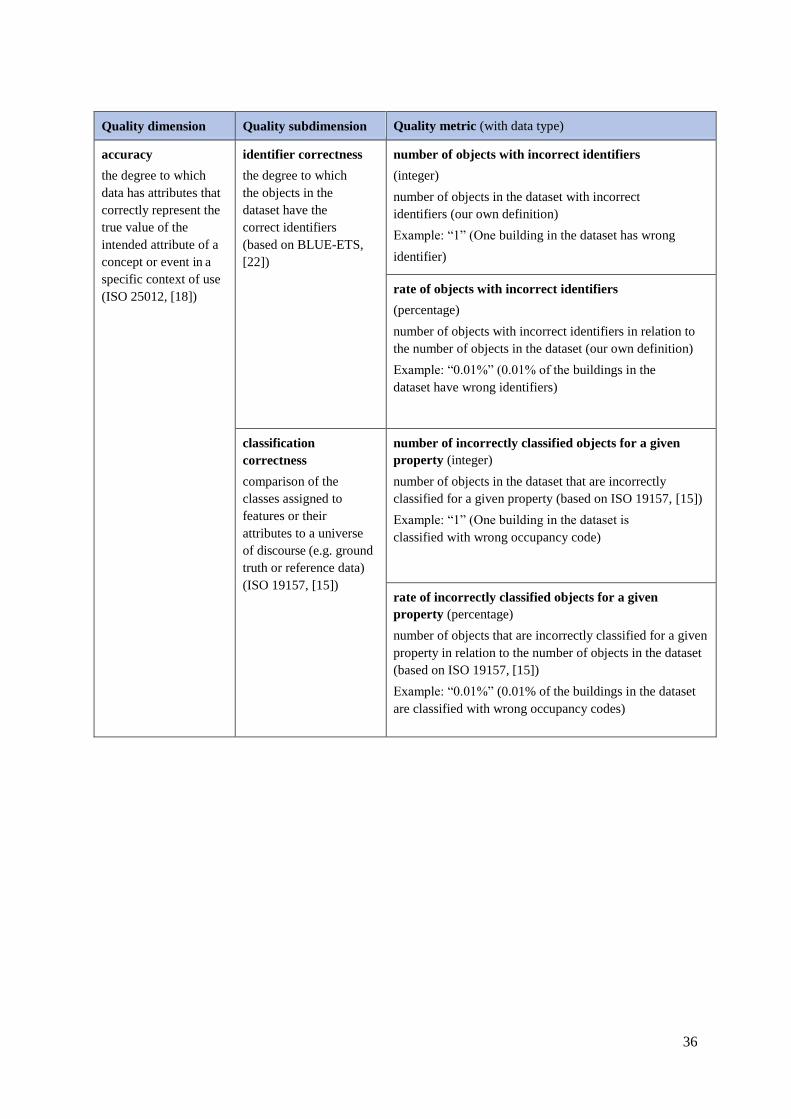
36
Quality dimension Quality subdimension Quality metric (with data type)
accuracy
the degree to which
data has attributes that
correctly represent the
true value of the
intended attribute of a
concept or event in a
specific context of use
(ISO 25012, [18])
identifier correctness
the degree to which
the objects in the
dataset have the
correct identifiers
(based on BLUE-ETS,
[22])
number of objects with incorrect identifiers
(integer)
number of objects in the dataset with incorrect
identifiers (our own definition)
Example: “1” (One building in the dataset has wrong
identifier)
rate of objects with incorrect identifiers
(percentage)
number of objects with incorrect identifiers in relation to
the number of objects in the dataset (our own definition)
Example: “0.01%” (0.01% of the buildings in the
dataset have wrong identifiers)
classification
correctness
comparison of the
classes assigned to
features or their
attributes to a universe
of discourse (e.g. ground
truth or reference data)
(ISO 19157, [15])
number of incorrectly classified objects for a given
property (integer)
number of objects in the dataset that are incorrectly
classified for a given property (based on ISO 19157, [15])
Example: “1” (One building in the dataset is
classified with wrong occupancy code)
rate of incorrectly classified objects for a given
property (percentage)
number of objects that are incorrectly classified for a given
property in relation to the number of objects in the dataset
(based on ISO 19157, [15])
Example: “0.01%” (0.01% of the buildings in the dataset
are classified with wrong occupancy codes)

37
Building Register – Basis for 3D Cadastre
Nikola VUČIĆ, Damir ŠANTEK
State Geodetic Administration, Zagreb, Croatia
Keywords: building register, 3D cadastre, land registry
SUMMARY
Cadastral systems need to be designed and supported from three-dimensional spatial perspectives.
To create the 3D cadastre, a building register is needed. Development of the building cadastre can be
based on the records of state surveys, spatial units registers, land registers, records of local and
regional self-government units, data from construction files according to special regulations in the
field of spatial planning, records kept by building managers, and other sources.
The most significant element of the 3D cadastre is comprised of buildings and separate parts of
buildings, followed by public utility infrastructure and complex spatial real-life situations (bridges,
tunnels, overpasses, underpasses, overlapping of constructed objects with natural facilities, large
shopping malls with more underground and overhead floors etc.).
This paper investigates important steps in establishing the building register. We propose how to
upgrade the building register into the 3D cadastre, based on examples from Croatian land
administration system. The most significant use cases in 3D cadastre are shown in this paper as well.
1. INTRODUCTION
In the last couple of decades, there has been an increasing demand for property development in urban
areas, resulting in the division of property ownership so that different owners can own delimited space
on, above or below ground surface. Under 3D cadastre, the 2D cadastre management of data cannot
meet the real land management of the three dimension space aspect and property. It is essential to
introduce the 3D cadastre (Choon and Seng, 2013).
The limited advances in full 3D cadastre implementations throughout the world might be explained by
the fact that the implementation of the 3D cadastre requires close collaboration between legal and
technical experts in an empirical environment to understand the impact of each other's domain (Stoter
et al. 2012).
In the Republic of Croatia (and other countries where cadastre was established a long time ago), many
registers and official databases on land and interests were created where certain overlaps between
some segments are evident. These were most often established independently and therefore contain a
lot of redundant data. However, their interaction can be used to gain new values and establish
Multipurpose Land Administration Systems (Vučić et al., 2017).
A 3D object in the 3D cadastre is defined as such a geometry that has vertical faces enclosing a 3D
space with roofs and floors. A 2D object (parcel in the current cadastral system) is a special case of a
3D object which has the coincident roof and floor, and collapses into a polygon. A 3D object termed
‘3D property’ refers to a spatial envelope containing the construction built with the land space, rather
than a space of land rights because the current laws and regulations cannot give a clear and explicit
statement about the spatial extent of the rights and it is impossible to describe the spatial extent of
those rights (Guo et al 2011).

38
Cities are increasingly adopting 3D city models. Providing further value and additional utility over 2D
geo-datasets, 3D city models are becoming ubiquitous for making decisions and for improving the
efficiency of governance. Local governments use 3D city models for urban planning and
environmental simulations such as estimating the shadows cast by buildings, investigating how noise
from traffic propagates through a neighbourhood, and predicting how much solar irradiation the roof
of a building receives in order to assess whether it is economically feasible to install a solar panel
(Biljecki 2017).
In the Republic of Croatia, the new State Survey and Real Property Cadastre Act stipulates the
establishment of a new register called the "Building Register”.
This paper is organized as follows. Section 1 is introduction. Section 2 analyses Croatian LADM
profile. Section 3 describes process of registering buildings in the Croatian land administration system.
Section 4 describes elements for establishing the Building register and quality control of 3D cadastre
data. Section 5 describes spatial data quality in 3D cadastre. The paper ends with conclusion.
2. CROATIAN LADM PROFILE
The first version of the Croatian LADM profile was developed in 2012. New classes, attributes, and
types were added in the code list. For the attributes added in classes HR_SpatialUnit:
HR_UsageTypeLand and HR_UsageTypeBuilding (Figure 1), the corresponding code list was created
according to the Regulation on Land Cadastre and according to the Regulation on the Content and
Form of Real Property Cadastre Documentation (Figure 2). The code list was also created for
HR_OwnerType, HR_MonumentMaterial, HR_BoundaryType attributes, in accordance with the
current State Survey and Real Property Cadastre Act.
Another important contribution to the development of the 3D Cadastre in the Republic of Croatia is
the introduction of the unique identifier of special parts of real property, proposed to be implemented
in the State Survey and Real Property Cadastre Act and the Land Registration Act (Vučić 2015).
The unique identifier of special parts of real property is a solution for all objects that are needed for
the development of 3D Cadastre (buildings of various purposes, underpasses, overpasses, tunnels,
bridges, viaducts, underground buildings, etc.).
The unique identifier could be used for denotation of separate parts of buildings, such as flat,
apartment, business space, where each separate part gets a unique identifier in the Croatian land
management system.
The unique identifier of a special part includes:
identification number of the cadastral municipality
number of land registry file
number of land registry sub-file

39
Figure 1. LADM profile for the Republic of Croatia

40
Figure 2. LADM profile for the Republic of Croatia – code lists

41
3. REGISTERING BUILDINGS IN THE CROATIAN LAND
ADMINISTRATION SYSTEM
Data about buildings are entered into land books based on information delivered to the land registry by
the cadastral office. Ownership of a particular part of real property (e.g. an apartment or office space)
is realized through registration in the land registry. Such separate parts may be registered if they
constitute independent units of use. Separate parts may include balconies, terraces, basements, and
attics, under the condition that they serve exclusively a single particular part and are clearly separated
from other parts of the real property. Land book registration of particular parts of real property is not
possible without a partition of real property. The same procedure is commonly used in the land
registry to formally consolidate land which was often publicly owned with buildings constructed on
that land. Partition of real property serves to establish ownership of particulars part of real property
(apartment, office space, garage, etc.) that become associated with the proportionally shared part of
real property (Vučić et al. 2013).
Fair relationship in financing the maintenance of buildings is furthermore made possible by
establishing ratios of each party’s ownership in the real property and, hence, each party’s proportional
share in the shared ownership of common parts.
The elaborate on condominium partition of real property establishes the size and shape of the common
and separate parts of a single real property (apartment, office space, etc.) and draws connections for
reference purposes against the real property as a unit. Additionally, data about particular parts must be
technically processed providing drawings of particular and common parts with the required labels and
areas of particular parts. A shared ownership contract must also be provided.
4. ELEMENTS FOR ESTABLISHING THE BUILDING REGISTER
The standard attempts to assign standardized classes to generally differentiate grades of 3D data. The
geometric detail and the semantic complexity increase with each level (Figure 3). This LOD
categorisation is well known in the 3D GIS community (Biljecki 2017).
Figure 3. The five LODs of the OGC CityGML 2.0. (Biljecki 2017)
The attributes of the objects are:
building (identification code of the building, identification code of the cadastral parcel,
address of the building, footprint of the building, 3D building model, parameters of positional
and height accuracy, real use of the building, land area under the building, altitude of the
building (minimum, terrain, maximum), height of the building, number of floors, number of
the ground floor, number of apartments/business premises in the building, building permit,
level of construction, condition of property, year of construction, year of facade renovation,
year of roof renovation, electricity, sewerage, water supply, gas, energy certificate, type of
investors, type of foundation, material of bearing structures)
floor (identification code, footprint of the floor, type of floor (underground/above ground),
number of the floor, altitude of the floor, height of the floor)

42
roof (footprint of the roof, ridge of the roof)
building unit (identification code, address, land registry file, owner, real use of the building
unit, area, method of determining area, building manager, number of rooms, bathroom, toilet,
kitchen, year of the renovation of installations, energy certificate)
part of the building unit (identification code, footprint of the part of the building unit, 3D
model, parameters of positional and height accuracy, real use of the part of the building unit,
area, energy certificate, type of heating)
rooms (real use, area)
4.1 Data about buildings
Buildings are registered in the cadastre on obligatory request of a party. A geodetic report prepared by
an authorized surveying company must be supplied with this request. The responsible cadastral office
must review and confirm the report. Surveying companies have at their disposal many surveying
methods, including the modern GNSS surveying method, while field surveying must be performed
with minimally the same accuracy as cadastral surveying or technical supervision used for preparing
the cadastral record for the cadastral municipality where the relevant building stands. Buildings are
registered in the cadastre with the following attributes: area, intended building use, building name, and
house number.
Additional information (attributes) needs to be recorded in the building register such as: footprint of
the building, 3D building model, altitude of the building, height of building. Table 1 proposes the
basic attributes necessary for efficient land administration.
Attribute Description Obligation Code list
identification code of the building:
code of cadastral municipality YES code list of cadastral
municipality
the number of the building
within the cadastral municipality
YES numerical value from
1 to n
identification code of the cadastral parcel YES defined in the Land
Cadastre
footprint of the building maximum outline of the building or
building point
YES polygon or point
3D building model building volume NO building volume
land area under the building land area under the building
recorded in the Land Cadastre or
obtained in some other way
(measurement, calculation from
the building footprint, ...)
NO numerical value from
1 to n
real use of the building code from the National
Classification of types
of construction
YES code list
address of the building address structured from the Spatial
Units Register
NO defined in the Spatial
Units Register

43
altitude of the building (minimum, terrain,
maximum)
altitude of the building:
- minimum (altitude of the
lowest point of the building)
- terrain (altitude of the terrain
adjacent to the building)
- maximum (altitude of the
highest point of the building)
NO numerical value
between -200 and
2500
height of the building height difference between the
lowest and highest point of the
building
NO numerical value
between 0 and 1000
number of floors YES numerical value from
1 to 100
number of the ground floor YES numerical value from
1 to 100
year of construction YES year between N and
today's date
building permit the data are already included in the
Joint Information System of Land
Registry and Cadastre (JIS)
NO alphanumeric value
Table 1. Data about building
The object Building is linked to the Land Cadastre (particle or a building that already exists in the
JIS), topography, address, building part, building unit, floor and roof.
Features of the building:
building is associated with one or more cadastral parcels,
building is associated with one or more buildings in the topography, each building has a
minimum of one floor,
each building has at least one building part,
each building has at least one building unit,
each building can have one or more addresses.
4.2 Collecting information on buildings
To complement those already registered in the cadastre and land registry, information can also be
collected by aerial imaging (stereo restitution) or LIDAR scanning.
With stereo restitution, the height of the surface near the building is collected, the highest point of the
building, the main ridge of the roof, and the height and layout of the outer edge of the roof. Based on
these data, a simple 3D model consisting of the building with a roof can be created and on the basis of
measured heights, the height of the building can be calculated.
Collecting the building layout data and its height is also automatically recorded by characteristic
contours of the building using LIDAR data. Use of the automatic classification of LIDAR data is the
easiest way to create point clouds of buildings. With software applications, characteristic contours of
the buildings can be created, which can be used for the establishment of the initial building register.

44
4.3 Proposed separate parts to be entered in the building register
Along with the attributes entered in cadastral records for over two centuries, new, additional attributes
need to be collected for establishing the cadastre of buildings, as detailed in Table 2.
Attribute Description Obligation Code list
identification code of the building:
code of cadastral municipality YES code list of cadastral
municipality
the number of the building
within the cadastral municipality YES numerical value from
1 to n
identification code of the cadastral parcel YES defined in the Land
Cadastre
footprint of the building maximum outline of the building or
building point
YES polygon or point in
RoC
3D building model building volume NO building volume in
RoC
land area under the building land area under the building
recorded in the Land Cadastre or
obtained in some other way
(measurement, calculation from
the building footprint, ...)
NO numerical value from
1 to n
real use of the building code from the National
Classification of types
of construction
YES code list
address of the building address structured from the Spatial
Units Register
NO defined in the Spatial
Units Register
altitude of the building (minimum, terrain,
maximum)
altitude of the building:
- minimum (altitude of the
lowest point of the building)
- terrain (altitude of the terrain
adjacent to the building)
- maximum (altitude of the
highest point of the building)
NO numerical value
between -200 and
2500
height of the building height difference between the
lowest and highest point of the
building
NO numerical value
between 0 and 1000
number of floors YES numerical value from
1 to 100
number of the ground floor YES numerical value from
1 to 100
year of construction YES year between N and
today's date
building permit the data are already included in the
JIS for object BUILDING:
NO alphanumeric value
year of the facade renovation NO year between N and
today's date
year of the roof renovation NO year between N and
today's date
electricity the existence of electrical networks YES code list
sewerage the existence of sewerage system YES code list
water supply the existence of water system YES code list
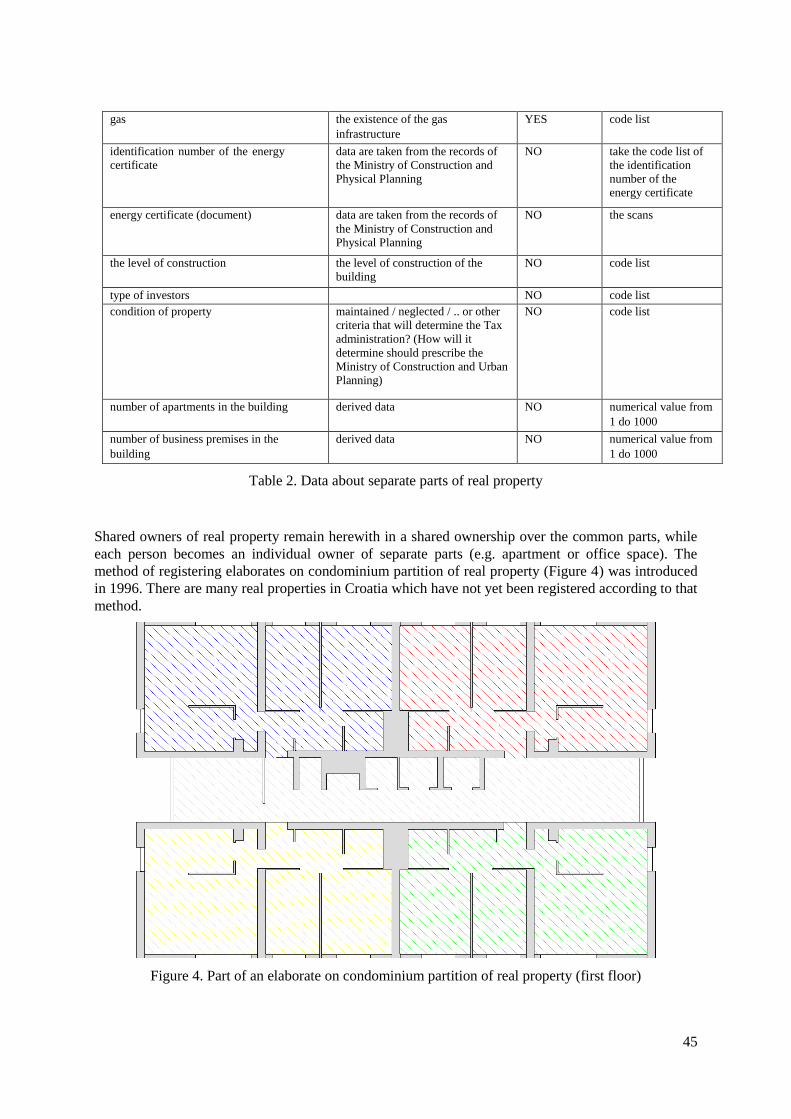
45
gas the existence of the gas
infrastructure
YES code list
identification number of the energy
certificate
data are taken from the records of
the Ministry of Construction and
Physical Planning
NO take the code list of
the identification
number of the
energy certificate
energy certificate (document) data are taken from the records of
the Ministry of Construction and
Physical Planning
NO the scans
the level of construction the level of construction of the
building
NO code list
type of investors NO code list
condition of property maintained / neglected / .. or other
criteria that will determine the Tax
administration? (How will it
determine should prescribe the
Ministry of Construction and Urban
Planning)
NO code list
number of apartments in the building derived data NO numerical value from
1 do 1000
number of business premises in the
building
derived data NO numerical value from
1 do 1000
Table 2. Data about separate parts of real property
Shared owners of real property remain herewith in a shared ownership over the common parts, while
each person becomes an individual owner of separate parts (e.g. apartment or office space). The
method of registering elaborates on condominium partition of real property (Figure 4) was introduced
in 1996. There are many real properties in Croatia which have not yet been registered according to that
method.
Figure 4. Part of an elaborate on condominium partition of real property (first floor)

46
Models have been made from the 2D building plans that are used for elaborate on partition of real
property (Figure 5). In that elaborate there is an original 2D measurement data of every floor and by
heights we can also easy calculate a volume of every separate part of property.
Figure 5. Residential building (3D model of a floor)
Today's computer technology provides advanced methods of registration in official registers. For the
purpose of implementing a building register the 3D models can be used (Figure 6). This model can be
linked to the Unified Feature Identifier of particular part of real property or to the number of cadastral
parcel in the database and also integrated (by coordinates) with matching 3D cartographic view
developed within the national land administration system (Vučić et al. 2013).
Figure 6. Residential building (3D model)

47
5. SPATIAL DATA QUALITY IN 3D CADASTRE
In 2009 Karki et al. investigate about data validation in 3D cadastre. Validation is initially approached
to answer questions such as: “ what is validation? why it is necessary to validate?, and how do we
validate?”. Limiting the scope to the 3D geometry or spatial representation of a 3D cadastre, their
paper takes a novel approach in identifying the various aspects of validation of a 3D cadastral parcel
and identifies the critical validation factors (Karki et al. 2009).
For the area of Republic of Croatia in 2019 Moharić et al. present an overview of some of the most
important on-going activities in the cadastral system of the Republic of Croatia in this respect, as well
as the historical cross-section of a unified digital cadastral database establishment activities and the
transition towards digital cadastre (Moharić et al. 2019).
Step towards 3D cadastre also requires the processing of data inside a building on all apartments and
office spaces within a single building. There are not many complex real-life 3D situations in the
Republic of Croatia (such as tunnels, bridges, complex underground buildings, overlapping bulidings
etc.), and the formation of a 3D cadastre is mostly reduced to the registration of the third dimension as
well as to the registration of special parts of buildings.
Spatial data quality in the 3D cadastre is based on the appropriate processing of 3D data, respectively
in the alignment of the graphic data of the floor plans of special parts of buildings with the written data
on the surfaces of special parts. It is possible to introduce the volume of special parts of a building as a
collected or calculated data. In order to control the quality of the data it is necessary to perform
additional field measurement with affordable handheld laser distance meter. To achieve higher level of
accuracy quality control can be integrated on the application level, e.g. applications responsible for
cadastre management and maintenance.
6. CONCLUSION
Implementation of the Building Register project in the Republic of Croatia, as a new part of the real
property register, is essential for the establishment unique register of buildings. This register will
served as a platform for developing a good, complete and fair basis on which property tax can be
established, for improving management of real property and resolving legal issues in multi-residential
buildings, for better management of spatial and construction planning and housing policy, promoting
the development of community and infrastructure planning, providing a better overview of apartments
and office spaces, allowing better application, as well as providing a systematic statistical list. The
biggest problem in establishing the building register is the large number of buildings unregistered in
the cadastre and land registry, as well as the large number of apartment buildings where a partition
into condominium units has not been conducted. The project of establishing the building register
should, among other things, resolve this problem.
REFERENCES
Biljecki F. (2017) Level of detail in 3D city models, PhD Thesis, TU Delft, pp. 3 and pp. 7
Choon, L. T, Seng, L. K, (2013), Towards a Malaysian Multipurpose 3D Cadastre based on the Land
Administration Domain Model (LADM) - An Empirical Study, Proceedings of the 5th Land
Administration Domain Model Workshop, Kuala Lumpur, Malaysia, FIG, Copenhagen, Denmark
Guo R, Li L, He B, Luo P, Ying S, Zhao Z, Jiang R (2011) 3D Cadastre in China – a Case Study in
Shenzen City, 2nd International Workshop on 3D Cadastres, Delft, Netherlands
Moharić, J., Šustić, A., Vorel Jurčević, B., Šantek, D. (2019) Digital Cadastral Data Quality, Hrvatsko
društvo sudskih vještaka (Croatian Society of Court Experts)

48
Stoter, J, van Oosterom, P, Ploeger H. (2012), The Phased 3D Cadastre Implementation in the
Netherlands, Proceedings of the third FIG Workshop on 3D Cadastres, 25-26 October 2012,
International Federation of Surveyors (FIG), Copenhagen
Karki, S, Thompson, R., Mcdougall, K. (2009). Data validation in 3D Cadastre, Developments in 3D
Geo-Information Sciences (pp.92-122), DOI: 10.1007/978-3-642-04791-6_6.
Vučić, N, (2015), Support the transition from 2D to 3D cadastre in the Republic of Croatia, University
of Zagreb, Faculty of Geodesy, PhD Thesis
Vučić, N, Tomić, H, Roić, M, (2013), Registration of 3D Situations in Croatian Land Administration
System, Proceedings of the International Symposium & Exhibition on Geoinformation ISG 2013,
Faculty of Geoinformation and Real Estate, Universiti Teknology Malaysia, pp. 14-28
Vučić, N., Roić, M., Mađer, M., Vranić, S., Van Oosterom, P. (2017). Overview of the Croatian Land
Administration System and the Possibilities for Its Upgrade to 3D by Existing Data. ISPRS
International Journal of Geo-Information, 6 (7), 223-1. doi:10.3390/ijgi6070223

49
Rebuilding the Cadastral Map of The Netherlands, overall Concept & Communication
on Geometric Quality
Eric HAGEMANS 1, Anouk HUISMAN-VAN ZIJP
2
1,2 Kadaster, Hofstraat 110, 7311 KZ Apeldoorn, The Netherlands
Keywords: cadastral map, communication, (visualization of) geometric quality, automation
SUMMARY
The Dutch Cadastral Map has been around since the early 19th century and fits the designed goal
perfectly: it is a complete and topological correct index to the cadastral registration. However, the so-
called graphic quality of about half a meter doesn’t show on the map and it doesn’t seem to be enough
in a future where people want to use it as a map and zoom in and establish the exact location of their
boundaries themselves. The related uncertainty of the parcel size is also an issue. Therefore Kadaster
defined a wish for a cadastral map with better geometric quality and clearer communication about its
quality.
It quickly became apparent that to be able to create such a map the original field documents must be
used. Technically and financially it is a very big challenge to automatically digitize these documents.
After a market survey we started a research project in 2017 where many different aspects (legal,
communication, geodetic, organizational, etc.) were studied. The focus however was first on the most
critical aspect: the question whether the millions of original analogue field documents could be read
automatically. Two companies realized a proof of concept in which they proved that it is possible, but
not 100% automatically. We continued by contracting experts from both companies who, together
with our own staff, succeeded in building a prototype that is able to both read the documents and
connect them together to a new geometry of a cadastral map. The solution is based on artificial
intelligence.
Field documents
A field document contains the surveyors sketch of the measurements. The content of a field document
is very complex, it is usually handwritten and with a flexible map scale. Extracting structured
information from such documents demands different steps for an automatic algorithm: image
improvement, line detection, point definition, recognition and reading of measurement numbers and
the link between these numbers and two points (begin & end). The result of this process is a digital
drawing on scale with structured measurement data. In this process manual checking and correction is
still needed.
Geodetic concept
A second large process is the positioning of this line pattern in the national reference system and the
connecting of the different field results to each other. The geodetic concept is based on the Delft
method of testing where quality control is performed in all steps of the process. This starts with the
adjustment and testing of the measurements of the many small survey projects individually, of which
the measurements are stored in the field documents. After georeferencing the survey projects grow
together by connecting them using corresponding points in the overlap between the projects. These
corresponding points are often cadastral stones, iron pipes or corners of buildings. All measurements
are weighted and the so-called idealisation precision is accounted for in relation to the type of point.
With every newly added project the redundancy improves, the network is re-adjusted, and the
measurements are statistically tested. In this way the geometric base for the new cadastral map is
being built while errors in the measurements are eliminated.

50
The main challenges in building the geometric base for the new cadastral map are: the large number of
field documents and the variability of their content, the relatively large number of errors in
combination with an average redundancy in individual survey projects that is quite low, and how to
cope with the limitations in network size as a nation-wide integral adjustment is not feasible.
Currently we are in the middle of a pilot project in which we will produce about 5 to 10 thousand
digitized field documents to create a new cadastral map geometry in order to get decision support
information. We are already busy preparing a new infrastructure to store the new geometry called
Reconstruction Map (not yet being the current cadastral map).
Communication with the public
Now that the technical solution is in the making, the next step is to coach the public in using and
understanding the current cadastral map and the new reconstruction map properly, so making the
public understand the geometric quality of the data shown. This poses a big risk of damaging the
public confidence in the Kadaster. Because although we are improving on the quality of our data in
this project, the public for the first time will become aware of the quality of the data and therefore
might perceive it as a quality loss. Therefore a good communication strategy plays a key-role in this
process.
The legal and communication aspects are being examined at this moment. We are developing an
introduction process with a public awareness campaign and legal answers to difficult questions with
the change of parcel sizes as the most delicate one. Also the concept of do-it-yourself reconstruction is
developed. At the moment we are moving from research to decision making, so we are still in the
process of describing all the benefits for society.
Communication on geometric quality
Explaining geometric quality to the public is not easy because it is the result of a mathematical
process. The challenge is to make clear what the result of your actions is, to explain it as simple as
possible while still using correct descriptions. De-mythification of the used methods is therefore
needed.
A simple example of explaining is by using a reliability strip: a zone in which the searched boundary
can be found. For the current cadastral map such a strip is half a meter wide in urban areas and one
meter in rural areas. This way you have an easy story for connecting the boundary representation on
the current cadastral map to the real life situation. For the newly built and improved cadastral map it is
important to explain what quality can be expected. We know the standard deviation (σ) of the absolute
position (compared to the national coordinate system) is at least 5cm. This means a strip of 2σ = 10 cm
minimum, and with a 95% reliability (4σ) even 20 cm!
What we want the public to understand, is that people should expect a 10 cm strip and not 1 cm or
even better quality. While this may disappoint some persons, we feel strongly that open
communication on this subject will be appreciated in the end. As a preparation for that we already
show more metadata about the geometric quality in the current map.
Besides the reliability strip, we are currently designing a system of classification of the quality so the
public can have a better overview of the geometric quality. This classification will be derived from the
quality aspects that are stored to individual points. We already developed some default schemes to
describe difficult situations in an easy way.
As the examples above show, there are many ideas on communicating the cadastral data quality, but
this is still an ongoing process. Although these strategies are being developed specifically for this
project, they can also be used on other spatial Key Registers in the Netherlands, because the same
issues with understanding data quality exist there as well.

51
The Quality Control Column Set: An Alternative to the Confusion Matrix for Thematic
Accuracy Quality Controls
José Rodríguez-Avi, Francisco Javier Ariza-López, Virtudes Alba-Fernández, José Luis García-Balboa
Universidad de Jaén, Paraje des las Lagunillas S/N, E-23.071-Jaén, Spain
[jravi, fjariza, mvalba, jlbalboa]@ujaen.es
Introduction
A classification may be considered accurate if it provides an unbiased representation of the reality
(agrees with reality), or conforms to the “truth”. Thematic accuracy is defined by ISO 19157 as the
accuracy of quantitative attributes and the correctness of non-quantitative attributes and of the
classifications of features and their relationships. Classification correctness is defined by the same
standard as the comparison of the classes assigned to features or their attributes to a universe of
discourse (e.g. ground truth or reference data). Classification correctness is a main concern in any
remote sensed derived product (e.g. land cover, fire and drought incidence maps, etc.) and, in general,
for any kind of spatial data (e.g. vector data such as cadastral parcels, road networks, topographic data
bases, etc.). The main components for a thematic accuracy assessment are (Stehman and Czaplewski,
1998): i) the sampling design used to select the reference sample; ii) the response design used to
obtain the reference land-cover classification for each sampling unit; and iii) the estimation and
analysis procedures. But for a proper classification correctness assessment, a classification scheme is
also needed. A classification scheme has two critical components (Congalton and Green, 2009): i) a
set of labels, ii) a set of rules for assigning labels. From our point of view, the two previous aspects
must be considered from a more general perspective of the production processes of spatial data, and
from this perspective, the first thing to consider is a specification of the product (e.g. in the sense of
ISO 19131). This specification should contain the classification scheme but also a specification of the
level of quality required for each category (e.g. at least 90% of classification correctness for category
A), and grade of confusion allowed between categories (e.g. at most 5% of confusion between
categories A and B). These quality grades must be in accordance with the processes' voice (capacity to
give some quality grade) and the user's voice (quality needs for a specific use case).
The confusion matrix is currently at the core of the accuracy assessment literature (Foody, 2002) and,
as stated by Comber et al. (2012), the error matrix has been adopted as both the “de facto” and the
“de jure” standard, the way to report on the thematic accuracy of any remotely sensed data product
(e.g. image derived data). Of course, the same tool can be used for any kind of data directly originated
in a vector form.
A confusion matrix and the indices derived from it are statistical tools for the analysis of paired
observation. When the objective is to compare two classified data (by different processes, different
operators, different times, or something similar), the observed frequencies in a confusion matrix
areassumed to be modelled by a multinomial distribution (forming a vector after ordering by
columns,for instance). The indexes derived, like overall accuracy, kappa, producer’s and user’s
accuracies and so on, are based on this assumption (multinomial distribution) and they make sense due
to the complete randomness of the elements inside the confusion matrix. However, this inherent
randomness, that is the assumption of the underlying statistical model falls down when a true reference
data is available. Suppose the reference data is located by column. If the reference data are considered
as the truth, the total number of elements we know that belong to a particular category, can be
correctly classified or confused with other categories, but always there will be located in the same
column but never in other different column (category). This fact implies that inherent randomness of
the multinomial is not possible now. However, we can deal with the available classification by

52
considering a multinomial distribution for each category (column) instead of the initial multinomial
distribution which involved all the elements in the matrix. For this reason, we will call this approach
as Quality Control Column Sets (QCCS). Therefore, the goal of this paper is to present the basis of
this new approach and to give an example of its application.
Quality control column set
A confusion matrix, or error matrix, is a contingency table, which is a statistical tool for the analysis
of paired observations. The confusion matrix is proposed and defined as a standard quality- measure
for spatial data (measure #62) by ISO 19157. For a given geographical space, the content of a
confusion matrix is a set of values accounting for the degree of similarity between paired
observations of 𝑘 classes in a controlled data set (CDS), and the same 𝑘 classes of a reference data
set (RDS). Usually RDS and CDS are located by columns and by rows, respectively. So it is a
𝑘 × 𝑘 squared matrix. The diagonal elements of a confusion matrix contain the number of correctly
classified items in each class or category, and the off-diagonal elements contain the number of
confusions. So a confusion matrix is a type of similarity assessment mechanism used for thematic
accuracy assessments.
CM(i,j) = [#items of class (j) of the RDS classified as class (i) in the CDS] (1)
A confusion matrix in not free of errors (Congalton and Green, 1993; Foody, 2002), and for this
reason a quality assurance of intervening processes is needed; e.g. the proposal of Shehman and
Czaplewski (1998) can be considered in this way (in order to apply a statistically rigorous
accuracy assessment). As pointed out by Smits et al. (1999), obtaining a reliable confusion matrix is a
weak link in the accuracy assessment chain. Here a key element is the RDS, denoted sometimes as
“ground truth”, which can be totally inappropriate and, in some cases, very misleading (Congalton and
Green, 2009) and should be avoided. As pointed out by several studies, RDS often contain error and
sometimes possibly more error than the CDS. Here, the mayor problem comes from the fact that
classifications are often based on highly subjective interpretations. The problem of lack of quality in
the reference data is still current (Congalton et al. 2014), and the thematic quality of products
derived from remote sensing still presents problems. We understand that this situation is due to the
fact that in most cases the RDS is simply another set of data (just another classification) and not a
true reference (error free or of better quality).
The above mentioned situation does not occur in the quality assessment of other components of spatial
data quality; in this way, compared to positional accuracy there is a clear lack of standardization. For
example, in the case of positional accuracy, the ASPRS standard (ASPRS, 2015) establishes the
following requirement: “The independent source of higher accuracy for checkpoints shall be at least
three times more accurate than the required accuracy of the geospatial data set being tested”. This
situation is directly achievable when working with topographic and geodetic instruments, but it is
not directly attainable when working with thematic categories because of the high subjectivity of
interpretations. However, we believe that this situation should guide all processes for determining the
RDS of an assessment of thematic accuracy.
In order to actually achieve greater accuracy for the RDS some quality assurance actions need to be
deployed in order to reduce the subjectivity of the interpretations, for instance: i) using a group of
selected operators, ii) designing a specific training procedure for the group of operators in each
specific quality control (use case), iii) calibrating the work of the group of operators in a controlled
area, iv) supplying the group with good written documentation of the product specifications and the
quality control process, v) helping the group with good service support during the quality-control work
and socializing the problems and the solutions and, finally vi) proceeding to the classification based on
a multiple assignation process produced by the operators of the group, achieving agreements where
needed. In this way Yang et al (2017) propose that validation sampling units be reviewed by 9 experts

53
and to adopt a label requires a consensus of at least 6/9 among these experts. All these actions are
quality assurance actions and must be deployed, paying special attention to improving trueness
(reducing systematic differences between operators and reality), precision (increasing agreement
between operators in each case) and uniformity (increasing the stability of operators’ classifications
under different scenarios).
If the RDS does not have the quality to be a reference, the confusion matrix can be understood as a
complete multinomial. From this perspective, the analyses based on the confusion matrix are correct
(e.g. overall accuracy, kappa, users’ and producers’ accuracies, and so on). But if the RDS does have
the quality to be a reference, it is not correct to work with the complete confusion matrix because the
inherent randomness in the matrix falls down. Now we can manage the data under a new approach:
separating the matrix in columns (one for each category) and redefining a multinomial distribution for
each category (column). Within this new approach we propose a category-wise control that allows the
statement of our preferences of quality, category by category, but also the statement of
misclassifications or confusions limited between classes. These preferences are expressed in terms of
minimum percentages required in well-classified items and maximum percentage allowed in
misclassifications between classes within each column.
In order to illustrate the application of the above with an example, Figure 1 shows a confusion matrix
with results from the accuracy assessment of the classification of a synthetic data set with four
categories. Now let us consider that the RDS used in this assessment does have the quality to be a
reference. Therefore, the data from Figure 1 cannot be understood as a complete multinomial but
rather a set of four multinomials, one for each category (column). Figure 2 illustrates this fact with
locks that symbolize that the marginal of the columns are fixed and therefore the new structure
“quality control column set” (QCCS) has to be considered instead of the classical method based on the
confusion matrix.
Figure 1. The new structure called “quality control column set” (QCCS) applied to data with the
structure of a confusion matrix. The locks symbolize that the marginal of the columns are fixed.
For clarity, each column is presented in a different colour, highlighting the number of correctly
classified items. (Wo = Woodland, G = Grassland, N = Non-vegetated, Wa = Water)
Once the QCCS structure is considered our proposal allows us to consider a set of quality
specifications in the following manner: for each category, a classification level could be stated but also
misclassification levels with each other category (or group of them). In Table 1 we have summarized
an example of quality specifications for the category Wo of Figure 1. We have indicated, the minimum
percentage required for well-classified items, but also the maximum percentage allowed in
misclassifications. This possibility of merging categories offers a more flexible quality control
analysis. By this way, the quality specifications conform what we call quality control hypothesis set
(QCHS). Each column of a QCHS allows the complete definition of a multinomial model for a
category (e.g. Table 1). A QCCS supplies the observed data and a QCHS the specifications modelled
by a set of multinomial, so a complete definition of a quality control has been performed and can be
tested by means of an exact test based on the multinomial distribution function.

54
Category Specification ID Description
Woodland
SpWo#1 95% of minimum percentage required in well-classified item (≥95%)
SpWo#2 4% of maximum percentage allowed in misclassifications with
Grassland (≤4%)
SpWo#3 1% of maximum percentage allowed in misclassifications with both Non-vegetated land and Water (≤1%)
Note: these specifications are only by way of example
Table 1. Example of specifications: quality levels required for each category and the percentage of
misclassifications allowed between classes within each category.
Conclusions
A new approach for thematic accuracy quality control is presented. It is based on the assumption that
the RDS is a reference, and this fact makes available a more powerful and complete method for
thematic accuracy quality control than those based on a confusion matrix or on global indices. This
method allows a class by class quality control, including some degree of misclassifications or
confusions between classes. It is a very flexible procedure because it provides the possibility to merge
classes, which means the possibility of varying the dimension of the underlying multinomial and it
also allows us to test simultaneously the quality levels for a set of categories.
Funding
This work was supported by the Spanish Ministry of Economy and Competitiveness [grant number
CMT2015-68276-R].
References
ASPRS, 2015. ASPRS Positional Accuracy Standards for Digital Geospatial Data. Photogrammetric
Engineering & Remote Sensing 81 (3): A1-A26. https://doi.org/10.14358/PERS.81.3.A1-A26
Comber, A., Fisher, P., Brunsdon, C., Khmag, A., 2012. Spatial analysis of remote sensing image
classification accuracy. Remote Sensingof Environment 127, 237-246.
https://doi.org/10.1016/j.rse.2012.09.005.
Congalton, R.; Green, K., 1993. A practical look at the sources of confusion in error matrix
generation. Photogrammetric Engineering & Remote Sensing 59(5), 641-644.
https://www.asprs.org/wp-content/uploads/pers/1993journal/may/1993_may_641-644.pdf
Congalton, R.G., Green, K., 2009. Assessing the accuracy of remotely sensed data: Principles and
practices. Lewis Publishers, Boca Raton, USA.
Congalton, R.G.; Gu, J.; Yadav, K.; Thenkabail, P.; Ozdogan, M. 2014. Global Land Cover
Mapping: A Review and Uncertainty Analysis. Remote Sensing. 2014 (6), 12070-12093.
https://doi.org/10.3390/rs61212070
Foody G.M., 2002. Status of land cover classification accuracy assessment. Remote Sensing of
Environment 80 (1), 185–201. https://doi.org/10.1016/S0034-4257(01)00295-4.
Smits, P. C., Dellepiane, S. G., Schowengerdt, R. A., 1999. Quality assessment of image classification
algorithms for land-cover mapping: a review and proposal for a cost-based approach. International
Journal of Remote Sensing 20, 1461–1486. https://doi.org/10.1080/014311699212560.
Stehman, S.V., Czaplewski, R., 1998. Design and Analysis for Thematic Map Accuracy Assessment:
Fundamental Principles. Remote Sens. Environ 64 (3), 331–344.
https://doi.org/10.1016/S0034-4257(98)00010-8.

55
Yang, Y.; Xiao, P.; Feng, X.; Li, H. 2017. Accuracy assessment of seven global land cover datasets
over China. ISPRS Journal of Photogrammetry and Remote Sensing 125,156-173.
https://doi.org/10.1016/j.isprsjprs.2017.01.016

56
Count Based Quality Control of “As Built” BIM Datasets using the ISO 19157 Framework
Francisco Javier Ariza-López1, José Rodríguez-Avi
2*, Juan Francisco Reinoso Gordo
3, Iñigo Ariza-López
4
1 Department of Cartographical Engineering, Geodesic and Photogrammetry; University of Jaén,
23071 Jaén, Spain; [email protected]
2* Department of Statistics and Operational Research, University of Jaén,
23071 Jaén, Spain; [email protected]
3 Department of Architectural Graphic Expression and Engineering, University of Granada,
18071 Granada, Spain; [email protected]
4 Department of Architectural Constructions I, University of Seville,
41021 Seville, Spain; [email protected]
* Correspondence: [email protected]
From an informational point of view, a Building information model (BIM) is digital model based
geometric information, enriched thematically, semantically and relationally that, managed by the right
software tools, allows a smarter management of buildings and facilities. The corner stone of BIMs is
to understand the relationships between materials, objects, assemblies and projects. All these elements
are managed by a BIM tool as objects, in the sense of object-oriented programming. That means that
materials, objects, assemblies and projects have properties, methods, events and relationships. In
reality, a BIM tool is little more than a database management system with a graphical user interface.
From this point of view, BIM models are directly linked to Geographic Information Systems (GIS)
and BIM data to spatial data (geographic information).
Data quality of BIM datasets (BIMDS) is relevant and the BIM Comunity (www.bimcommunity.com)
has developed a publication series which includes a guide centered on quality assurance of BIM
projects (COBIM, 2012). This document proposes and develop several quality controls mainly
devoted to check logical consistency issues and the use of software is proposed for examining clashes
between building elements. Automatic routines for quality control of BIM has been proposed by
Cheng (2018) and many others authors, also there are several software tools for this propose, e.g.
iTWO by RIB (www.rib-software.co.uk), Solibri by Solibri (www.solibri.com); BIM Tree Manager
by Agacad (www.aga-cad.com) or Verity by ClearEdge (www.clearedge3d.com). All these controls
are based on aspects of logical consistency that, in most cases, can be automated.
Neither of the previously mentioned documents or tools develops or proposes a statistical method for a
statistical quality control. Nor is there any mention of quality control standards from the industrial
field (e.g. ISO 2851 or ISO 3851 series). The situation described above indicates the existence of
several aspects that require research attention. One of them is that all aspects whose quality must be
controlled in BIM datasets must be formalized, and another, that an appropriate method must be
available so that the acceptance/rejection of BIM datasets is carried out on a statistical basis when a
sampling is needed (e.g. as built perspective). In this work proposals are made in these two lines.
Thus, our objective is to propose how to adequately formulate a quality control of BIM datasets and
how to approach a statistical control.
BIM data quality and ISO 19157
BIM data are very similar to spatial data because they must be integrated into a geographical
framework (the actual location of the building), integrated into its environment (the surrounding

57
geographical-topographic reality), and collect the presence, dimensions, positions and exact attributes
of the elements of interest. This resemblance is both conceptual (data models), and factual (e.g.
capture and processing procedures), as well as exploitation (thematic, topological, temporal
consultations, modeling, etc.). This proximity allows an advantageous approximation since in the field
of geographic information there is a greater experience related to data quality. For instance, Sun et al.
(2018) show the close links between spatial data and BIM data and review of the standards and
methods currently used for ensuring quality in spatial data and BIM in Sweden (mainly), and
internationally. For this reason, we adopt this international standard as the base for our proposal.
The International Standard ISO 19157 (ISO 2013) establishes the principles for describing the quality
of spatial data. This is achieved by defining data quality elements, data quality measures, a general
procedure for assessing and reporting data quality.
As a way of handling diverse perspectives of data quality, ISO 19157 proposes the so-called data
quality elements (DQE) (e.g. absolute positional accuracy, relative positional accuracy, classification
correctness, etc.). A DQE relates to a specific aspect of data quality that can be measured and
evaluated through different measures and methods. DQEs can be organized into categories which are
logical groupings of DQE (e.g. DQEs related to logical consistency conform a category).
Before executing quality control, the population of elements of interest must be defined, and this is
carried out by means of a scope. The scope is a filter based on time, location, classification,
attributes… or, in general, in any other criteria that establish an element selection rule. The scope is
usually defined by a category of elements of interest (e.g. windows, walls, pipes, etc.), but it can also
be defined by a set of categories of elements of interest that share some aspect of common interest
(e.g. windows and doors and walls, when our interest is the correction of the finish color). We call this
set of categories of elements of interest the category of interest (CoI). The joint of a CoI with a DQE is
known as data quality unit (DQU) in ISO 19157 terminology. So the same CoI can be linked to
different DQE in order to control several perspectives of the data quality (e.g. those of all the DQE).
Also, the same DQU can be assessed by means of different DQM (data quality measures) and by
different evaluation methods (EM). ISO 19157 defines more than 70 standardized data quality
measures (see Annex C of ISO 19157) but only a general EM. The last is not problematic because ISO
19157 allows the use of whatever evaluation method considered adequate for the assessment purpose,
e.g. ISO 28590 (ISO 2017), ISO 3951 (ISO 2007), etc. Finally, quality control of a product is a
statistical decision on the acceptance or rejection of a product with respect to its specifications, for
this purpose a quality level (QL), or conformity level, must be established. This QL must be
expressed in the same way and units as the DQM used for the DQE being considered. By this way, a
quality control is well defined if a DQU (=DQE + Scope) and its corresponding QL (=DQM) and EM
are properly stablished. These are the elements that must be managed to unequivocally establish
quality control when using the ISO 19157 framework.
Count-based quality control
Products are defined by specifications, so that a nonconformity is the non-fulfillment of a specified
requirement: e.g. a specification can be that 95% of the instances of a BIMDB must carry correct
attributes in relation to reality. The presence of nonconforming/defective items is then quantified and a
decision is made about the compatibility of this amount with respect to the conformity level. If
sampling is required, e.g. in an “as built” BIM quality control, this decision must be taken in a
statistical context in which the risks of the parties are controlled. The appropriate statistical tool for
this is the hypothesis testing framework. Thus, adopting a hypothesis (distribution and value) on the
behavior of the nonconforming items, by taking a sample (of a given sample size n), this statistical
technique allows a decision to be taken where the producer's risk (Type I error), and the user's risk
(Type II error) are bounded. The appropriate statistical models for working with proportions are: the

58
binomial and hypergeometric models for working with one single class, in an infinite or finite
population, respectively, and the multinomial and multivariate hypergeometric models for working
with multiple classes, in an infinite or finite population, respectively.
Thus, the procedure is:
Take an independent sample for each DQU.
Count the number of nonconforming items found in the sample of each DQU.
Calculate the corresponding p-values for each DQU.
Check whether or not the global H0 hypothesis is accepted or rejected according to a MHTM
correction.
Example of application
As an example of the application of the proposed method, the case of a BIMDB control corresponding
to the delivery of an ended project (“as built”) will be considered. It is a building with 4 floors
(basement, F0, F1 and F2); with garages in the basement, two commercial premises in F0 and 4
apartments distributed between F1 and F2, that is, two per each floor.
Group
Categories of interest
Cases (N)
Group
Categories of interest
Cases (N)
Elements C1=Doors and windows 119 C8=Slabs and paving 25
C2=Bathrooms and Kitchens 14 C9=Pillars 105
C3=Balconies and terraces 29 C10=Sales unit 6
C4=Other rooms 18 C11= Interior walls 200
C5=Living rooms and bedrooms 16 Facilities C12=Electricity installation 7
C6=Common zones
6
C13=Heating and air
conditioned installations
7
C7=Enclosures (walls) 179 Total 731
Table 1 Categories of interest in the BIMDB
In relation to the DQU for the control, Table 2 summarizes their configuration, population and sample
sizes. Sample sizes have been set arbitrarily with the criteria set forth above (≈10%), except for case C2, for
which a size that assumes a proportion is adopted of the population.
Data quality units
Cases in the
population (N)
Sample
size
(n)
Quality
control
Data Quality Measure and ID*
Conformity
level
(Maximum
proportion of
defects)
DQU1=Completeness of elements
DQE = Commission + omission
CoI = C1+C2+ ··· + C10
511
50
QC1
Rate of excess items (ID=3) +
Rate of missing items (ID=7)
1%
DQU2=Completeness of facilities
DQE = Commission + omission
CoI = C11+ C13
182
40
QC2
Rate of excess items (ID=3) + Rate of missing items (ID=7)
3%
DQU3= Shape Fidelity
DQE = Fidelity in shape
CoI = C1+C2+ ··· + C10
1605
160
QC3
Rate of unfaithful items (ID=**)
5%
DQU4=Attributes of elements DQE = Correction of non-
quantitative attributes CoI = C1+C2+ ··· + C10
462
50
QC4
Rate of incorrect attribute values (ID=67)
10%

59
DQU5=Attributes of installations
DQE = Correction of non-
quantitative attributes CoI = C12+ C13
491
50
QC5
Rate of incorrect attribute values
(ID=67)
10%
DQU6= Shape Fidelity of walls
DQE = Fidelity in shape CoI = C11
200
20
QC6
Rate of unfaithful items (ID=**)
80%, 15%,5%***
Total 3451 350
(*) The ID is the identifier for this measure given in Annex D of ISO 19157.
(**) This measure is not included in Annex D of ISO 19157. (***) This proportions are linked to good, acceptable and unacceptable cases.
Table 2 Definition of data quality units to be considered for the control
(cases in the population and sample size) and the quality controls
by means of the data quality units and the conformity levels
Prior to the control and by agreement between the parties, QL must have been established. For this
example, the specifications are those presented in Table 2. When indicating completeness, we refer to
both omissions and commissions, considering both types of error as equivalent for error counting
proposes. Finally, it should be noted that the QLs are themselves an order of the importance of the
different aspects considered in the control. Naturally, these values must be determined based on the
experience and the requirement of greater or lesser rigor for the BIM application. By this way, as
indicated by Eq (4), the global control on the BIMDB means that: QC1 is passed AND QC2 is passed
AND QC3 is passed AND QC4 is passed AND QC5 is passed AND QC6 is passed.
Defect case counts are computed (Table 3). From them, applying the functions (pbinom and phyper)
(R Core Team, 2019), the p-values that appear in Table 3 are obtained. As can be seen, the
hypergeometric model has been considered for the case QC2, in the rest of the cases the binomial
model is applied. Here a MHTM is needed, and we apply Bonferroni by its simplicity. Since α = 5%
was adopted, the global null hypothesis should be rejected if any p-value were less than 0.05 /
6=0.0083. Given that the lowest obtained p-value is 0.0004 <0.083, it is possible to reject the
hypothesis that the BIMDB complies with the specifications imposed by Table 4 since the observed
data give evidence of this.
Quality
control
Number of
nonconforming
items
Sample
size (n)
p-value
Binomial Hypergeometric Multivariate
Hypergeometric
QC1 0 50 1.000
QC2 5 40 0.0004
QC3 11 160 0.179
QC4 5 50 0.569
QC5 2 50 0.966
QC6 7,1(*) 20 0.0236
(*) The number of items per class is: 12 (good), 7 (acceptable), 1 (unacceptable)
Table 3 Results of the defective count and p-values by quality control
Conclusions
The quality of BIMDB is an issue of great importance but, so far, it is not acquiring the appropriate
relevance compared to the current boom of its applications. The quality of BIMDB is not fully
formalized, but directly applicable knowledge can be transferred from the field of geospatial data. The
framework established by ISO 19157 (ISO 2013) has already been proposed for its application to BIM

60
data due to its great similarity with geographical information. This paper has presented the statistical
basis of a method of global quality control of BIMDB with multiple DQUs, which means different
scopes and diverse DQEs. The method has a valid, affordable and known statistical formulation as it is
based on known distribution functions that are applied in the field of quality control. The main
contributions of this work are two, first the proposal and example of use of ISO 19157 data quality
framework to BIM data, and second the statistical approach formulation including an example of use
on how to handle the joint control of several types of errors with different quality specifications for
each of them.
Funding
This work has been supported by grant CMT2015-68276-R of the Spanish Ministry of Economy and
Competitiveness.
References
Cheng, Y.M. (2018). Building Information Modeling for Quality Management. In Proceedings of the
20th International Conference on Enterprise Information Systems (ICEIS 2018) - Volume 2, pages
351-358
COBIM (2012). Series 6 Quality assurance. Common BIM Requirements.
ISO (2013). Geographic Information – Data Quality. International Standardization Organization.
ISO (2007). ISO 3951-3:2007 Sampling procedures for inspection by variables — Part 3: Double
sampling schemes indexed by acceptance quality limit (AQL) for lot-by-lot inspection. International
Organization for Standardization.
ISO (2017). ISO 28590:2017 Sampling procedures for inspection by attributes — Introduction to the
ISO 2859 series of standards for sampling for inspection by attributes. International Organization for
Standardization.
R Development Core Team (2019). R: A Language and Environment for Statistical Computing.
Vienna, R Foundation for Statistical Computing.
Sun J, Harrie L, Jensen A, Eriksson H, Tarandi V, Uggla G (2018). Description of geodata quality
with focus on integration of BIM-data and geodata.

61
Solutions for Encouraging Spatial Data Producers to Co-Operate in Harmonizing
National Topographic Data
Nils Mesterton
National Land Survey of Finland, Helsinki, Finland
National Land Survey (NLS) has developed digital services that aim to advance harmonization of
spatial data in Finland. The Geospatial Platform started during 2017 and it consists of a number of
digital services to support the national SDI in Finland. One of the main goals of the platform is to
encourage data producers to adopt common conceptual models defined in the project in collaboration
with various stakeholders. Data quality is an important component in harmonizing national spatial data
because while having a multi-producer environment reduces overlapping work, it also means that all
of the data producers have their own methods of producing their data which again makes national data
regionally different in terms of quality.
This paper highlights answering to a number of challenges faced in involving data producers in the
effort of making national spatial data harmonized, i.e. interoperable in Finland. New development
ideas, the Quality Rule Catalog and Quality Map are presented. To advance the national SDI, it is very
important to utilize various communicational methods along with developing technical solutions to
meet the user needs. Common solutions, definitions and services are required to make it certain that
data producers have the capability to deliver high quality interoperable data to the national supply.
That is why I believe that it is important to develop both the technical things as well as methods to
listen and to involve key stakeholders in the development work.
Data producers import their data using the Data Upload Service which allows integrating spatial data
in various schemas and formats to the Geospatial Platform and importing them to the national
database. Data Upload Service transforms interoperable data to a data model following common
conceptual models.
QualityGuard is an automated spatial data quality solution that evaluates data quality of all data that
are imported to the national database. It has been in trial use for over a year now. Users which are
primarily municipalities and regions at the moment receive a logical consistency report describing
which of the imported features conflict with quality rules regarding the theme of the imported data.
Quality rules are meant to reveal issues that are not logically consistent with the common conceptual
models.
A central challenge is to motivate municipalities and regions to try the services and provide feed- back
on them during their beta phase so that they could be developed to reach the user needs to a higher
degree before entering production. Communicating a clear and reachable vision is imperative in
motivating data producers to participate in the effort. Bombastic headlines will certainly bring
attention to the cause across the board but claiming the promises and making them reality is an
entirely different challenge that requires expertise in many fields.
A promising path to success seems to be a combination of creating co-operation by working
intensively with key stakeholders and delivering high-quality digital services that meet the user needs
as well as possible. Motivated or not, data producers may not necessarily have the means to do
anything regardless of how excited they would be about the vision. Developing the data to be
nationally interoperable and making the methods for data collection to be less error-prone requires
work, GIS professionals and money. This also requires building commitment among the municipal
policy makers.
Implementation work of the demonstration services of data importation service and QualityGuard has
had a rather sluggish start. This is due to various reasons and the problem field is diverse. Currently

62
there are 40 user organizations that have been granted access the Geospatial Platform. Most of these
are municipalities and regional alliances interested in importing their data. Regional alliances maintain
and deliver regional plans using a common data model. Having a common data model makes it
effortless to integrate these services to their data production process. Municipalities deliver building
data but in this case the data production methods are different for each data producer. This leads to
building data being different for each producer, making it more awkward to integrate with the data and
to reach for national interoperability. Larger municipalities have more resources and often have their
own GIS department but smaller municipalities may have out- sourced all of their GIS work if there
even is any relevant spatial data available.
Understanding and supporting the users in adopting the services has a big role in the implementation
work. Data producers need individual support in adopting and using the services. Geospatial Platform
has answered to this need by establishing a number of supporting activities. Implementation support
team is responsible for taking care of the data producer once they have applied for access rights to
QualityGuard and to the Data Upload Service until the data can be successfully imported to the
Geospatial Platform services. This requires granting access and creating configurations for the data to
be imported and dealing with any issues until successful runs have been made.
The data producer’s capability to integrate their data will be evaluated with technical personnel before
implementation. In case of issues or worries about the services or the data, they can contact the
support using email or telephone. NLS also arranges promoting sessions (skype meetings and face to
face meetings) with municipalities where the data producers can discuss about integrating their data
with experts. Communicating actively with the data producers has an essential role in developing the
support services and also the applications because it is an excellent method of reaching a sufficient
understanding of the users needs and their problems. However, communication is not enough to
support the user in this task and there should be a good repository of online support material available.
Data Quality Catalog is an online collection of quality rules added with detailed instructions and
guiding visuals on how to fix the data. A basic version of the Catalog containing just the quality rule
definitions will be online this fall to be evaluated by users of the Geospatial Platform services. The
fully featured version has been recognized to hold great value and the development is expected to
begin next year. It is meant to deliver assistance on a platter to the users trying to understand and find
ways how to fix their data relying on the quality information provided by QualityGuard's error dataset.
Having an online repository of quality rules is an essential resource that makes fixing quality issues
easier and greatly reduces the need to guide data producers individually. In many cases it can
completely eliminate the need to contact the Geospatial Platform support organization and this is again
very beneficial because there is always a threshold in reaching for help.
One of the ideas that we are planning to implement to support the users, Quality Map is a web map
that visualizes data quality across the nation. Visualizing data quality across the nation on a web map
could also be very useful for implementation work but also for the end users of the data. Making
things visible would display which data producers are delivering their data and putting an effort in
improving and developing their data towards national interoperability. This would bring data quality
transparent to the ecosystem and hopefully make data producers to compete with each other in
developing their data. On the other hand, end users could see if the data is available and interoperable
across administrative region borders, which would improve usability of the data by helping users
decide whether or not the data is suitable for their use case.
Harmonizing national topographic data is a big effort which requires common rules, models and
processes regarding the data, building motivation and commitment among the data producers as well
as implementing high quality digital services that meet the user needs. We believe that resort- ing to
legislation is far from being the only way to reach commitment and hope to see the rise of an
innovative spatial data ecosystem around interoperable data in Finland.

63
Evaluating Quality of Spatial Data Coming from Multiple Suppliers
Case Finnish National Topographic Database
Mari Isomäki
National Land Survey of Finland, Application Services, Helsinki, FI-00521, Finland
The Finnish National Topographic Database (NTDB) is a centralized database for topographic data of
Finland. It consists of buildings (2.5D and 3D), road links, other manmade structures and addresses.
The NTDB consists of data coming from multiple suppliers: governmental organizations and
municipalities. Different suppliers use varying systems in gathering and storing spatial data among
each other’s (Lundvall 2019). Because the systems vary greatly, also the data supplied comes in many
different forms in regard of their format and quality. In effect, large diversity of data is the biggest
challenge in collecting national data into a centralized database.
To overcome the versatility of data, schema transformation and quality check must be implemented on
every data import. Data validation is based on quality specifications formatted as quality rules. Quality
rules are derived from INSPIRE and current national topographic database norms, quality rules
produced by European Location Framework project (ELF) and international and national standards.
Quality rules are divided into three ISO 19157 quality elements: format consistency, domain
consistency and topological consistency (ISO/TS 19157:2014). This paper focuses on implementing
quality rules on spatial data: what is being tested before importing data into the NTDB and how
quality rules are implemented.
Before a data supplier can import data into the NTDB, a corresponding schema transformation
document is created into the automated data import system called Quality Guard and Data Upload
Service, of which schema transformation is an integrated part of. During schema transformation,
attribute names and values are converter to the ones used in the NTDB. After the schema
transformation, data is compatible with the data model used in the NTDB and with the quality rules.
In Quality Guard and Data Upload Service, there are fifteen individual rule types (fig 1) and 351
different quality rules. Besides rule type, each rule consists of rule identifier, attribute it is targeted on,
feature type that is being validated, severity, description and rule parameters. Rule parameters contain
detail-leveled information of what is being validated, whereas rule type guides how a rule is tested.
Based on feature type and attribute, correct quality rules can be targeted to appropriate features. The
most crucial rules, such as geometry validity, empty geometry and attribute data types are tested on all
features passing Quality Guard and Data Upload Service.
Rule type What is tested?
Not null Attribute has a value
Character length Value consists of certain amount of characters
Geometry type Geometry is the right type (area, point, or line)
Value range Value belongs in a predefined range of values
Belongs in a set Value belongs in a predefined set of values
Data type Data type is correct (integer, double, numeric, boolean, string, timestamp or date)
Distance Distance between features (features that are linked to each other’s can only have
certain distance between them)

64
Compare Value must be bigger, smaller or equal compared to another value
Overlaps Features must not overlap more than defined ratio
Geometry validity Geometry meets OGC SFSQL standards
Empty geometry Feature has a geometry
RegEx Value is consistent with a given regular expression
Within Feature is within a given area
Name list Value is found on a list (used to find out misspellings in address names)
Fig 1. Quality rule types implemented in building imports.
Depending on a quality rule, not passing a quality check causes either a warning or an error. All rules
related to geometry validity cause an error. Instead, attribute rules usually only cause an error when
data type is not correct. A feature causing error will not be inserted into the NTDB, but a feature
causing warning will. On the both cases, failed feature will be added in automatically constructed
quality rapport data supplier receives in case warnings or error are discovered. Quality rapport is a
shapefile where every failed feature is represented as a point marking failed feature’s center point.
However, if error relates to geometry invalidity, the point is in the invalid spot. Besides error location,
quality rapport also includes rule description, identifier, severity and original value. In the case a rule
compares a value to another, also compared value is represented in the quality rapport.
Having correct results in data validation depends fully on correct schema transformation. Because
quality rules expect input data to be in a certain schema, schema transformation is actually the most
crucial part of data validation in Quality Guard and Data Upload Service. Moreover, schema
transformation document is created manually, which makes it prone to mistakes. In the case schema
transformation is not done correctly, in addition to having false errors, data upload process usually
fails when starting to write features into database because of mismatches between NTDB and input
data.
Both, schema transformation and data validation, are being implemented in FME based application.
FME is a versatile and effective platform for building ETL (extract, transform & load) workflows.
Workflows used by Quality Guard and Data Upload Service are parametrized, making the application
dynamic and automated. FME offers a great number of built-in tools to test, route and manipulate data.
Also, many spatial data tools, such as spatial filtering and geometry validation, are available. In case
FME’s built-in tools do not offer solution, Python, TCL and SQL can be used. For example, overlap
and distance rules are executed by Postgis functions instead of built-in tools, because queries are more
efficient compared to built-in functions (fig 2).
Fig 2. Data validation process in Quality Guard and Data Upload Service

65
To conclude, NTDB can be built on data that is versatile in format and in quality. However, schema
transformation and data validation are crucial parts in the process. Either cannot be skipped, when
building a centralized database that uses diverse data sources and only includes high-quality data.
Furthermore, such a process should be as dynamic as possible, since dynamic process often lead to
easy maintainability.
References
ISO/TS 19158:2012, eographic information ualit assurance of data suppl .
ISO/TS 19157:2014, eographic information ata ualit .
Lundvall, A. (2019), The topographic database of the future is being built right now. Positio.

66
Understanding the Importance of Provenance from the Perspective of a
Geospatial Decision-Maker
Nikos Papapesios1, Claire Ellul
2, Artemis Skarlatidou
3, Amanda Shakir
4, Glen Hart
4
1,2 Civil, Environmental and Geomatic Engineering, University College London, London, United Kingdom
3 Dept of Geography, University College London, London, United Kingdom
4 Defence Science and Technology Laboratory DSTL, Salisbury, United Kingdom
Keywords: Provenance, Decision-making, Usefulness
Abstract
Information derived from geospatial sources are used in decision-making in various sectors such as in
defence (Franklin et al. 2013; Roy et al. 2017), in government (Harding 2006; Sutanta et al. 2016; Scott
and Rajabifard 2017) and in non-government organisations (Crooks and Wise 2013; Quill 2018).
However, decision-makers do not always have an easy way to decide whether to make use of the given
information in their decisions – and if so, how much can they rely on them. A factor that may
influence reliance on information for decision-making is well-documented provenance13
of the
information (Ma et al. 2014). Provenance is defined as the “information about entities, activities, and
people involved in producing a piece of data or thing, which can be used to form assessments about its
quality, reliability or trustworthiness” (W3C 2010). It is frequently referred to as lineage, pedigree,
parentage, genealogy and filiation (Buneman et al. 2001; Simmhan et al. 2005). There is thus a specific
interest in whether presenting important factors of provenance alongside the delivered information,
can assist decision-makers to be able to make informed decisions. This abstract presents the
preliminary results of an investigation into this aspect of provenance 2
.
A core challenge in evidence-based decision-making is to prevent information overload. It is thus
important to find out what provenance factors are required, providing the decision-makers only with
sufficient context without over-burdening them with excessive details. The first step of any approach
to tackle this challenge includes developing a better understanding of related concepts – what is
provenance, and what are the current factors suggested as being an important component of
provenance. Research shows that data quality and metadata factors are of high importance to make
provenance information more useful. This in turn leads to the development of a theoretical framework
to underpin work on identifying which data quality and metadata factors are potentially relevant to
decision-makers interested in the provenance of their data.
The analysis of the related concepts indicates that although provenance does not entirely correspond to
metadata, these concepts (provenance and metadata) are usually linked (W3C 2010). Provenance is
often described as the process to detect the lineage and the derivation of data (Alkhalil and Ramadan
2017). Yue et al. (2011) state that lineage and provenance often overlap, with both being used to
1 Provenance information can answer to questions such as who created the information, when it was created,
why it was created, when it was updated, who own the information. 2 The presented work has been ethically approved by the UCL Research Ethics Committee until 15th July 2020.

67
describe the same information. Provenance also evaluates the data quality and reproduces processes
(Simmhan et al. 2005; Moreau and Foster 2006; Chen et al. 2014; Closa et al. 2017).
Interoperability of diverse environments thus can be increased (W3C 2013). The level of detail
described in provenance can determine how much quality can be assessed (Simmhan et al. 2005).
Provenance can also identify relationships between different objects, trace them back, providing
thereby the big image of a situation (Chen et al. 2014). Therefore, it can help a user to assess fitness
for purpose for a specific application, by providing a description of the origin of the data as well as the
processes implemented to bring data in the current form (Closa et al. 2017).
However, much of the work cited above relates to a producer centric view of provenance. To develop
a more user-centric view of the problem – and address issues relating to information overload due to
the complexity of current standards, interviews have then been conducted to further understand the
decision-maker perspective on this challenge as well as their actual needs. For these semi-structured
interviews, participants are selected from various sectors amongst the geospatial network of the
research study. The selected stakeholders represent a wide range of sectors of decision-makers,
making use of geospatial information products (geospatial decision-makers). Each interview was
around 40 minutes long and covered topics including geospatial information, metadata and
presentation techniques.
Once the interviews were transcribed, thematic analysis was selected as a user-friendly method of
qualitative data analysis (Braun and Clarke 2012). This involves a six-phase approach (proposed by
Braun and Clarke, 2012), including code generation and theme identification. The outputs of the
analysis are examined in the NVIVO software, which supports the annotation and coding of
qualitative data and presented through reports as well as scatter diagrams and other graphical
representations. Preliminary findings include a set of factors identified as important, several
suggestions to present them through provenance and additional challenges that can influence decision-
makers’ trust.
These preliminary results highlight the importance of taking into account the decision-makers’ needs
when presenting provenance information and will help develop a focus on the important factors that
should be presented as provenance accompanying the received information. Based on this results,
online surveys will be distributed to a larger number of participants that is not possible to participate in
the interview study, providing immediate data validation and faster response rates (Sue and Ritter
2012; Díaz De Rada and Domínguez-Alvarez 2014). This information - i.e. the usefulness of the
provenance information for information derived from geospatial information – will thus form part of
an enhanced provenance framework, with the next stages of the work focussing on usability and trust.
A number of low and high-fidelity prototypes will be then developed to present provenance
information according to the decision-makers’ preferences. The developed prototypes will be also
evaluated through usability tests where the stakeholders will have to interact with several tasks, trying
to assess if the provenance information is presented in a usable way as well as if their trust level is
increased.
Acknowledgments
This work is funded by a PhD studentship co-sponsored by the UK Defence Science and Technology
Laboratory and the UK Engineering and Physical Sciences Research Council. The authors would like
to thank both funders for their support.
References
Alkhalil A, Ramadan RA (2017) IoT Data Provenance Implementation Challenges. Procedia Comput
Sci 109:1134–1139. doi: 10.1016/j.procs.2017.05.436

68
Braun V, Clarke V (2012) Thematic Analysis.
Buneman P., Khanna S., Wang-Chiew T. (2001) Why and Where: A Characterization of Data
Provenance. In: Van den Bussche J., Vianu V. (eds) Database Theory — ICDT 2001. ICDT 2001.
Lecture Notes in Computer Science, vol 1973. Springer, Berlin, Heidelberg. https://doi.org/10.1007/3-
540-44503-X_20
Chen P, Plale B, Aktas MS (2014) Temporal representation for mining scientific data provenance. Futur
Gener Comput Syst 36:363–378. doi: 10.1016/j.future.2013.09.032
Closa G, Masó J, Proß B, Pons X (2017) W3C PROV to describe provenance at the dataset, feature
and attribute levels in a distributed environment. Comput Environ Urban Syst 64:103–117. doi:
10.1016/j.compenvurbsys.2017.01.008
Crooks AT, Wise S (2013) GIS and agent-based models for humanitarian assistance. Comput Environ
Urban Syst 41:100–111. doi: 10.1016/j.compenvurbsys.2013.05.003
Díaz De Rada V, Domínguez-Alvarez JA (2014) Response Quality of Self-Administered Question-
naires: A Comparison Between Paper and Web Questionnaires. Soc Sci Comput Rev 32:256–269. doi:
10.1177/0894439313508516
Franklin AL, Mott T, Williams THL (2013) Coproduction in the U.S. Department of Defense:
Examining how the evolution of geographic information systems (GIS) expands non-traditional
partner engagement. Policy and Internet 5:387–401. doi: 10.1002/1944-2866.POI345
Harding J (2006) Vector Data Quality: A Data Provider’s Perspective. In: Fundamentals of Spatial
Data Quality. pp 141–159
Ma X, Fox P, Jacobs K, Wample A (2014) Capturing provenance of global change information. Nat
Clim Chang. doi: 10.1038/nclimate2141
Moreau L, Foster I (2006) Provenance and Annotation of Data. Chicago, IL, USA
Quill TM (2018) Humanitarian Mapping as Library Outreach: A Case for Community-Oriented
Mapathons. J Web Librariansh 12:160–168. doi: 10.1080/19322909.2018.1463585
Roy SE, Kase EK, Bowman H (2017) Crowdsourcing Social Media for Military Operations. Assoc
Comput Mach 23–27.
Scott G, Rajabifard A (2017) Sustainable development and geospatial information: a strategic
framework for integrating a global policy agenda into national geospatial capabilities. Geo-spatial Inf
Sci 20:59–76. doi: 10.1080/10095020.2017.1325594
Simmhan YL, Plale B, Gannon D (2005) A Survey of Data Provenance Techniques. Sue VM, Ritter
LA (2012) Conducting online surveys. Sage Publications
Sutanta H, Aditya T, Astrini R (2016) Smart City and Geospatial Information Availability, Current
Status in Indonesian Cities. Procedia - Soc Behav Sci 227:265–269. doi: 10.1016/j.sbspro.2016.06.070
W3C (2010) What Is Provenance - XG Provenance Wiki.
https://www.w3.org/2005/Incubator/prov/wiki/What_Is_Provenance. Accessed 28 Jul 2018
W3C (2013) PROV-Overview. https://www.w3.org/TR/prov-overview/. Accessed 27 Jul 2018
Yue P, Wei Y, Di L, et al (2011) Sharing geospatial provenance in a service-oriented environment.
Comput Environ Urban Syst 35:333–343. doi: 10.1016/j.compenvurbsys.2011.02.006

69
Collaborative User Oriented Metadata Production on EuroSDR Geometadatalabs Platform
Bénédicte Bucher, Marie-Dominique Van Damme
LASTIG, Univ Gustave Eiffel, ENSG, IGN, Saint Mande, F 94 160, France
Geographical metadata have initially been designed for the management of geographical data in a
production environment and for the exchange of geographical data between a provider environment
and a user application. These metadata were to be processed in contexts belonging to the general
domain of expertise of geographic information (GI). In the past twenty years, geographical metadata
standards stemming mainly from the GI community have been elaborated, in particular ISO19115 to
describe geographical data series. Metadata datasets have been produced to describe authoritative
databases, in particular in the context of the European spatial information infrastructure, INSPIRE.
On-line catalogue services were developed to exploit these metadata and exchange them metadata
conforming to the CSW standard.
Geographical metadata may also be needed in contexts not belonging to the general field of GI
expertise. In the early century, the Web has been widely adopted as an open distributed architecture. In
an open distributed architecture, no restriction should be set on the potential users of a given data
service and metadata should support not only data exchange but also data discovery and reuse in
domains possibly far from the data specific domain. Users who may not have been trained to use
complex geographical data could benefit from spatial data infrastructure like INSPIRE. To achieve
this, current GI catalogues must be improved to be usable not only from GI specialists but also from
novice users. Since ten years, efforts have been devoted by the GI community to reach new users by
adopting new formalism and standards outside the GI field of expertise. For example the DCAT
metadata standard is used to produce geographical metadata more legible outside the GI community.
The work presented here targets the identification and production of geographical metadata to improve
the capacities of existing GI catalogues and make them more usable for novice users of geographical
data. We wish to remove from the user perspective existing silos between data technologies and
funding programs that he currently has to cope with when he searches for geographical data. Our
research hypothesis is that this identification and this production can be organized through a
collaborative platform connecting representative users and experts of the different relevant GI
components, geographical data and geographical software or services to pre- process the raw
geographical data for the user application. Our approach is to foster the analysis by the requirements
of a chosen application. For this application, we analyze what metadata are required for users to
retrieve and use geographical data and are currently missing. Then we experiment a process to produce
these missing metadata on a collaborative platform, in a way compatible with standard models so that
the produced metadata content can eventually feed existing catalogues.
To implement our approach and evaluate our research hypothesis, a first step was to design a
collaborative platform accessible from representative users of an application domain and from experts
in geodata or geosoftware.
This platform is the EuroSDR Geometadatalabs platform. Geometadatalabs was designed to support
the identification of missing metadata by eliciting user requirements and connecting them with
existing metadata, more precisely querying existing catalogues based on their requirements and
presenting them the results. A strong constraint from our perspective was to support user- centered
access to data and to mobilize geodata experts who may be reluctant to interact with different
platforms. We implemented Geomatadatalabs as a unique platform that will host different projects
depending on the user community. These use-oriented projects are called infolabs, as illustrated on

70
Figure 1. The user sees the specific infolab dedicated to his usage whereas the geodata provider can
have an access centered on his geodata and transversal to all thematic infolabs.
Geometadatalabs was also designed to support the production of missing metadata. With this respect,
it must be capable of supporting collaborative production of whatever constitutes metadata in today’s
context: textual comments, structured data more and more to be organized as linked data and images.
Mediawiki engine was chosen mainly because it powers the successful collaborative project Wikipedia
which demonstrates that its editing interface can be learnt by anyone. Besides, it supports the edition
of textual and semi-structured information. It can integrate RDF data and hence interact with more
structured and GI oriented catalogues powered by Geonetwork for example as well as yield structured
data for these catalogues.
Figure 1. Geometadatalabs, a collaborative platform hosting specific infolabs dedicated to exchanges
between GI experts and a specific users community, on this page URCLIM infolab for the urban
climate community to connect with experts in geodata and geosoftware relevant for their needs.
The next step is to select an application domain for this research and experiment our approach on this
domain, i.e. our capacity to identify missing metadata and to collaboratively document them. The
criterion to select an application domain is the fact that representative users are motivated to engage in
our experiment.
Our first proof of concept is developed within the application domain of urban climate modelling.
Scientists studying urban climate design canopy models to simulate interactions between
meteorological phenomena (wind, moisture, temperature) described at a given scale and the surface of
earth described at a finer scale in order to calculate finer meteorological phenomena. To obtain land
data required to feed these canopy models, this community has developed a common strategy: 1) agree
on common formal specifications of such land models (a.k.a Local climate Zones) (Bechter et al.
2015), 2) design production procedures of such land data affordable by the community itself (Ching et
al. 2018). This strategy has been successfully applied to produce low resolution land model out of
Landsat imagery on the World Urban Databased and Access Portal Tools project
(http://www.wudapt.org/). In order to account for local phenomena like for instance urban heat
islands or air pollution, more resolute climate models are needed. To design these models, scientists
need more resolute land data describing the city morphology and land use (Masson et al. 2019). The

71
purpose of the URCLIM project is to design local urban climate models on a set of European cities –
Paris, Toulouse, Ghent, Brussels, Helsinki, The Randstadt, Bucarest- reusing local open data, and local
data which falls into the scope of the Public Sector Information Directive, i.e. which may not be open
at the start of the project but that have a good probability to become open in the near future. The
URCLIM infolab has been developed on Geometadatalabs platform to connect climate scientists and
data specialist to identify and reuse relevant geo- resources to produce land models to feed urban
canopy models at a high resolution (Bucher and Van Damme 2018). Its main page is visible on
Figure 2.
Figure 2. Infolab dedicated to urban climate research hosted on Geometadatalabs.
The identification of missing metadata was performed by decomposing the retrieval process step by
step, using the platform to share the expression of user requirements and the presentation of metadata
results and discussions on data relevance. We identified the following missing metadata.
- To improve the expression of a user need, more alignments between existing ontologies must
be established and maintained to connect user domain with geo-data domains. INSPIRE
schemas are a very useful asset to perform these alignments. Similarity measures are needed,
firstly to assess if comparable data are available on a different city, and second to support the
query extension.
- To improve the retrieval of resources and evaluate their relevance, multi-lingual metadata are
needed as well as data samples. Similarity measures are needed to compare datasets. More
metadata about derivation processes are needed than metadata about the different software
projects –users do not want to contribute to the software but rather to preprocess their data-. In
this specific step, Geospatial user feedback from similar users is especially relevant. Cross-
references between similar data and similar software or services are missing.
- During the exploitation of the data, for users to be able to question the results, they need
legible provenance documentation (the entities involved, their expertise, the technologies).
Besides, there is a need for a technology neutral way to describe uncertainty.

72
Figure 3. Elicitation of user requirements for geographical information on URCLIM infolab.
Further work must address the production of cross references between data set in the different cities of
the project and n the documentation of derivation process to process the raw datasets and yield the
required information layer.
This work is developed in the context of EuroSDR commission on information usage and has been
funded by EuroSDR. It also benefited from fruitful exchanges with Eurogeographics Quality KEN and
INSPIRE KEN. It has been partly funded by ERA4CS, an ERA-NET initiated by JPI Climate with co-
funding from the European Union (Grant n° 690462) for the URCLIM project (www.urclim.eu).
References
Bechtel, B., Alexander, P., Böhner, J., Ching, J., Conrad, O., Feddema, J., Mills, G., See, L. and
Stewart, I. 2015. Mapping local climate zones for a worldwide database of form and function of cities.
International Journal of Geographic Information, 4(1), 199-219
Ching, J., Mills, G., Bechtel, B., See, L., Feddema, J., Wang, X., Ren, C., Brousse, O., Martilli, A.,
Neophytou, M., Mouzourides, P., Stewart, I., Hanna, A., Ng, E., Foley, M., Alexander, P., Aliaga, D.,
Niyogi, D., Shreevastava, A., Bhalachandran, P., Masson, V., Hidalgo, J., Fung, J., Andrade, M.,
Baklanov, A., Dai, W., Milcinski, G., Demuzere, M., Brunsell, N., Pesaresi, M., Miao, S., Mu, Q.,
Chen, F., Theeuwes, N., 2018. WUDAPT: An Urban Weather, Climate, and Environmental Modeling
Infrastructure for the Anthropocene. Bull. Amer. Meteor. Soc. 99, 1907–1924.
Masson V., W. Heldens, E. Bocher, M. Bonhomme, B. Bucher, C. Burmeister, C. de Munck, T. Esch,
J. Hidalgo, F. Kanani-Sühring, Y-T Kwok, A. Lemonsu, J.-P. Lévy, B. Maronga, D. Pavlik,
G. Petit, L. See, R. Schoetter, N. Tornay, A. Votsis, J. Zeidler, 2020 : City-descriptive input data for
urban climate models : Model requirements, data sources and challenges, Urban Climate, Elsevier,
Vol 31, https://doi.org/10.1016/j.uclim.2019.100536
Bucher B., Van Damme M.-D., 2018, URCLIM Deliverable D2.1-1, URCLIM Infolab, Paris

73
Authoritative Geospatial Data and its Quality
Joep Crompvoets1, Stijn Wouters
1, Maxim Chantillon
1, Dominik Kopczewski
2, Mick Cory
2,
Carol Agius2, Stephan Grimmelikhuijsen
3
1 KU Leuven Public Governance Institute, Leuven, Belgium
2 EuroGeographics, Brussels, Belgium
3 Utrecht University School of Governance, Utrecht, The Netherlands
1. INTRODUCTION
Societies are increasingly digitalising more and more aspects of daily life. A basic building block for
digitalisation is data. This data is being integrated within and across public administrations, but also
across borders and across the public, private and not-for-profit sectors. High quality data is a necessary
criterion to ensure the quality of both public and private digital services and to drive innovation
(Debruyne et al., 2017; European Commission, 2016).
The recognition and organisation of data as authoritative should be vital not only for ensuring the data
quality, but also to foster trust between public sector organisations, between different sectors and
across borders (European Commission, 2017). Especially in the context of geospatial data, the
exchange and integration of authoritative data has advanced significantly. Important challenges
however still need to be addressed (Cravens & Ardoin, 2016).
Authoritative is a term that one often hears when someone is describing geospatial data. Many public
mapping, cadastral and land registration agencies promote their geospatial data as authoritative or as
created from authoritative sources. Although authoritative data sounds impressive, it is important to
understand what it really means.
In a geospatial context, land surveyors were probably the first to use the term authoritative geospatial
data and they have been producing authoritative data for some time. Surveyors define authoritative as
data that contains a surveyor’s professional stamp and that the data can be used for engineering design,
determination of property boundaries and permit applications. In essence, the term carries a
certification of positional accuracy (Plunkett, 2014).
For decades, if not centuries, national mapping, land registries and cadastral authorities (NMCAs) have
been recognised as the official source of geographic information. They were established by states to
collect and distribute geospatial (mapping) and map-related data, often for some defined public
purpose, such as defence, taxation or protection of property rights. The data provided by these public
authorities were habitually presented as authoritative data.
Today, NMCAs are not the only ones providing geospatial data, information and related services. A
growing number of different producers and providers of geospatial data, information and services are
entering the market, serving different purposes and needs vis-à-vis the users, who are both private and
publicly oriented. These new data, information and service producers/providers come from the public,
private and community sectors. With this development in mind, there is a need for setting a clear
understanding of what is meant by authoritative. When exploring the meaning of the term
authoritative geospatial data, issues related to legislation, trust, and (quality) certification emerge. The
term might be applied only to data that is legislated or regulated. If it is necessary to differentiate data
supplied by government agencies from other sources of data, then it is suggested that the discussion
should be about trusted data, and what gives rise to such trust. The validation of this type of data might
be part of the certification of authoritativeness. For most practitioners, the term usually somehow refers
to data that was produced or is approved by some authority.

74
Besides the meaning of the term, there is also no proper understanding what is the added value of
authoritative geospatial data in Europe. It is also not fully clear how the term is applied and interpreted
across Europe. Under different national conditions ‘authoritativeness’ can be defined in various ways.
Moreover, the link with spatial data quality is also not fully understood. This paper aims to fill these
gaps. Therefore, the main objective of this paper is to provide a better and more comprehensive
understanding of the definition, nature, governance and future of authoritative data and the links to
spatial data quality in Europe.
An online survey was undertaken in the summer of 2018 to get an overview of the definitions,
characteristics, governance and future of authoritative data across Europe. A questionnaire was sent to
all members of EuroGeographics, who are the national mapping, land registry and cadastral authorities
(NMCAs) of Europe. The first results were presented at the General Assembly of EuroGeographics in
Prague (October 2018). During the General Assembly, focus group meetings in the form of roundtable
discussions were organised that built on the findings of the survey and delved into the definitions,
importance and opportunities of authoritative data. This paper presents the results of the online survey
as well as the focus groups meetings.
After this introduction, the followed methodologies of the online survey and focus group meetings are
described in Section 2. In Section 3, the results of the online survey and focus group meetings are
presented. Finally section 4 provides the main conclusions.
2. METHODOLOGY
A two-step methodology was applied:
1. An online survey with the members of EuroGeographics was undertaken to get an overview of
the definitions, characteristics, goverance and future of authoritative geospatial data across
Europe.
2. Focus groups meetings in the shape of roundtable discussions with the members of
EuroGeographics were organised that built on the findings of the survey and delved into more
detail regarding the definitions, importance and future of authoritative data.
This two-step methodology allowed to have a more comprehensive and detailed view on the topic of
authoritative data across Europe.
2.1 Survey
As this research aims to create an overview of the different positions taken by the network members of
EuroGeographics, it was decided to conduct an online survey during the 2018 summer. Questions
were created on the basis of the insights provided in the academic literature, as well as the specific
context in which EuroGeographics and its members find themselves. All members are known to have
a strong knowledge concerning geospatial data and relevant policy making. These competences were
taken into account when approaching the concept of “authoritative data”. The survey therefore
included both closed and open questions serving a double goal. On one hand, it allowed the
researchers to collect data based on existing views presented in the academic literature, whereas the
open questions gave the possibility to gather more specific information on the positions taken by the
respondents and the organisations they represent.
Besides some introductory questions, such as the name of the respondent, the name of the organisation
and the country, the following 9 main questions were asked:
1) What is the definition that your organisation applies with regards to authoritative geospatial
data (sets)?
2) What is your opinion about the tentative definition of authoritative geospatial data (sets)
presented at the beginning of the survey?

75
3) The notion of authoritative can relate to different objects (e.g. a specific category of data, a
specific data point, an entire data set) and subjects (e.g. an organisation). In your country, does
authoritative point to one of the following situations?
4) What are the conditions which define geospatial data (sets) as authoritative?
5) What geospatial data (sets) should always be/remain authoritative?
6) Are there quality management programs within your organisation that manage the
authoritative geospatial data (sets)?
7) Which organisation(s) is/are responsible for the validation of authoritative geospatial data
(sets)?
8) Is your organisation restricted by any of the following issues related to practical management
of authoritative geospatial data (sets) in your country?
9) How would your organisation like to see authoritative geospatial data (sets) being developed
in the next five year?
The questionnaire was sent to the 63 Permanent Correspondents (organisations in 46 countries) of the
NMCA members of EuroGeographics.
The data was cleaned and a simple analysis was executed, based on a number of qualitative and
quantitative analysis techniques.
2.2 Focus group meetings
A focus group meeting is a good way to gather together people from diverse backgrounds or
experiences to discuss a specific topic of interest. In our case, we gathered executives of national
mapping, cadastral and land registration agencies in Europe to discuss issues related to authoritative
data including definitions, importance and future developments. A focus group is a small but diverse
group of people whose reactions are studied in guided or open discussions about a specific topic – in
our case a guided discussion about authoritative data – to determine the reactions that can be expected
from a larger population (Marshall & Rossman, 1999). This qualitative research approach
complements with the survey results and provide more detail. Participants were asked about their
perceptions, opinions, beliefs, and attitude towards the topic. Questions were asked in an interactive
group setting where participants were free to talk with other group members. In our case the group
setting was based on a roundtable construction in which each person was given equal right to
participate. The discussion was led by a moderator who was familiar with the topic. During the
discussion, another person either took notes or recorded the vital points he or she was getting from the
group. Beforehand, a set of discussion questions were prepared. These questions were mainly derived
from the survey results that needed further explanation/understanding. The following preparatory
questions formed the basis for the roundtable discussions:
1. What is authoritative data for you?
2. How important is it for you that your data is labelled as ‘authoritative’?
3. Do you think that there is a future for authoritative data? If yes, then what needs to be done to
sustain the usage of authoritative data in the future?
The focus group meetings took place in the afternoon of 8 October 2018 as part of the annual General
Assembly of EuroGeographics. An important event in which the executives of most European national
mapping, cadastral and land registration agencies participate. Before the focus group meetings, the
topic authoritative data was briefly introduced and the preliminary survey results were presented. In
total, 94 people participated in one of the 10 arranged roundtable discussions. All the notes of each
roundtable were collected and analysed afterwards.

76
3. RESULTS
The results are presented in the following two sub-sections: 3.1 Survey and 3.2 Focus group meetings.
3.1 Survey
3.1.1 Response and organisational characteristics
The online survey was launched on 26 June 2018 and remained open until 25 October 2018. A first
reminder was sent in the week of 25 July 2018, and a second one in the week of 9 August 2018. In
addition, an oral reminder was given during the General Assembly of EuroGeographics (8 October
2018) followed by a fourth reminder that was sent 12 October 2018. In parallel, several Members were
individually reminded. Overall, 37 responses from 31 countries were received. In terms of
organisations, the response rate was 37/63 (59%). In terms of countries, the response rate was 31/46
(67%). In comparison with similar online studies, these responses rates are very high.
The countries that responded were: Croatia, Cyprus, Czech Republic, Denmark (2), Estonia, Finland,
France, Georgia, Germany (2), Hungary, Iceland (2), Ireland, Italy, Latvia (3), Lithuania,
Luxembourg, Macedonia (FYROM), Moldova, Netherlands, Poland, Romania, Slovakia, Slovenia,
Spain, Sweden, Switzerland, Turkey, Ukraine, and United Kingdom (3). Between brackets the number
of responding organisations per country can be found in case that two or three organisations per
country responded.
3.1.2 Definitions
Four survey questions referred to the definition of authoritative data and their coverage.
Respondents were asked the following question: ‘What is the definition that your organisation applies
with regards to authoritative geospatial data (sets)? ( 1)’ From the 37 respondents, 21 respondents
were able to give a definition (60%). From the 21 definitions, 13 definitions made reference to
legal/official aspects of authoritative data, 12 definitions made reference to the provision by a public
authority, and 3 definitions referred to reference data. 4 definitions were exactly the same as the
definition presented in the introductory text of the survey. Only 5 respondents mentioned that their
given definitions were officially approved by their organisation.
At the start of the survey, a tentative definition for authoritative data (sets) was presented: “Data provided
by or on behalf of a public body (authority) which has an official mandate to provide it”. This definition was
introduced in the European Location Framework (ELF) project. In this context, the following was
question was asked: ‘What is your opinion about the tentative definition of authoritative geospatial data
(sets) presented at the beginning of the surve ? ( 2)’. From the 35 responses, 30 (strongly) support
the tentative definition (86%).
The next survey question was the following: The notion of authoritative can relate to different objects
(e.g. a specific category of data, a specific data point, an entire data set) and subjects (e.g. an
organisation). ‘In our countr , does authoritative point to one of the following situations? ( 3)’ The
respondents could tick all the relevant options. From the answers, it appears that authoritative data can
relate to a variety of objects and subjects within and across countries. For almost half of the
respondents, it is the data or part of the data in the dataset (44%). For more than half of the
respondents (56%), it relates to the dataset as a whole. For almost 60%, it relates to all data that is
collected and/or managed by the authoritative organisation. The results clearly indicate that
authoritative data cover different objects and subjects and so the coverage is not straightforward.
The fourth question referred to ‘the conditions which define geospatial data (sets) as authoritative
( 4)’. Respondents were in the position to tick all the relevant options. Concerning the conditions

77
which define data as authoritative, almost all respondents indicate input legitimacy as a prominent
factor (i.e. ‘Supplied by a recognised public authority’ (94%) and ‘Derived from a trusted source’
(71%). ‘Having a high quality’ (47%), ‘Being institutionalised’ (44%), and ‘Existence of licensing
agreements’ (38%) are indicated by a significant number of respondents, while all other conditions
appear of less importance.
3.1.3 Characterisation of Authoritative datasets
Two survey questions referred to the characterisation of the key authoritative datasets (being type and
quality). Respondents were asked to answer the following question: ‘What geospatial data (sets)
should alwa s be/remain authoritative? ( 5)’ Respondents were allowed to tick all the relevant
options. Many members agreed on a wide set of necessary authoritative datasets, with ‘Cadastral
parcels’ (94%), ‘Administrative boundaries’ (92%), and ‘Addresses’ (92%) as the most listed datasets.
In addition, it is notable that the percentage for each of the presented datasets was above 50%.
The next question was: ‘Are there qualit management programs within our organisation that
manage the authoritative geospatial data (sets)? ( 6)’. Most respondents answered this question with
‘Yes’ (82%). This strongly indicates that quality is a very important aspect in the management of
authoritative geospatial data. If the answer was ‘Yes’, then the respondents were able to comment on their
response. A number of comments provided by the respondents were the following:
- ‘Data coming from the private sector are automatically verified and randomly tested. Quality
indexes are produced and continuously monitored. Several projects to enhance quality are
ongoing’;
- ‘We run quality checks continuously’;
- ‘Applying validation rules that can be expanded’;
- ‘The Centre of Registers validates the data (vertex points of surveyed land parcels) provided
by surveyors before entering in the cadastral map’;
- ‘Compliance with standards for data updating and validation’;
- ‘Each provider is responsible to manage the quality of their data’;
- ‘Specific requirements are included in law regulations’.
3.1.4 Governance
The next two questions are associated with issues related to the governance of authoritative geospatial
data. The first governance question was the following: ‘Which organisation(s) is/are responsible for
the validation of authoritative geospatial data (sets)? (Q7)’. Most respondents answered that it is the
authority defined in the law or mentioned the name of their own organisation. A few respondents
explicitly referred to the organisation that provides the data (sets). In most federal countries, the
responsibilities are allocated to authorities operating at different levels of administration.
The next governance question was: ‘Is our organisation restricted b an of the following
issues related to practical management of authoritative geospatial data (sets) in your country? (Q8)’.
From the results it was clear that the organisations face a variety of restrictions in the practical
management of authoritative data. 56% of respondents point out ‘National security’, while 47% indicate
‘Privacy’ and ‘Licensing’ as a restriction. Other factors (e.g. IPR (41%), Funding (35%), Access (35%),
Quality (32%) , Authority (18%)) are much less prominent.

78
3.1.5 Future developments
The last survey question dealt with the future developments of authoritative geospatial datasets: ‘How
would your organisation like to see authoritative geospatial data (sets) being developed in the next
five years? (Q9)’ Respondents had to answer this question both from their country as well as the
European perspective. The responses at the country level were diverse, some respondents had no
specific expectations for the developments in the next five years whereas others referred to a number of
potential developments. The most frequently mentioned answers referred to developments related to
data quality, data quality management control, legislation, governance (in terms of strategy
development, structure, coordination, and responsibilities), open data, data accessibility,
standardisation/harmonisation and user-centricity. The responses towards the potential developments
at the European level were less diverse. A similar picture as the one at country level appeared. The
answers of those who have clear expectations were however less diversified. Developments related to
data harmonisation/standardisation, governance (in terms of a coordination body or cross-border
management), and INSPIRE implementation/usage stood out. A few respondents referred to
developments related to data quality, data accessibility, open data, and legislation.
3.2 Focus group meetings
After an introductory session about authoritative data (including the presentation of the preliminary
survey results), a number of focus group meetings in the shape of roundtables were organised in
Prague at the EuroGeographics General Assembly on 8 October 2018. In total, 10 roundtables were set
up whereby 94 participants joined the discussions. Most of the participants were executives of national
mapping, cadastral or land registration agencies across Europe.
The participants came from the following countries: Armenia, Austria, Azerbaijan, Belarus, Belgium,
Bosnia & Herzegovina, Croatia, Cyprus, Czech Republic, Denmark, Estonia, Finland, France,
Georgia, Germany, Greece, Iceland, Ireland, Italy, Kosovo, Latvia, Lithuania, Macedonia (FYROM),
Moldova, Netherlands, Norway, Poland, Romania, Russia, Serbia, Slovakia, Slovenia, Spain, Sweden,
Switzerland, Turkey, Ukraine, and United Kingdom.
Before the discussions started the procedure was explained and the discussion questions were
introduced. The duration of the focus group meetings was around 1.5 hours.
3.2.1 Question 1: What is authoritative data for you?
A similar question was asked in the online survey. From the survey it became clear that authoritative
data needs somehow to be linked to the provision of data by a (public) authority which is legally
binding. In some countries, the term reference data is used as an alternative. The discussions in focus
groups complemented the answers of the survey as the outcomes give a much more comprehensive
and detailed picture about the meaning of authoritative data.
From the discussions, numerous characteristics of authoritative data emerged. These include: legally
binding, accountability, uniqueness, mandatory use, liability, (public) authority provision, trusted,
standardised, continuity, high quality, quality management system, certified, traceability, maintained,
and accessibility. Each of the terms will be briefly introduced and/or explained. It is worth noting that
the terms legally binding, accountability, uniqueness, mandatory use, liability refer somehow to the
legal aspect of authoritative data. Meanwhile high quality, quality management system, certified,
traceability and maintained refer to the quality aspect. In addition, it is good to mention that
authoritative data cover most of these characteristics but does not necessarily have these all at the
time. Moreover, there are strong dependencies among the characteristics. One characteristic could be a
vital condition for another.

79
Legally binding
Many participants strongly stated that authoritative data has to be legally binding. According to
several participants, the term authoritative should only be applied to data that is legislated or regulated.
It has to be officially recognised by a reference in law. If authoritative data is not embedded in
legislation, it can never be labelled as authoritative. Many participants stated that authoritative should
mostly be produced and collected by legal obligation. In addition, several participants mentioned that
the usage of authoritative data should be legally regulated enforcing stakeholders to use it. This legally
binding characteristic is a vital condition for authoritative data that to become trusted by society.
Accountability
Some participants referred to the need that there is somehow an organisation that is legally
accountable for the data production, provision, high quality, and/or maintenance of authoritative data.
Few participants stated that organisations should be accountable but not necessarily be liable.
Uniqueness
The uniqueness refers to the authoritative data as an object as well as the role performed by the
organisation which provides the data. According to the respondents, a dataset that stands out from
other datasets by its characteristics is ‘unique’. Unique is also the provision of authoritative data by
giving one organisation the sole rights to produce and/or provide for a wide use
Mandatory Use
This characteristic refers to the mandate that other (public) authorities (and other stakeholders) are
legally obliged to solely use authoritative data and no other data. As such, authoritative data has been
given a higher usage priority.
Liability
The participants did not fully agree if liability is a full characteristic of authoritative data. Most of the
participants agreed that authoritative organisations should be accountable for the data production,
provision or maintenance. The participants are less clear about the liability issue. Some participants
strongly stated that their organisations are liable for their ‘authoritative’ actions and products with all
the consequences, meanwhile others are not. The implementation of quality management systems
enhances the assurance of liability in many organisations. In this context, few participants underlined
that authoritative data is not about quality but more about liability.
(Public) Authority provision
Authoritative data refers to data provided by or on behalf a (public) authority body. A few participants
added that authoritative data should be also produced, maintained and/or certified by the authority
body. It is hereby however not fully clear if authoritative data also has to come from a public entity or
not. Some participants stated that authoritative data could be also provided (produced, maintained) by
private companies (e.g. by means of outsourcing), however private companies are not in the position
to officially certify data as authoritative data. Moreover, many participants agreed that not every
dataset provided (produced, maintained) by a public entity should be labelled as authoritative. Some
participants asked themselves if the discussion should be about the necessity to differentiate the source
of data provision (production, maintenance) by public agencies from other sources of data.
Trusted
Although trust did not appear in the online survey, it formed an important topic in the roundtable
discussions. Trust is a rather vague topic that is difficult to grasp in its full extent. In order to be
widely used in society and to be applied in essential public tasks, it is important that the authoritative
data can be trusted. Several characteristics that have already been mentioned are a key condition to
reach trust (e.g. characteristics such as legally binding, accountability, off, authority provision,
standardised, high quality, accessibility of authoritative data). It is crucial to provide data that can be
trusted by the users in the long term or to build a lasting organisational trust. However, this is a long
and complicated process that has to address validation and correction of existing data, implementation

80
of standards and quality control instruments in the collection, production, maintenance and updating
processes as well as securing access to the data in future.
Standardised
In order to enhance trust and usage, it is important that authoritative datasets are harmonised and the
production and maintenance processes/procedures/protocols are specified according to international
standards that are defined in relevant regulations.
Continuity
It is important that authoritative data has a long lasting trust. This could be achieved by having
building up a tradition in the production, maintenance and/or provision of highly qualitative data that
are backed up by legislation. Many datasets of NMCAs have been successfully institutionalised during
the years. This recognition can be a guarantee that the NMCAs are able to produce, maintain and
provide authoritative data well.
High Quality
It is assumed to be one of the critical attributes of authoritative data that the quality of authoritative
data is higher than the quality of competing data and that correct data enhances the appetite for more
quality of data. Data quality is a wide topic and includes issues related to geometric accuracy,
precision, updates, and reliability. All these issues have to be taken into account when dealing with the
high quality and reliability of authoritative data. Users need reliable data to sue in the business
processes. They need to have a guarantee that the data used is good or certified for their activities
and/or products. Moreover, users do not want to be liable for their data and prefer to shift the
responsibilities to recognised authorities as they are obliged to keep the data updated and accurate.
Finally, it is important that the quality of authoritative data is defined in the relevant regulations (e.g.
frequency in delivering updated versions).
Quality management system
It is important that the validation of high quality of authoritative data is assured as authorities are often
liable for their data produced, provided or maintained. This could be achieved by establishing a quality
management system specifically developed for securing validation processes of certain authoritative
datasets. These validations must be part of the certification of authoritativeness and should be made as
transparent as possible.
Certified
Authoritativeness is a kind of status. Therefore, this authoritativeness needs to be defined and
validated. When data are produced by third parties, the data needs to be validated on the basis of a set
of standardised criteria. As a recognition that all the criteria are achieved, the dataset can be certified
as authoritative.
Traceability
According to several participants, an important condition for data to be labelled as authoritative is that
the data generation has to be fully traceable with clear documentation of the process of how the data
has been created and/or maintained. It is an important quality specification.
Maintenance
Several participants strongly stated that the data does not only need to be produced by a (public)
authority but also needs to be maintained in order to fully receive the label of authoritative data. It is
therefore crucial to communicate how the authoritative data are maintained and how it is updated in
the future.
Accessible
In order to provide trusted data, participants mentioned that authoritative data also needs to be
accessible to users. When the authoritative data is accessible, the usage of the data could be
significantly increased and become more trusted. Accessibility could be enhanced by providing

81
authoritative data via geoportals or other relevant platforms. Important to underline is the fact that the
participants gave very conflicting responses on whether or not the data needs to be open and/or free.
3.2.2 uestion 2: How important is it for ou that our data is labelled as ‘authoritative’?
One roundtable described “authoritativeness of data” as a label meaning that an organisation is granted
a legal mandate to collect and maintain certain information which serves a concrete purpose or a task
within the public administration. This relates to several responsibilities of public authorities, including:
securing legal rights and ownership of lands, proper and actual addressing, zoning and planning,
administrative divisions, public infrastructure and other aspects that have to be taken into
consideration in the decision-making processes within the public administration. In other words,
authoritative decisions can be (only) made based on authoritative data.
According to most participants, it is very important that some of their data is labelled as authoritative.
NMCAs might lose part of the ‘market’ if their data is not labelled as authoritative. In general, it can
be assumed that the user will likely give higher credits for authoritative data, compared with other
data; e.g. the use of authoritative data would potentially lead to the avoidance of conflicts by citizens
as they are/feel more (legally) secured. In order to be labelled authoritative data, agreed (quality) rules
and/protocols need to followed and independent entities need to check if these rules and/or protocols
are respected. It is very likely that governments will invest more in updates and other kind of support
related to authoritative data than to data that are not labelled as authoritative. This all means that data
labelled as authoritative will likely be more used by public authorities and other stakeholders and that
their demand will be higher when the data are not labelled authoritative. In this context, investments in
the improved accessibility of data is a must to facilitate the usage of the authoritative data.
3.2.3 Question 3: Do you think that there is a future for authoritative data? If yes, then what needs to
be done to sustain the usage of authoritative data in the future?
The participants strongly stated that there is definitely a future for authoritative data, but only for a
limited number of datasets (at least for addresses, cadastral and administrative boundaries). If NMCAs
would have no future, then they do not have a purpose. Authoritative geospatial data are core business
and a unique selling point of NMCAs. There will likely always be a need for public authorities to
provide and use authoritative data as they are the only ones required to be used in numerous key public
policy and delivery processes. It is likely that authoritative data will become even more important
when more public processes will be more automated in which there will be less opportunity to
intervene in the processes. This means that data in these automated processed will strongly depend on
standardised, high quality and legally binding datasets – so authoritative data.
The participants also indicated that there might be a need to distinguish two types of authoritative data;
a core set of datasets that always have to remain authoritative (e.g. for military or national security
reasons) vs. a set of associated datasets. This set of core datasets can only be provided by public
institutions. To a certain extent, topographic data can be collected by companies or citizens, however
the authoritativeness of topographic data can be important when associated with (administrative)
boundaries.
Some of the key responsibilities of modern welfare states include military, social welfare, justice, or
spatial planning tasks. These tasks strongly demand authoritative data and moreover, citizens assume
that these public tasks are simply executed by default, but they will however not be executed
(correctly) if there is no authoritative data.
Authoritative data have a cost for data acquisition, collection, storage, maintenance and distribution,
and cannot simply compete with data provided by private companies. A question that does arise is the
conflict that arises when public authorities are required to sell their data to third parties. The

82
participants underlined that there is no such conflict as it is just a discussion of funding policy. In this
context, it is also important to underline that non-public authorities are able to provide authoritative
data, see PSMA in Australia41. It is as such not the sole tasks of public authorities.
In response to the second part of the question, participants gave a set of recommendations to sustain
the usage of authoritative data in the future. The first recommendations refer to the legally oriented
recommendations:
- Authoritative data needs to be registered in laws and regulations in order to ensure that this
data is available into the future and is not manipulated. If someone would like to change it
then they need to legally challenge and/or question it.
- Ensure the legally binding aspect of authoritative data. A citizen can decide if he/she uses data
from the state, or another source, but if a judge needs to make a verdict he will always refer to
authoritative data, because the law states it.
- Validate crowdsourced data by an expert in order to be certified as an authoritative source.
Several recommendations also refer to trust as an important future element.
- Open authoritative data in order to enhance public transparency and allow users to give
feedback;
- Focus on the public values of authoritative data serving the general public interest;
- Do not focus only on the possible profits;
- Be persistent in order to guarantee that the data will be kept available and provides continuity.
It is also strongly recommended to make the existing authoritative data to be used as widely as
possible to ensure it meets future needs. This could be achieved by opening the data and by improving
its accessibility, for example via popular platforms and/or one-stop shops.
Other given data quality-oriented recommendations were:
- Invest in the high quality of authoritative data (in terms of accuracy, frequent updates);
- Have a strong data quality management control system in place in order to ensure the data
integrity.
3. Conclusion
The main objective of this paper was to provide a better and more comprehensive understanding of the
definition, nature, governance and future of authoritative data and the links to spatial data quality in
Europe.
To better understand authoritative data, this study applied a two-step methodology, making use of an
online survey, and focus group meetings based on roundtable discussions, both with the members of
EuroGeographics. Both steps were followed by a triangulation with the academic literature
surrounding the subject. The focus group meetings confirmed the main conclusions of the surveys and
provided complementary information about authoritative data in Europe. The focus groups underlined
that several additional conditions and characteristics of authoritative data were added to the (existing)
organisational conditions for authoritative data mentioned in the survey: Legally binding,
accountability, uniqueness, mandatory use, liability, (public) authority provision, trust, standardisation,
41 Although PSMA Australia Limited is a company, it has to be underlined that it is owned by all the
governments of Australia.

83
continuity, high data quality, adequate quality management system, certification, traceability, and
maintenance.
The results of this paper underline the need for a systematic and harmonised approach towards
authoritative data. The survey revealed that there is a variety of definitions and approaches applied by
the different member organisations of EuroGeographics, as well as different opinions on which data
should be considered as authoritative. Through the focus groups, the results of the survey were
corroborated and several additional elements could be added on the topic of authoritative data.
The research shows that spatial data quality is an important element to be included in a definition for
authoritative data but is not the most prominent one. Based on the findings of this this research, we
have tried to integrate all relevant elements and aspects into one single overarching definition: “Data
likely provided by or on behalf of a public body (authority) which has an official mandate to provide
and sustain it, that is based on a set of known criteria to ensure (inter alia) high data quality, and that is
required to be used or aimed towards extensive use and reuse within the public sector and society as a
whole”. This new proposed definition could be the basis for further discussion on the meaning of
authoritative data.
Other conclusions of this paper are that NMCAs underlined that data that is validated as authoritative
data is considered to be of very high quality. This does, in turn necessitates adequate resources for
ensuring data quality and up-to-dateness. The paper also underlined that the obligation to use
authoritative data depends on the situation at hand. More effort should be put in making authoritative
data available and recognisable by other public organisations as well as private actors. Finally, the
participating NMCAs underlined that there is a need for organisations within the public sector to take
up a central role in the governance of authoritative data.
ACKNOWLEDGEMENTS
The authors of the report would like to express their sincere gratitude to all members of
EuroGeographics who provided input to the survey and/or roundtable discussions.
REFERENCES
Cravens, A. E., & N. M. Ardoin. (2016). Negotiating credibility and legitimacy in the shadow of an
authoritative data source. Ecology and Society, 21(4).
Debruyne, C. et al. (2017) Ireland’s Authoritative Geospatial Linked Data. In: C., d'Amato et al.
(Eds.), The Semantic Web – ISWC 2017 (pp. 66-74). Cham: Springer.
European Commission (2016). EU eGovernment Action Plan 2016-2020 – Accelerating the digital
transformation of government.
European Commission (2017). Annex to the communication from the commission to the European
Parliament, the Council, the European Economic and Social Committee and the Committee of the
Regions European Interoperability framework - Implementation strategy.
Marshall, C. & G. B. Rossman (1999). Designing Qualitative Research. 3rd Ed. London: Sage
Publications, p. 115.
Plunkett, G. (2014). What does the term “Authoritative ata” Reall mean? Environmental Systems
Research Institute Canada.