International Trends in Park Tourism - University of …eagles/documents/International Trends... ·...
44
International Trends in Park Tourism by Paul F. J. Eagles Professor Department of Recreation and Leisure Studies School of Urban and Regional Planning University of Waterloo Waterloo Ontario Canada N2L 3G1 and Chair, Task Force on Tourism and Protected Areas World Commission on Protected Areas World Conservation Union (IUCN) Gland Switzerland Paper prepared for EUROPARC 2001 October 3 to 7, 2001 Hohe Tauern National Park, Matrei, Austria Edition 4: 17 September 2001
Transcript of International Trends in Park Tourism - University of …eagles/documents/International Trends... ·...
International Trends in Park Tourism
by
Paul F. J. Eagles
Professor Department of Recreation and Leisure Studies
School of Urban and Regional Planning University of Waterloo
Waterloo Ontario Canada
N2L 3G1
and
Chair, Task Force on Tourism and Protected Areas World Commission on Protected Areas
World Conservation Union (IUCN) Gland
Switzerland
Paper prepared for EUROPARC 2001
October 3 to 7, 2001
Hohe Tauern National Park, Matrei, Austria
Edition 4: 17 September 2001
Page 1 of 43
International Trends in Park Tourism
Abstract. Nature-based tourism is a large and growing global industry. Much of this tourism is
based in parks and other forms of protected areas. Nature-based tourism depends upon high
levels of environmental quality and suitable levels of consumer service. Many countries have
nature-based tourism as a very important component of their overall tourism industry. This paper
discusses global park tourism trends in seven areas: park establishment, park economics, park
finance and pricing policy, tourism competencies, park tourism market, visitation statistics and
tourism management structures. Examples are presented to illustrate points raised.
Keywords: tourism, nature-based tourism, ecotourism, park finance, planning, policy, trends,
provincial park, national park, economics, park tourism
Page 2 of 43
International Trends in Park Tourism
Introduction
Nature-based tourism is a large and growing global industry (Ceballos-Lascurain, 1998).
Nature-based tourism is travel dependent upon the attributes of the natural environment. This
paper discusses the nature-based tourism market globally, and more specifically the segment of
this tourism occurring in parks and protected areas. The paper provides a global context for the
detailed discussion of park tourism.
Nature-based tourism is the travel and tourism activity dependent upon the destination
attributes of the natural environment. This tourism is dependent upon two fundamental
components: 1) appropriate levels of environment quality and 2) suitable levels of consumer
service.
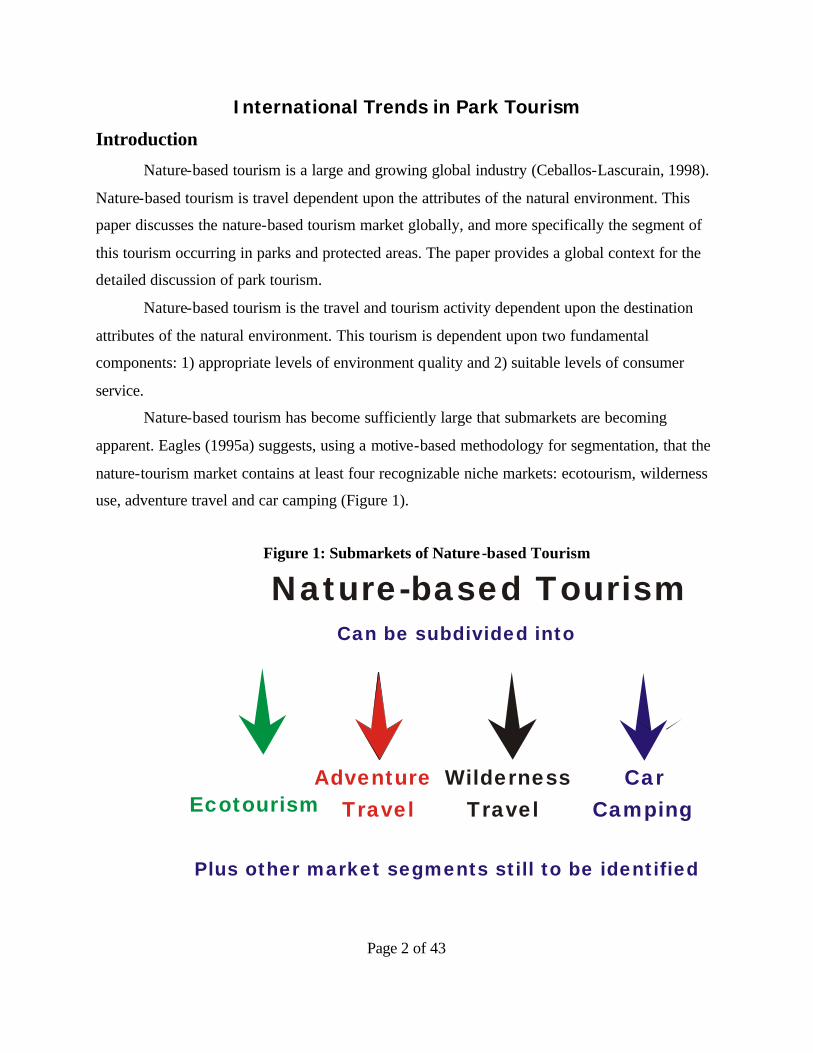
Nature-based tourism has become sufficiently large that submarkets are becoming
apparent. Eagles (1995a) suggests, using a motive-based methodology for segmentation, that the
nature-tourism market contains at least four recognizable niche markets: ecotourism, wilderness
use, adventure travel and car camping (Figure 1).
Figure 1: Submarkets of Nature -based Tourism
Nature-based Tourism
EcotourismAdventure
TravelWilderness
TravelCar
Camping
Can be subdivided into
Plus other market segments still to be identified
Page 3 of 43
Ecotourism involves travel for the discovery of and learning about wild, natural environments.
Wilderness travel involves personal re-creation through primitive travel in natural environments
that are devoid of human disturbance. Adventure travel is personal accomplishment through the
thrills of dominating dangerous environments. Car camping is safe, family travel in the interface
between the wild and the civilized (Eagles, 1995a). This classification utilizes unique sets of
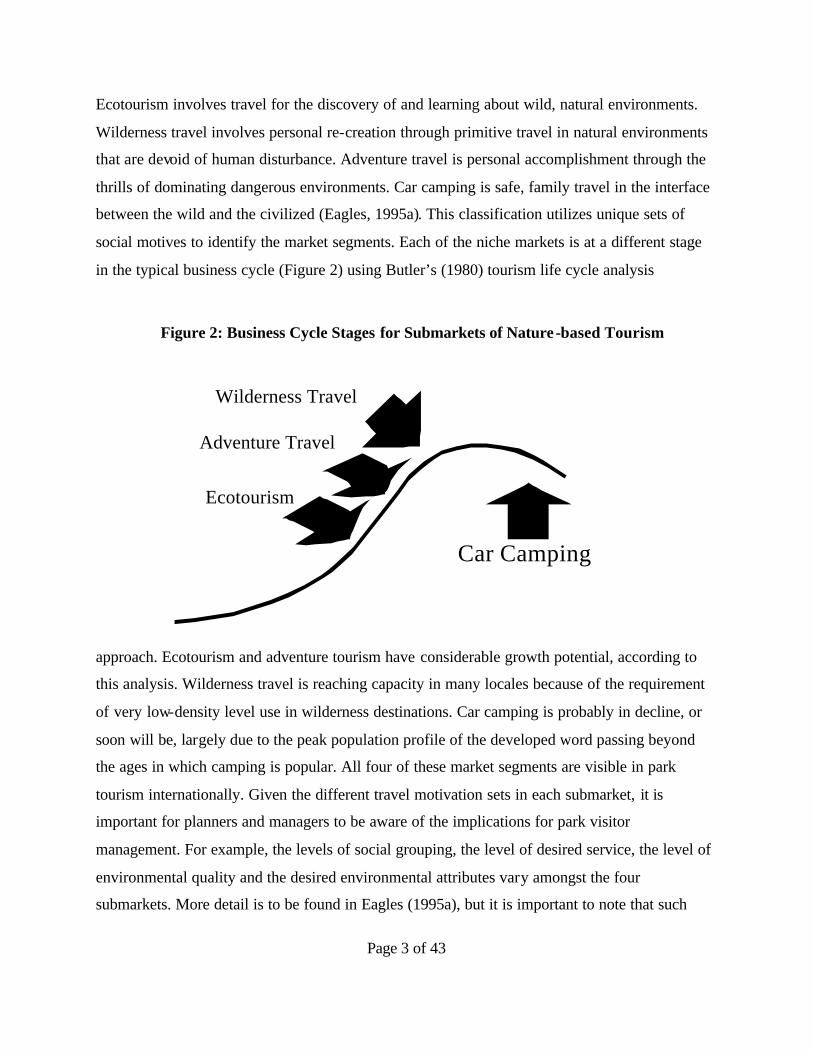
social motives to identify the market segments. Each of the niche markets is at a different stage
in the typical business cycle (Figure 2) using Butler’s (1980) tourism life cycle analysis
approach. Ecotourism and adventure tourism have considerable growth potential, according to
this analysis. Wilderness travel is reaching capacity in many locales because of the requirement
of very low-density level use in wilderness destinations. Car camping is probably in decline, or
soon will be, largely due to the peak population profile of the developed word passing beyond
the ages in which camping is popular. All four of these market segments are visible in park
tourism internationally. Given the different travel motivation sets in each submarket, it is
important for planners and managers to be aware of the implications for park visitor
management. For example, the levels of social grouping, the level of desired service, the level of
environmental quality and the desired environmental attributes vary amongst the four
submarkets. More detail is to be found in Eagles (1995a), but it is important to note that such
Figure 2: Business Cycle Stages for Submarkets of Nature-based Tourism
Wilderness Travel
Adventure Travel
Ecotourism
Car Camping
Page 4 of 43
differences only become visible with the large and growing size of the nature-based tourism
market.
Nature-based tourism is a large and growing component of international tourism. Several
countries in the world have nature-based tourism as a key component of their most important
export industry, tourism. These countries include Australia, Kenya, Nepal, New Zealand,
Tanzania, Costa Rica, and Botswana; to name a few. Any one country has global competition in
this field and this competition is becoming more sophisticated each year. The economic
importance of the tourism industries in these countries is leading to more thoughtful policy and
institut ional development. It is important to recognize the constructive role that can be played by
positive and consultative policy development in nature-based and park tourism. Three examples
are worthy of note, Australia, Tanzania and New Zealand.
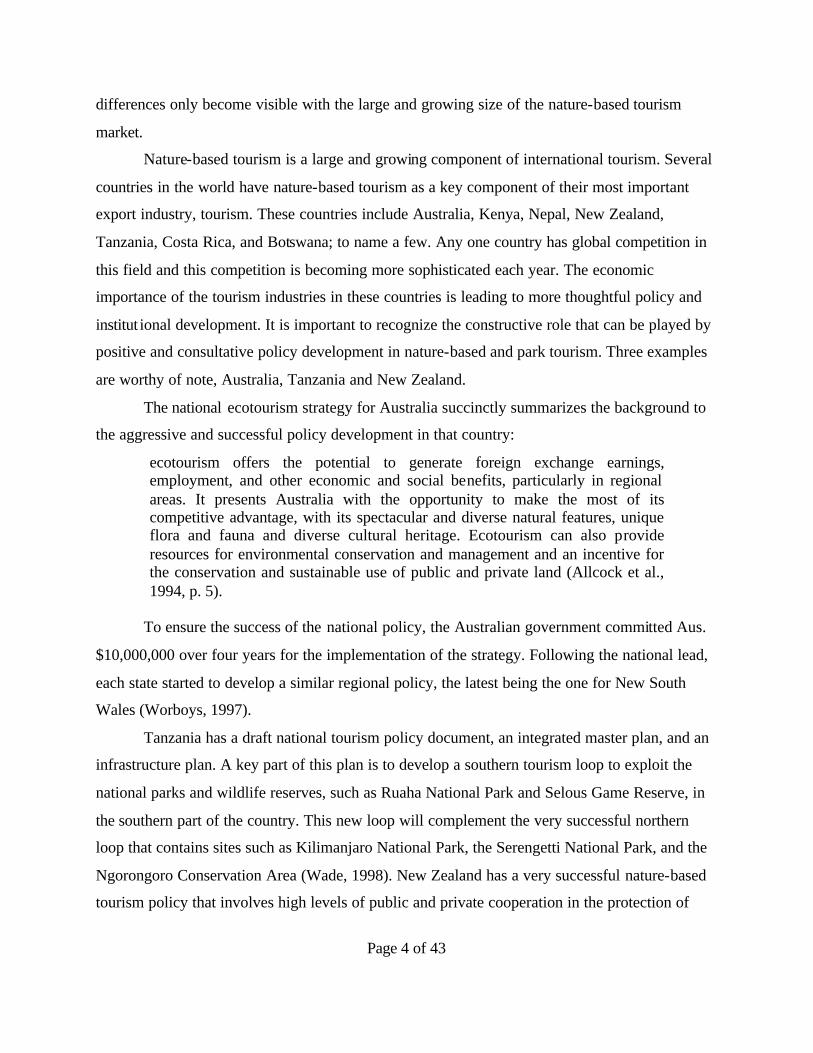
The national ecotourism strategy for Australia succinctly summarizes the background to
the aggressive and successful policy development in that country:
ecotourism offers the potential to generate foreign exchange earnings, employment, and other economic and social benefits, particularly in regional areas. It presents Australia with the opportunity to make the most of its competitive advantage, with its spectacular and diverse natural features, unique flora and fauna and diverse cultural heritage. Ecotourism can also provide resources for environmental conservation and management and an incentive for the conservation and sustainable use of public and private land (Allcock et al., 1994, p. 5).
To ensure the success of the national policy, the Australian government committed Aus.
$10,000,000 over four years for the implementation of the strategy. Following the national lead,
each state started to develop a similar regional policy, the latest being the one for New South
Wales (Worboys, 1997).
Tanzania has a draft national tourism policy document, an integrated master plan, and an
infrastructure plan. A key part of this plan is to develop a southern tourism loop to exploit the
national parks and wildlife reserves, such as Ruaha National Park and Selous Game Reserve, in
the southern part of the country. This new loop will complement the very successful northern
loop that contains sites such as Kilimanjaro National Park, the Serengetti National Park, and the
Ngorongoro Conservation Area (Wade, 1998). New Zealand has a very successful nature-based
tourism policy that involves high levels of public and private cooperation in the protection of
Page 5 of 43
landscapes, the management of protected areas, and the delivery of tourism services. These
countries have government policy as the framework for a whole range of public and private
activities, and this policy has helped foster a suitable environment for the development of nature-
based tourism generally, and park tourism specifically. Government policy plays a very
important role in the development of tourism industries that are financially and ecologically
sustainable.
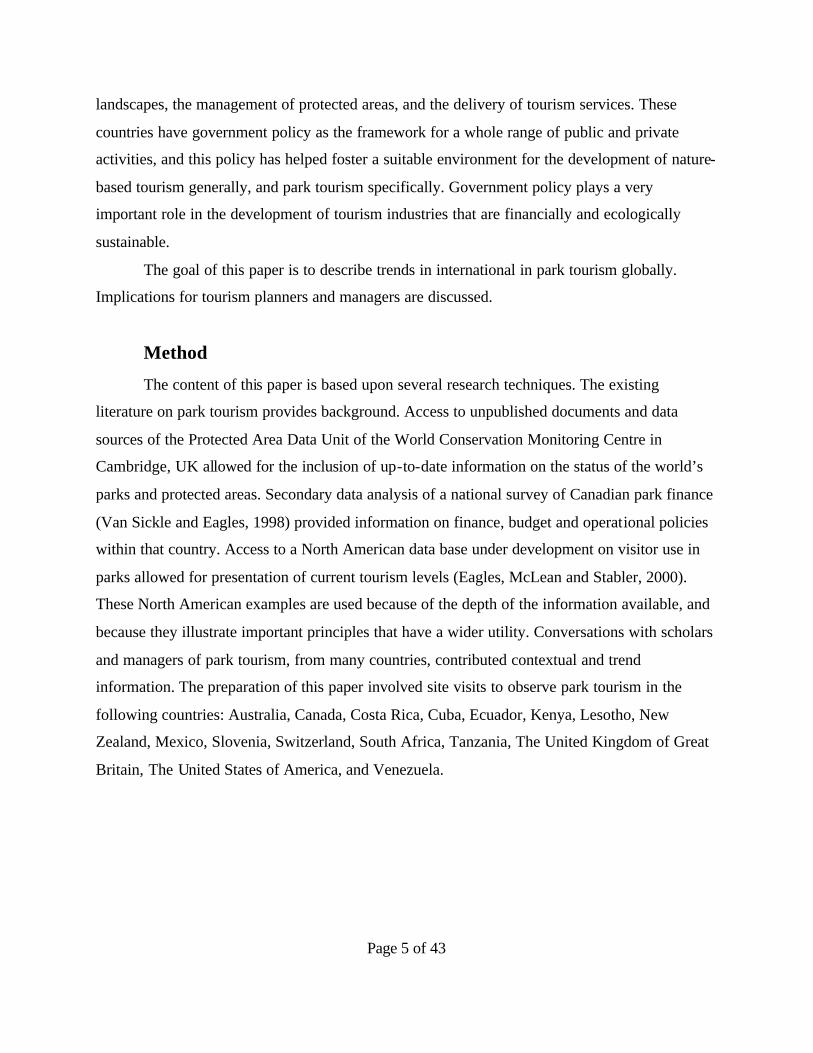
The goal of this paper is to describe trends in international in park tourism globally.
Implications for tourism planners and managers are discussed.
Method
The content of this paper is based upon several research techniques. The existing
literature on park tourism provides background. Access to unpublished documents and data
sources of the Protected Area Data Unit of the World Conservation Monitoring Centre in
Cambridge, UK allowed for the inclusion of up-to-date information on the status of the world’s
parks and protected areas. Secondary data analysis of a national survey of Canadian park finance
(Van Sickle and Eagles, 1998) provided information on finance, budget and operational policies
within that country. Access to a North American data base under development on visitor use in
parks allowed for presentation of current tourism levels (Eagles, McLean and Stabler, 2000).
These North American examples are used because of the depth of the information available, and
because they illustrate important principles that have a wider utility. Conversations with scholars
and managers of park tourism, from many countries, contributed contextual and trend
information. The preparation of this paper involved site visits to observe park tourism in the
following countries: Australia, Canada, Costa Rica, Cuba, Ecuador, Kenya, Lesotho, New
Zealand, Mexico, Slovenia, Switzerland, South Africa, Tanzania, The United Kingdom of Great
Britain, The United States of America, and Venezuela.
Page 6 of 43
Results
Trends in Park Establishment
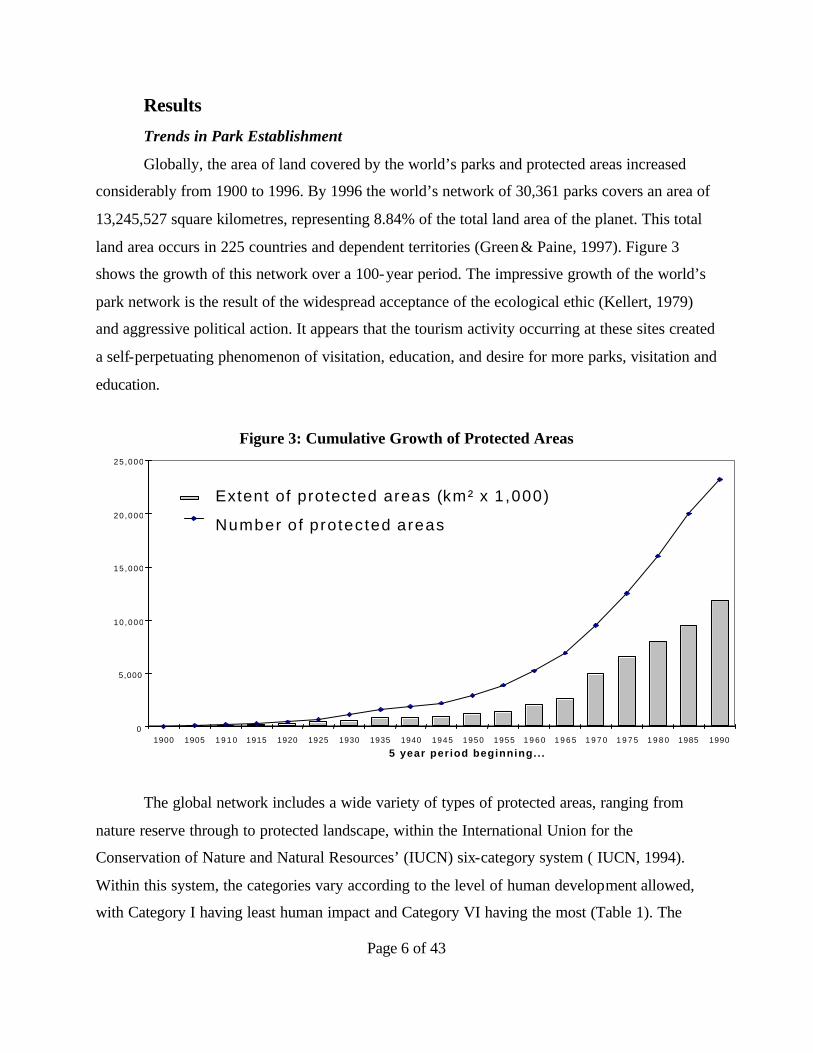
Globally, the area of land covered by the world’s parks and protected areas increased
considerably from 1900 to 1996. By 1996 the world’s network of 30,361 parks covers an area of
13,245,527 square kilometres, representing 8.84% of the total land area of the planet. This total
land area occurs in 225 countries and dependent territories (Green & Paine, 1997). Figure 3
shows the growth of this network over a 100-year period. The impressive growth of the world’s
park network is the result of the widespread acceptance of the ecological ethic (Kellert, 1979)
and aggressive political action. It appears that the tourism activity occurring at these sites created
a self-perpetuating phenomenon of visitation, education, and desire for more parks, visitation and
education.
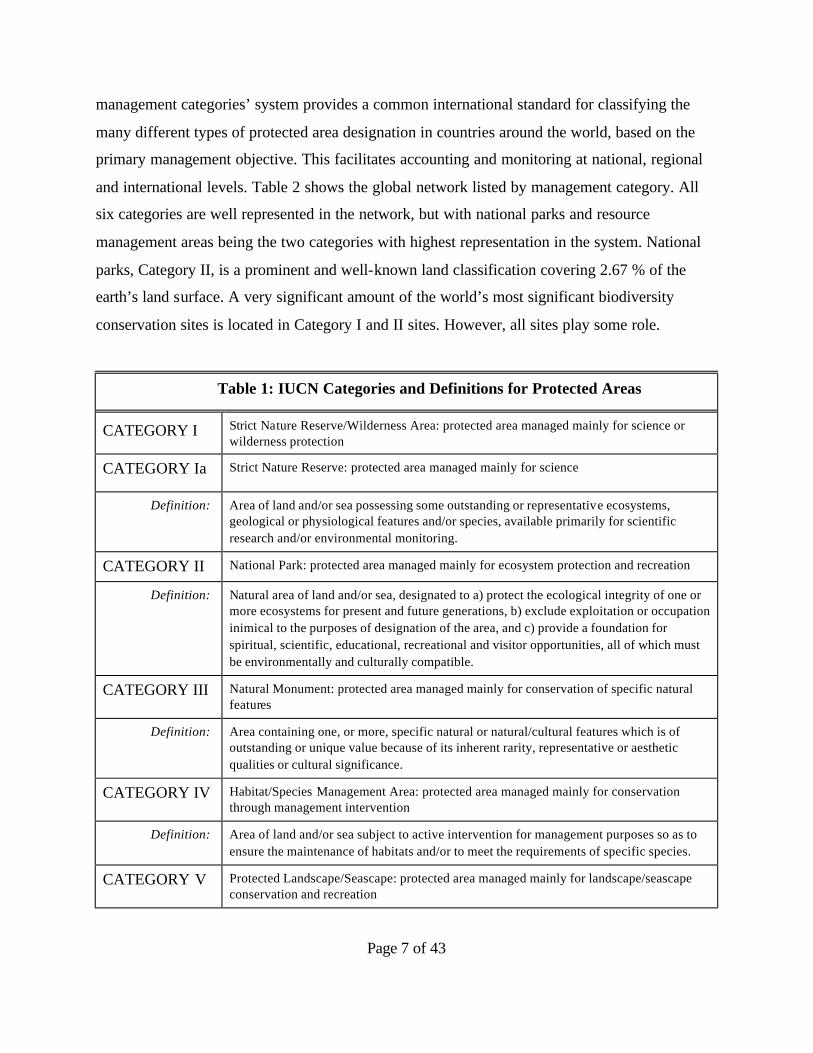
The global network includes a wide variety of types of protected areas, ranging from
nature reserve through to protected landscape, within the International Union for the
Conservation of Nature and Natural Resources’ (IUCN) six-category system ( IUCN, 1994).
Within this system, the categories vary according to the level of human development allowed,
with Category I having least human impact and Category VI having the most (Table 1). The
Figure 3: Cumulative Growth of Protected Areas
0
5,000
10 ,000
15 ,000
20 ,000
25 ,000
1900 1905 1 9 1 0 1915 1920 1925 1930 1935 1940 1945 1950 1955 1 9 6 0 1 9 6 5 1 9 7 0 1 9 7 5 1 9 8 0 1985 1990
5 year period beginning.. .
Extent of protected areas (km² x 1 ,000)
Number of protected areas
Page 7 of 43
management categories’ system provides a common international standard for classifying the
many different types of protected area designation in countries around the world, based on the
primary management objective. This facilitates accounting and monitoring at national, regional
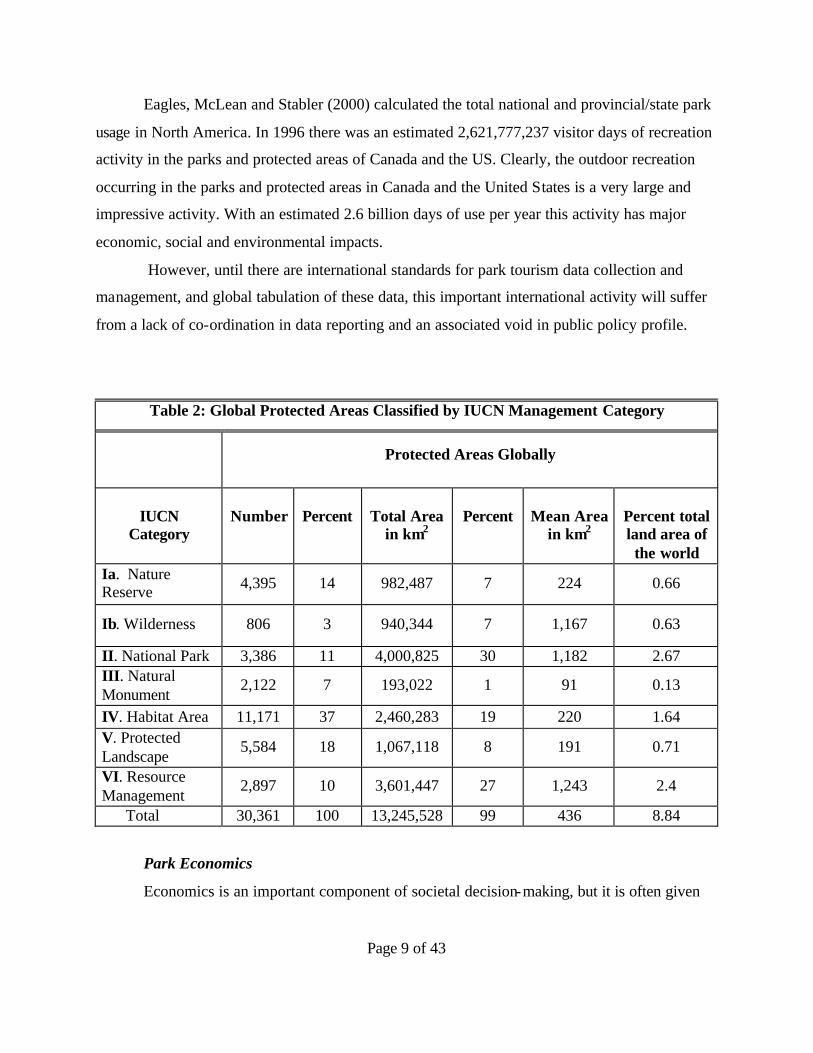
and international levels. Table 2 shows the global network listed by management category. All
six categories are well represented in the network, but with national parks and resource
management areas being the two categories with highest representation in the system. National
parks, Category II, is a prominent and well-known land classification covering 2.67 % of the
earth’s land surface. A very significant amount of the world’s most significant biodiversity
conservation sites is located in Category I and II sites. However, all sites play some role.
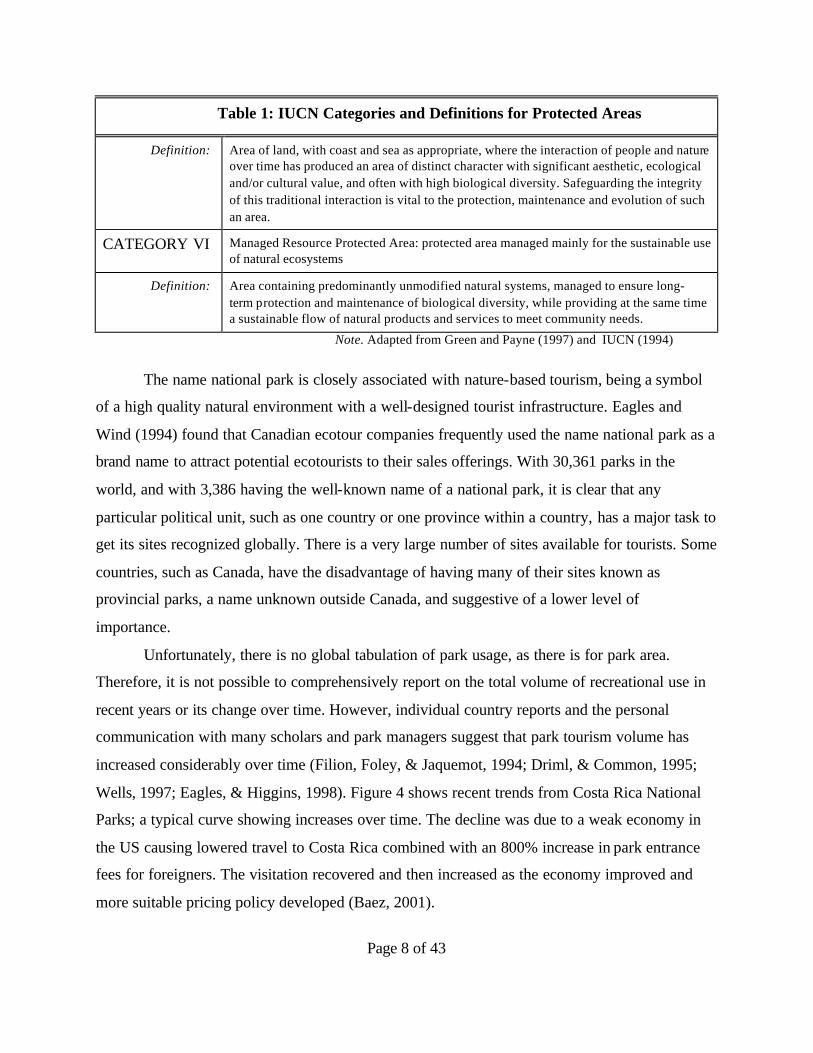
Table 1: IUCN Categories and Definitions for Protected Areas
CATEGORY I Strict Nature Reserve/Wilderness Area: protected area managed mainly for science or wilderness protection
CATEGORY Ia Strict Nature Reserve: protected area managed mainly for science
Definition: Area of land and/or sea possessing some outstanding or representative ecosystems, geological or physiological features and/or species, available primarily for scientific research and/or environmental monitoring.
CATEGORY II National Park: protected area managed mainly for ecosystem protection and recreation
Definition: Natural area of land and/or sea, designated to a) protect the ecological integrity of one or more ecosystems for present and future generations, b) exclude exploitation or occupation inimical to the purposes of designation of the area, and c) provide a foundation for spiritual, scientific, educational, recreational and visitor opportunities, all of which must be environmentally and culturally compatible.
CATEGORY III Natural Monument: protected area managed mainly for conservation of specific natural features
Definition: Area containing one, or more, specific natural or natural/cultural features which is of outstanding or unique value because of its inherent rarity, representative or aesthetic qualities or cultural significance.
CATEGORY IV Habitat/Species Management Area: protected area managed mainly for conservation through management intervention
Definition: Area of land and/or sea subject to active intervention for management purposes so as to ensure the maintenance of habitats and/or to meet the requirements of specific species.
CATEGORY V Protected Landscape/Seascape: protected area managed mainly for landscape/seascape conservation and recreation
Page 8 of 43
Table 1: IUCN Categories and Definitions for Protected Areas
Definition: Area of land, with coast and sea as appropriate, where the interaction of people and nature over time has produced an area of distinct character with significant aesthetic, ecological and/or cultural value, and often with high biological diversity. Safeguarding the integrity of this traditional interaction is vital to the protection, maintenance and evolution of such an area.
CATEGORY VI Managed Resource Protected Area: protected area managed mainly for the sustainable use of natural ecosystems
Definition: Area containing predominantly unmodified natural systems, managed to ensure long- term protection and maintenance of biological diversity, while providing at the same time a sustainable flow of natural products and services to meet community needs.
Note. Adapted from Green and Payne (1997) and IUCN (1994)
The name national park is closely associated with nature-based tourism, being a symbol
of a high quality natural environment with a well-designed tourist infrastructure. Eagles and
Wind (1994) found that Canadian ecotour companies frequently used the name national park as a
brand name to attract potential ecotourists to their sales offerings. With 30,361 parks in the
world, and with 3,386 having the well-known name of a national park, it is clear that any
particular political unit, such as one country or one province within a country, has a major task to
get its sites recognized globally. There is a very large number of sites available for tourists. Some
countries, such as Canada, have the disadvantage of having many of their sites known as
provincial parks, a name unknown outside Canada, and suggestive of a lower level of
importance.
Unfortunately, there is no global tabulation of park usage, as there is for park area.
Therefore, it is not possible to comprehensively report on the total volume of recreational use in
recent years or its change over time. However, individual country reports and the personal
communication with many scholars and park managers suggest that park tourism volume has
increased considerably over time (Filion, Foley, & Jaquemot, 1994; Driml, & Common, 1995;
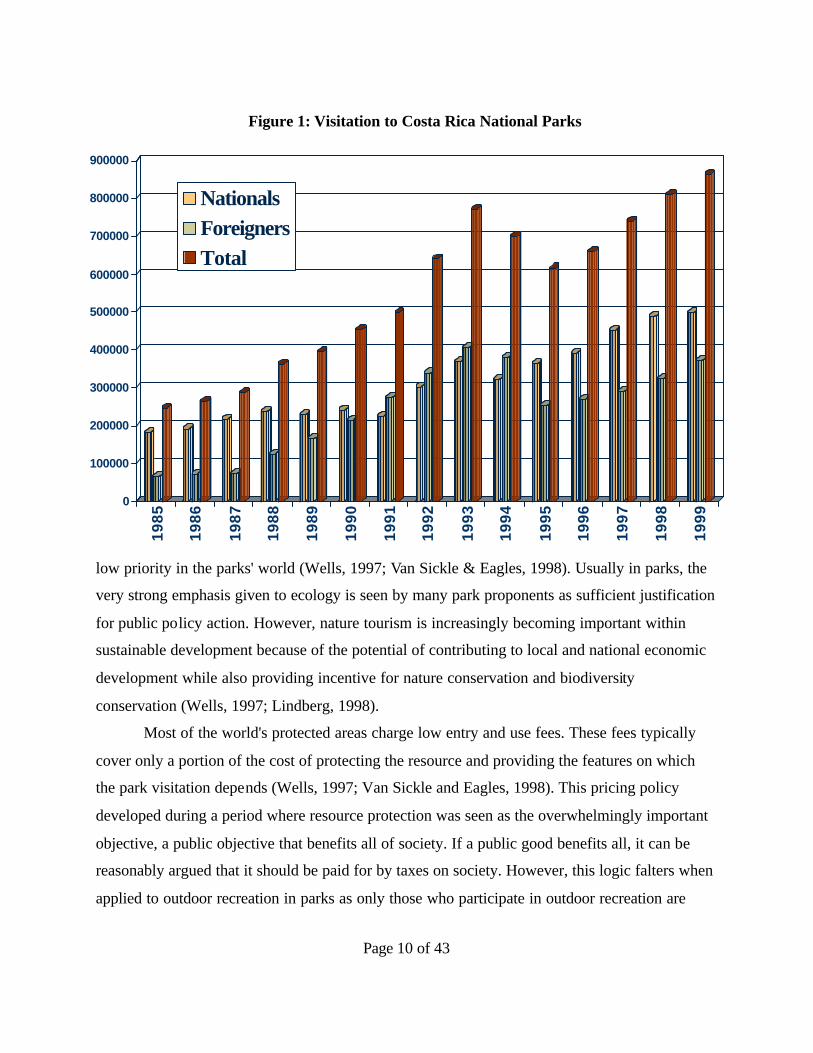
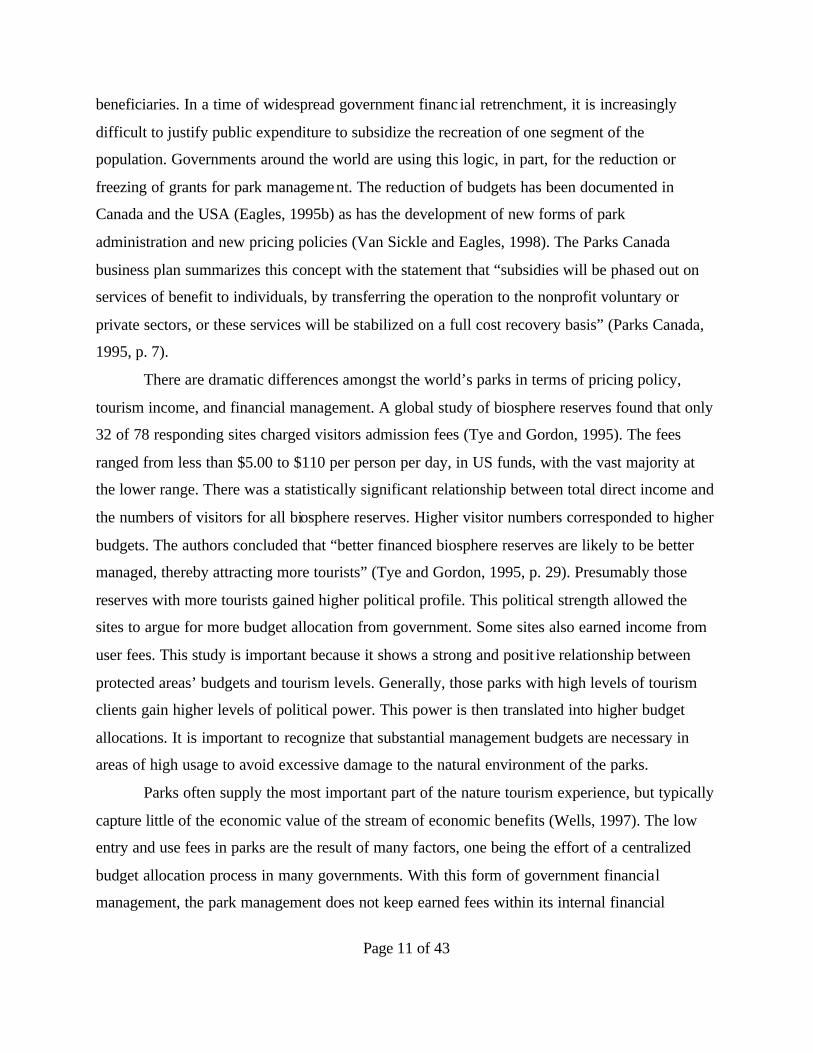
Wells, 1997; Eagles, & Higgins, 1998). Figure 4 shows recent trends from Costa Rica National
Parks; a typical curve showing increases over time. The decline was due to a weak economy in
the US causing lowered travel to Costa Rica combined with an 800% increase in park entrance
fees for foreigners. The visitation recovered and then increased as the economy improved and
more suitable pricing policy developed (Baez, 2001).
Page 9 of 43
Eagles, McLean and Stabler (2000) calculated the total national and provincial/state park
usage in North America. In 1996 there was an estimated 2,621,777,237 visitor days of recreation
activity in the parks and protected areas of Canada and the US. Clearly, the outdoor recreation
occurring in the parks and protected areas in Canada and the United States is a very large and
impressive activity. With an estimated 2.6 billion days of use per year this activity has major
economic, social and environmental impacts.
However, until there are international standards for park tourism data collection and
management, and global tabulation of these data, this important international activity will suffer
from a lack of co-ordination in data reporting and an associated void in public policy profile.
Table 2: Global Protected Areas Classified by IUCN Management Category
Protected Areas Globally
IUCN
Category
Number
Percent
Total Area
in km2
Percent
Mean Area
in km2
Percent total land area of the world
Ia. Nature Reserve 4,395 14 982,487 7 224 0.66
Ib. Wilderness 806 3 940,344 7 1,167 0.63
II. National Park 3,386 11 4,000,825 30 1,182 2.67 III. Natural Monument
2,122 7 193,022 1 91 0.13
IV. Habitat Area 11,171 37 2,460,283 19 220 1.64 V. Protected Landscape
5,584 18 1,067,118 8 191 0.71
VI. Resource Management
2,897 10 3,601,447 27 1,243 2.4
Total 30,361 100 13,245,528 99 436 8.84
Park Economics
Economics is an important component of societal decision-making, but it is often given
Page 10 of 43
low priority in the parks' world (Wells, 1997; Van Sickle & Eagles, 1998). Usually in parks, the
very strong emphasis given to ecology is seen by many park proponents as sufficient justification
for public policy action. However, nature tourism is increasingly becoming important within
sustainable development because of the potential of contributing to local and national economic
development while also providing incentive for nature conservation and biodiversity
conservation (Wells, 1997; Lindberg, 1998).
Most of the world's protected areas charge low entry and use fees. These fees typically
cover only a portion of the cost of protecting the resource and providing the features on which
the park visitation depends (Wells, 1997; Van Sickle and Eagles, 1998). This pricing policy
developed during a period where resource protection was seen as the overwhelmingly important
objective, a public objective that benefits all of society. If a public good benefits all, it can be
reasonably argued that it should be paid for by taxes on society. However, this logic falters when
applied to outdoor recreation in parks as only those who participate in outdoor recreation are
0
100000
200000
300000
400000
500000
600000
700000
800000
90000019
85
1986
1987
1988
1989
1990
1991
1992
1993
1994
1995
1996
1997
1998
1999
NationalsForeignersTotal
Figure 1: Visitation to Costa Rica National Parks
Page 11 of 43
beneficiaries. In a time of widespread government financ ial retrenchment, it is increasingly
difficult to justify public expenditure to subsidize the recreation of one segment of the
population. Governments around the world are using this logic, in part, for the reduction or
freezing of grants for park management. The reduction of budgets has been documented in
Canada and the USA (Eagles, 1995b) as has the development of new forms of park
administration and new pricing policies (Van Sickle and Eagles, 1998). The Parks Canada
business plan summarizes this concept with the statement that “subsidies will be phased out on
services of benefit to individuals, by transferring the operation to the nonprofit voluntary or
private sectors, or these services will be stabilized on a full cost recovery basis” (Parks Canada,
1995, p. 7).
There are dramatic differences amongst the world’s parks in terms of pricing policy,
tourism income, and financial management. A global study of biosphere reserves found that only
32 of 78 responding sites charged visitors admission fees (Tye and Gordon, 1995). The fees
ranged from less than $5.00 to $110 per person per day, in US funds, with the vast majority at
the lower range. There was a statistically significant relationship between total direct income and
the numbers of visitors for all biosphere reserves. Higher visitor numbers corresponded to higher
budgets. The authors concluded that “better financed biosphere reserves are likely to be better
managed, thereby attracting more tourists” (Tye and Gordon, 1995, p. 29). Presumably those
reserves with more tourists gained higher political profile. This political strength allowed the
sites to argue for more budget allocation from government. Some sites also earned income from
user fees. This study is important because it shows a strong and posit ive relationship between
protected areas’ budgets and tourism levels. Generally, those parks with high levels of tourism
clients gain higher levels of political power. This power is then translated into higher budget
allocations. It is important to recognize that substantial management budgets are necessary in
areas of high usage to avoid excessive damage to the natural environment of the parks.
Parks often supply the most important part of the nature tourism experience, but typically
capture little of the economic value of the stream of economic benefits (Wells, 1997). The low
entry and use fees in parks are the result of many factors, one being the effort of a centralized
budget allocation process in many governments. With this form of government financial
management, the park management does not keep earned fees within its internal financial
Page 12 of 43
structure, and therefore sees little benefit in comprehensive fee collection. This also contributes
to a low emphasis on park visitor management. Such issues as return rates, length of stay, visit
satisfaction and service quality all suffer when the financial return from the visitors is not tied
directly to the financial operation of a park. This lack of proper emphasis on visitor management
results in a dwarfed park tourism industry, one not fulfilling its potential.
Many governments see nature-based tourism as an important tool for economic
development. Unfortunately, most have not invested sufficiently in staff training, infrastructure
or park resources that are needed to support nature tourism. This exposes sensitive sites to
tourism-caused degradation (Wells, 1997).
Most national tourism agencies do not keep statistics on market sectors, such as those
associated with nature-based tourism and park-based tourism. Other management units, such as
park agencies seldom fill this information void. As a result, important sectors, such as nature-
based tourism, are not clearly documented for the benefit of policy determination. Looking at the
Canadian situation can show this situation. Clearly nature-based tourism is one of the key
elements of Canadian tourism. Filion et al. (1994) estimated that as much as one quarter of the
tourism expenditures in Canada can be attributed to wildlife tourism, one of the elements of
nature tourism. The Canadian Tourism Commission provides quarterly Canadian tourism figures
to governments, business and the media. These data considerably raise the profile of tourism
within the business sector. However, in Canada there is no system for the collection and
distribution of information on nature-based or park-based tourism. Neither the volumes of park
visitation nor its economic impacts are systematically collected and made available for
government and private consumption. Therefore, the importance of nature tourism in the country
is severely underrated due to lack of adequate information. The parks do not compare well to
other economic generators, such as auto manufacturing or forestry, where the volumes and
economic value of the products are carefully documented and reported within a continuous
stream of information. This Canadian situation is common throughout the world. The economic
impact of park tourism is not well known, not well documented, and where known, not well
communicated. This leads to a severe under-representation of the importance of park tourism
within the fiscal sectors of government and business.
Wells (1997) documented, globally, the economic studies available on nature tourism.
Page 13 of 43
Most of these studies are of individual parks or wildlife reserves. There are few regional or
national studies of the economic impact of the tourism associated with parks and reserves.
Eagles, McLean & Stabler (2000) compiled a national park-use database for Canada and
the United States. They found that in 1996, the last year complete data were available,
2,506,451,728 visitor days of recreation occurred in the federal and state parks and protected
areas of the USA, and an additional 115,325,509 visitor days of recreation occurred in Canadian
federal and provincial protected areas. This massive volume of 2,621,777,237 visitor days,
previously undocumented, reveals a high level of tourism use not generally known and
appreciated. The economic implications of this usage are normally not calculated and therefore
are certainly not well known in the fiscal policy arena of North American society. It is useful to
look at some of the park tourism economic impact studies that have been done, again using
Canada and the USA as case studies.
Ontario has a large and well-used provincial park system consisting of 275 parks. In 1992
the total economic output from park users and by government was Can.$831,200,000 (OMNR
and Econometric Research, 1993). A total of 12,172 person-years of employment resulted from
parks. This benefit was calculated from data on the 109 parks that were staffed to manage visitor
use in 1992. More economic benefit would be found if the other non-staffed, 166 provincial
parks, the six national parks and the hundreds of conservation areas were added to the
calculations.
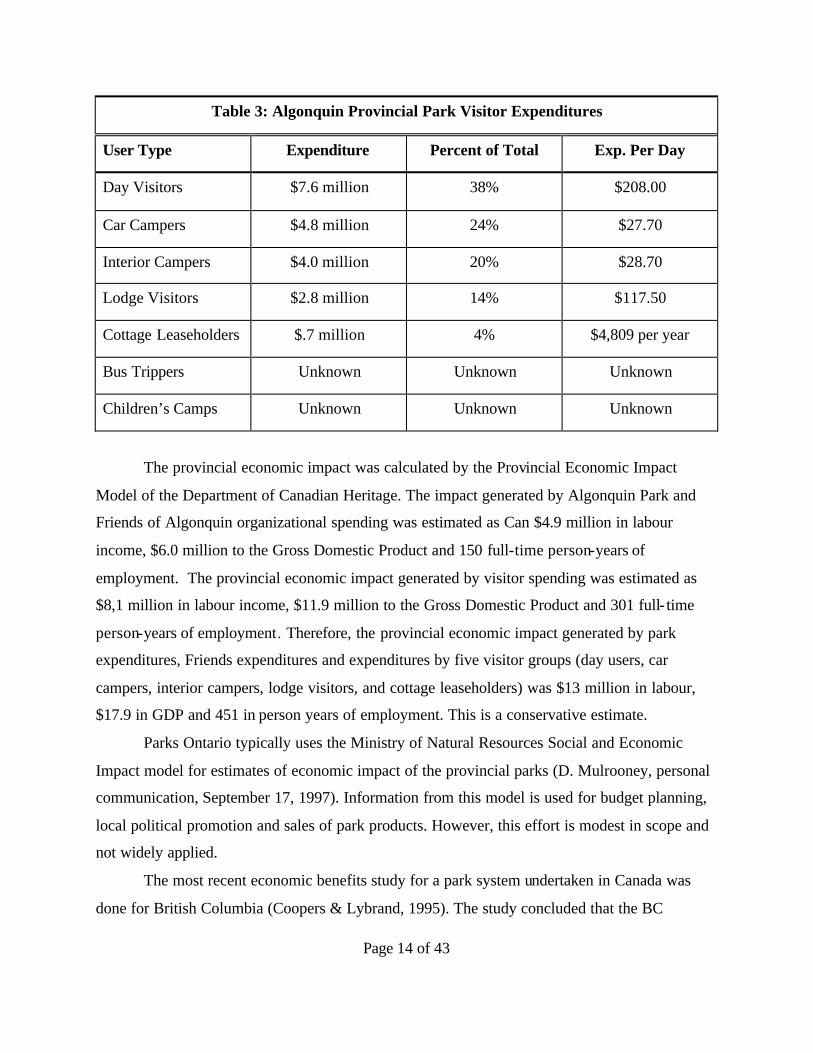
Recent research documented the expenditure level of park users to Ontario’s Algonquin
Provincial Park (Bowman, 2001). This is Ontario’s oldest and most visited Provincial Park.
Table 3 shows that the expenditures per person per day varied dramatically, with day visitors
spending the most, at $208.00 and car campers the least, at $27.7. This research showed that the
park management earned the most income from the groups that spent the least per day, car and
interior campers. Conversely, the management earned the least from the people who spent the
most, day visitors and lodge visitors. Two important user groups, bus tour visitors and children’s
camp users were not studied. This analysis shows the need for a complete re-evaluation of the
pricing and income policy of this important park.
Page 14 of 43
Table 3: Algonquin Provincial Park Visitor Expenditures
User Type Expenditure Percent of Total Exp. Per Day
Day Visitors $7.6 million 38% $208.00
Car Campers $4.8 million 24% $27.70
Interior Campers $4.0 million 20% $28.70
Lodge Visitors $2.8 million 14% $117.50
Cottage Leaseholders $.7 million 4% $4,809 per year
Bus Trippers Unknown Unknown Unknown
Children’s Camps Unknown Unknown Unknown
The provincial economic impact was calculated by the Provincial Economic Impact
Model of the Department of Canadian Heritage. The impact generated by Algonquin Park and
Friends of Algonquin organizational spending was estimated as Can $4.9 million in labour
income, $6.0 million to the Gross Domestic Product and 150 full-time person-years of
employment. The provincial economic impact generated by visitor spending was estimated as
$8,1 million in labour income, $11.9 million to the Gross Domestic Product and 301 full- time
person-years of employment. Therefore, the provincial economic impact generated by park
expenditures, Friends expenditures and expenditures by five visitor groups (day users, car
campers, interior campers, lodge visitors, and cottage leaseholders) was $13 million in labour,
$17.9 in GDP and 451 in person years of employment. This is a conservative estimate.
Parks Ontario typically uses the Ministry of Natural Resources Social and Economic
Impact model for estimates of economic impact of the provincial parks (D. Mulrooney, personal
communication, September 17, 1997). Information from this model is used for budget planning,
local political promotion and sales of park products. However, this effort is modest in scope and
not widely applied.
The most recent economic benefits study for a park system undertaken in Canada was
done for British Columbia (Coopers & Lybrand, 1995). The study concluded that the BC
Page 15 of 43
provincial parks’ system is a major source of economic activity in the province. In 1993 the
parks generated 5,300 jobs directly and 4,000 jobs indirectly. The 5,300 jobs created by parks are
comparable to other industries such as newsprint (4,200), metal mining (3,800) and coal mining
(3,000). In 1993 the BC provincial parks’ system contributed about Can.$430,000,000 to the
provincial gross domestic product. The park visitors reported significant benefits from
recreational activities beyond the market transactions. These nonmarket benefits were estimated
at Can.$670,000,000 beyond the cost of operating the system by the province. Clearly, British
Columbia’s provincial parks are a major economic force in the province. If the national parks’
contribution was added to the BC provincial parks’ contribution, then the benefits would be
considerably enhanced.
The Province of Alberta undertook an economic impact calculation of tourism in its
provincial parks, following on the lead of British Columbia. The results showed an economic
impact that was large and similar to the economic impact of forestry in the province. The report
was never officially released. It is speculated that the significance of the information to decision
making resulted in a successful lobby effort by the forest industry to make sure that the report
was not released, in order to avoid the positive political impact that would occur to parks with
the report’s dissemination. This is a common problem for park managers, interagency conflict
that results in a suppression of data and resources with the goal of now allowing park tourism to
gain the full public policy profile that it would otherwise enjoy. This is especially an issue when
park management is within a broadly-defined resource management agency. This is least of an
issue when parks are a stand alone agency or administration.
Parks Canada conservatively estimates the economic impact of national parks, national
historic sites and parks, and national canals to Canada’s GDP at Can.$1,250,000,000 per year.
Around 30,000 person-years of employment occur due to this spending. Non-resident visitors
contribute 25% of the visitor spending, or $275,000,000 annually (Parks Canada, 1995).
Coopers & Lybrand Consulting (1995) calculated that in 1993 British Columbia provincial parks
produced total benefits of Can.$430,000,000. These benefits included direct benefits, and
consumer surplus. In 1993 the parks had 22,300,000 visitor days of activity. Therefore, each day
of recreation produced an economic benefit of Can.$19. In 1992 the total economic output due to
Ontario parks was Can.$831,200,000 (OMNR and Econometric Research, 1993). This amount
Page 16 of 43
included direct, indirect, and induced impacts of parks. In 1992 Ontario provincial parks had
7,000,000 visitor days of recreation activity. Therefore, each day of recreation produced an
economic benefit of Can.$119. The difference in calculated impact per person between B. C. and
Ontario comes from different approaches to the calculation of impact. However, if one takes this
range of economic benefits and applies it to the visitation of all Canada’s parks, an economic
benefit occurs of between Can.$2.2 and $14 billion. However, whichever figure is used, the
implications of such a large economic impact on public policy making in Canada are immense.
Clearly, a standard and consistent method of calculating economic impact is required, and one
has been developed for the application by all provincial and national park agencies in Canada
(Stanley, Perron and Smeltzer, 1999).
If one assumes that the 1996 figure of 2,621,777,237 entrances to Canadian and
American parks, as calculated by Eagles, McLean and Stabler (2000), represent visitor days of
activity and one accepts an impact range of US $90 (OMNR and Econometric Research, 1993) to
US $141 per day (Carlsen, 1997), the value for park tourism ranges between US $236 billion and
$370 billion in Canada and the USA combined. These figures must be accepted with caution,
given the limitations of the data. However, the estimations do show that park-based tourism is a
very important economic activity in North American society. Even these high estimates
underestimate value, because they do not include option, bequest or existence value estimates.
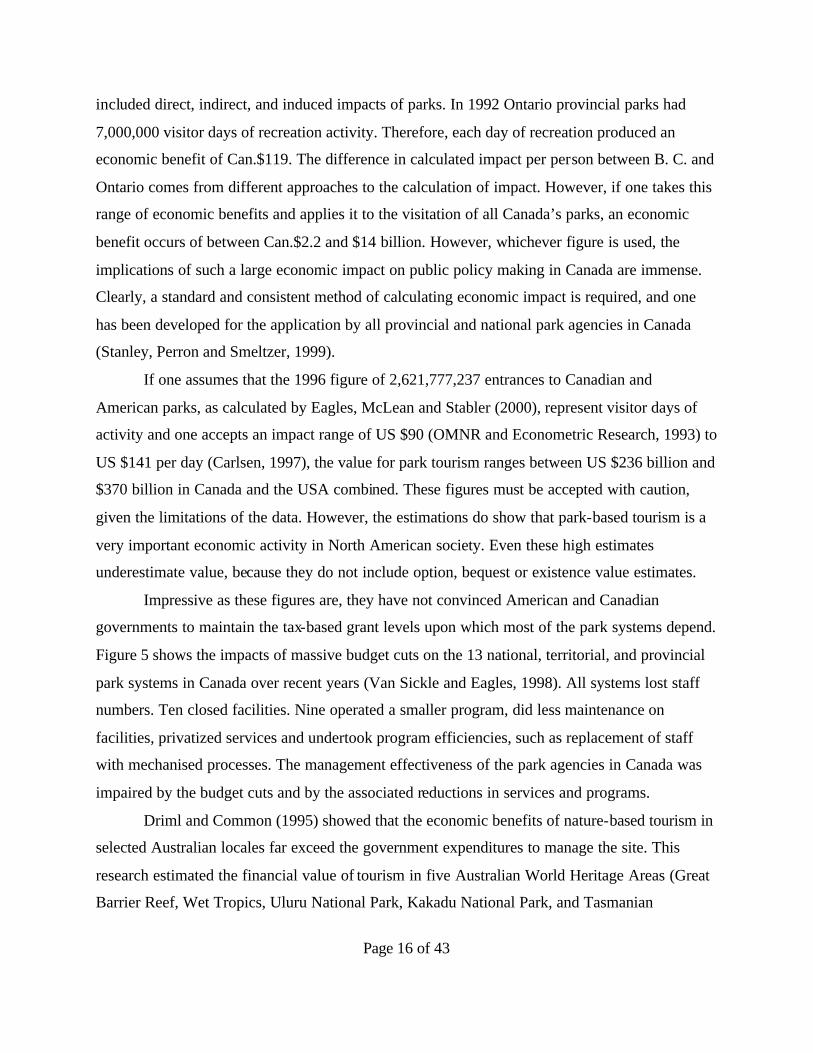
Impressive as these figures are, they have not convinced American and Canadian
governments to maintain the tax-based grant levels upon which most of the park systems depend.
Figure 5 shows the impacts of massive budget cuts on the 13 national, territorial, and provincial
park systems in Canada over recent years (Van Sickle and Eagles, 1998). All systems lost staff
numbers. Ten closed facilities. Nine operated a smaller program, did less maintenance on
facilities, privatized services and undertook program efficiencies, such as replacement of staff
with mechanised processes. The management effectiveness of the park agencies in Canada was
impaired by the budget cuts and by the associated reductions in services and programs.
Driml and Common (1995) showed that the economic benefits of nature-based tourism in
selected Australian locales far exceed the government expenditures to manage the site. This
research estimated the financial value of tourism in five Australian World Heritage Areas (Great
Barrier Reef, Wet Tropics, Uluru National Park, Kakadu National Park, and Tasmanian
Page 17 of 43
Wilderness). The five areas studied experienced tour ism expenditures in 1991/92 of Aus.
$1,372,000,000. The total management budgets were Aus. $48,700,000, and the user fee income
to the management agencies was Aus. $4,160,000. Therefore, the management budgets were
only 3.5% of the tourist expenditure that occurred in the World Heritage Areas. The revenue
raised by government through user fees represented only 8.5% of the government expenditures.
This study shows the very high financial value of tourism in the five World Heritage Areas. It
also reveals the low level of government expenditure for management, and the very low level of
government cost recovery. Driml and Common (1995) question the ability of the existing
management structure to maintain environmental quality in the face of large increases in tourism
use. They point out that tourism research expenditures in Australia are very low compared to
other economic generators such as agriculture and mining, both of which have a smaller national
economic impact than tourism.
Smaller Program
Staff Loss
Less Maintenance
Hiring Freeze
Closed Facilities
Privatized Services
Selling Park
Efficiencies
0
2
4
6
8
10
12
14N
umbe
r of
Age
ncie
s
Figure 5: Impacts of Budget Cuts in Canadian Parks
Page 18 of 43
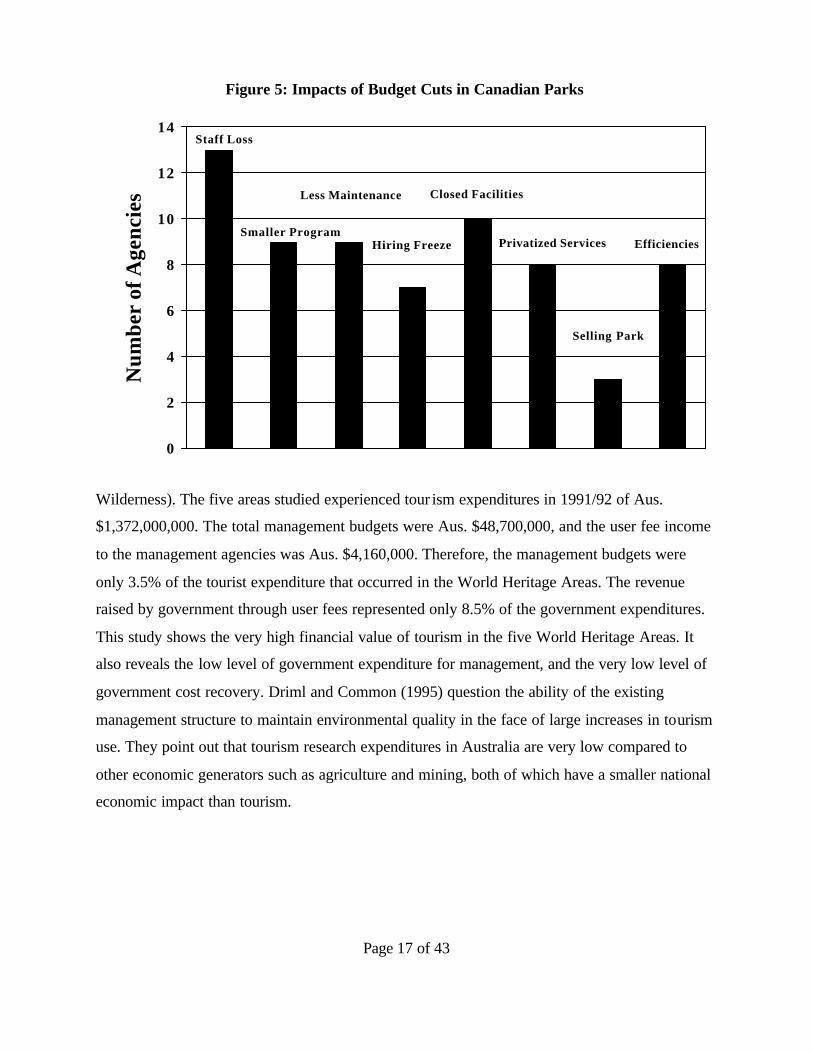
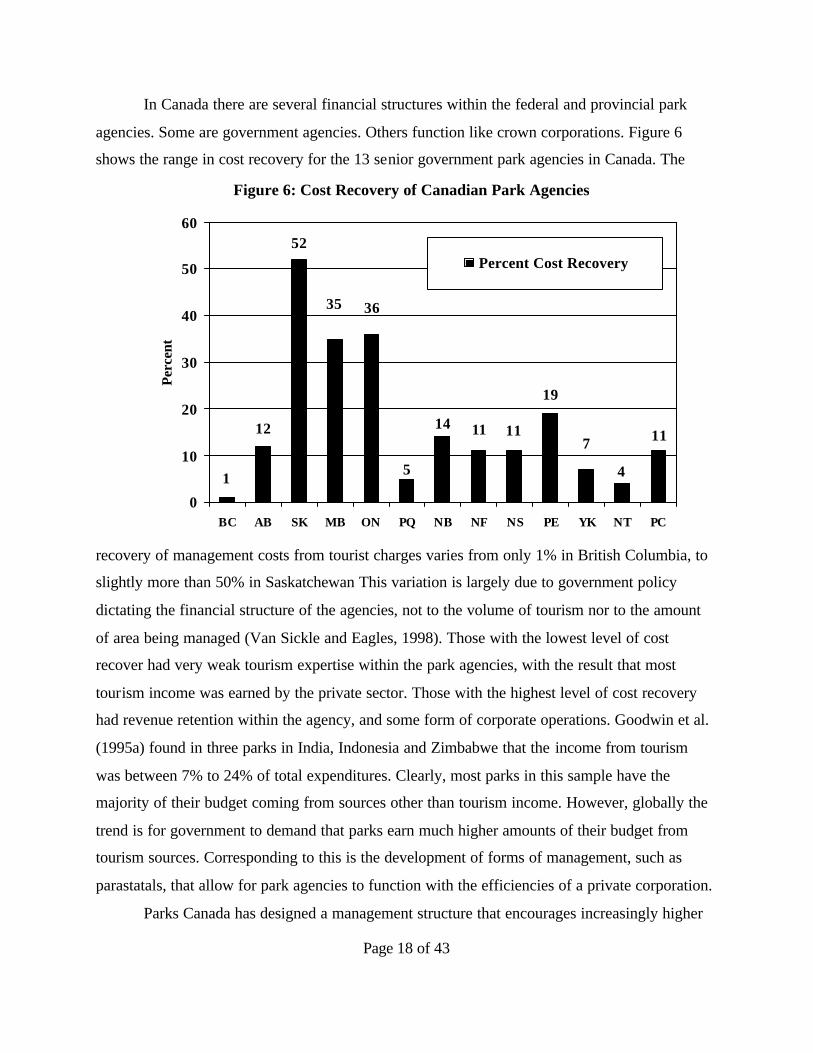
In Canada there are several financial structures within the federal and provincial park
agencies. Some are government agencies. Others function like crown corporations. Figure 6
shows the range in cost recovery for the 13 senior government park agencies in Canada. The
recovery of management costs from tourist charges varies from only 1% in British Columbia, to
slightly more than 50% in Saskatchewan This variation is largely due to government policy
dictating the financial structure of the agencies, not to the volume of tourism nor to the amount
of area being managed (Van Sickle and Eagles, 1998). Those with the lowest level of cost
recover had very weak tourism expertise within the park agencies, with the result that most
tourism income was earned by the private sector. Those with the highest level of cost recovery
had revenue retention within the agency, and some form of corporate operations. Goodwin et al.
(1995a) found in three parks in India, Indonesia and Zimbabwe that the income from tourism
was between 7% to 24% of total expenditures. Clearly, most parks in this sample have the
majority of their budget coming from sources other than tourism income. However, globally the
trend is for government to demand that parks earn much higher amounts of their budget from
tourism sources. Corresponding to this is the development of forms of management, such as
parastatals, that allow for park agencies to function with the efficiencies of a private corporation.
Parks Canada has designed a management structure that encourages increasingly higher
1
12
52
35 36
5
14 11 11
19
7
4
11
0
10
20
30
40
50
60
BC AB SK MB ON PQ NB NF NS PE YK NT PC
Perc
ent
Percent Cost Recovery
Figure 6: Cost Recovery of Canadian Park Agencies
Page 19 of 43
levels of cost recovery from tourists. To provide the management structure necessary to
implement the new business approach, Parks Canada (1995) obtained government permission (a)
to retain and reinvest all revenues, (b) to plan and operate on a multi-year, non- lapsing basis, (c)
to increase non-tax revenues from products and services, (d) to borrow against future revenue,
(e) to link revenues to costs, and (f) to depreciate assets. The new approach moves this
government agency into a management style very similar to that of a corporation, a government-
owned corporation or a parastatal. To implement this plan, new national parks’ legislation was
passed by the Canadian Parliament in 1998.
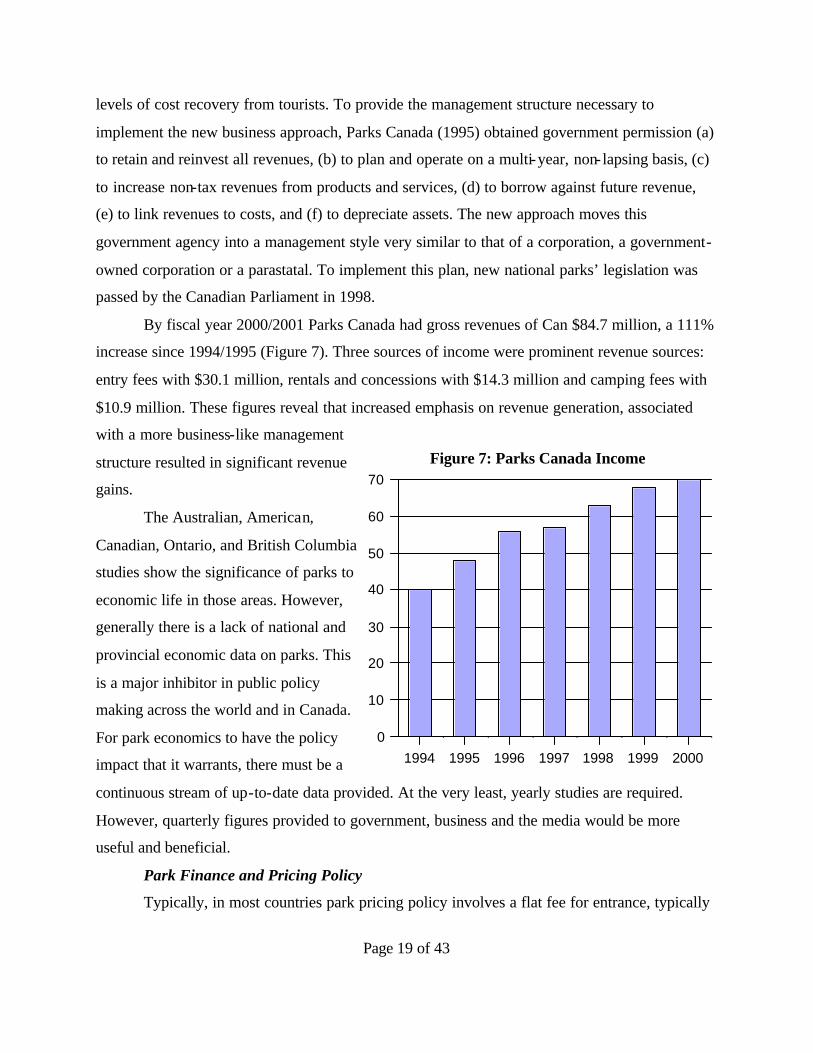
By fiscal year 2000/2001 Parks Canada had gross revenues of Can $84.7 million, a 111%
increase since 1994/1995 (Figure 7). Three sources of income were prominent revenue sources:
entry fees with $30.1 million, rentals and concessions with $14.3 million and camping fees with
$10.9 million. These figures reveal that increased emphasis on revenue generation, associated
with a more business-like management
structure resulted in significant revenue
gains.
The Australian, American,
Canadian, Ontario, and British Columbia
studies show the significance of parks to
economic life in those areas. However,
generally there is a lack of national and
provincial economic data on parks. This
is a major inhibitor in public policy
making across the world and in Canada.
For park economics to have the policy
impact that it warrants, there must be a
continuous stream of up-to-date data provided. At the very least, yearly studies are required.
However, quarterly figures provided to government, business and the media would be more
useful and beneficial.
Park Finance and Pricing Policy
Typically, in most countries park pricing policy involves a flat fee for entrance, typically
1994 1995 1996 1997 1998 1999 20000
10
20
30
40
50
60
70
Figure 7: Parks Canada Income
Page 20 of 43
for a vehicle, or for facility use, such as for one campsite. In many cases no fees are charged,
especially in low-use areas, in popular sites in the low season or in remote areas. The fees are
modest and not subject to market forces. Recreation allocation is typically done by the first-come
first-serve approach. In some parks fees are also charged by the park agency for specialized
recreation services, equipment rental, accommodation, food services and souvenir sales.
Typically the income from tourism is well below the park budget, constituting a small
percentage of the money used for management (Figure 6). Van Sickle and Eagles (1998) found
in Canadian national and provincial park agencies that fees provided an overall average of 17%
of the budgets, a very similar amount to the 18% found by Brademas and Readnor (1987) for the
USA. Saskatchewan is the national leader in Canada, earning 52% of expenditures in 1994-1995.
In contrast the British Columbia provincial parks’ agency, with a very different administrative
structure, recovered only 1% of revenues. Recent figures from state parks in the USA show that
for 1998 33.8% of state park budgets were recovered from various types of tourism fees
(McLean, 1999). These figures from the USA suggest that in this country state parks are
successfully earning higher percentages of their budgets from tourism fees. Globally, there is a
trend of governments requiring parks to recover higher percentages of their budgets from tourist
expenditures.
Often the generation of small amounts of revenue provides little incentive for the central
government to provide adequate levels of budget for management. Laarman and Gregersen
(1994) point out that this situation leads to a vicious cycle of “low fees, inadequate revenue, and
deficient public investment - followed by continued low fees, revenue and investment.”
The typical budget situation for parks is that of a central government body setting an annual
budget, dependent upon the money available for the central treasury as well as various political
and lobby group machinations. Goodwin et al. (1995a) found in studies of parks in India,
Indonesia and Zimbabwe there was no direct relationship between park budgets and park tourism
revenues. In these three countries the money was collected locally, then submitted to central
government.
In countries without a large tax-based subsidy for park management, tourism is often the
largest source of income for park agencies. Throughout Africa, for example, the parks must earn
much or most of their operating budgets from tourism. This has led to a level of innovation in
Page 21 of 43
pricing policy that is worthy of note.
South Africa has a booming tourism industry that has expanded dramatically in the past
five years and is predicted to grow substantially in the next five years. Significantly, 60% of the
5.5 million tourists who visited the country in 1997 visited a national park or game reserve
(Eagles, 1999). The democratically elected government of South Africa has many social
objectives calling for budget allocation. As a result all tax-based grants to the national and
provincial park systems are being phased out, leaving the parks with the options of increasing
income from tourism or cutting staff and services. The parks are responding with impressive
pricing and tourism service innovation.
The South African National Parks (SANP) system is now at 80% budget recovery from
tourism (Msimang, personal communication, May 21, 1999). SANP now operates an impressive
array of tourism businesses in the national parks. It provides a range of accommodation, ranging
from campgrounds through family cabins to hotels. All of the food and souvenir stores are
agency operated. Many of the tours are park operated. Therefore, income is earned from entrance
fees, lodging, food provision, product sales and tours. In the future, licensing of intellectual
property, such as logos and park names, is a possibility. Special promotional co-operation with
associated industries, such as 4 by 4 vehicle companies, holds promise. This diverse set of
income generators must be further utilized if the SANP is to gain sufficient income to reach the
public policy goal of financial self-sufficiency.
Differential fees are becoming more common. Foreigners pay more, and sometimes much
more, than nationals do. At high demand times prices are sometimes higher. Prices are becoming
associated with service level, higher prices corresponding to more services. Those agencies that
have parastatal status and have private sector involvement have a much higher diversity of
pricing and servicing standards.
South Africa is a good example of the development of a wide range of standards and
pricing for accommodation in and near the parks. The parks typically provide three levels of
basic accommodation services: personal tent camping, RV camping, and semi-permanent tent
rentals, the latter of which typically are wood-floored, canvas tents. The parks sometimes also
have three different levels of roofed accommodation, ranging from rustic cabins through cottages
to hotels. Many parks provide several levels of food provision, from restaurants, through fast
Page 22 of 43
food outlets to grocery stores. Merchandise sales are common, typically for typical outdoor gear
and souvenirs.
In South Africa the private sector is heavily involved in the upper range market,
providing two or three levels of highly priced accommodations and associated ecotourism
services at private game reserves. The private reserves are often located adjacent to the parks, to
take advantage of the wildlife and ecosystems of the parks as well as the already identified
ecotourism profile of the location.
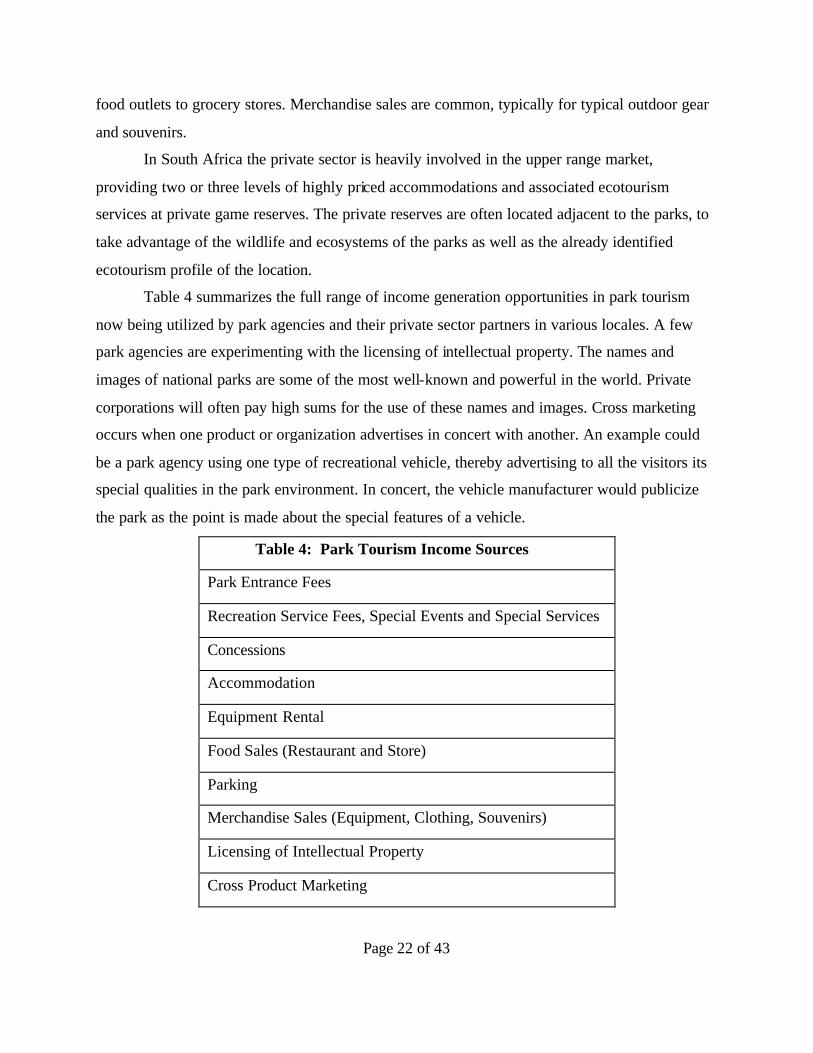
Table 4 summarizes the full range of income generation opportunities in park tourism
now being utilized by park agencies and their private sector partners in various locales. A few
park agencies are experimenting with the licensing of intellectual property. The names and
images of national parks are some of the most well-known and powerful in the world. Private
corporations will often pay high sums for the use of these names and images. Cross marketing
occurs when one product or organization advertises in concert with another. An example could
be a park agency using one type of recreational vehicle, thereby advertising to all the visitors its
special qualities in the park environment. In concert, the vehicle manufacturer would publicize
the park as the point is made about the special features of a vehicle.
Table 4: Park Tourism Income Sources
Park Entrance Fees
Recreation Service Fees, Special Events and Special Services
Concessions
Accommodation
Equipment Rental
Food Sales (Restaurant and Store)
Parking
Merchandise Sales (Equipment, Clothing, Souvenirs)
Licensing of Intellectual Property
Cross Product Marketing
Page 23 of 43
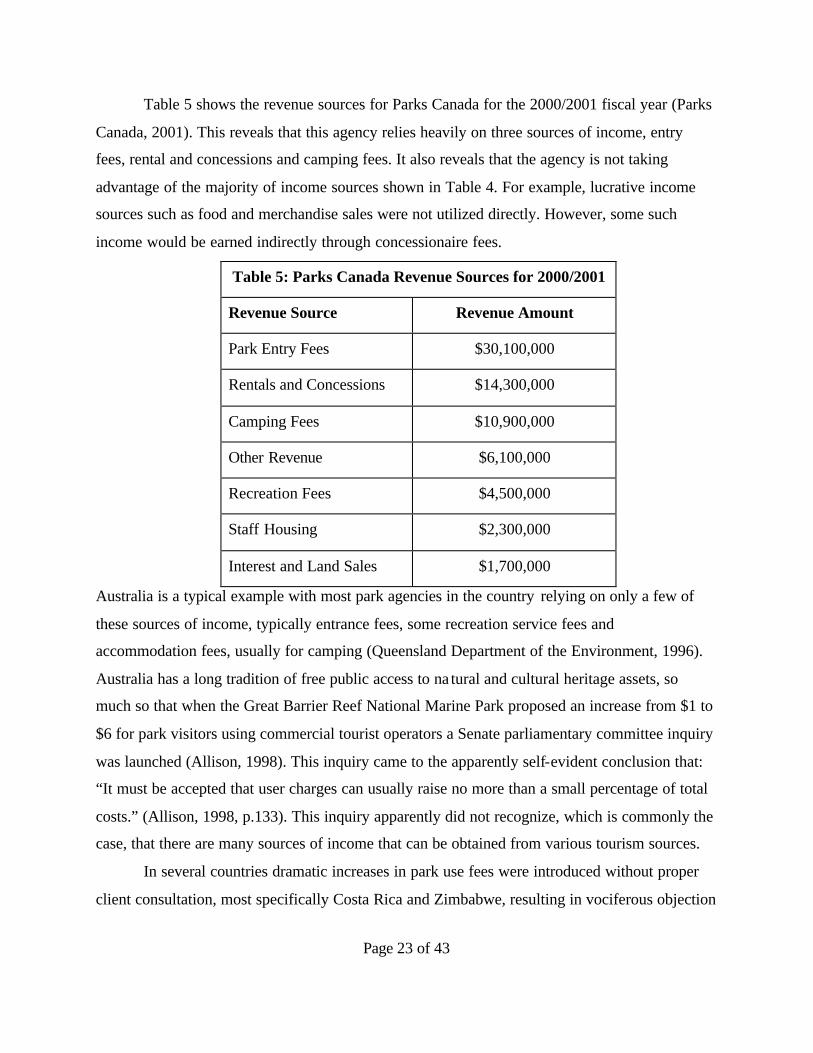
Table 5 shows the revenue sources for Parks Canada for the 2000/2001 fiscal year (Parks
Canada, 2001). This reveals that this agency relies heavily on three sources of income, entry
fees, rental and concessions and camping fees. It also reveals that the agency is not taking
advantage of the majority of income sources shown in Table 4. For example, lucrative income
sources such as food and merchandise sales were not utilized directly. However, some such
income would be earned indirectly through concessionaire fees.
Table 5: Parks Canada Revenue Sources for 2000/2001
Revenue Source Revenue Amount
Park Entry Fees $30,100,000
Rentals and Concessions $14,300,000
Camping Fees $10,900,000
Other Revenue $6,100,000
Recreation Fees $4,500,000
Staff Housing $2,300,000
Interest and Land Sales $1,700,000
Australia is a typical example with most park agencies in the country relying on only a few of
these sources of income, typically entrance fees, some recreation service fees and
accommodation fees, usually for camping (Queensland Department of the Environment, 1996).
Australia has a long tradition of free public access to na tural and cultural heritage assets, so
much so that when the Great Barrier Reef National Marine Park proposed an increase from $1 to
$6 for park visitors using commercial tourist operators a Senate parliamentary committee inquiry
was launched (Allison, 1998). This inquiry came to the apparently self-evident conclusion that:
“It must be accepted that user charges can usually raise no more than a small percentage of total
costs.” (Allison, 1998, p.133). This inquiry apparently did not recognize, which is commonly the
case, that there are many sources of income that can be obtained from various tourism sources.
In several countries dramatic increases in park use fees were introduced without proper
client consultation, most specifically Costa Rica and Zimbabwe, resulting in vociferous objection
Page 24 of 43
and subsequent roll-back of some of the increase. The lack of knowledge of pricing policy and
the methods of price adjustment is common in parks, and is visibly evident in these two
examples.
There are implications for management of higher levels of income based on tourism
(Table 6). Overall, park visitors will face higher fees and more increased opportunity where fees
are charged. The biggest changes take place within the park agency. A business approach to
management is necessary. This includes the ability to retain and utilize most if not all income.
Given the need for income, the park visitors become more important. Their opinions on
programs, their length of stay, their return rates, their facility and program needs and their overall
satisfaction become important management variables. The managers become more aware of the
need for marketing, that is the creation of a product that fits the market needs. Once the income
becomes substantial park management has a higher level of independence from government
grants, and from government in general.
Table 6: Implications of Tourism-based Income
Business-based Management
Increased Profile of Visitors in Management
More emphasis on Client Satisfaction
Service Quality Management
Enhanced Marketing
Independence from Government Grants
Higher fees
Experience reveals many resistance factors from the move from a park agency dependent
upon government grants, to an agency dependent upon tourism income (Table 7). Nature is
perceived as being universally-owned and requiring no human management. This concept of
nature as a free good creates expectations that national parks and other forms of protected areas
should provide free access. Over history this concept was reinforced with pricing for access well
below the production cost. In the USA national park use fees were prohibited by law for many
Page 25 of 43
years. The private sector in tourism usually objects to any fees, and especially to any increase in
fees. In addition, it is obvious to many business people in tourism that substantial income can be
earned by providing services to park visitors. These people therefore act like vultures, swooping
into the political arena to seize the most important assets, such as accommodation and food
provision. This denies the park management from important income sources. Park agencies are
typically not equipped to undertake business management. Their marketing, pricing policy,
economics and financial expertise are usually deficient. This and other factors lead many park
agency staff to vigorously object to a park agency operating as a business. It is common for
important sectors of the public, such as environmental groups, to object to the business
operation. This is often due to fears of over commercialisation. It can also be due to resistance to
paying increased fees.
Table 7: Resistance Factors to Tourism-based Income
Public expectation of free nature
History of pricing below production cost
Private tourism sector resistance
Private sector vultures
Lack of business expertise in agency
Public concern about commercial development
Staff resistance to business operation
Tourism Planning and Management Competencies
All national parks and protected areas have some level of visitor use. This can vary from
just a few to millions of visitors per year. Much of the visitor management is reactive, rather than
proactive. The parks receive whatever visitor use that occurs, and then try to develop
mechanisms to define and manage appropriate activities and levels of use. Often visitor
management only takes place when some level of a problem is perceived. The parks usually
provide “take it or leave it” levels of tourism service. In other words, a type of recreation
Page 26 of 43
program or facility and a level of service is provided, with the visitor free to accept this, or to not
participate. Visitors are expected to make their opinions about activities and services known
through management reviews or through complaints, or not at all. It is very rare for park agencies
to consis tently and professionally evaluate and monitor the wants and levels of satisfaction of
their visitors. It is even rarer for evaluation to be done on potential visitors or past visitors who
did not return.
The majority of park agencies are weak in tourism competencies. Those that do occur are
usually the result of resource managers learning on the job about visitors and tourism
management. Very few agencies, and almost no parks, have professional expertise in leisure
pricing policy, in tourism economics, in marketing, in tourism management, in social statistics,
in service quality or in leisure studies. However, this situation is changing rapidly in several
countries. For example, Parks Canada is one of the leaders in the development of high levels of
competency throughout the agency in tourism management. This increase is stimulated by the
need of the agency to gain operational income from tourism.
The low level of tourism competency occurs in park agencies where the emphasis is on
resource protection and the budget comes entirely from a central government pot. However,
whenever a park agency starts to move to a tourism-based budget where income from visitor
services provides the income, there is a much higher emphasis given to tourism management.
Often the private sector operators in and near the parks have much higher levels of tourism
market expertise than do the parks. In many parts of the world the private sector is the force
behind the tourism in parks. It is the private sector that attracts the visitors, services their basic
needs, and provides all of the tourism services. A pointed example of this is in Costa Rica, where
the national parks and the wildlife refuges have low tourism competencies within the
government agency. It is the private sector that has developed the internationally recognized,
park-based ecotourism industry over the last 20 years.
Park Tourism Market
Is there a market for increased levels of nature-based tourism? The largest market study
ever undertaken was done for British Columbia and Alberta in Canada in 1995 (HLA and ARA,
1995). For this study, the term ecotourism was used and was defined very broadly as “nature,
adventure and cultural experiences in the countryside” (HLA and ARA, 1995, p. ES-1). The
Page 27 of 43
study found a very large ecotourism market in Canada and the United States. In the seven
metropolitan areas studied, Seattle, San Francisco, Los Angeles, Dallas, Chicago, Toronto, and
Winnipeg a market of 13.2 million potential ecotravellers was found. This was much larger than
anticipated, and showed that a large market is now present in North America alone.
The study found that the natural setting is the most critical factor in the determination of a
quality product. The tourists showed increasing desire to find experiences in environments that
were ecologically well managed. Recreational activities were important and multiple activities
were desired. Midrange accommodation was desired, and the experienced ecotourist placed
much higher emphasis on the outdoor experience than on the accommodation. Competent guides
and quality interpretive programs enhanced the quality of the travel product experience. The
preferred trip was long, at seven days or more. Parks and the activities in the parks were found to
be very important components of the ecotravel experience (HLA and ARA, 1995).
Clearly, there is a large and growing ecotourism market in North America. Travel trends
throughout the world point to growing markets, especially in North America, Europe and Asia.
Given the large potential market size, the key issue becomes one of providing travel products
that fit the market and ensuring that these products have positive economic and environmental
benefits.
Visitation Statistics
Decisions should be based upon data. The better the data, the better the chance of good
decisions. A fundamental figure for decision making is that of product volume. No private
company can survive without thorough, accurate and up-to-date data on the numbers and timing
of the production and subsequent sale of the ir products. However, some parks pay low levels of
attention to documenting their level of recreation use. In recent years during budget cutting some
managers cut gate staff and visitor management personnel, people doing functions seen as less
important. Imagine a store firing all its cashiers and its product service personnel!
Many parks are poorly designed for documentation of visitation levels. Parks are often
large with many entry points, making it difficult to tabulate all entrances. Some park clients
sneak in, to avoid fees. Many parks do not have staff covering all entrances at all times of the
day and all months of the year. Shoulder season visitation is usually poorly documented. Within
Page 28 of 43
one agency there may be different data collection procedures in different parks. And in large
parks there may be different data collection procedures at different entrances (Wade, 1998).
However, the recent move in Canada and the USA towards parks retaining fee income is
reversing this trend and placing much higher emphasis on catching as many of the clients as
possible.
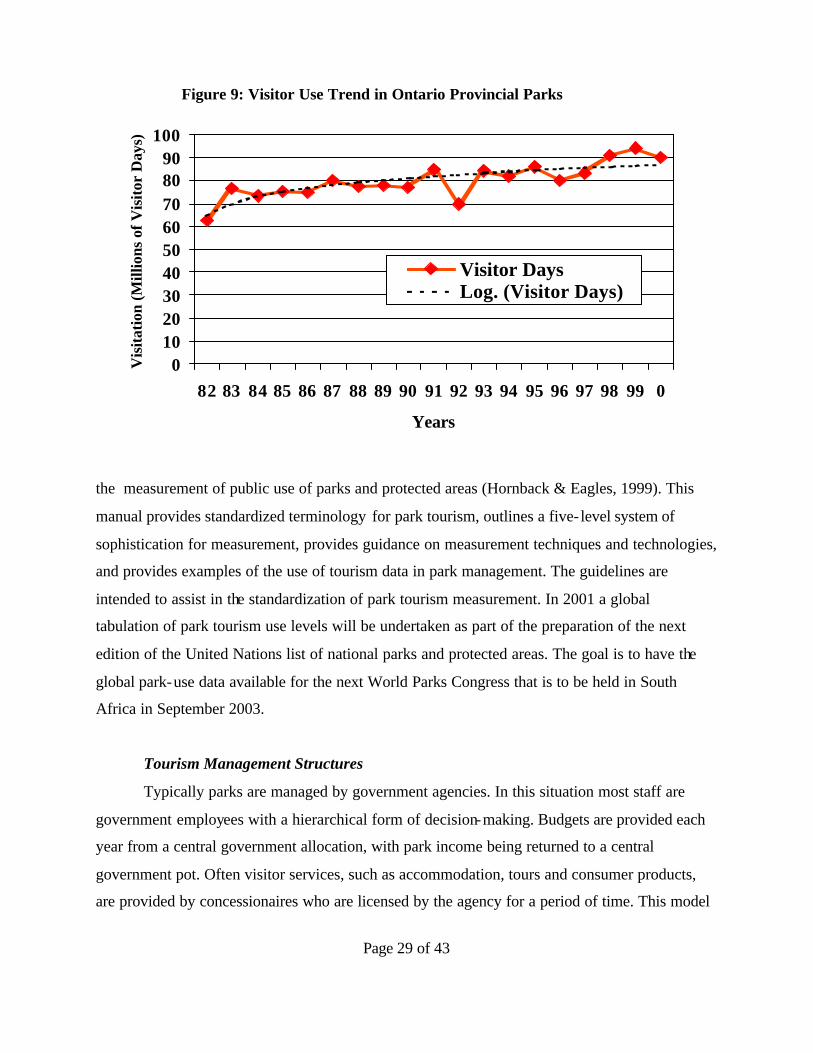
Ontario has a history of collecting accurate and useful park use figures, and can be used
as an example to illustrate certain points. Figure 9 shows the visitation trends in Ontario
provincial parks over the last decade, as measured in visitor days of recreation use. Clearly,
increases in use continue across the period, shown both in the raw data and in the trend line
shown in Figure 9. It is probable that budget cuts in Ontario throughout the 1990s meant that the
figures shown in the last few years are underestimated, as staff are less available to count
properly in shoulder seasons and in low-use periods during the days of the heaviest seasons. The
dip from 1995 to 1996 is probably due to a large reduction in staff, due to budget cuts.
Interestingly the use level increases substantially in the late 1990's, even though the fees levels
increased substantially during the same period. One major reason for the increase is the fees
charged were used to provide higher levels of service, especially for camping.
Every park system has its own, unique system of counting and recording its visitors.
Some count all who enter, including recreationists, service vehicles, and vehicles just passing
through. Some count only those who stay during the night, ignoring day visitors. Some count
only those who pay. Some record the numbers of entrants, some the numbers of visitor hours,
and others the numbers of visitor days.
There is a need to standardize, in parks, in countries, and globally, the definition, the
collection procedures, and the reporting of park tourism statistics. When this is done, the park
movement will have new and powerful data for influencing public policy discussions.
Recently the World Commission on Protected Areas released the first-ever guidelines for
Page 29 of 43
the measurement of public use of parks and protected areas (Hornback & Eagles, 1999). This
manual provides standardized terminology for park tourism, outlines a five- level system of
sophistication for measurement, provides guidance on measurement techniques and technologies,
and provides examples of the use of tourism data in park management. The guidelines are
intended to assist in the standardization of park tourism measurement. In 2001 a global
tabulation of park tourism use levels will be undertaken as part of the preparation of the next
edition of the United Nations list of national parks and protected areas. The goal is to have the
global park-use data available for the next World Parks Congress that is to be held in South
Africa in September 2003.
Tourism Management Structures
Typically parks are managed by government agencies. In this situation most staff are
government employees with a hierarchical form of decision-making. Budgets are provided each
year from a central government allocation, with park income being returned to a central
government pot. Often visitor services, such as accommodation, tours and consumer products,
are provided by concessionaires who are licensed by the agency for a period of time. This model
0102030405060708090
100
82 83 84 85 86 87 88 89 90 91 92 93 94 95 96 97 98 99 0
Years
Vis
itatio
n (M
illio
ns o
f Vis
itor
Day
s)
Visitor DaysLog. (Visitor Days)
Figure 9: Visitor Use Trend in Ontario Provincial Parks

Page 30 of 43
is widespread and reasonably effective when central government provides sufficient budget.
However, it is very ineffective in several respects. The budgets are not closely tied to tourism
levels, so park management is severely limited in its ability to respond to increases or other
changes in visitation levels. Also the park staff recognize that the key people to please are those
who provide the budget, such as upper level bureaucrats and politicians. As a result the level of
understanding and commitment to park visitors is often very low with this model of
management. This model can be problematic when the size and power of the private sector
tourism overwhelms a politically weak government agency. In this situation the selfish
individual interests of the tourism operators can lead to tourism overuse. Very severe
environmental degradation often occurs with this model, due to the lack of budget for the agency
to handle tourism pressures.
Much experimentation with park management structures is under way. Three new models
that are having success are worthy of discussion: the parastatal agency, the non-profit
corporation, and the private, for-profit corporation.
Many government agencies are shifting to a parastatal form of operation, as discussed
earlier for Canada. A parastatal is a corporate body within government. The parastatal makes its
own policy, maintains internal financial operations, and has control over internal reporting and
decision structures. Often a government-appointed Board of Directors functions as the overall
policy and approving body, sometimes with veto powers held by a Minister. This approach is in
place in Kenya, in Tanzania, in South Africa and in Ontario, Canada, to name four examples.
Advantages over the government model are numerous. This structure is much more financially
efficient. The agency can quickly establish pricing and tourism policies that enable it to more
effectively tap tourism financial flows. The ability to internally handle budgets means a better
understanding of the connection between service and income, between outflow and inflow of
money. This structure usually leads to much higher levels of emphasis on park visitors, their
needs and their satisfaction. This approach often has a much flatter structure, with the multiple
layers of the government agency replaced by only a couple of administrative layers. The biggest
disadvantage of a parastatal, seen by some, is the loss of central control by government.
Those countries with parastatal forms of park agency management are those that are most
likely to earn the majority or their entire operational budget from tourism. Examples include
Page 31 of 43
Tanzania National Parks (TANAPA) in Tanzania, Kenya Wildlife Service (KWS) in Kenya, and
SANP in South Africa. However, it is important to note that in all three of these African
countries various forms of foreign aid are very important for capital development in the parks.
Some countries utilize non-profit corporations to provide some of the tourism services.
These can take the form of membership groups that provide specialized services, such as
guiding, information dispersal, and recreation management. Such groups have the advantages of
a parastatal plus the additional ability to mobilize large numbers of volunteers and solicit
donations. However, this approach is rarely used for entire parks, probably due to the narrow
focus of such groups and their lack of ability to handle the entire range of concerns required in
park management.
Often for-profit private corporations provide some tourism products and services to
visitors in parks. This is frequently done on a licensed concessionaire basis, where the company
has a monopoly, or on a free market basis where many companies compete for the tourist market.
Occasionally experimentation is occurring where park development or park management is being
turned over totally to private companies. One such case is now taking place in Lesotho. The
Lesotho Highlands Development Authority is constructing a series of massive dams in the
Lesotho highlands, for the purpose of earning income from the export of water to the large urban
areas of nearby South Africa. As a remediation effort the Authority has hired a consulting firm to
select, plan, design and construct a system of protected areas within the development area. Four
parks are under development, with two, the Bokong Nature Reserve and Tse’hylane National
Park, at the stage of tourism facility development. At the end of the contract period the private
firm will turn over the operational parks to the fledgling national parks’ agency of the country.
This is the only example I have ever seen of a private company given complete authority for the
selection, planning, design and construction of protected areas. Personal observation of the
activities suggests that it is a highly effective effort, but the ability of the government park
agency to manage the park and the tourism after the hand-over is in doubt.
Conclusions and Summary
What does it take to effectively manage tourism in a national park or other form of
protected area? It might be best to discuss the overall trends in park tourism by summarizing
Page 32 of 43
within two headings: 1) park tourism opportunities and 2) park tourism challenges.
Park Tourism Opportunities
Within most park agencies the park management authorities have some level of
familiarity with park visitation. Most are capable of handling some international tourism. If the
parks work within a competent, co-ordinated system, and have sufficient finances to operate the
parks that exist, it is possible to develop a co-ordinated tourism management system.
For the parks to become international destinations, the country and the parks must have a
global image of being a premier destination for outdoor recreation and nature tourism. Potential
tourists must see some international profile. Location is important, but poor location can be
overcome due to inexpensive air travel. Significant natural resources, a high market profile, and
a quality service industry are three prerequisites for effective utilization of the international
market.
The international airports, road, and water transportation system must be capable of
handling significant levels of tourism traffic. Information systems need to be able to handle the
whole range of needs that occur in tourism. People need lots of information. Those sites that
have better information technologies are much more effective in attracting international tourism.
Unfortunately, most park agencies do not control the flow of the majority of information that is
provided to park visitors. Guide books, feature films, conservation groups, scientific
publications, and tour companies usually provide more information than do the parks. This can
be an advantage if the information is accurate and appropriate, but it can be very problematic if
the park is not prepared or capable of handling the resultant tourism traffic. It can also be a
problem if the information is wrong, or purposely misleading.
Park Tourism Challenges
Most parks are not now equipped to handle international tourism. Typically these parks
lack tourism management capability, sufficient staff, and infrastructure. Examples to illustrate
this lack of expertise are easy to find. Many parks do not have the language ability to handle
tourism from foreign countries. Often very little is done to encourage and assist visitation by
people from foreign countries.
Page 33 of 43
Most parks have insufficient numbers of people with expertise in tour ism, marketing,
service quality evaluation, and international ecotourism. The level of expertise in these areas
must be considerably upgraded if the agencies want to develop a vibrant, international tourism
industry, one that can compete globally. Expertise in service quality management is particularly
needed. The North American service industries are the global leaders in the development and
application of service quality management principles. As a result, the North American consumer
expects high levels of quality from service providers. Government agencies lag far behind the
private sector in applying service quality management principles, and this lack is obvious to their
clients.
Several countries, most specifically the USA, Australia, and the United Kingdom, have
aggressive tourism research, education, and development programs aimed at nature-based
tourism. For example, the National Parks Service of the USA developed a suite of national
cooperative research and training institutes at first- line universities in that country (Michael
Soukup, personal communication, November 24, 1997). This follows similar initiatives
previously undertaken by the US Forest Service, and another by the US Fish and Wildlife
Service. Recently, the park agency in the State of Victoria in Australia funded a major
cooperative research and education unit in at Deakin University (David Weston, personal
communication, November 17, 1997; John Senior, personal communication, July 24, 1999). The
recent nature tourism strategy for the State of New South Wales proposes a strengthened link
between the national park agency and universities in that state of Australia (Worboys, 1997). No
such cooperative units are found in most countries in the world. This deficiency results in a
severe paucity of professional level of expertise in the specialized area of park tourism. There is
an urgent need for the development of better connections between universities and park
management. Australia is leading the way with the development of the national research program
for sustainable tourism. This is known as the Cooperative Research Centre for Sustainable
Tourism (CRC Tourism) and is located in the Gold Coast Campus of Griffith University (Terry
de Lacy, personal communication, July 12, 1999). This operation involves university,
government department and private sector cooperation into cutting edge and applied tourism
research. This approach appears to be functioning very well with impressive levels of useful
tourism research being published.
Page 34 of 43
Many parks are generally unknown outside the local area, and have weak mechanisms to
provide a higher level of profile. Many parks have natural resources of limited international
appeal. Therefore, it is reasonable to suggest that only some parks can play an international role.
Within an overall park system tourism strategy, only those with appropriate natural and
managerial resources should be chosen for international visitation.
Only a few parks have an existing international reputation sufficient to attract people to
the sites as primary travel destinations. Those that have the names “national park” and “World
Heritage Site” have significant brand identity. The plethora of park names, such as “provincial
park” and “conservation area,” leads to confusion by many potential visitors. These names are
often poorly known outside the local area. These phrases may also connote low levels of
resource significance and tourism infrastructure.
Parks are very important components of the nature-based tourism industry. They occupy
some of the most interesting landscapes. They also have information and infrastructure that
attract tourists. And they can be used within a system of linked travel routes for long-distance
travel. However, the parks are seldom managed within a system of linked travel routes. For
example, are the parks part of a clearly- identified travel route? Is all information for all
destinations on a route available at all stops along the route? Can a visitor book all
accommodation and other services for an entire trip at any of the parks along the route?
Typically, the answer to these questions is negative.
Many park administrations show weak understanding of the global ecotourism market.
There does not appear to be a policy envelope, an administrative structure, or a staffing
complement that recognizes an international role. The big exception to this situation is in
Australia, with both national and state-level ecotourism strategies that explicitly deal with the
parks as international destinations (Allcock, Jones, Lane & Grant, 1994; Worboys, 1997;
Western Australian Tourism Commission, 1997; Tourism Queensland, 1999). The ecotourism
policy and plan for the State of Queensland in Australia is one of the most mature policy
documents available.
An obvious example of the lack of understanding of international tourism is the
inadequacy of programs and facilities aimed in this direction. International visitation is not
directed through a well-designed system of information for international visitors. Multilingual
Page 35 of 43
publications are almost non-existent. Staff language ability is generally in the local language,
often in English, and almost never in other important languages such as German, Spanish, or
Japanese. Prebooking by international visitors is very difficult or non-existent. There is no way
for international tourists to work through their travel agents to facilitate visitation to most parks.
Often visitors are expected to bring all the necessary equipment for camping or outdoor
recreation, a very difficult and expensive task for trips that involve air travel. Rental or sale of
equipment sometimes occurs in the parks, but its availability is spotty, and when available, is
difficult to access for international visitors. There is seldom easy access to guides, specialized
information, or ethnic food for international travellers. Co-operation with airlines, tour agencies,
recreation vehicle rental companies, or hotel chains is rare. Parks do little to encourage, or even
facilitate, the visitation by people from the country’s major foreign tourism markets. Given these
challenges, it is a wonder that as many international travellers find their way to parks as do. It is
clear why the Lonely Planet Guides, and other similar guidebooks, have found such a global
market. However, if these challenges were tackled effectively by the parks, the numbers of
international visitors could increase dramatically.
Often the parks’ infrastructure is designed for the knowledgeable and experienced local
person. It is difficult for foreigners to visit parks. It is very difficult for them to gain the
knowledge of a park, to obtain access, to get all the necessary equipment, to learn how to use the
equipment, to gain suitable transport and then to visit most parks. In North America camping is
the dominant form of camping in parks. The complexity of camping redirects many visitors into
other forms of accommodation. However, there is very limited roofed accommodation in the
parks to handle the international ecotourism market. There are often suitable accommodations
outside the parks, but these are typically small scale and difficult to access by people in remote
locales of the world.
Park tourism is a global phenomenon and has a global market. Those agencies and those
parks that develop suitable expertise and facilities are out-competing others. The phenomenal
success of national parks and game reserves in South Africa in the last half decade shows how a
sophisticated tourism approach can successfully out-compete many other similar destinations in
Africa that have equally good natural resources, but less effective tourism operations.
Some of the deficiencies outlined are due to low levels of finance. At present, the typical
Page 36 of 43
government agency structure results in insufficient finance to hire trained staff, to develop the
research base, to develop the product line, to advertise the product, and to handle the visitors
when they arrive. The parastatal agency structures developing in many countries help self-
finance this endeavour when they become operational, but there are often insufficient start-up
funds. It is important for governments to recognize that one must spend money to make money.
Allocations from governments are necessary for the development of nature-based tourism. These
allocations must be made within the context of a carefully constructed national, provincial, and
agency policy environment. This aid is often occurring in developing countries through various
forms of foreign aid. The Global Environment Facility provides grants and soft loans for
biodiversity conservation (GEF, 1996) in parks and protected areas, with the long-term
operational funds to come from tourism (The World Bank, 1998).
The challenges are partially due to a nature-tourism policy void in many countries. There
is an urgent need for co-ordinated national/provincial/regional nature-based tourism strategies in
most countries. These strategies would identify key policy priorities, consider which sites have
potential for international ecotourism, develop recommendations for market development,
provide backing to financial development, and schedule a multi-year development plan. The
Australian national and state nature-tourism policies are the best in the world at the current time
(Allcock, Jones, Lane & Grant, 1994; Worboys, 1997, Western Australian Tourism Commission,
1997).
Park Tourism Summary and Conclusions
If park tourism is to be given the level of public policy recognition that it deserves, a
more consistent and thorough procedure for the collection of visitation and economic data is
required. Carlson (1997) discussed the complexities of evaluating and monitoring recreation and
tourism use. After his study of economic evaluation of recreation and tourism in New South
Wales he called for “a more consistent approach to data collection.” The World Commission on
Protected Areas is attempting to standardize the collection and use of park tourism data.
Guidelines for the measurement of economic impact of parks are under development (Bagri,
Blochhus, & Vorhies, 1998). The goal of this effort is to standardize methods of measurement
and to encourage the widespread collection and dissemination of the output. Guidelines for the
collection and use of visitor-use data (Hornback & Eagles, 1999) are published by the World
Page 37 of 43
Commission on Protected Areas. The goals of these two efforts are to standardize the approaches
used for economic impact measurement, as well as the terminology, the measurement methods,
and the reporting of park visitation. These guidelines should be of assistance to all parks
agencies.
The next data collection for the United Nations’ List of National Parks and Protected
Areas, occurring in the year 2001, asks for visitor-use data from all countries. Once compiled,
this inventory will provide the first global documentation of park use. Using economic models,
these visitor-use data will be the base for the calculation of global tourism economic impacts.
With the movement toward documentation of tourism’s volume and impact, discussion is
starting on the evaluation of the park management’s ability to handle tourism (Hocking, 1997).
The development of management effectiveness guidelines and procedures can assist policy
makers, senior management, and the public in understanding the capability of park managers and
their institutions.
Many parks are starting to move towards agency management structures that function
like corporations within government. This involves a) agency retention of fee and license
revenue, b) retention of budget surpluses at the end of the fiscal year, c) pricing policies that
better reflect the cost of production, and d) more flexible arrangements with corporate and non-
profit entities outside government. It is probable that higher use fees will be charged. Over time a
much higher proportion of revenue will come from merchandise and food sales than now occurs.
Innovative funding mechanisms, such as licensing of park names or cooperative public-private
ventures in special purpose merchandise,
are under way.
Park agencies must develop
tourism management competencies
within their own organization (Table 8).
It is critical that the park visitors’ needs
and wants be understood. Most park
agencies now function on a take- it or
leave- it philosophy towards their
1) Understanding the visitors’ needs and wants
2) Service quality management
3) Leisure pricing policy
4) Leisure Marketing
5) Tourism and resource economics
6) Finance
7) Tourism management
Table 8: Tourism Competencies
Page 38 of 43
visitors. Certain types of facilities and services are provided, and the park client is not even asked
if this facility or service is desirable or serving their needs. A class example to illustrate this
point is the lack of service quality management in most park agencies. Few agencies have
specific service quality goals, with Parks Canada being a notable exception. The private sector in
leisure services is rapidly moving towards service quality goal management. All park agencies
require specialists in leisure pricing policy. Pricing policy is a major field in business
management, and a critical component of the operation of most corporations. Leisure marketing
is the specialized field concerned with developing a solid understanding of the client, the product
and developing means to match the two. The park agencies with parastatal forms of management
are now staffing with specialized expertise in leisure marketing. This paper makes a strong point
of the need for tourism and resource economics expertise within a park agency. Those agencies
that function like a corporation need specialized finance expertise. Tourism management is a
large and specialized field that is a broad and complex as resource management. All park
agencies should develop staff expertise in this area. It may be too obvious a point to make, but it
is important to note that people trained in biology, forestry and resource management typically
have no professional training in any of the fields listed in Table 8. Therefore, it is important for
park agencies to retrain their existing staff, or hire such expertise.
The negative impact of tourism on park resources is less influenced by absolute numbers
of visitors, and more influenced by weak tourism policy, management and staffing. Very low
levels of finance often cause this. It has been shown many times in many parks that with
sufficient expertise and finance, park tourism can be very competently managed, with low levels
of negative environmental impact and high levels of positive economic impact. The key issue is
developing a management framework that emphasizes staff expertise in tourism and financial
competence. Tourism, within most park agencies, can provide significant levels of income if it’s
allowed to by the overall government legislative and policy framework.
The next 20 years will see a major shift in park management towards much more
sophisticated tourism management. Such a shift will help considerably in developing a financial
system that allows for competent and successful park management.
Page 39 of 43
Acknowledgements
Thanks to Tom Beechey of Ontario Parks for the initial encouragement to develop these
ideas into a paper. Thanks to Dan Mulrooney of Ontario Parks and Per Nilsen of Parks Canada
for many discussions and debates on the intricacies of visitor management. Michael Green of the
World Conservation Monitoring Centre in Cambridge, U K, kindly allowed for the reproduction
of Figure 3 from his unpublished paper. Special thanks to Robin Grimwade of Centennial Park
Trust of Sydney, Australia for insightful discussions on the park management bench marking
effort under way in Australia. Michael Soukup, Associate Director for Natural Resources of the
National Parks Service of the USA provided information on agency-university agreements.
Bryan Higgins of the City University of New York, Megan Epler Wood of The Ecotourism
Society, Kreg Lindberg of Sturt University, Peter Valentine of James Cook University, Steve
McCool of the University of Montana, Steve Parker of the University of Nevada at Las Vegas,
Chris Haynes of the Conservation and Land Management Department of Western Australia,
David Weston the Deputy Director of National Parks for the State of Victoria, Mavuso Msimang
of the South African Parks Board, Trevor Sandwith of Kwa-Zulu Natal Nature Conservation
Service, Dave Reynolds of Earth Plan, and Keith Johnson of the Department of Conservation of
New Zealand each provided important insights. Ron Welch and Derek Wade of the University of
Waterloo, Dan Mulrooney, Tom Beechey and Barton Fielder of Ontario Parks, and Ric Symmes
provided comments on an earlier version of the paper. Ann Ross made editorial comments. Terry
de Lacy, the executive director of Australia’s national sustainable research centre (CRC
Tourism) was very helpful. John Senior of Parks Victoria and Tony Charters of Queensland
Tourism provided valuable information on recent tourism management trends within their parts
of Australia.
References
Allcock, A., Jones, B., Lane S., & Grant J. (1994). National Ecotourism Strategy. Canberra,
ACT: Commonwealth Department of Tourism.
Allison, Lyn. (1998). Access to Heritage: User charges in museums, art galleries and national
parks. Report of the Senate Environment, Recreation, Communications & the Arts
References Committee, Parliament of the Commonwealth of Australia. Australia:
Canberra.
Page 40 of 43
Baez, A. L. (2001) Costa Rica Como Destino Turistico. Unpublished Conference Paper, Rio De
Janeiro, Brazil.
Bagri, A., Blochhus, J., & Vorhies, F. (1998). Economic Values of Protected Areas: A Guide for
Policy Makers and Park Managers. Draft 2. Gland, Switzerland : World Commission on
Protected Areas, IUCN - The World Conservation Union.
Bowman, Margaret. (2001). Economic Benefits of Nature Tourism: Algonquin Park as a Case
Study. M. A. thesis, Department of Recreation and Leisure Studies, University of
Waterloo, Waterloo. 300 pp.
Brademas, D. J. and Readnor, J. K. (1987). Status of Fees and Charges in Public Leisure Service
Agencies. Journal of Park and Recreation Administration 7(4), 42-55
Butler, R. W. (1980). The concept of a tourist area cycle of evolution: implications for
management of resources. Canadian Geographer 24, 5-12.
Ceballos-Lascurain, H. (1998). Introduction. In M. Epler-Wood and K. Lindberg (Eds.),
Ecotourism: A Guide for Planners and Managers, Volume 2 (pp. 7-10). North
Bennington, VT: The Ecotourism Society.
Coopers & Lybrand Consulting. (1995). Economic Benefits of British Columbia Parks. Victoria,
BC: British Columbia Ministry of Environment, Lands and Parks.
Carlsen, J. (1997). Economic Evaluation of recreation and tourism in natural areas: a case study
in New South Wales, Australia. Tourism Economics, 3(3), 227-239.
Driml, S., & Common, M. (1995). Economic and Financial Benefits of Tourism in Major
Protected Areas. Australian Journal of Environmental Management, 2(2),19-39.
Eagles, P. F. J. (1995a). Understanding the Market for Sustainable Tourism. In S. F. McCool &
A. E. Watson (Eds.), Linking tourism, the environment and sustainability. (pp 25-33,
USDA Forest Service, General Technical Report INT-GTR-323). Ogden, UT:
Intermountain Research Station.
Eagles, P. F. J. (1995b). Tourism and Canadian Parks: Fiscal Relationships. Managing Leisure,
1(1),16-27.
Eagles, P. F. J. (1998). International Ecotourism Management: Using Australia and Africa as
Case Studies. Paper presented at Protected Areas in the 21st Century: From Islands to
Networks, World Commission on Protected Areas, Albany, WA, Australia.
Page 41 of 43
Eagles, P. F. J. (1999) Maloti-Drakensberg Transfrontier Conservation and Development Area
Project Mission Report on Tourism to the World Bank. Unpublished report.
Eagles, P. F. J., & Higgins, B. R. (1998). Ecotourism Market and Industry Structure. In M.
Epler-Wood and K. Lindberg (Eds.), Ecotourism: A Guide for Planners and Managers,
Volume 2 (pp. 11-43). North Bennington, VT: The Ecotourism Society.
Eagles, P. F. J., McLean, D., & Stabler, M. J. (2000). Estimating the Tourism Volume and Value
in Parks and Protected Areas in Canada and the USA. George Wright Forum 17(3): 62-
76.
Eagles, P. F. J., & Wind, E. (1994). The Advertising of Canadian Ecotours in 1992. Journal of
Applied Recreation Research, 19(1), 67-87.
Ethos Consulting. (1990). Adventure Travel in Eastern Canada. Ottawa, ON: Tourism Canada.
Filion, F., Foley, J. P., & Jaquemot, A. J. (1994). The Economics of Global Ecotourism. In M.
Munasinghe & J. McNeely (Eds.), Protected Areas Economics and Policy: Linking
Conservation and Sustainable Development. (pp. 235-252 ). Washington, DC: World
Bank.
Global Environment Facility. (1996). Operational Strategy. Washington, DC, USA.
Goodwin, H. J., Kent, I. J., Parker, K., & Walpole, M. J. (1997a) Tourism, Conservation
& Sustainable Development: Volume I, Comparative Report.(1 of 4 Volumes), published,
The Durrell Institute of Conservation and Ecology, The University of Kent, Canterbury,
UK.
Goodwin, H. J., Kent, I. J., Parker, K., & Walpole, M. J. (1997b) Tourism, Conservation
& Sustainable Development: Volume IV, The South-East Lowveld, Zimbabwe.(1 of 4
Volumes), Unpublished, The Durrell Institute of Conservation and Ecology, The
University of Kent, Canterbury, UK.
Green, M. J. B., & Paine, J. (1997). State of the World’s Protected Areas at the End of the
Twentieth Century. Paper presented at Protected Areas in the 21st Century: From Islands
to Networks, World Commission on Protected Areas, Albany, WA, Australia.
HLA Consultants & ARA Consulting Group Inc. (1995). Ecotourism/Nature/Adventure/ Culture:
Alberta and British Columbia Market Demand Assessment. Vancouver, BC, Department
of Canadian Heritage.
Page 42 of 43
Hockings, M. (1997). Evaluating Management Effectiveness. Draft 1. Gland, Switzerland: World
Commission on Protected Areas, Working Group on Management Effectiveness.
Hornback, K., & Eagles, P. F. J. (1999). Guidelines for Public Use Measurement and Reporting
at Parks and Protected Areas. First Edition. Gland, Switzerland: World Commission on
Protected Areas, Task Force on Tourism and Protected Areas.
IUCN. (1994). United Nations List of National Parks and Protected Areas. Gland, Switzerland:
Commission on National Parks and Protected Areas.
Kellert, S. R. (1979). Public Attitudes Toward Critical Wildlife Issues. Washington, DC: US
Government Printing Office.
Laarman, J., & Gregersen, H. (1994). Pricing Policy in Nature-based Tourism. Working Paper,
EPAT/MUCIA, St. Paul, MN: The University of Minnesota
Lindberg, K. (1998). Economic Aspects of Ecotourism. In M. Epler-Wood and K. Lindberg
(Eds.), Ecotourism: A Guide for Planners and Managers, Volume 2 (pp. 87-117). North
Bennington, VT: The Ecotourism Society.
McLean, D. (1999). The 1999 Annual Information Exchange. The National Association of State
Park Directors and the Eppley Institute, The University of Indiana, Indiana, USA. 55 pp.
National Parks Service. (1995). The Money Generation Model. Denver, CO: Office of Social
Science, Socio-economic Studies Division.
Ontario Ministry of Natural Resources & Economic Research Ltd. (1993). Economic Impact of
Provincial Parks in Ontario: A Summary Report. Peterborough, ON: Provincial Park
Operations Section.
Parks Canada. (1995). Framework - National Business Plan 1995/1996 - 1999/2000. Hull, PQ:
Department of Canadian Heritage.
Queensland Department of the Environment. 1996. Benchmarking and best practice program:
user pays revenue. Unpublished report prepared for ANZECC Working Group on
National Parks and Protected Areas Management. Brisbane, Queensland: Queensland
National Parks and Wildlife Service.
Stanley, R., L. Perron, and S. Smeltzer. 1999. The Provincial Economic Impact Model. The
Department of Canadian Heritage, Ottawa, Ontario, Canada. + computer program.
Page 43 of 43
The World Bank. (1998). South Africa Cape Peninsula Biodiversity Conservation Project.
Project Document, Environment Group, Africa Region. Washington, DC.
Tourism Queensland. (1999) Queensland Ecotourism Plan. Tourism Queensland, Brisbane,
Australia
Tye, H., & Gordon, D. M. (1995). Financial and Human Investments in Biosphere Reserve
Management. Cambridge, UK: World Conservation Monitoring Centre.
Van Sickle, K., & Eagles, P. F. J. (1998). User Fees and Pricing Policies in Canadian Senior Park
Agencies. Tourism Management 19(3): 225-235.
Wade, D. (1998). An Exploration of Tourism Data Management in Tanzania’s National Parks.
Unpublished master’s thesis, University of Waterloo, Waterloo, Ontario, Canada.
Wells, M. P. (1997). Economic Perspectives on Nature Tourism, Conservation and
Development. Environment Department Paper No. 55, Pollution and Environmental
Economics Division. Washington, DC, The World Bank.
Western Australian Tourism Commission. (1997). Nature Based Tourism Strategy For Western
Australia. Department of Conservation and Land Management, Perth, Australia.
Worboys, G. L. (1997). Draft Nature Tourism and Recreation Strategy. Hurstville, NSW: New
South Wales National Parks and Wildlife Service.