International Trade in Steel Products: Evidence on Dumping
38
International Trade in Steel Products: Evidence on “Dumping” Versus Competitive Behavior William E. James Nathan Associates, Inc. Craig Parsons Department of Economics, Yokohama National University Working Paper Series Vol. 2003-13 July 2003 The views expressed in this publication are those of the author(s) and do not necessarily reflect those of the Institute. No part of this book may be used reproduced in any manner whatsoever without written permission except in the case of brief quotations embodied in articles and reviews. For information, please write to the Centre. The International Centre for the Study of East Asian Development, Kitakyushu
Transcript of International Trade in Steel Products: Evidence on Dumping

International Trade in Steel Products: Evidence on
“Dumping” Versus Competitive Behavior
William E. James Nathan Associates, Inc.
Craig Parsons
Department of Economics, Yokohama National University
Working Paper Series Vol. 2003-13 July 2003
The views expressed in this publication are those of the author(s) and
do not necessarily reflect those of the Institute.
No part of this book may be used reproduced in any manner whatsoever
without written permission except in the case of brief quotations
embodied in articles and reviews. For information, please write to the
Centre.
The International Centre for the Study of East Asian Development, Kitakyushu
1
International Trade in Steel Products: Evidence on “Dumping” Versus Competitive Behavior
William E. James and Craig Parsons
“Today, the steel industry of the United States is in a trade policy environment unlike any it has experienced in the past three decades. Restructured, modernized, and price and quality competitive, U.S. steel no longer seeks or enjoys industry-specific protection. Anti-Dumping (AD) and Countervailing Duty (CVD) laws have become, for the steel industry, the quid pro quo for free trade. They set the limits on permissible behavior in the marketplace . . .”
Douglas A. Brook, LTV Corporation, “Steel: Trade Policy in a Changed Environment,” in Alan V. Deardorff and Robert M. Stern, eds., Constituent Interest and U.S. Trade Policies, Ann Arbor: University of Michigan, 1998: 133.
Abstract In the wake of the East Asian financial crisis of 1997-98, demand for steel fell sharply in East and Southeast Asia as economic activity declined. East Asian steel producers responded by increasing shipments to the U.S. where demand was strong with the robust economic growth. The U.S. steel industry, both owners and unions, reacted to the surge in imports with a flurry of antidumping petitions. The steel lobby also organized a political campaign demanding quantitative restrictions on steel imports into the U.S. The U.S. executive branch responded favorably to the antidumping petitions and quickly launched investigations leading to punitive antidumping duties on steel imports from many East Asian, developing and transitional economy steel producers. Steel imports quickly declined and the growth in import penetration in the U.S. market for steel was kept in check. Despite this, the new U.S. administration made good on campaign promises to steel states and initiated the use of safeguards under the GATT escape clause, thus escalating the trade conflict in steel. This chapter examines the economic issues of competitive firm behavior as an alternative explanation of “dumping” and considers the possibility of collusive behavior of steel firms under the antidumping actions. It considers the possible avenues East Asia may explore for resolving the trade dispute and the economic costs associated with U.S. steel protection.
I. Introduction: Trade Policy Issues in the Iron and Steel Industry
The latest “steel crisis” in the United States culminated in the President’s recent
decision to invoke the Escape Clause under Section 2011 and to impose temporary (3-year)
safeguards against imported steel products. The latest “crisis” dates from the surge in imports
1 Section 201 of the Trade Act of 1974 known as the “Escape Clause” is rarely used. See Cunningham (1998: 275).
2
in 1998 that led the industry and unions to mobilize their considerable political muscle in
support of protective measures. As in every case since the early 1960s, East Asian producers
have figured prominently in the trade conflict in steel. In almost all previous trade disputes
over steel imports into the U.S. market, protection has been through selective application of
antidumping or countervailing duty measures and “voluntary” restraint agreements.2
The imposition of safeguards in 2002 then may be viewed as somewhat of an
escalation in the effort to protect the U.S. domestic steel industry.3 The industry and unions
may still be unsatisfied and have pressed unsuccessfully for quantitative import restrictions
and for a renewed international negotiation with major steel producing countries around the
globe.4
A. Steel as a “Sensitive Industry” in the United States: Background
The steel industry in the United States was developed initially in the late nineteenth
century behind protective tariffs. In 1870, it is estimated that U.S. steel production amounted
to 100,000 tons or only one-eighth of the combined production of the two largest producers,
the United Kingdom and Germany. However, by the turn of the century, U.S. production
amounted to 13.6 million tons, exceeding the combined production of the next two largest
producers (Germany was number two with the United Kingdom in third position). It is
estimated that U.S. steel output accounted for as much as 56 per cent of global steel output by
World War I.5
The steel industry in the United States during those early years was, in the words of
Baldwin, Chen and Nelson (1995: 158), “the archetype of big business.” The United States
Steel Corporation was founded in 1901 and was the very first billion dollar enterprise in the
United States. It controlled over one-half of all steel production capacity. Over the next
several decades, the industry remained highly concentrated with technology characterized by
large-scale integrated production units initially supplied with coal and iron ore from U.S.
domestic sources, but soon reliant to greater or lesser extent (depending on plant location) on
2 For a useful summary of the history of steel trade disputes and remedies, see Hufbauer and Goodrich (2001). 3 The safeguards, however, are not being applied to steel imports from NAFTA members Canada and Mexico and also exempt a large number of developing countries. No major suppliers from East Asia are exempted, although marginal suppliers like Indonesia and the Philippines are exempted. 4 The Multilateral Steel Agreement (MSA) negotiations were launched in 1989 but ultimately collapsed with no agreement in 1997. 5 The figures cited in this paragraph are from Ashworth (1987).

3
imported ore. Among the key inputs into steel production is bauxite upon which the industry
is nearly completely import dependent (Frank, 1999).
The high concentration and pricing behavior of the industry made it a likely candidate
for anti-trust action. Price fixing was a blatant feature of the industry in the early years of the
twentieth century (Burnham, 1981). However, no anti-trust action was ever successfully
mounted against the industry in the inter-war period.
Price leadership by U.S. Steel continued to characterize the industry in the post-war
decades and led to several congressional investigations and ultimately, a show-down over
pricing with President John F. Kennedy in 1962. The initial inefficacy of the steel industry in
obtaining protection under the terms of the Anti-Dumping Act of 1921 in 1963 may, in part,
have been due to the strained relationship between the industry and the administration at the
time.6
The relationship between big steel, labor and the government underwent substantial
change during these years.7 Unionization of the work force in the large scale integrated mills
was complete and wage levels were amongst the highest in any industry. Wage disputes with
organized labor led to a prolonged strike in 1959 and this opened the way for foreign
producers to gain market share. In order to avoid such episodes in future, the U.S. steel
industry “institutionalized” an accord with organized labor. However, this accord came at the
very time that foreign competitors with the latest steel technology and newest mills were
expanding production and also at a time of structural change in the U.S. economy that would
lead to slower growth in demand for steel, as the overall steel content of GDP began to fall.
Even prior to the 1959 strike and the 1963 antidumping petition, European and Japanese
producers were beginning to expand market share in the United States (Balwin, Chen and
Nelson, 1995: 160).
This led the industry, both labor and capital, to begin to organize themselves
politically in order to improve relationships with Congress and the executive branch in order
to obtain protection from foreign competitors. Before examining the political economy of
steel protection in recent decades in the United States, the development of the upstarts in East
Asia is briefly considered.
6 Another reason may have been that with the Treasury Department in the lead on antidumping decisions, there was some reluctance to introduce definitive measures (Hufbauer, 1999). 7 For discussion see Baldwin, Chen and Nelson (1995).

4
B. The Rise of the Steel Industry in Japan and East Asia
Japan, at first glimpse, seems among the least likely of countries to have prospects for
development of an internationally competitive iron and steel industry. With very limited coal
deposits, no iron ore, no bauxite, high dependence on imported energy and little experience
with industrial technology prior to the late nineteenth century following the Meiji
Restoration, it would come as a surprise to an observer in 1950 that Japan would emerge as a
leading producer on the technological frontier in steel production in two short decades.
Similar observations could be made for Taiwan and, perhaps to a lesser extent, Korea.8
Ashworth (1987:32) cites Japan as one of the rising steel producers with production capacity
by 1970 exceeding 10 million tons. By 1975, steel production in Japan is reported to have
reached 102 million tons, third in the world behind the Soviet Union and the Unites States.
Production capacity in Japan caught up rapidly with that of the United States and soon
surpassed that of all other countries.
Japan as a matter of national industrial policy had identified the iron and steel industry
as a key strategic sector for development of the national economy. Japan was able to
overcome its weaknesses in domestic raw materials through development of deepwater ports
capable of servicing new large-scale bulk carriers of iron ore and coal from Australia and
other suppliers. By building new, technologically up-to-date steel mills adjacent to these
ports, Japan fulfilled two objectives: expanded output of steel as a critical domestic industrial
input and efficient and inexpensive export capablilities in steel taking advantage of
economies of scale and low transportation costs. Japan’s steel producers were encouraged to
expand capacity and modernize with the government providing infrastructure, power and
low-cost capital for expansion. The industry was granted infant tariff protection initially,
although tariffs were eventually reduced to low levels of less than five per cent. The Ministry
of International Trade and Industry (MITI) forged the merger in the early 1970s of two large
steel companies, Fuji and Yawata, creating Nippon Steel, then the largest producer in the
world (Okimoto, 1989: 25).
Investment in new capacity during 1950-1975 must have been on a staggering scale
in Japan, as by 1975 it had attained the capacity to produce up to 140 million tons per annum
compared with domestic consumption of around 70 million tons. This meant Japan already
8 Wade (1990: 319) points out that Korea’s state-run Pohang Iron and Steel Company (POSCO) was declared to be the most efficient steel producer in the world by the World Bank in 1987 and POSCO even provided technical assistance to steel producers in the United States.

5
had a very substantial export capability. By 1980, Japanese actual annual steel production
(111 millon tons) exceeded U.S. production (101 million tons) and would continue to exceed
100 million tons while U.S. production contracted to just 80 million tons over the next decade
to 1990.9
Korea and Taiwan, like Japan, attached special economic significance to the
development of the steel industry. In Taiwan, China Steel Corporation (CSC) was founded as
a state enterprise in 1971 and began production in 1974. 10 Although it enjoyed a near
monopoly in the domestic market, exports were essential for it to achieve economies of
scale. CSC became an efficient and profitable producer, making Taiwan a major steel
exporter.11 In Korea private conglomerates or chaebol were encouraged to enter the industry
and expand capacity in the heavy industrialization drive that began in 1973. Pohang Iron and
Steel Company (POSCO) was established during this period as a state enterprise with access
to credit on favorable terms. Again, these large scale integrated steel mills were built using
the most up to date equipment and technology in contrast to the U.S. industry which had
expanded capacity in the 1950s prior to the development of continuous casting and the basic
oxygen furnace. These developments made it possible for the newcomers to displace U.S.
exports in third markets but also to compete effectively in the U.S. market itself.
Korea, for example, was in 1975 a marginal producer of just 2 million tons of crude
steel per annum. However, by 1980 production had increased more than four-fold to 8.6
million tons and by 1990 had increased nearly three-fold again to 23 million tons, larger than
France and the United Kingdom. At the same time Korean domestic consumption of steel
was 3 million tons in 1975, 6 million tons in 1980 and 18 million tons in 1990 allowing it to
shift from being a net importer to being a significant exporter.12 POSCO became the flagship
of the Korean steel industry. The Koreans soon emerged as the second largest exporter of
steel after Japan. Faced with the rapidly growing, more efficient production in East Asia, the
integrated sector of the U.S. steel industry was under pressure from rising import penetration.
9 Crude steel production figures are from World Resources Institute (1992: 321). 10 Wade (1990: 99) states production came on line in 1974, Baldwin, Chen and Nelson (1995: 171) date the first production from 1975. 11 Wade (1990: 100) supports the view that CSC had a virtual monopoly in the domestic market. Minimills producing specialty steel of high quality have had a presence in Taiwan, but were reliant on basic steel input from CSC. CSC was able to strictly control imports of steel and even the state-owned shipbuilding enterprise was unable to circumvent CSC in order to obtain cheaper imported steel (Wade 1990: 131). 12 World Resources Institute (1992: 131).

6
The response was to seek trade remedies in order to fend off the foreign challenge in the U.S.
domestic market.
C. Trade Protection and Structural Change in the U.S. Steel Industry13
By the latter half of the 1960s, Japanese steel was making substantial inroads in the
U.S. market and in 1968 such imports rose to a volume of 7.5 million tons, prompting the
U.S. industry to demand passage of quantitative limits on steel imports. The Johnson
Administration responded by negotiating “voluntary restraint agreements” (VRAs) that
limited Japan to a volume of 5.8 million tons per year with 5 per cent annual expansion in the
quota limit for a three-year period. The business cycle downturn that began in 1969 and
continued into 1970 in the United States, however, substantially reduced demand and imports
from Japan fell to less than 20 per cent of the quota.14 The economic recovery in 1971 led to a
renewed surge in steel imports and Japanese exporters not only filled their quota, but made
use of the allowance in the VRA to carry forward the unused quota from the previous two
years. This led the Nixon Administration to negotiate a three-year extention of the VRAs
under tighter restrictions. However, when these lapsed in 1974, there was an even greater
surge in imports and in 1975, a recession year, domestic production fell while imports rose by
60 per cent. This prompted the industry and unions to mount an all-out campaign for relief
from import competition characterized by the filing of antidumping petitions and a campaign
against “unfair” trade aimed at winning the support of Congress and the public at large.
The integrated steel producers in the United States were not only under pressure from
imports but were also experiencing new domestic challengers for market share in the form of
minimills that made use of electric furnaces and continuous casting. The latter technology cut
costs by eliminating several steps in the production process. Furthermore, the minimill sector
made use of non-union labor and expanded production in regions outside of those that were
served by the integrated mills. Minimill production, in addition to low-cost imports from East
Asia and Europe provided efficient alternatives to the production of the integrated but
13 Baldwin, Chen and Nelson (1995) provide an excellent discussion of the adjustment of the U.S. steel industry in response to changes in labor-management relations, technological change, and increasing import competition during recent decades. Hufbauer and Goodrich (2001) provide a succinct summary of the protective measures taken over the course of three decades leading up to the Section 201 safeguards of 2002 and also comment on recent trends in productivity and U.S. steel demand. Brook (1998) provides an interesting discussion of the political economy issues involved in U.S. steel trade disputes. These sources provide references to the broader literature on the U.S. steel industry. 14 See Baldwin, Chen and Nelson (1995: 165).
7
antiquated large scale U.S. producers. Hence, structural change and improvements in
productivity clearly had become essential for the survival of the large-scale integrated sector.
The trigger price mechanism (TPM) was the latest innovation in the effort to
accommodate the steel lobby without alienating important U.S. allies such as Japan. In the
latter 1970s, the steel industry filed antidumping petitions so numerous that they threatened to
overwhelm the capacity of the Carter Administration’s trade authorities. In addition, the steel
industry was successful in establishing the Congressional Steel Caucus with over 150
members from the house and senate. Opposition to steel imports was also mobilized through
“buy America” campaigns. 15 The efforts to restrict imports of Japanese steel against a
backdrop of large Japanese current account surpluses and mounting U.S. current account
deficits threatened to result in outright quantitative restrictions.
Import penetration, plant closures and layoffs led to increased protection in the form
of “fast-track” antidumping measures through the trigger price mechanism and to successive
rounds of export restraint agreements (Brock, 1998: 137). The idea of the trigger price
mechanism was to establish a reference price based on the constructed value of the most
efficient producers of the products in question. Any imports priced below the reference price
were considered to be “dumped” and fast-track antidumping investigations would be
immediately launched, with duties rapidly assigned equal to the calculated margin of
dumping.
Japanese steel exporters were prepared to accommodate the United States and were
even willing to consider “orderly marketing arrangements” for steel along the lines of the
Multi-Fiber Arrangement (MFA) that governed market access in textiles and apparel. The
TPM succeeded in reducing imports’ share in U.S. apparent consumption, and in raising
domestic steel prices, capacity utilization and profit. These gains, however, were short-lived.
By 1980, a new round of industry antidumping petitions (this time directed against European
producers) scuttled the first TPM and led the Carter Administration to hike the new TPM by
12 per cent and to alter the rules regarding the conversion factor in determining prices and
dumping margins. Even this failed to satisfy the industry and a new round of antidumping
petitions and countervailing duty cases resulted in 1982. The new Reagan Administration
15 Frank (1999: 221) points out that the “Buy American” campaign gained momentum after 1967, especially between 1978 and 1981, and that in 1990 35 states had Buy American laws. The steel industry was behind this effort. For example, in 1981 18 states passed such laws and 8 of these mandated only the purchase of U.S.-produced steel.

8
undertook negotiations that resulted in VRAs involving the Japanese and European producers
that would regulate imports until 1992.
While these VRAs were formally enforced over Japanese and European producers,
the United States brought “informal” pressure to join the VRAs on upstart producer/exporters
from Taiwan—CSC, and Korea—POSCO, beginning in 1986. It appears that CSC complied
as exports were reported to have doubled from 1985 to 1986 only to be cut back to 1985
levels in 1987 (Baldwin, Chen and Nelson, 1995: 171). These informal VRAs were
augmented by antidumping and countervailing cases from time to time in both the 1980s and
1990s. During the two decades, dramatic improvements in productivity were realized in the
U.S. steel industry that brought output per man-year worked more or less into line with that
of Japan. Obsolete plants were closed and employment in the integrated steel mills was cut
drastically.
Hufbauer and Wada (1999) provide some data on longer-term trends in the industry:
employment which totaled 521,000 in 1974 fell to 163,000 in 1997 (just before the present
steel crisis began) and fell further to 142,000 in 2001; the share of production provided by the
dynamic minimill sector doubled between 1975 and 2000, reaching 45 per cent of total steel
output in the Unites States.16 Hufbauer and Goodrich (2001) report that output per man-year
increased by 50 per cent in the decade of the 1990s from 400 tons to 600 tons. Lindsay,
Griswold and Lukas (1999) report that total production of steel in the United States rose from
a low of 61.6 million tons in 1982 (when the VRAs were introduced) to 89 million tons in
1993 and further to a peak value of 105.9 million tons in 1997 just before the recent crisis
broke out.
Import penetration in the U.S. iron and steel market (ISIC 371) rose from 13.6 per
cent in 1988 to 15.7 per cent in 1994 but fell back to 14.0 per cent in 1997 (James and
Movshuk, 2001). A statistical test indicates there is no significant trend in world import
penetration in the U.S. apparent consumption of iron and steel between 1988 and 1997, but
there is a negative and significant trend in import penetration from Japan in apparent
consumption of steel over the same time period.17 Imports from Japan, Korea and Taiwan
together were only 4.2 per cent of U.S. apparent consumption in 1988 and fell to just 2.2 per 16 Hufbauer and Wada (1999) report that a ton of hot-rolled steel can be produced at a cost of $315 by a minimill compared with $350 in an integrated mill. With the growth of the efficient minimill sector and productivity gains in the integrated mills the manhours required to produce a ton of steel declined from nine to four between 1980 and 1998 (Lindsey, Griswold and Lukas, 1999: 7). 17 James and Movshuk (2001) provide the estimates of import penetration and tests for significance of trend.

9
cent in 1997, the year before the present “crisis” commenced. These shares must have
increased in 1998 with a dramatic increase in U.S. import volume from Japan of over 4
million tons, from Korea of 1.8 million tons and from Taiwan of 300,000 tons in 1998
compared with 1997.18 However, in 1999 import levels fell back nearly as dramatically as
they had risen: by 3.5 million tons in the case of Japan and by 400,000 tons in the case of
Korea. The volume of imports from Taiwan continued to rise but accounted for only 2.7 per
cent of total imports.
The United States reduced the volume of its steel imports from Russia by over 4
million tons in 1999 compared with 1998. The reason for the sharp decline in imports is not
immediately decipherable as numerous antidumping petitions were filed in these two years, a
steel quota bill was passed by the house but was narrowly defeated in the Senate and the
administration negotiated a voluntary restraint agreement with Russia. Even though U.S. steel
imports rebounded in 2000, they remained well below the volume reached in 1998 and in
2001 imports fell by over 5 million tons in the first half of the year compared with the same
period in 2000.
Despite this, the pressure on the administration and Congress to increase protection
mounted with mill closures, bankruptcy filings and layoffs of thousands of steel workers.
Although the preferred solution of the integrated steel industry of introducing strict quotas on
imports and negotiating a global agreement to end subsidies and reduce excess capacity has
not been realized, it is significant that Section 201 of the Trade Act of 1974 has been used
and that safeguards have been put in place for a three-year period from 2002 through 2004.
The use of safeguards indicates an escalation of the efforts of the U.S. government to restrict
steel imports compared with more selective protection through antidumping.
D. Policy Issues to Consider in Recent Steel Trade Disputes
Under the General Agreement on Tariffs and Trade (GATT), a Safeguard Provision
(popularly known as the Escape Clause) was introduced in Article XIX based upon a similar
clause found in the 1943 Reciprocal Trade Agreement that the United States negotiated with
Mexico.19 The insertion of an Escape Clause into the GATT was intended by the U.S.
18 These data are from the homepage of the USITC: http://dataweb.usitc.gov/. 19 Trebilcock and Howse (1999: 227); they provide a detailed discussion of the controversies surrounding Article XIX.
10
executive branch to allay fears in Congress regarding the GATT trade liberalization. 20
Countries employing safeguards may select to use either tariffs (article 5) or quotas (article 9)
and in the former case the tariffs shall apply to all sources of imports, while in the latter the
quota allocation is determined by the share of each exporter in a previous representative
period. All that is required of a contracting party to invoke safeguards was to show that
imports were increasing either absolutely or relative to domestic demand or consumption and
that this increase had been unexpected or unforseen. The injury test was terribly vague and, in
any case, no proof of causation running from increasing imports to injury or threat of injury
was required.
Proponents of the safeguard escape clause have argued that it is useful as a safety
valve and leads otherwise hesitant countries to offer lower and more tariff bindings than
otherwise. Furthermore, the presumption that safeguards require the country invoking the
escape clause to provide compensation to the exporting countries limits the spurious use of
Article XIX.21
The compensation requirement and the issues surrounding the right to use safeguards
selectively had led to some controversy within the GATT regime,22 but these issues were
largely settled with the Uruguay Round Safeguards Agreement. First, the compensation
principle is retained. However, if the safeguards are withdrawn within a three-year period, the
right of exporters to compensation is withheld. The Uruguay Round Safeguards Agreement
(URSA) also compromised on the issue of selectivity, allowing some relaxation of the
principle of non-discrimination so that developing countries are excluded from the safeguard
as long as they are minor exporters (under 3 per cent of import share). The URSA also made
“grey area measures” (voluntary restraint agreements) illegal and all such existing measures
had to be ended before the end of 1999 (among contracting parties). The other improvements
introduced by the URSA include putting strict time limits on safeguards (maximum of 4 years
with possible extension in the case of serious injury for an additional 4 years), improvement
20 Article XIX is not the only escape clause in the GATT. Articles XII and XVIII (b) allow developing countries to restrict or control imports for reasons of balance-of-payments problems. 21 Compensation, while limiting the inappropriate use of Article XIX, may also reduce the chance that it will be used at all. Hence, it is unsurprising that antidumping, countervailing duties and export restraint agreements have been more popular. The latter methods also provide for selectivity in application of the protective measure. 22 When Japan acceded to the GATT in 1955, some contracting parties wished to invoke selective safeguards only against “injurious” exports from Japan rather than to put in place generally protective measures (Trebilcock and Howse, 1999: 234).
11
in the definition of injury (evidence of lost sales, employment, profit, plant closures, etc.),
and improved requirements for notification and surveillance of the safeguard measures.
The decision of the U.S. administration to use the escape clause in 2002 to protect the
domestic steel industry needs to be explained and analyzed in some detail. The use of
selective measures under Title VII (antidumping–AD & countervailing duties–CVD) has not
succeeded in preventing plant closures and layoffs. These types of measures harass exporters
and were more successful when they led to export restraints (as discussed above). However,
under the Uruguay Round Agreement grey area measures had to be phased out among
contracting parties by year end 1999 and can only be used against non-member states.
Following the surge in steel imports in the United States that took place in the wake of
the Asian financial meltdown of 1997, there was intensified pressure brought to bear by the
steel industry lobby for greater protection than allowed under current U.S. trade laws. The
industry wished to invoke strict quantitative restrictions in the form of import quotas (along
lines of the MFA which had long protected the U.S. textile industry). The Visclosky bill
which would have imposed quotas on steel imports passed the House of Representatives by
289-141 in March 1999 and was strongly opposed by Clinton Adminsitration trade officials
who argued it could lead to a trade war. Ironically, as this bill was moving ahead, steel
imports had already begun to recede and steel prices to rise. As an alternative, Charlene
Barshefsky called for a strengthening of current U.S. trade laws, particularly Section 201. In
the end, the Senate defeated the quota bill but moved to strengthen U.S. trade laws.
The protective effect of antidumping was increased after the Clinton Administration
signed into law the amendment that Senator Robert Byrd of West Virginia (a steel state)
championed. This change in the law transfers antidumping duty receipts from the Treasury to
the complainant industry (which could lead to transfers to industry of up to $200 million per
year). Hence, the industry not only derives rent from the tariff protection but also from the
tariff collection. The change in U.S. antidumping law was immediately challenged in the
WTO by the EU, Japan and Korea.
One of the key points in analysis of the new Bush Administration’s choice to use
Section 201 is the fact that West Virginia, Ohio and Pennsylvania swung away from the
Democrats and Al Gore in 2000 after Clinton threatened to veto the Visclosky Steel Quota
Bill late in 1999. During his campaign, candidate Bush had promised to protect steel
producers and workers in these three states and in 2002 the congressional seats in these states
12
were up for grabs in the mid-term election. Safeguards had been discussed as an alternative to
antidumping as a remedy for the problem in several influential circles. For example, the
Federal Reserve Bank of New York published an article in its Current Issues in Economics
and Finance in August 1998 that argued for safeguards over antidumping measures
(Klitgaard and Schiele, 1998). Charlene Barshefsky is quoted in the financial press (The
Daily Yomiuri, March 25, 1999: 16):
“The steel crisis has demonstrated that there is room for improvement in our trade
laws, and particularly to Section 201, to ensure that they deliver strong, effective
relief in an expeditious manner.”
In addition to the focus on Section 201, a major effort was made to achieve an export
restraint agreement with Russia. A preliminary agreement to fix minimum prices and to cap
exports was reached in early 1999 but was objected to by industry leaders and by key
senators such as Jay Rockefeller of West Virginia. However, in July of 1999, a last minute
deal was reached that limits Russia to exports of $600 million of hot-rolled steel and the same
amount for cold-rolled steel through 2003.
Meanwhile in the WTO, the United States suffered several setbacks in panel rulings
pertaining to antidumping measures: in 2000 there was a WTO finding that the U.S.
antidumping law of 1916 contained provisions for penalties (including fines and
imprisonment of foreign producers found to be selling at prices below market value) that
were illegal under the global trade rules. In 2001, a WTO panel ruled against U.S.
antidumping duties on steel imports from Japan ruling that the U.S. Department of
Commerce wrongly refused to consider information provided by Japanese steel producers.
The Byrd amendment to U.S. antidumping law is also currently under challenge. Under these
circumstances and faced with mounting layoffs and plant closures during a year of
congressional elections, it can be understood why the administration decided to invoke
Section 201 and impose more general rather than highly selective duties on steel imports.
We next consider the level of duties and the exclusions, including the exemption of
steel products from NAFTA partners in evaluating the likely impact on East Asian producers
and markets. The decision was to impose duties for a three-year period on ten types of steel
products. In making this decision, the United States has to reduce the level of tariffs
progressively each year. For the following items, tariffs of 30% in 2002, 24% in 2003 and
18% in 2004 will be imposed: certain flat products, including slabs and finished flat products

13
(plate, hot-rolled sheet, cold-rolled sheet and coated sheet)23; hot-rolled bar; cold-finished
bar; and tin mill products. For the following items, tariffs of 15% in 2002, 12% in 2003 and
9% in 2004 will be imposed: rebar; certain welded tubular products; stainless steel bar; and
stainless steel rod. Tariffs of 13% in 2002, 10% in 2003 and 7% in 2004 will be imposed on
carbon and alloy fittings and flanges. Finally, tariffs of 8% in 2002, 7% in 2003 and 6% in
2004 will be imposed on stainless steel wire. These products account for roughly 80 per cent
of U.S. steel production (Associated Press, October 24, 2001).
Most developing and transitional countries are on the exclusion list.24 However,
China, Korea, Taiwan, and Malaysia are included in the safeguard action as are all developed
countries outside of NAFTA. NAFTA members are excluded, despite their relative
importance in U.S. steel imports. For certain products, some developing and transitional
countries are included: for slabs and flat products, Brazil; for carbon flanges, India, Thailand
and Romania; for rebar, Moldova, Turkey and Venezuela; and for welded pipe, Thailand.
The impact of the U.S. safeguards on world trade and prices in steel will likely be to
cause significantly larger flows of lower priced steel to be shipped to markets with low
protection such as in Japan and East Asia. In the year 2000, ten countries shipped at least one
million tons of steel to the United States. Two of those: Canada with 5.17 million tons and
Mexico with 3.18 million tons are among the top three suppliers. Their exclusion will
certainly cushion the impact of the safeguards on international trade in steel outside North
America. All the other big suppliers with the exception of Brazil to the United States are,
however, included in the Section 201 for all relevant products. They are: Korea—2.9 million
tons (year 2000 shipments to the United States); Japan—2 million tons; Germany—1.9
million tons; China 1.7 million tons; Russia—1.5 million tons; Taiwan—1.3 million tons; and
Ukraine—1.2 million tons. Other major Asian suppliers into the U.S. market are India—1
million tons; Thailand—0.5 million tons; and Indonesia 0.3 million tons. In these cases,
except for the products mentioned above, the safeguards do not apply. However, in recent
years there have been rather large increments in shipments into the U.S. market and these
have led the United States to impose antidumping measures.25 It will be difficult to foretell
23 Slabs are regulated by a tariff-quota, with tariffs on over-quota shipments. The quota limit is also increased each year from 5.4 million tons in 2002 to 5.9 million tons in 2003 and 6.4 million tons in 2004. 24 The U.S. exclusion list is based upon a list of GSP—Generalized System of Preferences beneficiary countries. 25 For example, in 2001 the U.S. Department of Commerce requested an antidumping duty of 47.86% on hot-rolled carbon steel produced by PT Krakatau Steel, an Indonesian state-owned enterprise and, on top of the
14
precisely how much steel will be diverted to East Asia by the U.S. safeguard and at what
prices.
Much will depend on the response of the European Union to the safeguard. It is
unlikely the European Union will stand by as the market of first resort for the increased
volume of steel released from the U.S. market. The European Union itself collectively
shipped nearly 14 million tons of steel to the United States with a value (using 2000 as a
representative year) of over $4.5 billion, much of which will be adversely affected by the
safeguards. Furthermore, if the European Union raises tariffs on steel in its own market in
order to prevent the excess from the U.S. 201 action flowing in, then East Asian steel markets
will come under pressure.
Some simple arithmetic allows us to shed some light on the implications of the
safeguards for East Asian steel markets and producers. Canada and Mexico account for over
8 million tons of shipments to the United States (using 2000 as a representative year). Their
exclusion from the safeguard has the effect of preventing that much more steel from entering
the international market, but also provides Canadian and Mexican producers an opportunity
to expand their market share in the United States at the expense of large East Asian producers
and those in the European Union. The other major suppliers that are not excluded, including
the European Union, South Africa and Australia, account for around 20 million tons out of a
world total of 36 million tons shipped to the U.S. market (again using 2000 as a
representative year). In value terms the leading suppliers affected by the Section 201 case
shipped $9 billion worth of steel in 2000 compared with total U.S. steel imports of $17
billion (Canada and Mexico accounted for $4 billion). In volume terms over 55 per cent of
shipments to the United States may be affected (in value terms about 53 per cent may be so
affected).
The obvious point is that U.S. steel protectionism has global implications and East
Asian steel producers will almost certainly face lower margins, greater import competition
and related pressures to restructure or retrench, including closures of marginal producers and
layoffs. Fortunately, the United States is relying on price-based protection rather than
quantitative restrictions so that the global steel glut resulting from U.S. Section 201 will force
out the marginal producers first.
antidumping duty imposed a countervailing duty of 10.21%. The International Trade Commission (ITC) ruled in favor of the petitioners (finding the “dumped” steel to have caused injury) but reduced the antidumping duty.
15
The response to the U.S. safeguards of the European Union will be watched with great
interest by East Asian steel producers and their employees. Our conjecture is that the
European Union will raise its own barriers to avert an in-flow of steel imports, thereby
shifting the burden of adjustment elsewhere. (See the next section for a discussion of the
impact of U.S. antidumping measures on East Asian exporters in the wake of the 1997 Asian
financial crisis.) East Asian governments will no doubt be confronted with some difficult
decisions as a result. The strategic objective of the U.S. safeguards may be to force the major
players in global steel production and trade to reconsider their position regarding a
multilateral steel agreement. The prospects for such an agreement, however, are not very
good and the outcome of the U.S. decision to protect its integrated steel sector could have
unintended consequences for global trade.
East Asian policymakers have several choices to make in response to the Section 201
safeguards. First, they may choose not to respond immediately, but to wait and see what
impact there is on their own producers and consumers. Consumer countries like Singapore
and Hong Kong can enjoy discounted supplies of imported steel. Second, they may choose to
retaliate against the U.S. action. This is the likely course for major producer-exporter
countries. The method of retaliation will then have to be chosen. One possiblility is to
challenge the 201 Safeguards in the WTO (the European Union is likely to pursue this as part
of its overall strategy). Another is to threaten to impose restrictions of equal value to the
losses of exports in the U.S. steel market, though doing so is not an automatic option under
the URSA (unless the United States extends the 201 safeguards beyond the presently
contemplated three-year period). A third option is to raise protective barriers in the steel
sector (depending on tariff bindings if MFN tariffs are to be raised) but also through
antidumping or countervailing duty measures. A fourth option is to choose to cooperate and
to work towards a renewed negotiation for a Multilateral Steel Agreement (MSA). There are
a number of major issues that would need consideration in launching such a negotiation. For
one, would it be undertaken under the WTO umbrella or outside of it? If inside the WTO,
how would the interests of major non-member producers such as Russia and Ukraine be
accommodated? If outside the WTO, would the agreement focus on reducing excess capacity
or upon trade remedies along lines of the defunct multi-fibre agreement (MFA)?
These options are not exclusive and the choices made will depend crucially on each
country’s particular circumstances. The invocation of safeguards adds another layer of

16
protection to existing protection through MFN tariffs, antidumping measures and
countervailing duties and export restraint agreements. It raises the bar further for emerging
market steel producers such as Ukraine and Kazakhstan. The U.S. safeguard action is strictly
time delimited but this is not true for antidumping measures, despite the “sunset review”
required by the WTO after antidumping duties have been in place for five years.26 In fact, as
of July 2002, over 75 per cent of steel product antidumping measures placed under sunset
review resulted in affirmative decisions to keep antidumping measures in place.27
Hence, even after the safeguards are lifted, antidumping measures dating from the
outbreak of the latest crisis from 1998-2001 will be in place to protect U.S. integrated steel in
many products for most sources of imports. How valid the findings of these antidumping
rulings are in the case of Japan and other East Asian countries is the subject of the following
sections of the chapter. Empirical analysis of trade, consumption and production as well as
movements in relative prices is conducted with this question in mind.
II. Trade in Iron and Steel: Import Surges
This section examines certain patterns of world steel trade, with a focus on U.S.
imports and East Asian exports to the United States. We also examine the diversionary
impact U.S. AD duties have had, especially those initiated in the wake of the 1997 Asian
financial crisis.
Claims of dumping in the U.S. steel market by the steel industry against imports are
far from new and are viewed by many largely as a purely protectionist move, as noted in the
previous section. Furthermore, the evidence in favor of truly strategic dumping on the part of
U.S. trading partners is often “economically unjustified” (Prusa, 1999), and more likely
results from extreme exchange rate changes, and excessive capacity due to locally and
regionally depressed demand conditions. However, one can still often find clear evidence of
dramatic surges in certain steel products that ultimately elicit antidumping claims. Thus, to
the casual observer the AD actions may seem valid. A look at Table 1 gives us some idea of
this. The shaded rows depict rapid increases in exports to the United States, particularly on or
around the time of the Asian financial crisis. In the case of Japan, Korea, and Taiwan exports
26 The Sunset Review process under U.S. law is rigged so that the presumption is that dumping will recur and, hence, it is likely most definitive measures will be kept in place indefinitely (Moore, 1999). 27 Data are from the USITC homepage: (http://usitc.gov).
17
to the United States more than doubled, a year-on-year increase of over 100%. Russia and
India have also doubled exports (though this trend seems to have begun to prior to the crisis)
and continued to see rapid growth until being slapped by U.S. antidumping suits coupled with
the U.S. slowdown in 2001.
Other large exporters to the United States such as Canada, Brazil, Mexico, France, et
al. seemed to have kept levels fairly flat. Interestingly, China also seems to have shown some
restraint in exports to the United States during 1998, though imports from China nearly
tripled between 1997 and 2000.
A. Shifting Excess Capacity during the Asian Financial Crisis
We can tell a more focused story of how the Asian financial crisis likely led Japan and
others to “dump” steel on the U.S. market if we look at Table 2. As we can see, Japanese
exports of hot and cold-rolled steel to the United States rose dramatically from 1997 to 1998.
(We focus on hot and cold rolled steel here, as it is a large category, accounting for about
20% of U.S. iron and steel imports in 2000, and is the target of the most recent high profile
antidumping suits levied against exporters to the United States.) Then, in 1999 and 2000, the
per cent of Japanese exports of rolled steel to the United States dropped to virtually nil.
It should come as no surprise that the United States filed antidumping suits against
Japan in October 1998 (for hot-rolled) and June 1999 (for cold-rolled). One can clearly see
the effects in Table 2 where there is a sharp drop in imports from Japan at that time. The
United States continues to levy AD duties of up to 30% against Japanese and other imports.
(See section III for a more detailed discussion of recent AD actions.)
The data are also clearly consistent with the story presented earlier in the chapter that
as demand in Asia collapsed Japanese (and other Asian) producers sought other markets for
their surplus steel. America, with relatively strong growth, was one such market. (See Table 3
for GDP growth rates of the United States, Japan and Europe during the late 1990s.) Looking
at the columns for the U.S. and the NIEs in Table 2, we see that in 1997 NIEs represented
approximately 44% of Japanese exports of rolled (hot or cold) steel, while the U.S. share was
not quite 11%. In 1998, the situation changed dramatically with the United States purchasing
36% of Japanese exports while the share of the NIEs fell to 22%.
If we look at the data for 1999, when Asian countries began to bounce back, the NIEs’
share returns to its historic value, whereas for 1999 and 2000 the share of the U.S. is still

18
virtually zero. This is in direct response to the massive threats of AD measures against Japan
(and other producers) by the United States during this time as well as the U.S. slowdown.
Interestingly, though the share of exports going to Europe did more than double in
1998, the total amount is negligible. Japan exports virtually no (about 2%) rolled steel to the
European Union and over 85% to APEC countries. It does appear that the United States is the
dumping ground for excess capacity rather than other strong economies in Europe. Hufbauer
and Wada (1999) suggest that informal cartels in both in Europe and Japan prevent freer
market access for U.S. and other foreign steel producers.
B. Prices
As we can see from Figures 1 and 2, the dramatic change in Japanese export prices in
hot and cold-rolled steel help explain part of the story of how Japanese exports to the United
States rose sharply following the Asian financial crisis.28 Japanese export prices have fallen
both relative to Japan’s own domestic wholesale prices and U.S. import prices from all
countries. Prior to the Asian financial crisis, Japanese wholesale prices were, in fact, rising
relative to export prices as well as U.S. import prices. Also note that the WPI for both
products in Japan is very flat. The U.S. import price indices are also stable relative to the
wide swings in the price of Japanese exports of steel.
These price swings (coupled with rapid increases in exports to the United States) are,
of course, consistent with either “sporadic dumping” (Chacholiades, 1990) from
overproduction in the wake of unanticipated demand shifts or dumping as a result of price
discrimination in a monopolistically competitive market. (For a very simple model, see
Krugman and Obstfeld, 2000; for a more sophisticated model see for Brander, 1981.)
Such a drop in the export prices from Japan to the United States is also wholly
consistent with pricing-to-market behavior (see Marston, 1990). Note that in Figures 1 and 2
the U.S. import price (which uses a U.S. dollar base) does not fluctuate very much, while the
yen-based export prices exhibit wide swings. If we look at Figure 3 which tracks the
28 These series are indices that have been scaled to 100 in 1995. From this we can observe changes in levels of each series, but actual prices (unit values) may be higher or lower and cannot be determined from these figures. Thus, for example, per unit prices for Japanese exports may have been higher or lower than U.S. import unit prices before and/or after the crisis. Because of varying (typically higher) quality of Japanese steel, simple unit price comparisons are not always as useful as relative price movements such as these.

19
movements in the yen-dollar exchange rate and the Japanese export pricing in, more broadly,
iron and steel, we can see visually that some sort of pricing-to-market is evident. Note, in
particular, the sharp appreciation of the yen (from approximately 143 yen to the dollar in July
of 1998 to 115 in August 1999) in the 1998-99 period and the nearly simultaneous drop in
(yen-based) export prices. That is to say, to maintain roughly the same price in dollars, it
would have been necessary to drastically reduce the yen price of steel during that time even
aside from any reasons of excess capacity.
C. Evidence of Pricing-to-Market
In Figure 3, it seems evident that the yen-based export prices move somewhat in
tandem with the yen-dollar exchange rate and would indicate pricing-to-market behavior. We
test this econometrically by determining whether or not the two series have a common trend
or, in other words, are cointegrated.29 We conducted a test for cointegration between the log
of Japanese exports prices of iron and steel and the log of the yen/dollar exchange rate for
monthly data over the 1995-2002 period. We found a strong positive long run co-movement
of the two series. (See Appendix for details.) That is to say, when the yen appreciates vis-à-
vis the dollar, the yen-based export prices to the world (and presumably to the United States)
fall. According to the pricing-to-market literature this is done (rationally and efficiently) to
retain market share in the U.S. and elsewhere and not for predatory reasons per se.
That pricing-to-market (PTM) is likely for Japan and other East Asian steel producers
should not be surprising. In the PTM literature, studies often find that Japanese firms engage
in considerable pricing-to-market behavior, and more so than say, U.S. firms (Marston,
1990.) Moreover, when examining Japanese export pricing behavior to the United States,
Asia, and the European Union, more pricing-to-market occurs in the U.S. market than any
other market (Sasaki, 2002). Therefore, we should not be surprised that East Asian, and in
particular Japanese steel producers, also price-to-market to a large degree. Therefore, this
must, at least in part, explain the ease in which antidumping suits against East Asian
exporters to the U.S. market can be constructed.
29 Loosely speaking, cointegration implies long-run co-movements of two or more series. Such analysis rules out possible spurious relationships which frequently occur with trending, or ‘non-stationary data’ such as time series. See Maddala and Kim (1998) for the theory of cointegration and a comprehensive survey of the literature over the past 20 years as well as current advances.
20
As described above, a very plausible story for the dramatic relative fall in Japanese
export prices is, of course, pricing-to-market behavior. Additionally, the slight drop in the
Japanese WPI is likely due to the drop in aggregate demand in Japan (-1.1% GDP growth in
1998; see Table 3) and in the region in 1998. Thus, given the short-term fall in demand and
prices in Asia, as well as the sharp yen appreciation in the mid-1990s, it is only natural that
Japanese firms, seeking to avoid layoffs, and high shutdown costs would be forced to seek
other markets, and sell their wares (perhaps) at a discount to do so.
Therefore, one can see how it might be easy for a U.S. steel firm to find data to
validate claims of dumping which is defined as either by selling below average cost, or from
data such as these, pricing below one’s one domestic market price. If we again look at
Figures 1 and 2 we see that the drop in relative prices, which began shortly before the crisis
but really picked up steam in mid-1998, is ultimately about 20% lower than the overall U.S.
import price index and indeed Japan’s own domestic prices. Thus 20-30% dumping margins
currently in effect seem roughly consistent with these movements.
This is not to justify the AD actions, as it seems clear from the data that regional
demand conditions and exchange rate movements were the likely culprits, rather than
predatory dumping. Yet, it demonstrates the ease in which dumping can be validated under
the rough and economically unsound dumping criteria that exist.
D. The Overall Picture
The above-mentioned data on import values and prices in the United States gives AD
proponents ample anecdotal evidence to support their view. However, we hope the above
data have also shown that the likely explanation for the dramatic increases in exports of steel
from East Asia to the United States was the Asian financial crisis, which drove many South
East and East Asian economies into negative growth, as well as associated exchange rate
movements. Also, Japan’s own sluggish growth over the past ten years has forced Korea,
Japan and newer big players on the world market such as Russia and India to more
aggressively target the U.S. market for their goods. Any claims that Japan, Korea, Russia et
al. are strategically dumping is not a likely story given the large number of exporting nations
in this post-cold war era.
Moreover, though there are certainly periodic surges in certain types of steel from
year to year which elicit claims of dumping, the overall pattern of import behavior in the
21
United States is far less dramatic. If we look at Figure 4, we see that overall imports are rising
as one would expect in a growing economy. However, it is not clear that foreign import
penetration is on the rise. If we look at Table 4, we see the apparent consumption of imports
did reach 17% in the 1998, but it has been almost as high before, reaching 16% in the mid-
1980s. The rise in import penetration may to be a cyclical phenomenon that, unfortunately,
elicits a cyclical increase in AD actions by the United States. As mentioned earlier in this
paper and by James and Movshuk (2001), there is no statistical evidence prior to 1997 of an
increase in apparent consumption of imported steel in the United States. It may be, in fact,
that AD measures and previous VRAs have held in check the growth of import penetration in
the U.S. steel market.
While imports may or may not be on the rise in relative terms, steel jobs in the United
States have long been on the decline. However, rising productivity, high union wages, and
enormous pension liabilities, the so-called ‘legacy costs’ in the industry, are at the root of
declining jobs in the U.S. steel industry (see Hufbauer and Goodrich, 2001 and section one of
this chapter) rather than “unfair” trade.
Despite productivity increases and technological advances in the U.S. steel industry,
many newly industrialized countries have long had the same (or even superior) technology
than the U.S. firms, and lower labor costs. So, perhaps the increases in import penetration
will continue. One can reasonably expect that India (now the lowest cost producer for some
products), among others, may capture ever larger market shares in the United States. If the
current AD actions and counterclaims by Japan, the European Union, China and others in the
steel industry are not effectively resolved in the WTO (or unless the President and Congress
can find other compensatory schemes to eliminate legacy costs and excess capacity in U.S.
steel) we can only expect more of the same rent-seeking activities, not only against East
Asian producers, but Eastern Europe, Central Asia, and India as well.
22
III. Protective Responses: The Prevalence and Patterns of Antidumping Actions in
Steel Trade
While the recent spate of antidumping duties filed by the United States and other
nations in the steel industry is rightly gaining a great deal of attention lately, the use of AD
duties in the steel industry is not a new idea. The first use of an AD duty was, in fact, in the
steel industry in 1906. Perhaps surprisingly, it was not initiated by the United States but
instead by Canada, who accused the United States of unfairly dumping steel in the Canadian
market. The United States has traditionally been the main user of AD actions over the last
several decades, however, having enacted its first antidumping legislation in 1916 to protect
primarily against European imports (Prusa, 1999).
Between 1980 and 1988 411 AD investigations and 332 CVD investigations had
taken place in the United States alone. In the 1980s traditional users (Canada, New Zealand,
Australia, the United States, and the EC) accounted for 95% of the suits. This is no longer the
case and overall numbers have risen dramatically, particularly due to new users, such as
Mexico, Argentina and Brazil. From 1987 to 1997 over 2000 cases have been filed
worldwide. In 1997 the United States alone had 302 antidumping orders still in force and is
nearly matched by the European Union (246) and India (248). And some, perhaps unexpected,
new intensive AD users such as South Africa (156) have emerged (Prusa, 1999; WTO
homepage at: www.wto.org).
There has been an increase in AD measures use by countries in the East Asian region
as well. Japan has shown considerable restraint, initiating only two AD actions in the 1995-
2001 period, however. (Contrast with the U.S. figure of 255 over the same period.) Yet, for
other major economies in the region use seems to be on the rise. The number of AD
initiations from 1995-2001 for some select countries are as follows: South Korea: 47;
Taiwan: 6; Indonesia: 41; Malaysia: 17; Thailand: 5; and India: 247. Singapore and Hong
Kong apparently have not filed any actions. China has recently (May, 2002) written and
notified the WTO of its own domestic antidumping legislation (see www.wto.org). It will be
interesting to see whether China will mimic that of most other WTO members by initiating
frequent AD actions, or if it will instead demonstrate Japanese-style restraint.
In the 1990s, 2200 cases were filed worldwide, a decade-on-decade increase of 37.5%.
Perhaps this is not surprising given that successive GATT rounds have eliminated or severely

23
restricted virtually all other trade tools (discretionary tariffs, import quotas, export restraint
agreements, etc.) at least for most manufactured products in industrialized countries. Thus,
for many countries, particularly the United States, the AD duty is one of the only tools left.
A. Steel and Antidumping Actions
Iron and steel has been the major AD filing category in the United States and in the
world (see Miranda, Torres, and Ruiz, 1998). Of the United States’ 249 antidumping orders
currently in effect, over 120 of them are in the iron and steel category. Therefore, the future
of domestic antidumping legislation and WTO rulings will continue to have a large impact on
world trade in steel.
To be sure, though the media gives the steel rows quite a bit of press, the actual effect
of total AD actions overall on trade is fairly small. While AD suits have grown considerably
in the last two decades, they still cover only 2% of total U.S. merchandise imports. Still, the
trade diversion effects for any one product of such actions can be very large (and thus the
associated efficiency loss is large as well).
Prusa (1999) has examined the effects of U.S. AD action on U.S. imports. He found the
average “dumping margin” to be approximately 40% over the 1980-1994 period. The median
duty was 16%. Twenty percent of the cases had duties exceeding 50% and ten percent
exceeded 100% in duties. Additionally, Prusa finds that in cases where a case is “settled” or
an actual duty is assigned imports fall by 50-70% over the first three years. Even in cases
where the case is rejected, imports fall by 15-20%.
Casual inspection of import growth rates of major exporters of steel to the United
States seems to be consistent with Prusa’s overall findings. For example, if one refers to
Tables 5 and 6 which focus on hot and cold-rolled steel respectively, it appears that the mere
initiation of an AD suit (for example, against Japan and Korea) in the late 1990s had
dramatically reduced exports for that country to the United States. Actual imposition of a
duty reduced exports even further. That is to say, AD actions are very effective in reducing or
in some cases outright eliminating imports from a particular country.
If we look at other countries’ import patterns, the same general pattern emerges. That
is, following a dramatic rise in the imports of steel from a particular country, AD actions are
initiated which typically cause a drop in imports. This initiation is almost always followed by

24
assessment of a duty30 which brings about even larger declines in exports to the U.S. market.
(Rarely are “price undertakings” conducted in the wake of an AD initiation for steel products.
However, there may be a tendency for exporters to the United States to ‘voluntarily’ reduce
exports in the face of an initiation thereby implicitly raising the price to avoid further action
and thus achieving the same effect. This idea is intimately linked to the idea of the TPM.)
Also recall that AD duties are country (and firm) specific. Therefore AD actions not
only result in significant protection, but severe trade diversion as well. This trade diversion
was clearly present during the Asian financial crisis and was demonstrated in Table 2 of the
previous section.
If we look again at Tables 5 and 6, we notice that after a year or two of initiations
against (perhaps) the most egregious ‘offenders,’ more than half of the largest exporters are
targeted for AD actions in the steel industry. Having other ‘easy’ targets often only delays the
inevitable for the other major exporters.
It does appear that being a traditional user or member of NAFTA may help enable
some countries to stave off AD suits in some cases. However, there appears to be little
advantage in being from an East Asian economy. AD actions against Japan and Korea (and
China and Taiwan to some extent) seem to be quite persistent while for many “Western”
(France, the United Kingdom, New Zealand, etc.) countries the AD actions are not uniform.
This seeming bias could be for one of (at least) three reasons:
• East Asian producers are often the lowest cost producers and thus often appear as the
largest offenders and are easy perennial targets.
• The Finger conjecture (Finger, 1993) may hold, in that traditional users are better able
to fend off or pre-empt AD actions by the United States.
• Broader political or economic goals may be involved (NAFTA, for example).
With respect to the last reason, the “NAFTA effect” does appear to be real. That is to
say, because the United States., Canada and Mexico are neighbors and have an existing
framework to deal with trade issues between the three countries, AD actions between them
may be less likely.
30 These duties are relatively large. For the United States, steel AD duties averaged 26% in 2002 by the author’s calculation, with some duties exceeding 200%.)

25
B. Summary of Findings
The findings on antidumping actions by the United States in the steel industry are not
surprising. We find that:
• Antidumping duties are typically targeted at countries which experience dramatic
export growth to the United States in a short time, often on the order of 50-100%
increases in one year.
• The initiation of antidumping actions severely curbs imports to the United States from
the targeted country.
• The actual imposition of duties following an AD action results in even larger
decreases in imports, often much lower than pre-AD levels.
• There does appear to be some bias against Japanese and Korean exporters to the
United States. However, these two countries are often the lowest cost providers and
often have large sharp increases in exports to the United States, so AD actions, while
not warranted on economic grounds, are easily proven given the weak legal standards
that exist.
• There may be some evidence to suggest that traditional users are less often the target
of AD actions, at least for the steel industry.
• There also seems to be some anecdotal evidence that members of NAFTA are less
likely to initiate AD actions against each other in steel, despite the large trade volume
occurring in this product between these three countries.
• AD actions are on the rise in steel (and other products), both by the United States and
by new users (see www.wto.org for country and product specific examples) and
because of their strong diversionary (and potentially collusion facilitating) effects are
a danger to world trade and the health of the world economy.
It will be interesting to see how the newest antidumping actions in hot and cold-rolled
steel initiated in October of 2001 will develop. The counter sanctions threatened against the
United States by Japan and the European Union (and now along with China among other co-
complainants) in the spring of 2002 have not yet caused the United States to back down. Also,
China, a large steel producer and exporter has now entered the WTO. An important question
is whether China will increasingly become merely a target of AD actions in world steel trade,
26
or instead, become an active user of AD measures. If the Finger (1993) conjecture has any
weight, this strategy may allow China to become a more respected member of the world steel
“club” which, at least according to some observers, seems bent on collusion.
IV. Conclusion
The ease under U.S. trade law of complainants establishing that “dumping” has
occurred and the chilling effect this has on trade even without the finding of injury has been
documented (Prusa, 1999). The injury test required in establishing that “dumped” imports are
the cause is hardly rigorous. Finally, dubious accounting practices, including exclusion of
imports above cost and inconsistent treatment of depreciation in constructed cost, allow the
complainants to attain artificially high margins of dumping used in setting antidumping duties.
Once antidumping duties are in place, it is very difficult to remove them and the Sunset
Review reform introduced in Uruguay Round Agreement, while a positive step, is toothless
in U.S. antidumping law. The Byrd Amendment adds insult to injury by awarding the duties
paid to the complainant rather than the U.S. Treasury Department. While the focus has been
on U.S. antidumping law, much of the above applies to the European Union as well. Hence,
reform of antidumping in the new Doha Round is likely to attract support from export-
oriented economies in East Asia.
It is now well established in the literature that so-called “dumping” is almost always
consistent with competitive firm behavior and is rarely, if ever, of the “predation” variety.
The reasons for this are straightforward. Any firm in an established industry that attempts to
take a monopoly position in a foreign market through dumping would not only have to drive
out all domestic producers, but would also require protection against new sources of imports
and would have to be able to block new entrants in the domestic market. The monopoly could
not be sustained without the collaboration of the foreign government, hardly a likely outcome
under any foreseeable political economy model. The antidumping regime itself is
anticompetitive as it provides competing foreign and domestic firms with opportunities to
collude and fix prices. The outcome of antidumping definitive measures is to reduce the
volume of trade and raise prices thus harming consumers in the domestic market.
The erosion of the asymmetry in use of antidumping between the traditional users
(European Union, Canada, Australia, New Zealand and the United States) and other
27
contracting parties should serve as a caution. New users among the developing and
transitional economies are currently filing the bulk of new antidumping measures. Hence, the
traditional users may soon find themselves in a less favorable environment in facing
retaliatory investigations. An example of this took place recently when Taiwan’s authorities
began an investigation of U.S. semiconductor firms after they had filed antidumping petitions
against Taiwanese semiconductor producers. Ultimately, the findings were that the petitions
were without merit and were withdrawn. However, one can easily imagine a prisoner’s
dilemma where governments impose mutual antidumping duties.
Antidumping investigations and measures succeed in harassing trade, yet they have
failed to reverse long-term trends in employment and production in the U.S. steel industry.
(They may have succeeded in arresting the rise of East Asian steel import penetration in the
U.S. steel market, however.) The use of safeguards in the case of U.S. steel is an escalation of
the trade conflict in steel and puts the global trading system at some risk. One possible
interpretation of the safeguard action is as a strategic move to force other major producing
countries back to bargaining table over the MSA. However, the move will prove costly to
major U.S. trading partners in East Asia and may give them pause as to whether their best
policy option would lie in cooperation with the United States in a negotiation that may
ultimately impose long-term restrictions on exports as occurred previously in textiles and
apparel under the MFA. And what exactly are the costs of such an escalation?
Standard trade theory tells us that imposing a tariff results in a net loss for that
country so long as any terms of trade gains are negligible. While the United States certainly is
a large country and terms of trade gains are present, the likely outcome is still a net loss. The
terms of trade gain will only outweigh the deadweight loss when the tariff is small (Krugman
and Obstfeld, 2000). The current AD duties are not small, however, averaging 26 percent.
While no calculations were done for the current antidumping actions, the consumer
cost per job saved in the steel industry of the failed import quota scheme, the Steel
Revitalization Act, would have been very high, about $800,000 per job saved according to
Hufbauer and Goodrich (2001). And in this calculation this implicit rise in import prices was
only approximately 10% (a rise of $26 per ton). No doubt with AD duties averaging 26%, the
deadweight loss as well as the net loss to the U.S. economy is much greater. Additionally,
Francois and Baughman (2001) found that the costs of the Steel Revitalization Act would
cost two jobs lost in other steel-using industries (such as autos and heavy machinery) for
28
every job saved in the steel industry. Similar negative downstream effects on steel-using
industries are no doubt occurring under the current AD environment.
Finally, the costs to the exporters to the United States such as Japan, Korea, Russia,
Brazil, and many others must be considered. The exporters, who may not capture much of the
rents from the AD schemes, are also suffering from their diminished sales. In short, the losses
to the world are likely to be even greater than the estimates referred to above.
While the current AD actions target a very small portion of overall international trade,
the impact on the steel industry is quite significant, as over half the AD measures are in steel
products. This tit-for-tat AD escalation, especially in steel imports, may move the industry
closer to a more collusive quota scheme. While the current AD duties, and a possible move in
the direction of an MSA may benefit some of the steel firms (and to some extent labor in the
steel industry), the cost to the overall performance of economies in East Asia, North America,
Europe and the world would be much greater. Thus, meaningful reform of AD laws within
the framework of the WTO is paramount and solutions to the steel industry’s peculiar
problems such as excess capacity and ‘legacy costs’ must be found quickly.
References
Ashworth, William (1987), A Short History of the International Economy Since 1850 (Fourth
Edition). London and New York: Longman.
Associated Press (2001), “Steel imports harming U.S. industry: Panel,” The Jakarta Post,
October 24: 17.
Baldwin, Robert E., Tain-Jy Chen, and Douglas Nelson (1995), Political Economy of U.S.-
Taiwan Trade. Ann Arbor: University of Michigan Press.
Brander, James (1981), “Intraindustry Trade in Identical Commodities,” Journal of
International Economics, 11: 1-14.
Brook, Douglas A. (1998), “Steel: Trade Policy in a Changed Environment,” in A. Deardorff
and R. Stern, eds., Constituent Interests and U.S. Trade Policies. Ann Arbor: University
of Michigan Press.
Burnham, Walter D. (1981), “The System of 1896: An Analysis,” in P. Kleppner, et. al., eds.,
The Evolution of American Electoral Systems, Westport: Greenwood Press.

29
Chacholiades, Miltiades (1990), International Economics, McGraw Hill Publishing Company,
New York.
Cunningham, Richard O. (1998), “Trade Law and Trade Policy: The Advocate’s
Perspective,” in A.V. Deardorff and R.M. Stern, eds., Constituent Interests and U.S.
Trade Policies, Ann Arbor: University of Michigan Press.
Finger, Michael J. (1993), editor, Antidumping: How it Works and Who Gets Hurt, Ann
Arbor: University of Michigan Press, 1993.
Francois, Joseph F. and Laura Baughman (2001), “Costs to American Consuming Industries
of Steel Quotas and Taxes,” Washington: The Consuming Industries Trade Action
Coalition Foundation, June. Available at website at
http://www.citac.trade.org/latest/citac_steel_quotas_and_taxes_04_30_01.pdf.
Frank, Dana (1999), Buy American: the Untold Story of Economic Nationalism. Boston:
Beacon Press.
Hufbauer, Gary Clyde and Ben Goodrich (2001), “Steel: Big Problems, Better Solutions,”
Policy Briefs, Number 01-9 July 2001, Washington, D.C.: Institute of International
Economics. Available at website at www.iie.com.
Hufbauer, Gary Clyde and Erika Wada (1999), “Steel Quotas: A Rigged Lottery,” Policy
Briefs, Number 99-5 June 1999, Washington, D.C.: Institute of International Economics.
Available at website at www.iie.com.
Hufbauer, Gary Clyde (1999), “Anti-dumping: a Look at U.S. Experience, Lessons for
Indonesia,” mimeo, Washington, D.C.: Institute for International Economics.
Klitgaard, Thomas and Karen Schiele (1998), “Free versus Fair Trade: The Dumping Issue,”
Current Issues in Economics and Finance, Federal Reserve Bank of New York, 4(8),
August.
Krugman, P. and M. Obstfeld (2000), International Economics: Theory and Policy, 5th
edition, New York: Addison-Wesley Publishing.
James, William E. and Oleksandr Movshuk (2001), “International Economic Integration and
Competitiveness: An Analysis of Market Share in Manufacturing Industries in Japan,
Korea, Taiwan and the United States,” mimeo. An earlier version was printed as
Working Paper 2000-04 by the International Centre for the Study of East Asian
Development, Kitakyushu, Japan and may be downloaded.
(http://www.icsead.or.jp/data/2000-04.zip).
30
Lindsay, Brink, Daniel T. Griswold and Aaron Lukas (1999), The Steel “Crisis” and the
Costs of Protectionism. Trade Briefing Paper. Washington, D.C.: The Cato Institute,
April.
Maddala, G.S. and Kim, In-Moo (1998), Unit Roots, Cointegration, and Structural Change,
Cambridge, UK: Cambridge University Press.
Marston, R. C. (1990), “Pricing to Market in Japanese Manufacturing,” Journal of
International Economics 29(3/4): 217-236.
Miranda, Jorge, Raul A. Torres, and Mario Ruiz (1998), “The International Use of Anti-
Dumping,” Journal of World Trade, 32(5), August: 5-71.
Moore, Michael O. (1999), “Anti-Dumping Reform in the United States: a Faded Sunset,”
Journal of World Trade, 33(4), June: 1-18.
Okimoto, Daniel I. (1989), Between MITI and the Market: Japanese Industrial Policy for
High Technology. Stanford, CA: Stanford University Press.
Prusa, Thomas J. (1999), “On the Spread and Impact of Antidumping,” National Bureau of
Economic Research Working Paper no. 7404.
Sasaki, Yuri Nagataki (2002), “Pricing-to-Market Behavior: Japanese Exports to the US,
Asia, and the EU,” Review of International Economics, 10(1), 140-150.
The Daily Yomiuri (1999), “Clinton Cabinet hits bill to curb imports of steel,” March 25: 16.
Trebilcock, Michael J. and Robert Howse (1999), The Regulation of International Trade
(second edition). London and New York: Routledge.
United States International Trade Commission Homepage. 2002. (http://www.usitc.gov).
Wade, Robert (1990), Governing the Market: Economic Theory and the Role of the
Government in East Asian Industrialization. Princeton, NJ: Princeton University Press.
World Resources Institute (1992), World Resources 1992-93: Toward Sustainable
Development. A Guide to the Global Environment. New York: Oxford University Press
(in collaboration with the UN Enviroment Programme and the UN Development
Programme).
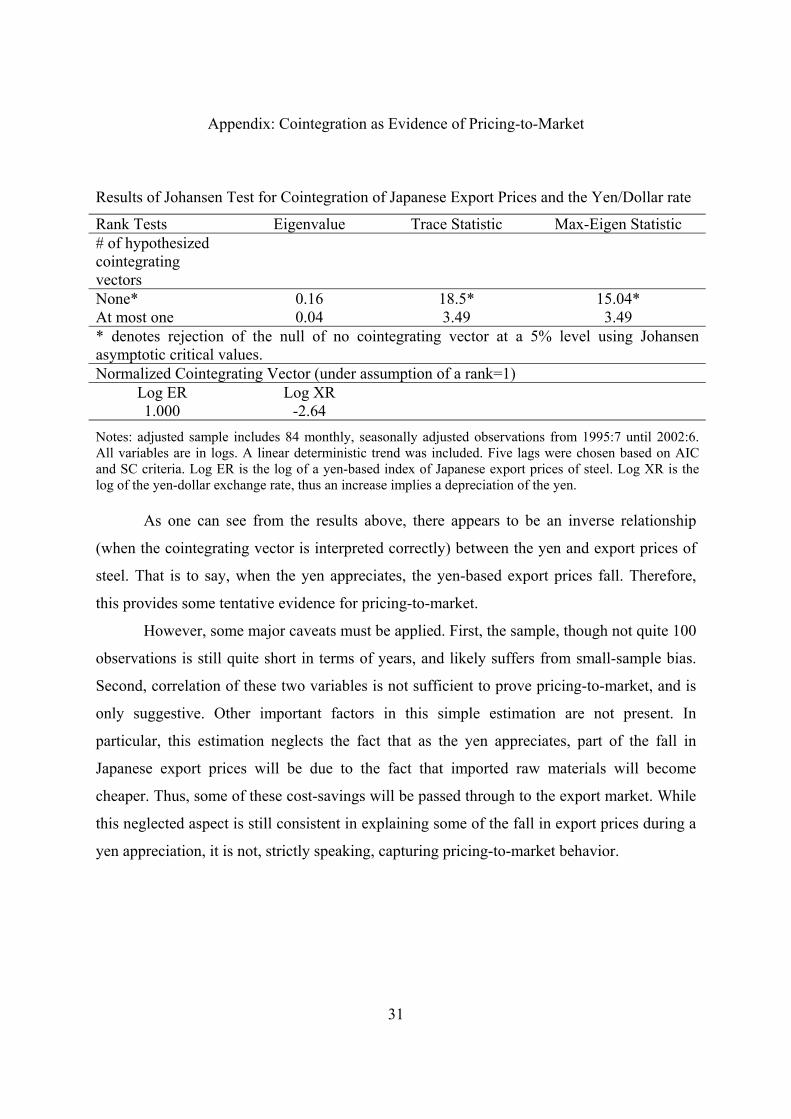
31
Appendix: Cointegration as Evidence of Pricing-to-Market
Results of Johansen Test for Cointegration of Japanese Export Prices and the Yen/Dollar rate Rank Tests Eigenvalue Trace Statistic Max-Eigen Statistic # of hypothesized cointegrating vectors
None* 0.16 18.5* 15.04* At most one 0.04 3.49 3.49 * denotes rejection of the null of no cointegrating vector at a 5% level using Johansen asymptotic critical values. Normalized Cointegrating Vector (under assumption of a rank=1)
Log ER Log XR 1.000 -2.64
Notes: adjusted sample includes 84 monthly, seasonally adjusted observations from 1995:7 until 2002:6. All variables are in logs. A linear deterministic trend was included. Five lags were chosen based on AIC and SC criteria. Log ER is the log of a yen-based index of Japanese export prices of steel. Log XR is the log of the yen-dollar exchange rate, thus an increase implies a depreciation of the yen.
As one can see from the results above, there appears to be an inverse relationship
(when the cointegrating vector is interpreted correctly) between the yen and export prices of
steel. That is to say, when the yen appreciates, the yen-based export prices fall. Therefore,
this provides some tentative evidence for pricing-to-market.
However, some major caveats must be applied. First, the sample, though not quite 100
observations is still quite short in terms of years, and likely suffers from small-sample bias.
Second, correlation of these two variables is not sufficient to prove pricing-to-market, and is
only suggestive. Other important factors in this simple estimation are not present. In
particular, this estimation neglects the fact that as the yen appreciates, part of the fall in
Japanese export prices will be due to the fact that imported raw materials will become
cheaper. Thus, some of these cost-savings will be passed through to the export market. While
this neglected aspect is still consistent in explaining some of the fall in export prices during a
yen appreciation, it is not, strictly speaking, capturing pricing-to-market behavior.

32
Table 1: U.S. Imports of Steel Products in Short Tons Country 1996 1997 1998 1999 2000 2001Canada 4,626,656 4,633,383 4,831,995 4,940,501 5,169,564 2,836,306Brazil 2,756,588 2,806,811 2,705,122 3,651,937 3,404,666 1,895,669Mexico 2,836,702 3,154,460 3,111,734 3,545,349 3,175,835 1,800,936Korea 1,461,038 1,692,703 3,516,698 3,112,957 2,905,665 1,669,884Japan 1,855,853 2,371,724 6,457,694 2,936,958 1,978,267 1,056,679Germany 2,494,880 2,246,889 1,614,225 1,598,418 1,883,111 841,665China 558,923 570,233 724,133 914,862 1,690,399 686,530Russia 1,662,535 3,308,099 5,237,131 1,215,864 1,524,272 619,333Taiwan 121,338 199,747 499,782 937,276 1,288,485 820,555Ukraine 781,961 439,672 718,966 593,594 1,184,289 674,727India 86,504 213,003 316,027 559,155 999,144 644,236France 1,241,005 1,017,166 1,030,007 1,146,353 941,621 416,014Note: one short ton equals 0.90718 metric tons. Source: U.S. International Trade Commission website.
Table 2: The shares of Japanese exports of HS 7208 ("Hot-rolled Steel") by trading partner (per cent) Year US NIES Korea ASEAN Taiwan China EU1991 4.9 41.9 28.1 32.2 7.8 10.4 0.11992 5.2 33.3 20.7 31.7 6.3 9.5 0.11993 1.2 23.6 9.6 19.3 9.1 46.7 0.11994 7.4 36.1 25.3 28.1 5.3 22.0 0.01995 3.8 40.6 26.6 32.7 8.8 17.3 0.01996 5.2 47.2 31.7 30.5 11.4 8.5 0.51997 10.7 43.8 29.4 28.8 11.3 5.5 0.21998 36.1 22.1 13.0 17.8 7.1 4.5 0.51999 1.0 46.3 33.9 31.5 10.6 4.4 0.22000 0.3 50.9 39.8 28.4 9.2 5.7 0.0Source: Japan Tariff Association. Notes: HS 7208 is "Flat-rolled products of iron or non-alloy steel, of a width of 600 mm or more, hot-rolled, not clad, plated or coated." The NIES are South Korea, Taiwan, Hong Kong and Singapore. HS 7208 represented approximately 20 percent of Japanese total exports in Steel (HS 72 Iron and Steel) in 2000.
Table 3: Real GDP growth rate (in real local currency) Year 1996 1997 1998 1999 2000 2001U.S. 3.6 4.4 4.3 4.1 4.1 1.2Japan 3.5 1.8 -1.1 0. 7 2.4 -0.6EU-11 1.4 2.3 2.9 2.6 3.4 n/aSource: Bureau of Economic Analysis (U.S.); Economic and Social Research Institute (Japan); Eurostat (EU).

33
Table 4: U.S. Iron and Steel: Output, Exports, Imports and Apparent Consumption (in current million U.S.$)
Year Total U.S. Output Imports from World World Imports from U.S. Import Shares1981 87,500 12,541.89 3,179.00 0.131982 57,000 9,128.30 2,457.27 0.141983 56,600 7,932.54 1,657.60 0.131984 65,800 11,975.58 1,513.63 0.161985 60,900 11,174.95 1,380.17 0.161986 56,940 9,694.19 1,239.17 0.151987 63,500 10,374.25 1,428.77 0.141988 77,200 11,938.62 2,299.80 0.141989 78,110 11,710.13 4,249.43 0.141990 75,740 11,245.67 3,925.47 0.141991 68,860 10,345.26 5,052.19 0.141992 71,296 10,463.96 4,427.78 0.141993 75,617 11,514.82 4,114.46 0.141994 84,710 15,470.06 4,490.89 0.161995 91,515 15,341.45 6,611.96 0.151996 96,720 16,499.13 6,168.97 0.151997 103,285 17,394.85 7,140.79 0.151998 104,015 20,227.79 6,977.51 0.17
Notes: Trade data from StatsCanada; Output Data from Steel Yearbook. Import Shares are of apparent consumption and are calculated as follows: “Imports from world” are divided by (“U.S. output” plus “imports from world” minus “world imports from U.S.” )
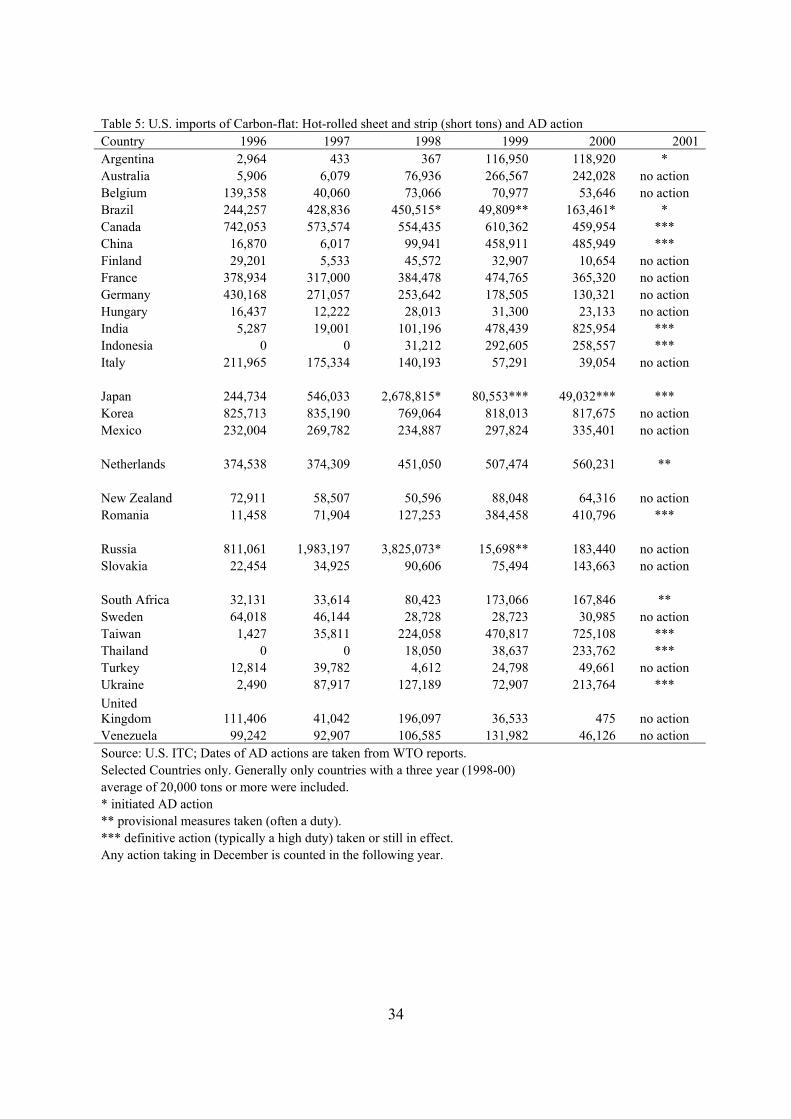
34
Table 5: U.S. imports of Carbon-flat: Hot-rolled sheet and strip (short tons) and AD action Country 1996 1997 1998 1999 2000 2001Argentina 2,964 433 367 116,950 118,920 * Australia 5,906 6,079 76,936 266,567 242,028 no action Belgium 139,358 40,060 73,066 70,977 53,646 no action Brazil 244,257 428,836 450,515* 49,809** 163,461* * Canada 742,053 573,574 554,435 610,362 459,954 *** China 16,870 6,017 99,941 458,911 485,949 *** Finland 29,201 5,533 45,572 32,907 10,654 no action France 378,934 317,000 384,478 474,765 365,320 no action Germany 430,168 271,057 253,642 178,505 130,321 no action Hungary 16,437 12,222 28,013 31,300 23,133 no action India 5,287 19,001 101,196 478,439 825,954 *** Indonesia 0 0 31,212 292,605 258,557 *** Italy 211,965 175,334 140,193 57,291 39,054 no action
Japan 244,734 546,033 2,678,815* 80,553*** 49,032*** *** Korea 825,713 835,190 769,064 818,013 817,675 no action Mexico 232,004 269,782 234,887 297,824 335,401 no action
Netherlands 374,538 374,309 451,050 507,474 560,231 **
New Zealand 72,911 58,507 50,596 88,048 64,316 no action Romania 11,458 71,904 127,253 384,458 410,796 ***
Russia 811,061 1,983,197 3,825,073* 15,698** 183,440 no action Slovakia 22,454 34,925 90,606 75,494 143,663 no action
South Africa 32,131 33,614 80,423 173,066 167,846 ** Sweden 64,018 46,144 28,728 28,723 30,985 no action Taiwan 1,427 35,811 224,058 470,817 725,108 *** Thailand 0 0 18,050 38,637 233,762 *** Turkey 12,814 39,782 4,612 24,798 49,661 no action Ukraine 2,490 87,917 127,189 72,907 213,764 *** United Kingdom 111,406 41,042 196,097 36,533 475 no action Venezuela 99,242 92,907 106,585 131,982 46,126 no action Source: U.S. ITC; Dates of AD actions are taken from WTO reports. Selected Countries only. Generally only countries with a three year (1998-00) average of 20,000 tons or more were included. * initiated AD action ** provisional measures taken (often a duty). *** definitive action (typically a high duty) taken or still in effect. Any action taking in December is counted in the following year.
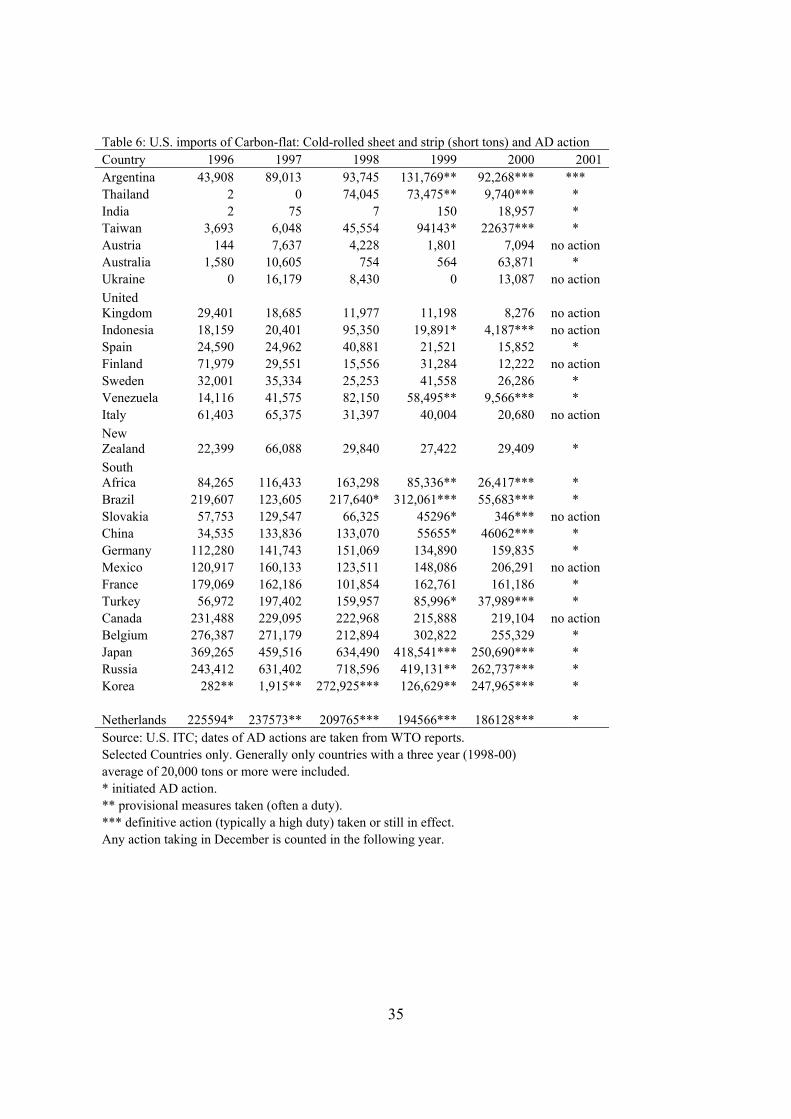
35
Table 6: U.S. imports of Carbon-flat: Cold-rolled sheet and strip (short tons) and AD action Country 1996 1997 1998 1999 2000 2001 Argentina 43,908 89,013 93,745 131,769** 92,268*** *** Thailand 2 0 74,045 73,475** 9,740*** * India 2 75 7 150 18,957 * Taiwan 3,693 6,048 45,554 94143* 22637*** * Austria 144 7,637 4,228 1,801 7,094 no action Australia 1,580 10,605 754 564 63,871 * Ukraine 0 16,179 8,430 0 13,087 no action United Kingdom 29,401 18,685 11,977 11,198 8,276 no action Indonesia 18,159 20,401 95,350 19,891* 4,187*** no action Spain 24,590 24,962 40,881 21,521 15,852 * Finland 71,979 29,551 15,556 31,284 12,222 no action Sweden 32,001 35,334 25,253 41,558 26,286 * Venezuela 14,116 41,575 82,150 58,495** 9,566*** * Italy 61,403 65,375 31,397 40,004 20,680 no action New Zealand 22,399 66,088 29,840 27,422 29,409 * South Africa 84,265 116,433 163,298 85,336** 26,417*** * Brazil 219,607 123,605 217,640* 312,061*** 55,683*** * Slovakia 57,753 129,547 66,325 45296* 346*** no action China 34,535 133,836 133,070 55655* 46062*** * Germany 112,280 141,743 151,069 134,890 159,835 * Mexico 120,917 160,133 123,511 148,086 206,291 no action France 179,069 162,186 101,854 162,761 161,186 * Turkey 56,972 197,402 159,957 85,996* 37,989*** * Canada 231,488 229,095 222,968 215,888 219,104 no action Belgium 276,387 271,179 212,894 302,822 255,329 * Japan 369,265 459,516 634,490 418,541*** 250,690*** * Russia 243,412 631,402 718,596 419,131** 262,737*** * Korea 282** 1,915** 272,925*** 126,629** 247,965*** *
Netherlands 225594* 237573** 209765*** 194566*** 186128*** * Source: U.S. ITC; dates of AD actions are taken from WTO reports. Selected Countries only. Generally only countries with a three year (1998-00) average of 20,000 tons or more were included. * initiated AD action. ** provisional measures taken (often a duty). *** definitive action (typically a high duty) taken or still in effect. Any action taking in December is counted in the following year.
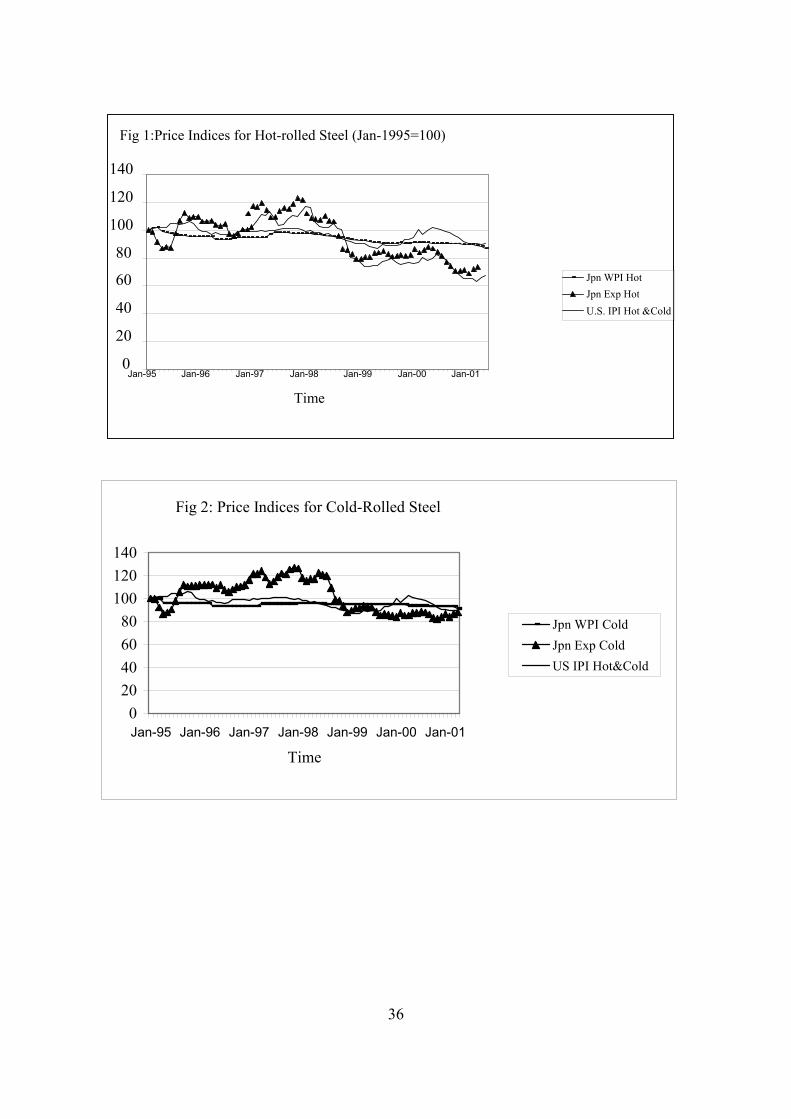
36
Fig 2: Price Indices for Cold-Rolled Steel
020406080
100120140
Jan-95 Jan-96 Jan-97 Jan-98 Jan-99 Jan-00 Jan-01
Time
Jpn WPI ColdJpn Exp ColdUS IPI Hot&Cold
Fig 1:Price Indices for Hot-rolled Steel (Jan-1995=100)
0
20
40
60
80
100
120
140
Jan-95 Jan-96 Jan-97 Jan-98 Jan-99 Jan-00 Jan-01
Time
Jpn WPI Hot Jpn Exp Hot U.S. IPI Hot &Cold

37
Fig 3: Japanese Export Prices and Yen/Dollar Rate
0
20
40
60
80
100
120
140
16019
95
1995
1996
1997
1997
1998
1999
1999
2000
2001
2001
2002
Time
Yen
/Dol
lar o
r Ind
ex
Export Price for Iron andSteel (yen base)Yen/Dollar rate
Fig 4:Real US Import of Iron and Steel (1995 mill $)
0.01000.02000.03000.04000.05000.06000.0
1991
Q1
1992
1993
1994
1995
1996
1997
1998
1999
2000
2001
Date
Real Import 1995 milldollars