International Support Measures for LDCs: mobilizing ... · Committee for Development Policy ......
32
CDP Secretariat Regional meeting on financing graduation gaps of Asia-Pacific LDCs Dhaka, 28-30 October 2014 International Support Measures for LDCs: mobilizing resources to close the graduation gap? Ana Luiza Cortez Matthias Bruckner Committee for Development Policy UN-DESA
-
Upload
hoangkhuong -
Category
Documents
-
view
216 -
download
0
Transcript of International Support Measures for LDCs: mobilizing ... · Committee for Development Policy ......

CDP Secretariat
Regional meeting on financing graduation gaps of Asia-Pacific LDCs
Dhaka, 28-30 October 2014
International Support Measures for LDCs:
mobilizing resources to close the graduation gap?
Ana Luiza Cortez
Matthias Bruckner
Committee for Development Policy
UN-DESA

International Support Measures for LDCs:
mobilizing resources to close the graduation gap?
Introduction
ISM and ODA
Increasing ODA flows to LDCs
LDC criteria and ODA allocation
ISM: international trade
Preferential market access and resource
mobilization
CDP Secretariat

LDC ISMs and Sources of Finance
• Development assistance
• International trade • General support
Information available: LDC PORTAL
• Domestic resource mobilization
• ODA
• International Trade
• FDI
• Other international capital flows
CDP Secretariat

CDP Secretariat

Official development assistance • Financial aid and technical assistance • Multilateral and bilateral partners
Modalities and commitments: DAC: 0.15 to 0.20% and above of donor’s GNI Untied aid: max extent possible Average grant element: 90% all LDCs (given year) or 86%
each LDC (3 years) Dedicated funds (LDCF/GEF; EIF) Target budget set asides by some multilaterals (UNDP,
UNICEF, etc.)
Important! Except for dedicated funds, ODA is not LDC-specific, just the
modalities and the targets. Donors allocation not based on LDC status: overlap criteria
CDP Secretariat

ODA flows: overview
CDP Secretariat
-
5,000
10,000
15,000
20,000
25,000
30,000
35,000
40,000
45,000
50,000
2000 2001 2002 2003 2004 2005 2006 2007 2008 2009 2010 2011 2012
$ 2
01
2 m
illio
n
ODA flows by OECD/DAC, 2000-2012
LDCs Asia-Pacific LDCs

ODA allocation by sector in Asia-Pacific LDCs
CDP Secretariat
ODA Allocation by Sectors (all donors)
Average 2010-2012 US$ million Per cent Indicator
Total 12,550.8 100.0 ..
I. Social Infrastructure & Services 6,647.0 53.0 HAI
II. Economic Infrastructure & Services 2,208.4 17.6 EVI
III. Production Sectors 976.2 7.8 EVI
IV. Multisector / Cross-Cutting 1,152.9 9.2 ..
VI. Commodity Aid / General Prog. Ass. 419.2 3.4 EVI
VII. Action Relating To Debt 75.6 0.6 ..
VIII. Humanitarian Aid 913.4 7.3 HAI
IX. Administrative Costs Of Donors 38.5 0.3 ..
X. Support To Ngos - 0.0 ..
XI. Refugees In Donor Countries 2.6 0.0 ..
Source: OECD.Stat
Need to boost EVI-related allocation but NOT at the expense of HAI

CDP Secretariat

Increasing ODA flows to LDCs
Donors to meet commitments renewed at Istanbul
Currently (2012):
• Above 0.20%: Denmark, Ireland, Luxembourg, Norway,
Sweden
• At 0.15%, but < 0.20%: Netherlands, UK
CDP Secretariat
DAC ODA flows to LDCs, $ million (current)
2011 2012
Observed 44,758.3 40,536.6
Committed 70,949.3 71,173.1
Gap 26,191.0 30,636.5
Source: Gap Task Report database

Closing the ODA gap: Increasing flows or
reducing commitments?
OECD/DAC proposal: better targeting
50% of net ODA to LDCs
The issue: defining the LDC share in bilateral ODA
Bilateral programs: 22%
Imputed multilateral: 10%
A. Fact: average DAC share to LDC reported 2012:
31.9%, or $40,537, corresponding to 0.09% donors GNI
Countries meeting 50%: Ireland
Estimated gap: about $23 billion
CDP Secretariat

The disappearing gap?
B. OECD proposal: also include imputed share of LDCs in bilateral regional and global programs (about 8%)
Average DAC share to LDCs: 40%, $50.8 billion, or 0.114% of donors GNI
Countries meeting 50%: Iceland, Ireland
Estimated gap: $12.7 billion
C. OECD/DAC table 26: calculates LDC shares by including imputed multilateral but excluding unspecified allocations by donors (smaller base)
Average DAC share to LDCs: 46.8%, $59.4 billion or 0.134% of donors GNI
Countries meeting 50%: Belgium, Canada, Denmark, Finland, Iceland, Ireland, Japan, Netherland, Norway, Sweden, UK, US
Estimated gap: $4 billion
CDP Secretariat

Summing up
CDP Secretariat
0
5
10
15
20
25
30
35
Istanbul A. Current approach B. OECD/DAC new C. Excluding unallocated
$ b
illio
n
ODA commitment gaps, 2012
50% proposal

Definitions matter!
1. The LDC share: what concept?
2. Modernizing ODA estimates the grant element question:
• new fixed rate or risk adjusted?
• total flows or grant equivalent?
• higher grant equivalent?
Implications for LDCs: a stricter definition of concessionality may affect shares: further analysis necessary
CDP Secretariat

Moving forward
• Volume: Istanbul commitments offer
potential for greater additional ODA flows
• LDC flows have close to 100% grant element,
likely not be affected by changes in estimation
methods
• Distribution: take into account LDC criteria
or its indicators
Targets needs
Avoids conflict with other developing countries
CDP Secretariat

CDP Secretariat

Proposal: ODA and LDC criteria
United Nations General Assembly call
(A/RES/67/221):
“Invites Development Partners to consider [LDC
indicators and criteria] as part of their criteria for
allocating [ODA].”
Resolution based on suggestions by the CDP.
Allows for better aligning ODA with needs
Avoids abrupt changes when countries graduate from
LDC category
CDP Secretariat

Formula-based ODA allocations
Formula-based ODA allocations typically depend on
Performance
Needs
Population
Formula based ODA allocation used mainly by multilateral donors, e.g.
World Bank/IDA; ADB/ADF; …
UNDP/ TRAC-1 (Needs/Income and Population only)
European Union/EDF
CDP Secretariat

Formula-based ODA allocations: ADB
example
Current basic formula
𝑆𝑖 = 𝐶𝐶𝑃𝑅𝑖2× 𝑃𝐶𝐼𝑖
−0.25 × 𝑃𝑂𝑃𝑖0.6 × 𝐶
𝑆𝑖: 𝑆ℎ𝑎𝑟𝑒 𝑜𝑓 𝑐𝑜𝑢𝑛𝑡𝑟𝑦 𝑖 in ADF commitments
𝐶𝐶𝑃𝑅𝑖: Composite country performance rating
𝑃𝐶𝐼𝑖: Per capita income
𝑃𝑂𝑃𝑖: Population
C: A constant that ensures 𝑆𝑖 = 1
‘Performance’ higher weight than ‘needs’
Performance component varies by factor 6
Income component varies by factor 2
CDP Secretariat

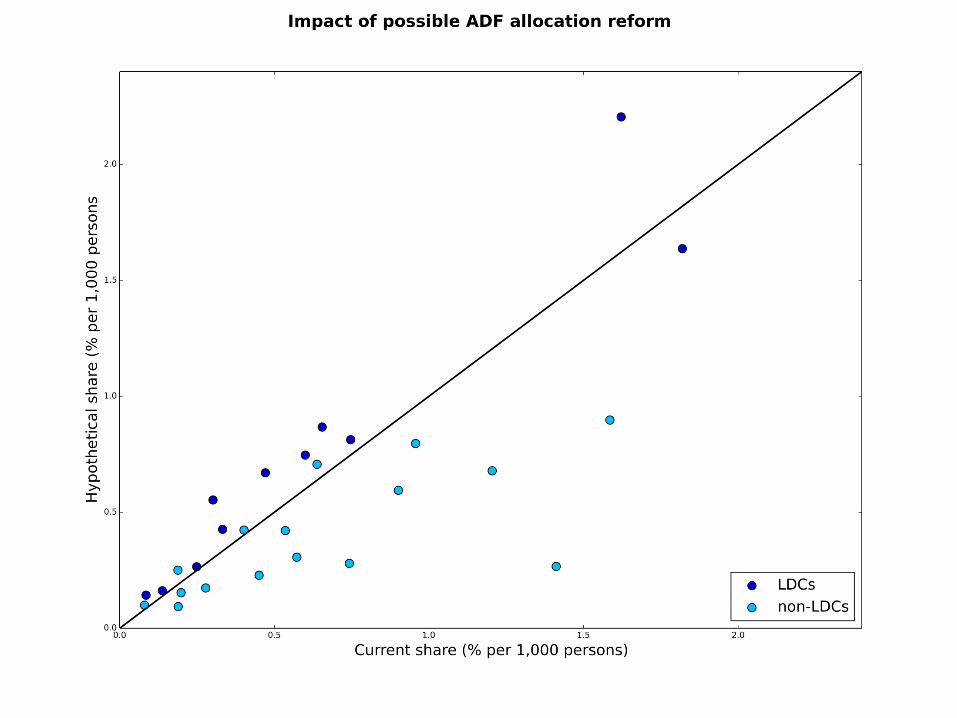
Formula-based ODA allocations:
Illustrative example
Possible adjusted formula
𝑆𝑖 = 𝐶𝐶𝑃𝑅𝑖2× 𝑃𝐶𝐼𝑖
−0.25 × 𝑃𝑂𝑃𝑖0.6 × 𝐿𝐻𝐴𝐼𝑖
0.5 × 𝐸𝑉𝐼𝑖0.5 × 𝐶
𝐿𝐻𝐴𝐼𝑖: 100 − Human Asset Index
𝐸𝑉𝐼𝑖: Economic Vulnerability Index
HAI component varies by factor 3
EVI component varies by factor 2
Overall importance of ‘needs’ increases
○ In line with common proposal to focus ODA on the neediest
Other functional forms and factors possible
CDP Secretariat
CDP Secretariat

LDC criteria and other ODA allocation
systems
Most bilateral donors do not use formulas for
allocating ODA
But many use (more or less) formal criteria to select
priority countries
HAI and EVI could be two of these criteria
The indicators within HAI and EVI could be
useful for allocations within priority themes
CDP Secretariat

CDP Secretariat

International trade
Special and differential treatment WTO • Increase trade opportunities for LDCs
• Safeguard the interests of LDCs
• Flexibility in rules and disciplines
• Longer transitional periods
• Provision of technical assistance
Preferential market access • Lower Tariffs
• DFQF
CDP Secretariat

Market access:
Trade as generator of resources
• The 1979 Enabling Clause: “Special treatment of the least developed among the developing countries in the context of any general or specific measures in favour of developing countries.”
• Preferential tariff treatment of LDCs: “The provisions of Article 1 of the GATT 1994 shall be waived until 30 June 2009, to the extent necessary to allow developing country Members to provide preferential treatment to products of the least developed countries [...]” [adopted in 1999, extended to 2019]
• Services Waiver: “Members may provide preferential treatment to services and service suppliers of least-developed countries with respect to the application of measures described in Article XVI [MFN market access, adopted in Dec 2011, valid for 15 years]
- Generalized System of Preference (GSP) - Regional and bilateral agreements - Global System of Trade Preferences (GSTP) - Developing country trading partners
CDP Secretariat

CDP Secretariat

Exports of goods and services,
2000-2012
CDP Secretariat Source of data: WDI database
-
50,000
100,000
150,000
200,000
250,000
2000 2001 2002 2003 2004 2005 2006 2007 2008 2009 2010 2011 2012
US
$ m
illio
n (
cu
rre
nt
va
lue
s)
LDCs-All LDCs-AP

Share of developed country imports from developing and
least-developed countries admitted free of duty, by value,
2000-2011
CDP Secretariat
2000 2005 2006 2007 2008 2009 2010 2011
Total Duty Free (excluding oil and arms)
Developing countriesa 64.8 74.9 76.2 77.4 78.7 77.0 78.8 79.7
Least Developed Countries 69.8 80.4 79.1 79.8 80.6 80.4 80.4 83.4
Of which: True Duty Free b
Developing countriesa 17.0 21.5 20.9 20.0 20.0 20.1 19.6 20.3
Least Developed Countries 35.0 49.0 52.7 51.9 48.7 52.9 53.6 52.7
a Including LDCs. b The true duty-free portion is calculated by subtracting from the total duty-free access all products
receiving duty free treatment under the MFN regime. The indicators are based on the best available treatment, including regional and preferential agreements.
Source: WTO-ITC-UNCTAD and based on CAMAD database compiled by ITC, UNCTAD and WTO.

DFQF (goods):
→ On average, relatively high utilization rates by
LDCs of GSP and other preferential schemes (2011):
• Canada: 90%
• EU: 92~96%
• USA: 83%
→ Room for improvement: • Coverage: the DFQF commitment
▪ Bali outcome; Most developed already at 100%, US as exception
▪ Preference erosion, with caveats
▪ Productive capacity constraints (volume and tariff lines)
• Utilization: needs lower cost of compliance (RoO)
CDP Secretariat

Changing trade dynamics
► Increasing importance of developing country partners
► Relatively few countries offer DFQF for LDCs: Chile, China, India,
Korea, Morocco, Taiwan POC, Turkey.
► Greater potential for expanded coverage?
CDP Secretariat

The Services Waiver
• Preferential treatment to be extended to like services and service suppliers of all LDCs
• To promote trade in sectors and modes of supply of LDC export interest
• Bali outcome → operationalization of services waiver:
o LDCs collective request (sectors and modes)
o CTS to organize meeting in 6 months with trading partners
o Targeted and coordinated technical assistance
• LDC request submitted on 21 July 2014 o Waive: restrictions, fees, taxes, visas, tests, work permits,
residence requirements, etc. Not clear whether all fall under art XVI
o List of service categories: construction, accounting, packaging, veterinary, engineering, etc.
CDP Secretariat

Moving forward:
Trade ISMs closing the gap?
Preferential Market access: • Expansion of coverage and lower cost of compliance
necessary
• Greater participation by emerging markets
• Potential for services exports depends on operationalization of waiver
• Productive capacity constraints resources needed to generate resources!
Greater use of other differentiated treatment: Improved access to SPS and TBT and technical
assistance as foreseen in legal texts needed
CDP Secretariat

Thank you!
Additional information:
www.un.org/ldcportal
CDP Secretariat