International Strategic Minerals Inventory … Strategic Minerals Inventory Summary Report ......
56
U.S. GEOLOGICAL SURVEY CIRCULAR 930-K International Strategic Minerals Inventory Summary Report-Vanadium Prepared as a cooperative effort among earth- science and mineral-resource agencies of Australia, Canada, the Federal Republic of Germany, the Republic of South Africa, the United Kingdom, and the United States of America
Transcript of International Strategic Minerals Inventory … Strategic Minerals Inventory Summary Report ......
U.S. GEOLOGICAL SURVEY CIRCULAR 930-K
International Strategic Minerals Inventory
Summary Report-Vanadium
Prepared as a cooperative effort among earth
science and mineral-resource agencies of
Australia, Canada, the Federal Republic of
Germany, the Republic of South Africa, the
United Kingdom, and the United States of
America
Geologic Time Scale
Million years Age
before present
Holocene Quaternary - 0.01
Pleistocene r- 2 (.)
Pliocene 6 t- 5 N Miocene 0 24 z t-
Tertiary w Oligocene u r- 38 I
Eocene r r- 55
Paleocene 63
Late Cretaceous Cretaceous (.) r- 96
Early Cretaceous 6 138 - N t-
0 Jurassic en
w 205 -
~ t-
Triassic -240
Permian
t- 290 Pennsylvanian
Carboniferous r- -330 Mississippian (.)
6 r- 360 N Devonian 0 w 410 ..J r-
<( Silurian a.. - 435
Ordovician r- 500
Cambrian -570 u
Late Proterozoic 0 r- 900 N
0 Middle Proterozoic 0:::
w r- 1600 z
1-0 ~
Early Proterozoic 0::: a..
2500 0:: m ~ z <(
<( u w w 0:: ::r: a.. (.)
0:: <(
International Strategic Minerals Inventory
Summary Report-Vanadium
By I. Goldberg, E.C.I. Hammerbeck, L.S. Labuschagne,
and C. Rossouw
U.S. GEOLOGICAL SURVEY CIRCULAR 930-K
Prepared as a cooperative effort among earth
science and mineral-resource agencies of
Australia, Canada, the Federal Republic of
Germany, the Republic of South Africa, the
United Kingdom, and the United States of
America
1992
U.S. DEPARTMENT OF THE INTERIOR
MANUEL LUJAN, jr., Secretary
U.S. GEOLOGICAL SURVEY
Dallas L. Peck, Director
Any use of trade, product, or firm names in this publication is for descriptive purposes only and does not imply endorsement by the U.S. Government
UNITED STATES GOVERNMENT PRINTING OFFICE: 1992
Free on application to Book and Open-File Report Sales U.S. Geological Survey Federal Center, Box 25425 Denver, CO 80225
Library of Congress Cataloging in Publication Data
International strategic minerals inventory summary report- vanadium I by I. Goldberg ... [et al.].
p. em. - (U.S. Geological Survey circular; 930-K) Includes bibliographical references. Supt. of Docs. no.: I 19.4/2:930-K 1. Vanadium. 2. Strategic materials. I. Goldberg, I. (Ian) II. Series. TN490.V2I58 1992 553.4'626-dc20 90-22734
CIP
FOREWORD
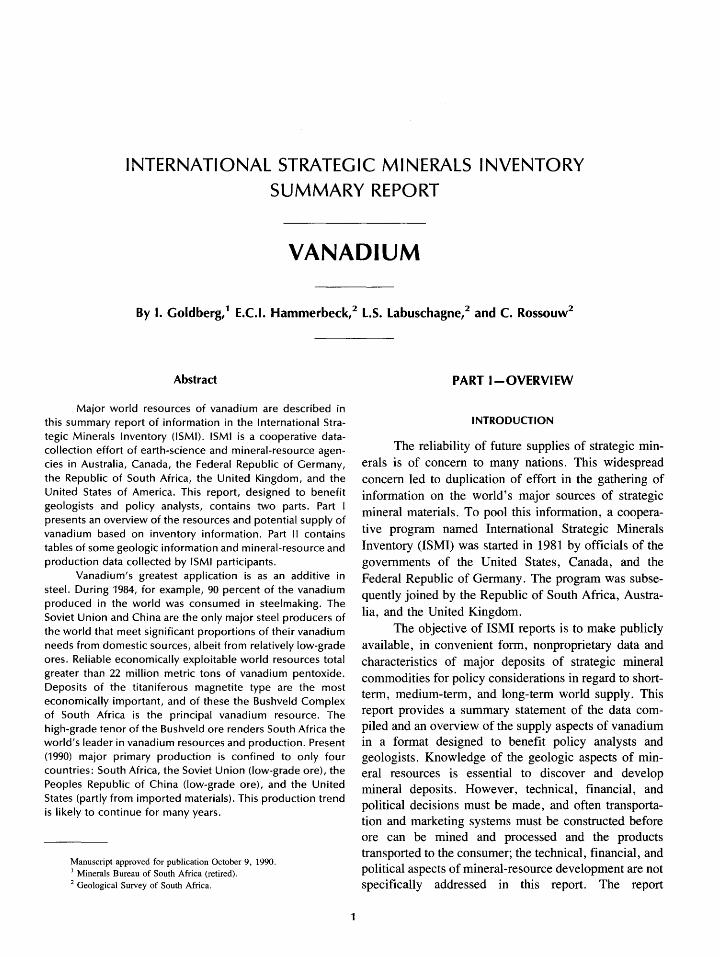
Earth-science and mineral-resource agencies from several countries started the International Strategic Minerals Inventory to cooperatively gather information about major sources of strategic mineral raw materials. This circular summarizes inventory information about major deposits of vanadium, one of the mineral commodities selected for the inventory.
The report was prepared by I. Goldberg of the Minerals Bureau of South Africa (retired) and by E.C.I. Hammerbeck, L.S. Labuschagne, and C. Rossouw of the Geological Survey of South Africa (GSSA). It was edited by David M. Sutphin and transcribed by Dorothy J. Manley of the U.S. Geological Survey (USGS). Vanadium inventory information was compiled or supplied by Cindy Rossouw (chief compiler); Ulrich H. Krauss, Federal Institute for Geosciences and Natural Resources of the Federal Republic of Germany; George N. Breit, USGS; Richard J. Pantel, U.S. Bureau of Mines; C. Roger Pratt, Australian Bureau of Mineral Resources, Geology and Geophysics; and A. Sozanski, Canadian Department of Energy, Mines and Resources (EMR), Mineral Policy Sector (MPS). Additional contributions to the report were made by Antony B.T. Werner and D.E.C. King (retired), EMR, MPS; G.A. Gross, EMR, Geological Survey of Canada; and J. De La Fluente, Centro de Informacion de Recursos Naturales, as well as by S. Schindler Contardo, Servicio Nacional de Geologia y Mineria, Clu1e.
Director
III

CONTENTS
Page
Foreword------------------------------------------------------------------------------- III Abstract- - - - - - - - - - - - - - - - - - - - - - - - - - - - - - - - - - - - - - - - - - - - - - - - - - - - - - - - - - - - - - - - - - - - - - - - - - - - - - - - 1 Part I-Overview - - - - - - - - - - - - - - - - - - - - - - - - - - - - - - - - - - - - - - - - - - - - - - - - - - - - - - - - - - - - - - - - - - - - - - - - 1
Introduction------------------------------------------------------------------------ 1 Uses and supply aspects -- ---------------------- -- ------------------- -- --- ------------ 3 Distribution of vanadium deposits - - - - - - - - - - - - - - - - - - - - - - - - - - - - - - - - - - - - - - - - - - - - - - - - - - - - - - 4 Vanadium resources - - - - - - - - - - - - - - - - - - - - - - - - - - - - - - - - - - - - - - - - - - - - - - - - - - - - - - - - - - - - - - - - - 7 Vanadium production - - - - - - - - - - - - - - - - - - - - - - - - - - - - - - - - - - - - - - - - - - - - - - - - - - - - - - - - - - - - - - - - 15 Conclusions------------------------------------------------------------------------ 17
Part II-Selected inventory information for vanadium deposits and districts- - - - - - - - - - - - - - - - - - - - - - - - - 23 References cited - - - - - - - - - - - - - - - - - - - - - - - - - - - - - - - - - - - - - - - - - - - - - - - - - - - - - - - - - - - - - - - - -- - - - - - - - 42 Additional references on vanadium resources--- - ------------------------ -- -------------------- 44
FIGURE 1. 2.
3.
4.
5-7.
ILLUSTRATIONS
Page
Diagram showing United Nations resource categories used in this report--------------- 3 Map showing location, geologic deposit type, and estimated resources of major
vanadium deposits and districts in the world - - - - - - - - - - - - - - - - - - - - - - - - - - - - - - - - - 5 Bar graph showing distribution of vanadium deposit types and current resources
through geologic time- - - - - - - - - - - - - - - - - - - - - - - - - - - - - - - - - - - - - - - - - - - - - - - - - - - - 9 Map showing World Bank economic classification for countries in which the world's
major vanadium deposits and districts occur---------------------------------- 11 Bar graphs showing:
5. Additions to vanadium resources in the world's major deposits and districts according to their date of discovery------------------------------------- 12
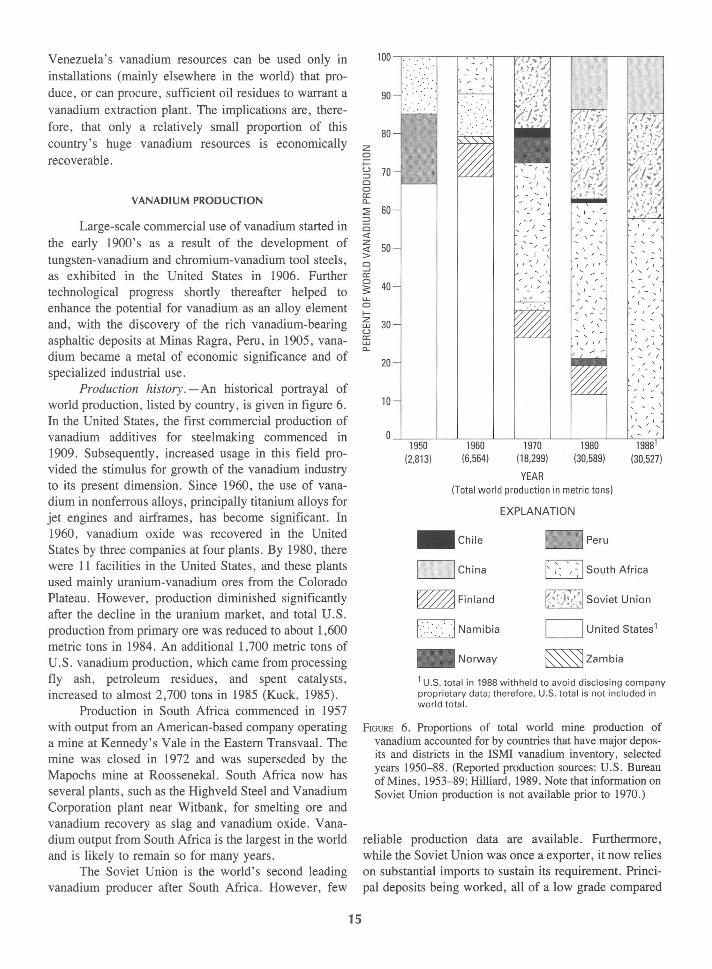
6. Proportions of total world mine production of vanadium accounted for by countries that have major deposits and districts in the ISMI vanadium inventory, selected years 1950-88------------------------------------------------------ 15
7. Vanadium production in countries that have major deposits and districts in the ISMI vanadium inventory, selected years 1950-88 ------------------------ 18
8-9. Maps showing location and products of major vanadium-processing plants: 8. In the world------------------------------------------------------------ 19 9. InEurope-------------------------------------------------------------- 20
10. Graphs showing four- and eight-country concentration ratios for selected nonfuel mineral commodity production in 1913 and 1980 ----------------------------- 21
11. Map showing major vanadium deposits and districts, their present production status, and their probable production status in 2020 - - - - - - - - - - - - - - - - - - - - - - - - - - - - - - - - - 22
TABLES
Page
TABLE 1. Past producers and minor deposits not included in the ISMI vanadium inventory - - - - - - - - - 6 2. Classification of vanadium geologic deposit types and examples--- -- ------------------ 8 3. Known economic and marginal world vanadium resources listed by World Bank economic
class of country, country, and resource classification - - - - - - - - - - - - - - - - - - - - - - - - - - - - 10
v
4-5. Estimated world cumulative and annual mine production of vanadium, contained in ore and concentrate:
Page
4. For each country having a major vanadium deposit or district --------------------- 16 5. By World Bank economic class of country - - - - - - - - - - - - - - - - - - - - - - - - - - - - - - - - - - - - 17
6. Selected geologic and location information from ISMI records for vanadium deposits and districts - - - - - - - - - - - - - - - - - - - - - - - - - - - - - - - - - - - - - - - - - - - - - - - - - - - - - - - - - - - - - 24
7. Selected production and mineral-resource information from ISMI records for vanadium deposits and districts ---------------------- -- --- ------------------- -- ------ 32
8-9. Selected production information for: 8. Vanadium pentoxide- - - - - - - - - - - - - - - - - - - - - - - - - - - - - - - - - - - - - - - - - - - - - - - - - - - - - - - 38 9. Ferro vanadium - - - - - - - - - - - - - - - - - - - - - - - - - - - - - - - - - - - - - - - - - - - - - - - - - - - - - - - - - - - 40
VI
INTERNATIONAL STRATEGIC MINERALS INVENTORY
SUMMARY REPORT
VANADIUM
By I. Goldberg,1 E.C.I. Hammerbeck/ L.S. Labuschagne/ and C. Rossouw2
Abstract
Major world resources of vanadium are described in this summary report of information in the International Strategic Minerals Inventory (ISMI). ISMI is a cooperative datacollection effort of earth-science and mineral-resource agencies in Australia, Canada, the Federal Republic of Germany, the Republic of South Africa, the United Kingdom, and the United States of America. This report, designed to benefit geologists and policy analysts, contains two parts. Part I presents an overview of the resources and potential supply of vanadium based on inventory information. Part II contains tables of some geologit information and mineral-resource and production data collected by ISMI participants.
Vanadium's greatest application is as an additive in steel. During 1984, for example, 90 percent of the vanadium produced in the world was consumed in steelmaking. The Soviet Union and China are the only major steel producers of the world that meet significant proportions of their vanadium needs from domestic sources, albeit from relatively low-grade ores. Reliable economically exploitable world resources total greater than 22 million metric tons of vanadium pentoxide. Deposits of the titaniferous magnetite type are the most economically important, and of these the Bushveld Complex of South Africa is the principal vanadium resource. The high-grade tenor of the Bushveld ore renders South Africa the world's leader in vanadium resources and production. Present (1990) major primary production is confined to only four countries: South Africa, the Soviet Union (low-grade ore), the Peoples Republic of China (low-grade ore), and the United States (partly from imported materials). This production trend is likely to continue for many years.
Manuscript approved for publication October 9, 1990. 1 Minerals Bureau of South Africa (retired). 2 Geological Survey of South Africa.
PART I-OVERVIEW
INTRODUCTION
The reliability of future supplies of strategic minerals is of concern to many nations. This widespread concern led to duplication of effort in the gathering of information on the world's major sources of strategic mineral materials. To pool this information, a cooperative program named International Strategic Minerals Inventory (ISMI) was started in 1981 by officials of the governments of the United States, Canada, and the Federal Republic of Germany. The program was subsequently joined by the Republic of South Africa, Australia, and the United Kingdom.
The objective of ISMI reports is to make publicly available, in convenient form, nonproprietary data and characteristics of major deposits of strategic mineral commodities for policy considerations in regard to shortterm, medium-term, and long-term world supply. This report provides a summary statement of the data compiled and an overview of the supply aspects of vanadium in a format designed to benefit policy analysts and geologists. Knowledge of the geologic aspects of mineral resources is essential to discover and develop mineral deposits. However, technical, financial, and political decisions must be made, and often transportation and marketing systems must be constructed before ore can be mined and processed and the products transported to the consumer; the technical, financial, and political aspects of mineral-resource development are not specifically addressed in this report. The report
addresses the primary stages in the supply process for vanadium and includes considerations of vanadium demand.
The imprecise term "strategic minerals" generally refers to mineral ore and derivative products that come largely or entirely from foreign sources, that are difficult to replace, and that are important to a nation's economy, in particular to its defense industry. The term implies a nation's perception of vulnerability to supply disruptions and of a need to safeguard its industries from the repercussions of a loss of supplies.
Because a mineral that is strategic to one country may not be strategic to another, no one list of strategic minerals can be prepared. The ISMI Working Group decided to commence with chromium, manganese, nickel, and phosphate. All of these studies, plus reports on platinum-group metals, cobalt, titanium, natural graphite, lithium, and tin are now published. Additional studies on vanadium (this report), zirconium, tungsten, and advanced materials have been subsequently undertaken.
The data in the ISMI vanadium inventory were collected from August 1984 to April 1986 and updated in 1989. The report was submitted to the U.S. Geological Survey for editing and publication in September 1989. The information used was the best available in the various agencies of the participating countries that contributed to the preparation of this report. Those agencies are the Bureau of Mines and the Geological Survey of the U.S. Department of the Interior; the Geological Survey of Canada and the Mineral Policy Sector of the Canadian Department of Energy, Mines and Resources; the Federal Institute for Geosciences and Natural Resources of the Federal Republic of Germany; the Geological Survey and the Minerals Bureau of the Department of Mineral and Energy Affairs of South Africa; the Australian Bureau of Mineral Resources, Geology and Geophysics; and the British Geological Survey, a component of the Natural Environment Research Council of the United Kingdom.
No geologic definition of a deposit (or district) is used for compiling records for this report. Deposits (or districts) are selected for the inventory on the basis of their present or expected future contribution to world supply. Records of all deposits compiled by ISMI participants meet this general "major deposit" criterion and are included in the inventory. In addition, and for the sake of completeness, summary information is provided on deposits that once were significant but whose resources are now considered to be substantially depleted. For most countries, inventory records are compiled on a deposit-by-deposit basis, but for some, such as the
2
Soviet Union, production and resources of vanadium cannot be distinguished. District totals are given for other deposits, for instance the Bushveld Complex, South Africa. Because the assignment of a specific number of records to the vanadium resources of a district or of an area was not done with the same detail by all compilers, comparisons among numbers of vanadium records in different geographic areas or among numbers of vanadium records and those of other commodities reported on in this series are not meaningful.
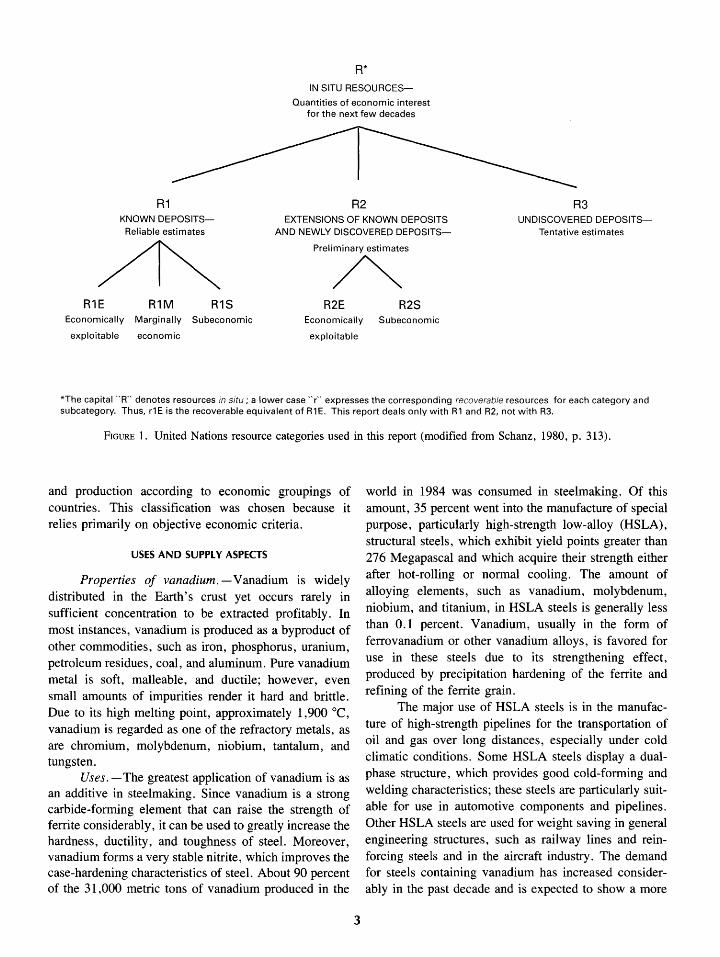
The ISMI record collection and this report on vanadium use the international classification system for mineral resources recommended by the United Nations Group of Experts on Definitions and Terminology for Mineral Resources (United Nations Economic and Social Council, 1979; Schanz, 1980). The terms, definitions, and resource categories of this system were established in 1979 to facilitate international exchange of mineralresource data; the Group of Experts sought a system that would be compatible with the several systems already in use in several countries. Figure 1 shows the United Nations (U.N.) resource classification used here. This report focuses on category R 1, which includes reliable estimates of tonnages and grades of known deposits. The familiar term "reserves," which many consider to be equivalent to r1E or RlE, has been interpreted inconsistently and thus has been deliberately avoided in the U.N. classification.
It should be noted that, generally, until a deposit has been extensively explored or mined, its size and grade are imperfectly defined. In many cases, deposit size proves to be significantly larger, sometimes even several times larger, than was established when the decision to mine was made. Experts who have a sound knowledge of a deposit and its geologic setting may infer that the deposit extends beyond the bounds reliably established up to that time. Tonnage estimates for such inferred extensions fall into category R2. For major deposits, ISMI records show R2 estimates in the few cases for which they are readily available. Category R3, postulated but undiscovered resources, is not dealt with in this report.
Not all companies or countries report resource data in the same way. Mining recovery from an ore body depends on individual conditions and can vary considerably, typically in the range of 75 to 90 percent for underground metal mining; that is, 10 to 25 percent of the in-place resources cannot be extracted. The World Bank economic classification of countries (World Bank, 1986, p. 180-181), which is based primarily on gross national product (GNP) per capita, is used in this and other ISMI reports to illustrate distribution of resources
R*
IN SITU RESOURCES
Quantities of economic interest for the next few decades
R1 R2 KNOWN DEPOSITS
Reliable estimates EXTENSIONS OF KNOWN DEPOSITS
AND NEWLY DISCOVERED DEPOSITS-
R3 UNDISCOVERED DEPOSITS
Tentative estimates
Preliminary estimates
A R1E R1M R1S R2E R2S
Economically Marginally Subeconomic Economically Subeconomic
exploitable economic exploitable
*The capital "R" denotes resources in situ; a lower case "r'' expresses the corresponding recoverable resources for each category and subcategory. Thus, r1E is the recoverable equivalent of R1E. This report deals only with R1 and R2, not with R3.
FIGURE 1. United Nations resource categories used in this report (modified from Schanz, 1980, p. 313).
and production according to economic groupings of countries. This classification was chosen because it relies primarily on objective economic criteria.
USES AND SUPPLY ASPECTS
Properties of vanadium.-Vanadium is widely distributed in the Earth's crust yet occurs rarely in sufficient concentration to be extracted profitably. In most instances, vanadium is produced as a byproduct of other commodities, such as iron, phosphorus, uranium, petroleum residues, coal, and aluminum. Pure vanadium metal is soft, malleable, and ductile; however, even small amounts of impurities render it hard and brittle. Due to its high melting point, approximately 1,900 °C, vanadium is regarded as one of the refractory metals, as are chromium, molybdenum, niobium, tantalum, and tungsten.
Uses.- The greatest application of vanadium is as an additive in steelmaking. Since vanadium is a strong carbide-forming element that can raise the strength of ferrite considerably, it can be used to greatly increase the hardness, ductility, and toughness of steel. Moreover, vanadium forms a very stable nitrite, which improves the case-hardening characteristics of steel. About 90 percent of the 31 ,000 metric tons of vanadium produced in the
3
world in 1984 was consumed in steelmaking. Of this amount, 35 percent went into the manufacture of special purpose, particularly high-strength low-alloy (HSLA), structural steels, which exhibit yield points greater than 276 Megapascal and which acquire their strength either after hot-rolling or normal cooling. The amount of alloying elements, such as vanadium, molybdenum, niobium, and titanium, in HSLA steels is generally less than 0.1 percent. Vanadium, usually in the form of ferrovanadium or other vanadium alloys, is favored for use in these steels due to its strengthening effect, produced by precipitation hardening of the ferrite and refining of the ferrite grain.
The major use of HSLA steels is in the manufacture of high-strength pipelines for the transportation of oil and gas over long distances, especially under cold climatic conditions. Some HSLA steels display a dualphase structure, which provides good cold-forming and welding characteristics; these steels are particularly suitable for use in automotive components and pipelines. Other HSLA steels are used for weight saving in general engineering structures, such as railway lines and reinforcing steels and in the aircraft industry. The demand for steels containing vanadium has increased considerably in the past decade and is expected to show a more
rapid growth in future years than the demand for mild steel (Duke, 1983).
Vanadium is used also in the production of certain tool steels, especially the low-alloy types (which have a higher hardening ability than straight carbon steels), and in high-speed tool steels, which can be used at elevated temperatures. The vanadium content in some of these steels is said to enhance wear resistance and increase their grain-coarsening temperatures to 1,030 °C. Other metallurgical applications are in various alloys, principally those of titanium (used in aircraft and in aerospace), in which the vanadium strengthens the pure titanium metal, and in cast iron, in which it counteracts graphitization and acts as a chill stabilizer.
Types offerrovanadium.-Most vanadium used in industry is in the form of vanadium pentoxide or of ferro vanadium. Vanadium pentoxide (V 20 5) is produced by blending milled ore, slag, or concentrate with sodium salt and then by roasting and leaching. Ferro vanadium (vanadium-carbon-iron alloy containing 50 to 86 percent vanadium) is produced by reducing vanadium pentoxide (by using carbon, silicon, or aluminum). Various types of ferrovanadium, distinguishable by their contents of vanadium, silicon, and carbon, are used in steelmaking. Among them are several proprietary products, such as Carvan, which contains 83 to 86 percent vanadium, 10 percent carbon, and 2 to 3 percent iron, and Ferrovan, which typically contains 42 to 43 percent vanadium, 6.5 percent silicon, 6.4 percent chromium, 3.6 percent manganese, 39.8 to 40.8 percent iron, and 0. 7 percent carbon. Other registered vanadium products used in certain kinds of steelmaking are Nitrovan, a vanadium nitride additive, and Vanox, a modified vanadium oxide. Selected information on plants producing vanadium pentoxide and ferrovanadium is listed in tables 8 and 9 in Part II.
Vanadium pentoxide is used directly as a catalyst in certain oxidation reactions, for example, in sulfuric acid plants where sulphur dioxide is changed to sulphur trioxide and for conversion reactions of naphthalene to phthalic anhydride and of benzene to maleic anhydride. In addition to vanadium pentoxide, other vanadium compounds used in catalysis include ammonium metavanadate, vanadium oxytrichloride, and vanadium tetrachloride. Consumption of vanadium in catalysts, ceramics, and electronics (some vanadium compounds are superconductors) is about 700 metric tons annually and is likely to rise appreciably in the next decade. Vanadium is used also in welding rods and permanent magnets made from vanadium pentoxide and ferrovanadium, in photographic processes that require vanadium
4
chloride, as a colorant in ceramics and glass, and as a drier in ink, paint, and varnish.
Substitution of vanadium.- Vanadium has specific technical advantages over possible substitute metals and is relatively inexpensive. Substitution, therefore, is likely only with the development of metals that are technically superior. In alloy steels, vanadium may be replaced by niobium, but, because each of these additives plays a particular role (for example, vanadium improves strength and niobium improves toughness by grain refining), substitution will be very limited.
Research has shown that titanium can be used as a substitute in certain pipeline steels; however, as with niobium, titanium is added primarily for grain refinement and does not provide the strengthening produced by vanadium. Consequently, titanium-bearing steels usually also contain vanadium. In titanium alloys, vanadium can be replaced by other metals, principally niobium, tantalum, and zirconium, but all of these are considerably more expensive and do not offer the versatile properties obtained by the use of vanadium. However, a new range of niobium-boron-titanium steels developed in Japan in the early 1980's is finding applications in markets that formerly used vanadium steels.
DISTRIBUTION OF VANADIUM DEPOSITS
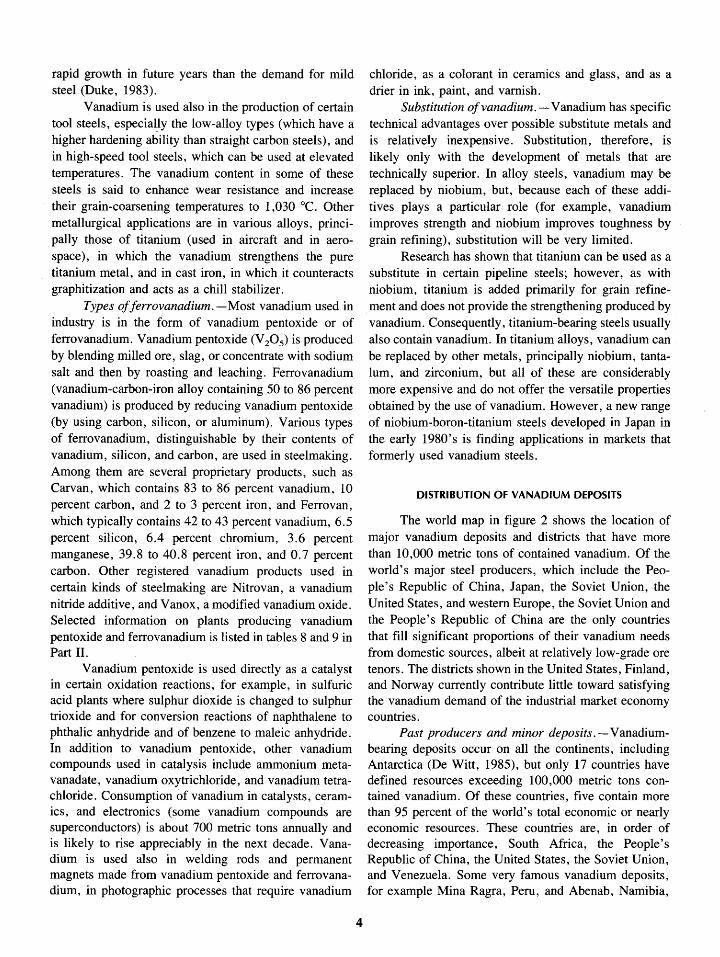
The world map in figure 2 shows the location of major vanadium deposits and districts that have more than 10,000 metric tons of contained vanadium. Of the world's major steel producers, which include the People's Republic of China, Japan, the Soviet Union, the United States, and western Europe, the Soviet Union and the People's Republic of China are the only countries that fill significant proportions of their vanadium needs from domestic sources, albeit at relatively low-grade ore tenors. The districts shown in the United States, Finland, and Norway currently contribute little toward satisfying the vanadium demand of the industrial market economy countries.
Past producers and minor deposits.- Vanadiumbearing deposits occur on all the continents, including Antarctica (De Witt, 1985), but only 17 countries have defined resources exceeding 100,000 metric tons contained vanadium. Of these countries, five contain more than 95 percent of the world's total economic or nearly economic resources. These countries are, in order of decreasing importance, South Africa, the People's Republic of China, the United States, the Soviet Union, and Venezuela. Some very famous vanadium deposits, for example Mina Ragra, Peru, and Abenab, Namibia,
VI
160° 40° oo 40° 80° 120° 160° I f]' ~~ :"~J~. 1 1
60°
~ '"' ~-~ // : -A • ~ -~·~ I;) NO~WAY . FINLAND ~( c·f· .,,-f /;1" ,d :COo::::. ~]0, ct:' Selv•g _,.(;! Mu"~~aara~ ) !S'J~' /
• 0: . '.c t)r<"'\ ROdMnd , ': \ ~" •kl I ' · "l.../: , f , ' 1 ( .,~ l \),_,_.!" SWEDEN ' 0 !'" j h~, ,
· ·- • Grangesb . l ({ &\ A ~ l:._., C-"9 m,'"- •, •<!>' > y · · ~ '' ) ~'I)" "
Duluth Co ~ ...; , •
400
Heath~V ~'("' ~VIETUNION ~h, 1- M•dntyce r ,, . fJ , , \ 6::::::: Kooh"""" , ,1i'
Iron Mountain ~ !' '~ ~ · ·..\ '.'. i Ayot ~ /"'y, Pho,phool• Fm . <; ) _ _j·~,' ..... ll~ko~k ! -•~ , ;;'~~ ~~:wi~ phosp;:~~~i:ld~---f- b -~~<s;=:~ ~. ~ o Ke""~c<:rc{.~r' ~~ r;~ ?0" ~ S;m G•bolel Mou t . ., .• I (.•· 0 :J;''·~ l- \ ,, l '-· '·, J,\ ), ""'''' <··-·"··" ""' ' . ,J .,,, ' \ ,I ( , • - , .• ..t~- M /) --•• , ___ " .. )j-' :; ~ ', ,
SEa It Wash - n ~ ' BURKINA FASO."' J' \(' ' ' / > .,, F ,,.', . , f{~' !' ..... ~··
"" ,' , u.· " • ~ ' "- , ,. ' , Ch _ada Sandsto~e I ...._ ,,,._., ~ Ou~l oeglon ;·", : I ,v ·-,_ ., " _I c;'? "'ty poopert "CI , l •. · ' INDIA' \·.1 > '· ' Wll,onSpolng: •, ,= .,.iv:NEZUELA ,· , ', '</"i>. i-.... \\ Blh !.:;;~;, r,~-' (--, _ _ /, • CHINA '(_ ~ Orinoco ~y--~~ ·c · \, 0 "Stoto ·' ·OC' •"· Chengd "( ,.3,' ···':-1-/-"'o.("'""' / . ' "'~ Stoto ', 'r '; ... n" M,.,,:,
,. ['~" ~_, __ . '-~''''- ' -n~ ,, . 1 - ~'"""""'"'"':.. - "' ,-'"•< ''"'"'" " e· :-:> ,___.._],; I< ·., ~ ""'""" Stole _.---11 ( - ' ·', "' , ; , "yr·-·c, . ~ ,7 J I ~~-<-,~ ~ \ •. ,,.,_ '?.-) BRAZIL · :J! li; ---r D · - , .,
oo
.. "
'- i ·c._ Uf.. C•mpo Ale ·-,, ··, ' BURUNDI ""( ,. .i'(;
~\ '- ,--i ) M'"''' 9" de Louode< • ''1' ~ M"k'"do/Buhooo-N . ':;<;, $~ 't CHILE Y"· ' I c ~ ~~-- yob''"' v· w~ ,. : '
El Romeral, / }1)v \-----~1'1 , TANZANIA AUSTRALIA ~_,.,,:--,~.)-, ('--. ~-· ·i I , \••"'•• Jull• c,.,, . , ;o--,_ f:'""- '"-' I• . B /~ '-.J- '
MER;:TOR PROJECTION :i ..J .r 0 SOU-!HAFRICA J:~.~~~~~-. 70' FT 0' LATITUDE ~! r Bu,hveld Compl .. (3 v .... bubb•arnge \] \ """
20° ·-
1000 500 70' ,' ( ) G•b.,lnth• 'f NEW ZEALAND
Bose loom 0 500 1000 KILO ( / """mble I We" Co•<t of
Boondooy .~~ndesanstalt '"' Geow METERS ~-. ,. :;''"dlmu"' \j / North l<l'"d
1. names representatlolssenschaften und R h ' Cuddadoo ~ ~ "· notnece<sanl o <to e oote< , , Y e~thon1f>t,.e • Yeell"'' 1J r-,'
(I 40° ·-
EXPLANATION
PRODUCER NON PRODUCER DEPOSIT TYPE PAST PRODUCERS
• 0 Magmatic (] () Those with current resources >10,000 metric tons of contained vanadium
• 6 Noncarbonaceous syngenetic sediment hosted SIZE CLASSIFICATION • \] Carbon-rich syngenetic sediment hosted
• 0 Epigenetic 0 Large to very large deposits >1,000,000 metric tons of contained vanadium
0 Small to medium deposits 10,000 to 1,000,000 metric tons of contained vanadium
• 0 Surficial
FIGURE 2. Location, geologic deposit type, and estimated resources of major vanadium deposits and districts in the world. Number in parentheses (following Bushveld Complex) indicates number of records (deposits and districts). Location names are from tables 6 and 7 in Part II.
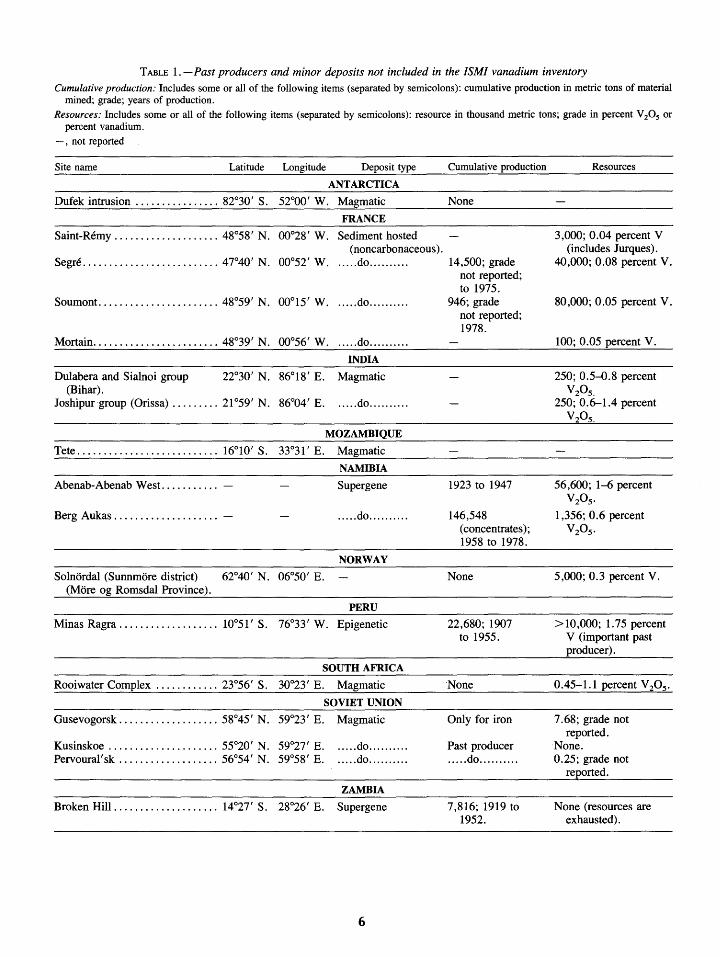
TABLE 1.-Past producers and minor deposits not included in the ISM/ vanadium inventory Cumulative production: Includes some or all of the following items (separated by semicolons): cumulative production in metric tons of material
mined; grade; years of production. Resources: Includes some or all of the following items (separated by semicolons): resource in thousand metric tons; grade in percent V20 5 or
percent vanadium. -, not reported
Site name Latitude Longitude Deposit type
ANTARCTICA
Dufek intrusion ................ 82°30' S. 52°00' W. Magmatic
FRANCE
Saint-Remy .................... 48°58' N. 00°28' W. Sediment hosted (noncarbonaceous).
Segre .......................... 47°40' N. 00°52' W. . .... do ......... .
Soumont. ...................... 48°59' N. 00°15' W. . .... do ......... .
Mortain ........................ 48°39' N. 00°56' W ...... do ......... .
INDIA
Dulabera and Sialnoi group 22°30' N. 86°18' E. Magmatic (Bihar).
Joshipur group (Orissa) ......... 21°59' N. 86°04' E. . .... do ......... .
MOZAMBIQUE
Tete ........................... 16°10' S. 33°31' E. Magmatic
NAMffiiA
Abenab-Abenab West........... Supergene
Berg Aukas . . . . . . . . . . . . . . . . . . . . . .... do ......... .
NORWAY
Solnordal (Sunnmore district) 62°40' N. 06°50' E. (More og Romsdal Province).
PERU
Minas Ragra ................... 10°51' S. 76°33' W. Epigenetic
SOUTH AFRICA
Rooiwater Complex ............ 23°56' S. 30°23' E. Magmatic
SOVIET UNION
Gusevogorsk ................... 58°45' N. 59°23' E. Magmatic
Kusinskoe ..................... 55°20' N. 59°27' E. ..... do ......... . Pervoural'sk ................... 56°54' N. 59°58' E. ..... do ......... .
ZAMBIA
Broken Hill .................... 14°27' S. 28°26' E. Supergene
6
Cumulative production
None
14,500; grade not reported; to 1975.
946; grade not reported; 1978.
1923 to 1947
146,548 (concentrates); 1958 to 1978.
None
22,680; 1907 to 1955.
None
Only for iron
Past producer ..... do ..........
7,816; 1919 to 1952.
Resources
3,000; 0.04 percent V (includes Jurques).
40,000; 0.08 percent V.
80,000; 0.05 percent V.
100; 0.05 percent V.
250; 0. 5-0.8 percent VzOs.
250; 0.6-1.4 percent VzOs.
56,600; 1-6 percent VzOs.
1 ,356; 0.6 percent VzOs.
5,000; 0.3 percent V.
> 10,000; 1. 75 percent V (important past producer).
0.45-1.1 percent V20 5 •
7.68; grade not reported.
None . 0. 25; grade not
reported.
None (resources are exhausted).
are now depleted or have little chance of economic exploitation in the foreseeable future. For the sake of completeness of the record, such important past producers, as well as some documented minor deposits containing generally less than 10,000 metric tons contained vanadium, are not shown in figure 2 but are listed in table 1.
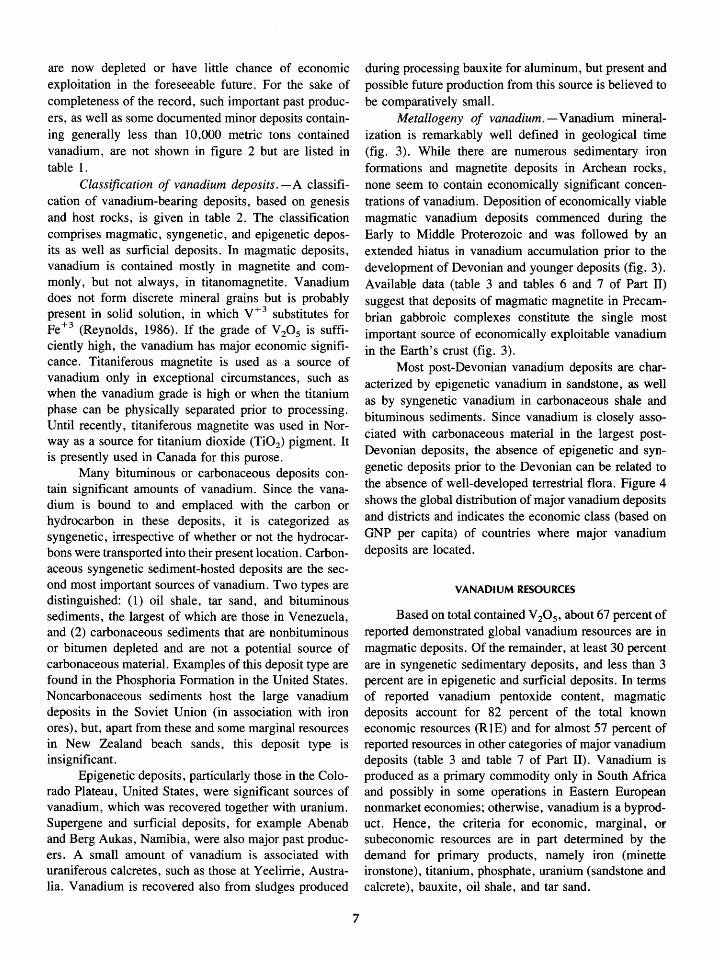
Classification of vanadium deposits.- A classification of vanadium-bearing deposits, based on genesis and host rocks, is given in table 2. The classification comprises magmatic, syngenetic, and epigenetic deposits as well as surficial deposits. In magmatic deposits, vanadium is contained mostly in magnetite and commonly, but not always, in titanomagnetite. Vanadium does not form discrete mineral grains but is probably present in solid solution, in which V+ 3 substitutes for Fe +3 (Reynolds, 1986). If the grade of V 20 5 is sufficiently high, the vanadium has major economic significance. Titaniferous magnetite is used as a source of vanadium only in exceptional circumstances, such as when the vanadium grade is high or when the titanium phase can be physically separated prior to processing. Until recently, titaniferous magnetite was used in Norway as a source for titanium dioxide (Ti02) pigment. It is presently used in Canada for this purose.
Many bituminous or carbonaceous deposits contain significant amounts of vanadium. Since the vanadium is bound to and emplaced with the carbon or hydrocarbon in these deposits, it is categorized as syngenetic, irrespective of whether or not the hydrocarbons were transported into their present location. Carbonaceous syngenetic sediment-hosted deposits are the second most important sources of vanadium. Two types are distinguished: (1) oil shale, tar sand, and bituminous sediments, the largest of which are those in Venezuela, and (2) carbonaceous sediments that are nonbituminous or bitumen depleted and are not a potential source of carbonaceous material. Examples of this deposit type are found in the Phosphoria Formation in the United States. Noncarbonaceous sediments host the large vanadium deposits in the Soviet Union (in association with iron ores), but, apart from these and some marginal resources in New Zealand beach sands, this deposit type is insignificant.
Epigenetic deposits, particularly those in the Colorado Plateau, United States, were significant sources of vanadium, which was recovered together with uranium. Supergene and surficial deposits, for example Abenab and Berg Aukas, Namibia, were also major past producers. A small amount of vanadium is associated with uraniferous calcretes, such as those at Yeelirrie, Australia. Vanadium is recovered also from sludges produced
7
during processing bauxite for aluminum, but present and possible future production from this source is believed to be comparatively small.
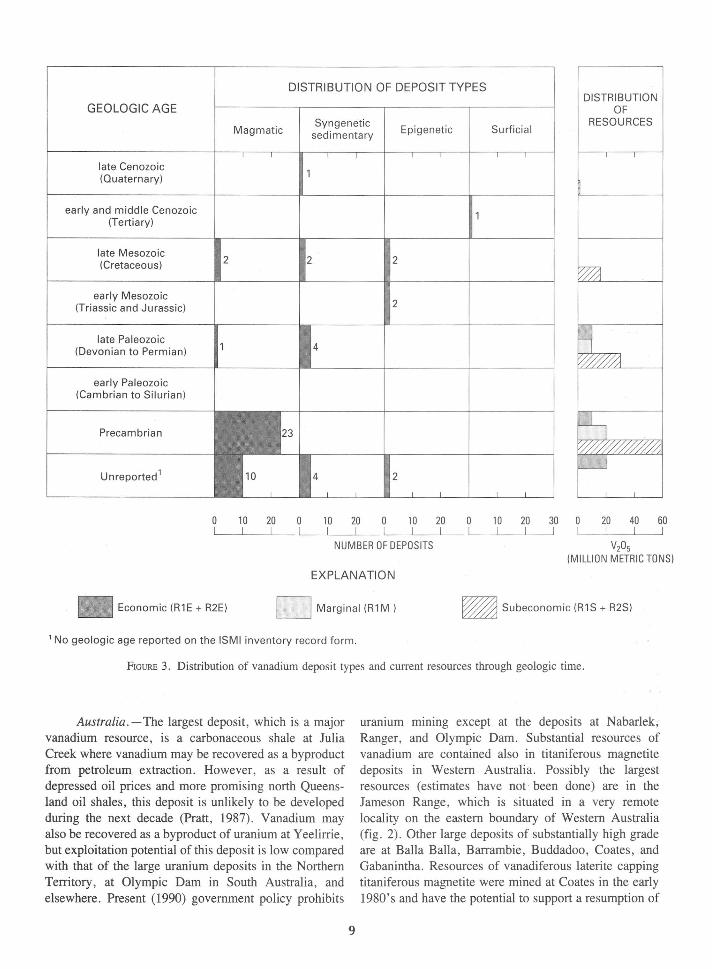
Metallogeny of vanadium.-Vanadium mineralization is remarkably well defined in geological time (fig. 3). While there are numerous sedimentary iron formations and magnetite deposits in Archean rocks, none seem to contain economically significant concentrations of vanadium. Deposition of economically viable magmatic vanadium deposits commenced during the Early to Middle Proterozoic and was followed by an extended hiatus in vanadium accumulation prior to the development of Devonian and younger deposits (fig. 3). Available data (table 3 and tables 6 and 7 of Part II) suggest that deposits of magmatic magnetite in Precambrian gabbroic complexes constitute the single most important source of economically exploitable vanadium in the Earth's cmst (fig. 3).
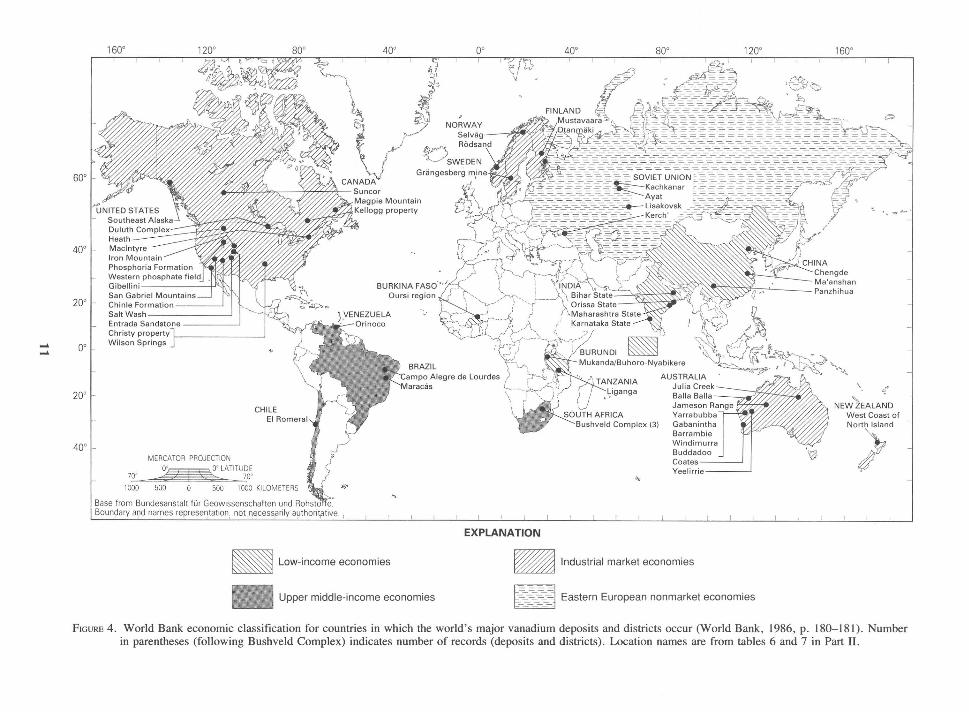
Most post-Devonian vanadium deposits are characterized by epigenetic vanadium in sandstone, as well as by syngenetic vanadium in carbonaceous shale and bituminous sediments. Since vanadium is closely associated with carbonaceous material in the largest postDevonian deposits, the absence of epigenetic and syngenetic deposits prior to the Devonian can be related to the absence of well-developed terrestrial flora. Figure 4 shows the global distribution of major vanadium deposits and districts and indicates the economic class (based on GNP per capita) of countries where major vanadium deposits are located.
VANADIUM RESOURCES
Based on total contained V 20 5 , about 67 percent of reported demonstrated global vanadium resources are in magmatic deposits. Of the remainder, at least 30 percent are in syngenetic sedimentary deposits, and less than 3 percent are in epigenetic and surficial deposits. In terms of reported vanadium pentoxide content, magmatic deposits account for 82 percent of the total known economic resources (R1E) and for almost 57 percent of reported resources in other categories of major vanadium deposits (table 3 and table 7 of Part II). Vanadium is produced as a primary commodity only in South Africa and possibly in some operations in Eastern European nonmarket economies; otherwise, vanadium is a byproduct. Hence, the criteria for economic, marginal, or subeconomic resources are in part determined by the demand for primary products, namely iron (minette ironstone), titanium, phosphate, uranium (sandstone and calcrete), bauxite, oil shale, and tar sand.
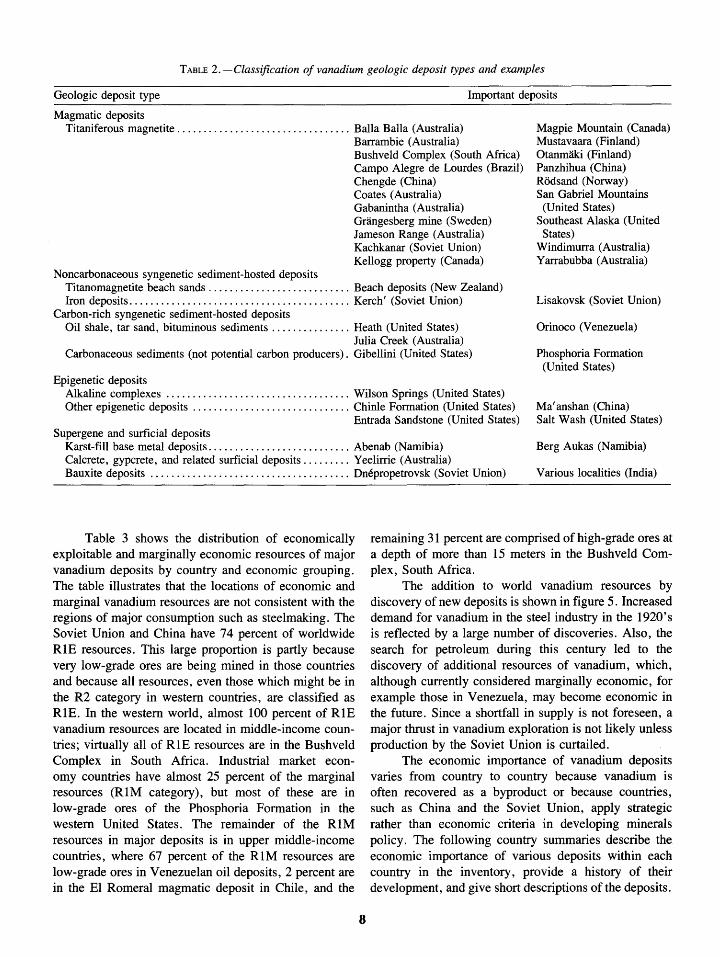
TABLE 2.-Classification of vanadium geologic deposit types and examples
Geologic deposit type Important deposits
Magmatic deposits Titaniferous magnetite ................................. Balla Balla (Australia)
Barrambie (Australia) Magpie Mountain (Canada) Mustavaara (Finland) Otanmaki (Finland) Panzhihua (China)
Bushveld Complex (South Africa) Campo Alegre de Lourdes (Brazil) Chengde (China) Rodsand (Norway) Coates (Australia) San Gabriel Mountains
(United States) Southeast Alaska (United
States)
Gabanintha (Australia) Grangesberg mine (Sweden) Jameson Range (Australia) Kachkanar (Soviet Union) Windimurra (Australia)
Y arrabubba (Australia) Kellogg property (Canada) Noncarbonaceous syngenetic sediment-hosted deposits
Titanomagnetite beach sands . . . . . . . . . . . . . . . . . . . . . . . . . . . Beach deposits (New Zealand) Iron deposits .......................................... Kerch' (Soviet Union) Lisakovsk (Soviet Union)
Carbon-rich syngenetic sediment-hosted deposits Oil shale, tar sand, bituminous sediments ............... Heath (United States) Orinoco (Venezuela)
Julia Creek (Australia) Carbonaceous sediments (not potential carbon producers). Gibellini (United States) Phosphoria Formation
(United States) Epigenetic deposits
Alkaline complexes ................................... Wilson Springs (United States) Other epigenetic deposits .............................. Chinle Formation (United States)
Entrada Sandstone (United States) Ma'anshan (China) Salt Wash (United States)
Supergene and surficial deposits Karst-fill base metal deposits ........................... Abenab (Namibia) Berg Aukas (Namibia) Calcrete, gypcrete, and related surficial deposits ......... Yeelirrie (Australia) Bauxite deposits ...................................... Dnepropetrovsk (Soviet Union) Various localities (India)
Table 3 shows the distribution of economically exploitable and marginally economic resources of major vanadium deposits by country and economic grouping. The table illustrates that the locations of economic and marginal vanadium resources are not consistent with the regions of major consumption such as steelmaking. The Soviet Union and China have 74 percent of worldwide RlE resources. This large proportion is partly because very low-grade ores are being mined in those countries and because all resources, even those which might be in the R2 category in western countries, are classified as RlE. In the western world, almost 100 percent of RlE vanadium resources are located in middle-income countries; virtually all of RlE resources are in the Bushveld Complex in South Africa. Industrial market economy countries have almost 25 percent of the marginal resources (RlM category), but most of these are in low-grade ores of the Phosphoria Formation in the western United States. The remainder of the RlM resources in major deposits is in upper middle-income countries, where 67 percent of the RlM resources are low-grade ores in Venezuelan oil deposits, 2 percent are in the El Romeral magmatic deposit in Chile, and the
8
remaining 31 percent are comprised of high-grade ores at a depth of more than 15 meters in the Bushveld Complex, South Africa.
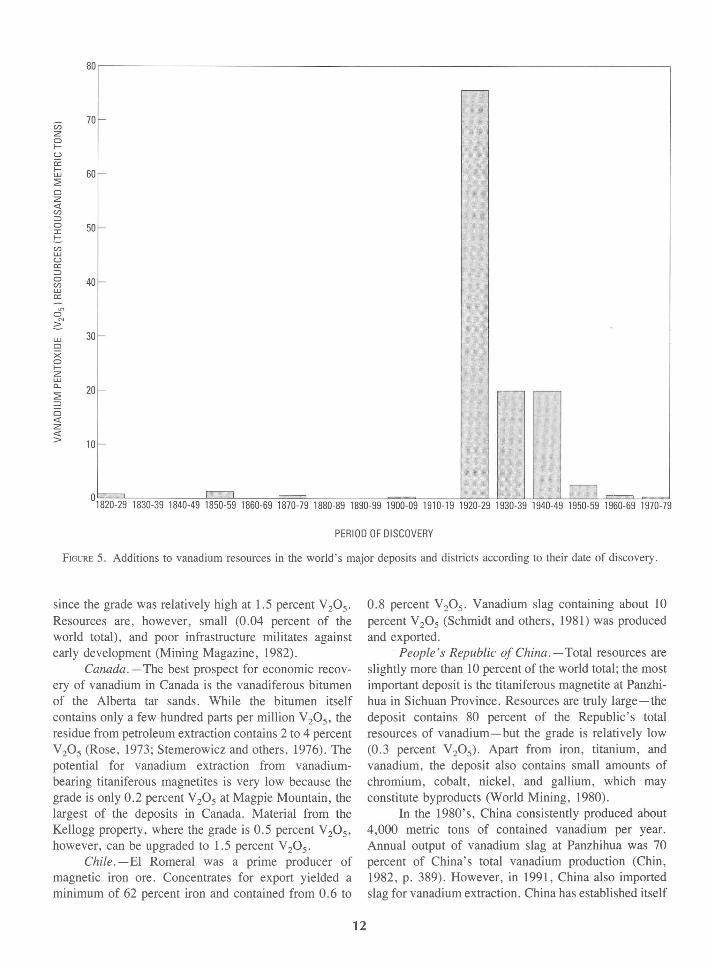
The addition to world vanadium resources by discovery of new deposits is shown in figure 5. Increased demand for vanadium in the steel industry in the 1920's is reflected by a large number of discoveries. Also, the search for petroleum during this century led to the discovery of additional resources of vanadium, which, although currently considered marginally economic, for example those in Venezuela, may become economic in the future. Since a shortfall in supply is not foreseen, a major thrust in vanadium exploration is not likely unless production by the Soviet Union is curtailed.
The economic importance of vanadium deposits varies from country to country because vanadium is often recovered as a byproduct or because countries, such as China and the Soviet Union, apply strategic rather than economic criteria in developing minerals policy. The following country summaries describe the economic importance of various deposits within each country in the inventory, provide a history of their development, and give short descriptions of the deposits.
TABLE 3. -Known economic (RJE) and marginal (RIM) world vanadium resources listed by World Bank economic class of country, country, and resource classification
[Figures are in thousand metric tons of vanadium pentoxide. N.r. = not reported]
ECONOMIC CLASS 1 Deposit type
Country Magmatic Syngenetic sedimentary Epigenetic Surficial Total
Carbon rich Non carbonaceous Economically exploitable resources (R1E)2
LOW INCOME China ................................. 3,448 N.r. N.r. 840 N.r. 4,288
UPPER MIDDLE INCOME Brazil. ................................ 42 N.r. N.r. N.r. N.r. 42 Chile ................................. 486 N.r. N.r. N.r. N.r. 486 South Africa3 ......................... 5,201 N.r. N.r. N.r. N.r. 5,201 Venezuela ............................. N.r. N.r. N.r. N.r. N.r. N.r.
Subtotal .......................... 5,729 N.r. N.r. N.r. N.r. 5,729 INDUSTRIAL MARKET
Australia .............................. N.r. N.r. N.r. N.r. 10 10 Finland ............................... N.r. N.r. N.r. N.r. N.r. N.r. Norway ............................... N.r. N.r. N.r. N.r. N.r. N.r. United States .......................... 2 N.r. N.r. N.r. N.r. 2
Subtotal .......................... 2 N.r. N.r. N.r. 10 12 EAST EUROPEAN NONMARKET
Soviet Union .......................... 49,150 N.r. 3,000 N.r. N.r. 12,150 World total ....................... 18,329 N.r. 3,000 840 10 22,179
Marginally economic resources (R1M)2
LOW INCOME China ................................. N.r. N.r. N.r. N.r. N.r. N.r.
UPPER MIDDLE INCOME Brazil. ................................ N.r. N.r. N.r. N.r. N.r. N.r. Chile ................................. 534 N.r. N.r. N.r. N.r. 534 South Africa3 ......................... 8,400 N.r. N.r. N.r. N.r. 8,400 Venezuela ............................. N.r 18,000 N.r. N.r. N.r. 18,000
Subtotal .......................... 8,934 18,000 N.r. N.r. N.r. 26,934 INDUSTRIAL MARKET
Australia .............................. 293 N.r. N.r. N.r. 6 299 Finland ............................... N.r. 194 N.r. N.r. N.r. 194 Norway ............................... 88 N.r. N.r. N.r. N.r. 88 United States .......................... 740 7,338 N.r. N.r. N.r. 8,078
Subtotal .......................... 1 '121 7,532 N.r. N.r. 6 8,659 EAST EUROPEAN NONMARKET
Soviet Union .......................... N.r. N.r. N.r. N.r. N.r. N.r. World total ....................... 10,055 25,532 N.r. N.r. 6 35,593
1 Based principally on GNP per capita and, in some instances, on other distinguishing economic characteristics (World Bank, 1986, p. 180-181). Two other economic classes, high-income oil exporters and lower middle income, are not listed because those countries do not have reliable identified economic or marginal resources.
2 Reliable estimates from identified deposits that have economically exploitable (RlE) or marginally economic (RIM) resources (fig. 1). 3 Includes Bophuthatswana. 4 Includes R2E resources.
mining with processing plant improvements and favorable economic conditions.
Brazil. -Only two deposits are known, and these contain less than 1 percent of the total world resources. Exploitation of the largest deposit, at Campo Alegre de Lourdes, is constrained by a poor infrastructure (Gottschalk, 1980; Bureau de Recherches Geologiques et Minieres, 1985).
10
Burkina F aso (previously Upper Volta).-Exploration for titaniferous magnetite delineated ten deposits in the Oursi region, notably at Tin Edia. Vanadium content of the magnetite in the Oursi region is lower than that in Burundi (Neybergh and others, 1980, p. 42), but the resources there are slightly larger.
Burundi. -Discovery of a vanadiferous magnetite deposit generated some optimism in the early 1980's
DISTRIBUTION OF DEPOSIT TYPES
GEOLOGIC AGE
Magmatic Syngenetic
sedimentary Epigenetic Surficial
DISTRIBUTION OF
RESOURCES
late Cenozoic (Quaternary)
early and middle Cenozoic (Tertiary)
late Mesozoic (Cretaceous)
early Mesozoic (Triassic and Jurassic)
late Paleozoic (Devonian to Permian)
early Paleozoic (Cambrian to Silurian)
Precambrian
Unreported 1
2 2
2
4
2
0 10 20 0 10 20 0 10 20 0 10 20 30 0 20 40 60
NUMBER OF DEPOSITS V205 (MILLION METRIC TONS)
EXPLANATION
~Economic (R1E + R2E) D Marginal (R1 M ) ~ Subeconomic (R1S + R2S)
1 No geo logic age reported on the ISM I inventory record form.
FIGURE 3. Distribution of vanadium deposit types and current resources through geologic time.
Australia.-The largest deposit, which is a major vanadium resource, is a carbonaceous shale at Julia Creek where vanadium may be recovered as a byproduct from petroleum extraction. However, as a result of depressed oil prices and more promising north Queensland oil shales, this deposit is unlikely to be developed during the next decade (Pratt, 1987). Vanadium may also be recovered as a byproduct of uranium at Yeelirrie, but exploitation potential of this deposit is low compared with that of the large uranium deposits in the Northern Territory, at Olympic Dam in South Australia, and elsewhere. Present (1990) government policy prohibits
9
uranium mmmg except at the deposits at Nabarlek; Ranger, and Olympic Dam. Substantial resources of vanadium are contained also in titaniferous magnetite deposits in Western Australia. Possibly the largest resources (estimates have not been done) are in the Jameson Range, which is situated in a very remote locality on the eastern boundary of Western Australia (fig. 2). Other large deposits of substantially high grade are at Balla Balla, Barrambie, Buddadoo, Coates, and Gabanintha. Resources of vanadiferous laterite capping titaniferous magnetite were mined at Coates in the early 1980 's and have the potential to support a resumption of
.... ....
160° 120° 40° 40° 80° 120° 160° ,,- , _ --,~hrr ,,, t: ~41£ ·~e,
>'i~~11t«~·-~ 60° ·-
• , _ ........
40° ·-
20° ·-
oo
AUSTRALIA
20° ·-Julia Creek~ . Balla Balla
0
' NEW ZEALAND West Coast of North Island
Barrambie J ~ > Windimurra Buddadoo '0 Coates Yeelirrie
"'
40° MERCATOR PROJECTION
70, O'ZTT O' LATITUfo~
1000 500 500
Base from Bundesanstalt fOr Geow1ssenschaften und Boundary a~d names represe~tation; not necessprily a~thorn,anve . ,
EXPLANATION
- Low-income economies - Industrial market economies
Upper middle-income economies 1$-~::Sj Eastern European nonmarket economies
FIGURE 4 . World Bank economic classification for countries in which the world's major vanadium deposits and districts occur (World Bank, 1986, p. 180-181). Number in parentheses (following Bushveld Complex) indicates number of records (deposits and districts). Location names are from tables 6 and 7 in Part II .
80
~
en 70 f-
z 0 f-u cc
r-f- 60 L.U
::2: 0 z <( (/)
::::> f-0 50 I
!:=. (/) LU u cc ::::>
f-0 40 (/) LU cc
0 ;£
r- ; LU 30 0 !
x 0 f-z LU
f- ,---- -"- 20 ::2: ::::> 0 <( z <( > 10 f-
1------o r---1 ....,-------, ll~ 0 1820-29 1830-39 1840-49 1850-59 1860-69 1870-79 1880-89 1890-99 1900-09 1910-19 1920-29 1930-39 1940-49 1950-59 1960-69 1970-79
PERIOD OF DISCOVERY
FIGURE 5. Additions to vanadium resources in the world's major deposits and districts according to their date of discovery.
since the grade was relatively high at 1.5 percent V 20 5 .
Resources are, however, small (0.04 percent of the world total), and poor infrastructure militates against early development (Mining Magazine, 1982).
Canada.-The best prospect for economic recovery of vanadium in Canada is the vanadiferous bitumen of the Alberta tar sands. While the bitumen itself contains only a few hundred parts per million V 20 5 , the residue from petroleum extraction contains 2 to 4 percent V 20 5 (Rose, 1973; Stemerowicz and others, 1976). The potential for vanadium extraction from vanadiumbearing titaniferous magnetites is very low because the grade is only 0.2 percent V 20 5 at Magpie Mountain, the largest of the deposits in Canada. Material from the Kellogg property, where the grade is 0.5 percent V 20 5 ,
however, can be upgraded to 1.5 percent V20 5 .
Chile.- El Romeral was a prime producer of magnetic iron ore. Concentrates for export yielded a minimum of 62 percent iron and contained from 0.6 to
12
0.8 percent V 20 5 . Vanadium slag containing about 10 percent V20 5 (Schmidt and others, 1981) was produced and exported.
People's Republic of China.-Total resources are slightly more than 10 percent of the world total; the most important deposit is the titaniferous magnetite at Panzhihua in Sichuan Province. Resources are truly large-the deposit contains 80 percent of the Republic's total resources of vanadium-but the grade is relatively low (0.3 percent V20 5). Apart from iron, titanium, and vanadium, the deposit also contains small amounts of chromium, cobalt, nickel, and gallium, which may constitute byproducts (World Mining, 1980).
In the 1980's, China consistently produced about 4,000 metric tons of contained vanadium per year. Annual output of vanadium slag at Panzhihua was 70 percent of China's total vanadium production (Chin, 1982, p. 389). However, in 1991, China also imported slag for vanadium extraction. China has established itself
as a major exporter of vanadium; because domestic consumption is only one-third of total production, Panzhihua contributes substantially toward foreign trade (Brady, 1981). The second largest vanadium producer is the Chengde, Hebei, steel mill, which treats ore that has been mined locally; the third largest is the iron deposit mined to serve the Ma' anshan, Anhui, steel mill (Brady, 1981, p. 55). In addition, small amounts of vanadium pentoxide have been produced since 1977 from sapropelic coals (Wang, 1980).
Finland.- Vanadium resources in magmatic deposits at Otanmald and Mustavaara are relatively low grade at 0.36 and 0.25 percent V20 5 , respectively. Because of unfavorable market conditions, mining operations at both deposits were suspended in 1985 (Salo, 1986). However, if market conditions improve, the deposits can be marginally economic.
India. -Despite intensive exploration of numerous titaniferous magnetite deposits, resources are subeconomic and small compared to the world total. Indian bauxite may have potential as a source of vanadium since it contains between 0.01 and 0.2 percent V20 5 , but no resource estimate has been calculated (Fortnightly Journal of Industry and Commerce Review, 1979; Vasudev and Srinivasan, 1979).
New Zealand.- The iron sands in Pleistocene and Holocene modern beaches and raised fossil beaches (Williams, 1965) stretch along 500 km of the west coast of North Island and contain between 1 and 2 percent of the world's total vanadium resources. Mining operations for magnetite beneficiation are located at Waikato North Head, Taharoa, and at Waipipi (New Zealand Geological Survey staff, 1981), but no vanadium has been produced. Plans for recovery of vanadium from steelmaking slag have been reported as part of New Zealand Steel Ltd.'s expansion, which was expected to be completed in 1986 (Sage, 1986). The company obtains its iron ore from Waikato North Head.
Norway.- The magnetite ore of Norway is westem Europe's richest source of titanium, but the vanadium content is low (only as much as 0. 2 percent vanadium in ore and 0. 5 percent in concentrate). The Bamle metallogenic province contains the largest amount of vanadium in both ore and concentrate (Geis, 1971), but for 104 years the vanadiferous magnetite deposit at Rodsand in More og Romsdal Province was a source of iron and vanadium (United Nations Department of Economic and Social Affairs, 1970). Mining operations at Rodsand were suspended in 1982 because it had been operating at a loss (U.S. Bureau of Mines, 1982).
13
South Africa.-The Bushveld Complex contains the world's largest vanadium resources of both the Rl and RlE categories. These vast resources are a result of the remarkable persistency of vanadiferous magnetite, both laterally and in depth, and its anomalously high vanadium content, averaging 1.6 percent V 20 5 but exceeding 2 percent V20 5 in places (Willemse, 1969).
The extent of Bushveld resources was not understood when a comprehensive summary of geological investigations in the Complex was published by Hall (1932). The presence of vanadium in magnetite had been first reported by Adam (1923), was studied in some detail by Schwellnus and Willemse (1943), and was depicted on the first mineral map of South Africa in 1959 (DeVilliers, 1959). Systematic prospecting was done in the 1960's and various resource estimates were made. On the basis of work by Schutte (1976), von Gruenewaldt (1977) estimated that the upper 30 meters of vanadium-bearing material contained about 16.8 million metric tons V 20 5 . Recently, the resource base was revised to 7. 2 million metric tons of vanadium metal of which 2 million metric tons are located in Bophuthatswana (MacCaskie, 1984). This figure comprises 3 .4 million metric tons of demonstrated economic (RlE) and 3.8 million metric tons of marginal (RIM) vanadium metal resources in magnetite deposits containing more than 1.25 percent V 20 5 that are less than 15 meters deep.
In the estimations by von Gruenewaldt ( 1977) and MacCaskie (1984), the giant Uppermost Magnetite Seam (No. 21) was not included in view of its relatively low vanadium content of 0.3 percent V 20 5 . Such low grades are, however, normal for most vanadiferous magnetites throughout the world. In order to put the Bushveld Complex into world perspective, 46 million metric tons of V20 5 (Schutte, 1976) would be added to the subeconomic resources (R2S) if the Uppermost Magnetite Seam were included. In places, vanadiferous titanomagnetite is not confined to specific seams but is dispersed over a wide zone comprising numerous closely spaced seams, which are amenable to opencast mining.
In this inventory, South African RlE and R2E resources are calculated to a cutoff grade of 1. 25 percent V 20 5 , to vertical depths of 15 and 80 meters, respectively, and are in deposits amenable to outcrop working and opencast mining. RIM category comprises 15 to 20 meters depth extensions of R 1 E resources. R 1 S and R2S categories include down-dip extensions of minable seams to a vertical depth of 200 meters, all less wellprospected seams, and all lower grade titanomagnetite that has a cut-off value of 0.3 percent V20 5 to the same depth.
Soviet Union.- Little is known about the Soviet Union's vanadium deposits, but resources may be very large, although of low grade. The largest deposit and the largest producer is Kachkanar, a titanomagnetite deposit of iron ore in the Central Urals. Tonnages of 2. 6 to 11.8 billion metric tons and grades between 0.08 and 0.35 percent vanadium in concentrate (0 .14 to 0. 63 percent V 20 5) are reported (Metals Sourcebook, 1973). In this report (table 3 and table 7 of Part II), a grade of 0.39 percent V 20 5 was used. Quoted resources were increased to 6.1 billion metric tons by Metals Sourcebook ( 1973). The minette iron ore mines at Lisakovsk and in Ayat in Kazakhstan are the second largest producers. According to Sokoloff (as quoted by Mineral Trade Notes, 1961), the Western Kazakhstan district has virtually unlimited resources of phosphoritic and oolitic brown ironstone suited for open-pit mining. Subsequently, Sokoloff (1963) stated that the iron ore at Kerch', Lisakovsk, and Ayat probably accounts for more than two-thirds of the 6.35 billion metric tons of the proven economic brown iron ore resource of the Soviet Union. Discounting 1 billion metric tons for Kerch', the resources at Lisakovsk and Ayat can be calculated as approximately 3.4 billion metric tons, which compares well to earlier published resources of 3. 367 billion metric tons containing 0.1 percent V 20 5 (Mineral Trade Notes, 1961; Strishkov, 1977 and 1979). In this report (table 3 and table 7 of Part II), resources of 3 billion tons at 0.1 percent V 20 5 were used.
Vanadium pentoxide has been recovered as a byproduct in the production of alumina from bauxite at Dnepropetrovsk (U.S. Bureau of Mines, 1977), and the Soviet Government announced that a commercial process for vanadium recovery from oil shale had been developed (U.S. Bureau of Mines, 1984). If these resources, for which no estimates are available, and the ironstone at Kerch' are taken into account, the low-grade vanadium resources in the Soviet Union may be substantially greater than those given in this inventory.
Sweden.-The deposits at the Gri:ingesberg mine are included in this inventory, but no vanadium production seems likely because of the low tenor of the ores.
Tanzania. -Four titaniferous magnetite bodies in the Njombe district have been prospected, but the resources are relatively small and the vanadium grade is low.
United States.-The United States ranks second in total world demonstrated resources (R1) but has a serious shortage of economic resources (R1E). Sandstonehosted uraniferous deposits on the Colorado Plateau have been significant producers since the beginning of this century, and vanadium has been recovered from these
14
deposits as a byproduct of uranium since World War II. Resources at some of these deposits are depleted, while the depressed uranium market, which shows no sign of improvement, renders exploitation elsewhere uneconomic.
In 1986, the only source of vanadium production was the Phosphoria Formation in the western United States, where vanadium was a byproduct of phosphate processing. Total resources in the phosphate field are large and constitute approximately 3 percent of the world total. Alaskan titaniferous magnetite deposits also contain large low-grade resources of vanadium, but it is unlikely that these could be economically exploited in the foreseeable future.
Venezuela. -Because of an anomalously high vanadium content of 100 to 1 ,400 parts per million in the Maracaibo and Orinoco oil fields, Venezuela ranks fourth in total vanadium resources (R1). It should be noted that vanadium can be recovered from oil when it is concentrated in residues, for example in fly ash or flexicoke. It can also be recovered from poisoned catalysts in refineries. Estimates of Venezuela's oil resources differ widely from 500 billion barrels in place, of which 300 billion barrels are considered to be recoverable (Kapo and Lopez, 1973), to 1.5 trillion barrels containing 150 to 500 parts per million vanadium for the Orinoco field alone (U.S. Bureau of Mines, 1983).
Development of the Orinoco oil field and largescale production of byproduct vanadium are underway, and production of vanadium pentoxide in flexicoke (presumably from the Maracaibo field) is almost 3,000 tons per year (U.S. Bureau of Mines, 1983). Using an in-place resource estimate of 500 billion barrels of heavy crude oil and an average vanadium content of 200 parts per million (Kapo and Lopez, 1973), the in-place vanadium resources are 14.4 million metric tons. The corresponding number for a recoverable resource of 300 billion barrels of oil is 8. 64 million metric tons of vanadium metal contained in the crude oil.
Using further a production rate of 227 million barrels of oil per year and a concomitant byproduct vanadium pentoxide extraction of 3,000 metric tons per year (U.S. Bureau of Mines, 1983) and assuming a life span of 30 years, the economic vanadium resources in Venezuela are about 90,000 metric tons of vanadium pentoxide, or 50,400 metric tons of vanadium metal. The amount of vanadium recovered from this source was small when the United States was the only country processing both ash and flexicoking residues from Venezuelan oil. With the modernization of the Rotterdam refinery in the Netherlands, this production was expected to grow from 1986 on (U.S. Bureau of Mines, 1985).
Venezuela's vanadium resources can be used only in installations (mainly elsewhere in the world) that produce, or can procure, sufficient oil residues to warrant a vanadium extraction plant. The implications are, therefore, that only a relatively small proportion of this country's huge vanadium resources is economically recoverable.
VANADIUM PRODUCTION
Large-scale commercial use of vanadium started in the early 1900's as a result of the development of tungsten-vanadium and chromium-vanadium tool steels, as exhibited in the United States in 1906. Further technological progress shortly thereafter helped to enhance the potential for vanadium as an alloy element and, with the discovery of the rich vanadium-bearing asphaltic deposits at Minas Ragra, Peru, in 1905, vanadium became a metal of economic significance and of specialized industrial use.
Production history. -An historical portrayal of world production , listed by country, is given in figure 6. In the United States, the first commercial production of vanadium additives for steelmaking commenced in 1909. Subsequently, increased usage in this field provided the stimulus for growth of the vanadium industry to its present dimension . Since 1960, the use of vanadium in nonferrous alloys, principally titanium alloys for jet engines and airframes, has become significant. In 1960, vanadium oxide was recovered in the United States by three companies at four plants. By 1980, there were 11 facilities in the United States, and these plants used mainly uranium-vanadium ores from the Colorado Plateau. However, production diminished significantly after the decline in the uranium market, and total U.S. production from primary ore was reduced to about 1 ,600 metric tons in 1984. An additional 1, 700 metric tons of U.S . vanadium production, which came from processing fly ash, petroleum residues, and spent catalysts, increased to almost 2,700 tons in 1985 (Kuck, 1985).
Production in South Africa commenced in 1957 with output from an American-based company operating a mine at Kennedy 's Vale in the Eastern Transvaal. The mine was closed in 1972 and was superseded by the Mapochs mine at Roossenekal. South Africa now has several plants , such as the Highveld Steel and Vanadium Corporation plant near Witbank, for smelting ore and vanadium recovery as slag and vanadium oxide. Vanadium output from South Africa is the largest in the world and is likely to remain so for many years.
The Soviet Union is the world's second leading vanadium producer after South Africa. However, few
15
100
90
80 z 0 f= (.) 70 :::;) 0 0 tl:: c.. :2: 60 :::;)
0 <{ z
50 <{ > Cl -' tl:: 0
40 s u.. 0 1-z
30 LJ.J (.) tl:: LJ.J c..
20
10
0
.. ' ' I
·.·-.: .. :.·
1950 (2,813)
1960 (6,564)
1970 (18,299)
YEAR
1980 (30,589)
' /
'''
r: I~ I '- I ..._
\- I I
- ' ' ' - ' ' ' '
' /
,· /
' ' I'- I ..._
\- I I
- ' ' , - ' J
' ' ' I ' /
1988 (30,527)
(Total world production in metric tons)
.. Chile
C=:Jchina
~Finland
t·· . · : j Namibia
.. Norway
EXPLANATION
I > [ [I Peru
I' :; ·, ~ I South Africa
C=:J United States 1
~Zambia 1 U.S. total in 1988 withheld to avoid disclosing company proprietary data; therefore, U.S. total is not included in world total.
FIGURE 6. Proportions of total world mine production of vanadium accounted for by countries that have major deposits and districts in the ISMI vanadium inventory, selected years 1950-88. (Reported production sources: U.S. Bureau of Mines, 1953-89; Hilliard, 1989. Note that information on Soviet Union production is not available prior to 1970.)
reliable production data are available. Furthermore, while the Soviet Union was once a exporter, it now relies on substantial imports to sustain its requirement. Principal deposits being worked, all of a low grade compared
with those elsewhere in the world, are Kachkanar, Kerch', Ayat, and Lisakovsk.
Finland has produced vanadium since 1953 and until the early 1980's was the third largest supplier in the western world. The sole operating company, Rautaruukki Oy, which is mostly state owned, had two mines-Ontanmaki and the Mustavaara. A low price for vanadium pentoxide is believed to be the main reason that the mines began phasing out production in about 1984 and finally closed in 1985.
The People's Republic of China assumed considerable importance as a vanadium producer and exporter in 1982 and 1983 after an extended absence from the market. However, vanadium pentoxide supplies from that country have since been irregular. The principal deposits being worked are those at Panzhihua in the southern part of Sichuan Province. Although the ore also contains cobalt, chromium, and nickel, which render metallurgical treatment difficult, the Chinese have developed an extensive iron- and steel-smelting complex that produces vanadium and titaniferous slag as byproducts. Available production and sales statistics are not exact, but estimates place annual output at about 5,000 metric tons of contained vanadium in vanadiferous slag.
Norway's sole producer, the Rodsand mine (owned by Elkem) ceased operations in 1982. Other former producers include those in Namibia, where operations ceased in 1978; Petrofina Canada, which recovered high-purity vanadium pentoxide from residual oils from Venezuela between 1965 and 1971; Mina Ragra in Peru, which was the world's principal vanadium producer from 1900 to 1955; the Coates mine in Western Australia, which was in production only from 1980 to 1981; Broken Hill in Zambia, which was in production from 1919 to 1952; and the Kusanskoe and Pervoural'sk deposits in the Soviet Union, which were exhausted during the 1960's.
Current production.- It is difficult to accurately deduce world primary production of vanadium due mainly to conflicting statistics from different published sources. Moreover, the Soviet Union and China, both major producers, do not disseminate statistical information on their vanadium production. Therefore, production figures quoted in this report for these countries are estimates based on scant reliable data.
The 54 vanadium deposits and districts in the International Strategic Minerals Inventory occur in 17 countries, of which South Africa, the United States, and the Soviet Union collectively accounted for more than 80 percent of the world's cumulative vanadium production. Figure 7 shows the production of vanadium from each of the producing countries included in the ISMI vanadium
16
inventory. Significant increases in production from South Africa and the Soviet Union for the periods shown cause the U.S. proportion of world vanadium production to be lower. This change was exacerbated further by a marked decline in U.S. production, particularly at uranium-vanadium mines.
Information on estimated cumulative production from 1950 through 1988 and world annual production for 1988 is shown in table 4. The country production data are grouped by World Bank economic class in table 5. Almost 38 percent of cumulative production since 1950 and more than 57 percent of 1988 production were from upper middle-income economic countries (almost totally from South Africa and lesser amounts from Argentina, Chile, and Mexico). The industrial market economy countries (predominantly the United States, Finland, and Norway and limited production reported by France and Australia) accounted for 30 percent of production since 1950 and an undisclosed portion (from the United States) of the 1988 production. Eastern European nonmarket economy countries (chiefly the Soviet Union) accounted for 22 percent of cumulative production and 29 percent of 1988 production. China, classified as a low-income economy country, contributed 7 percent to total production since 1950 and more than 13 percent to the world's
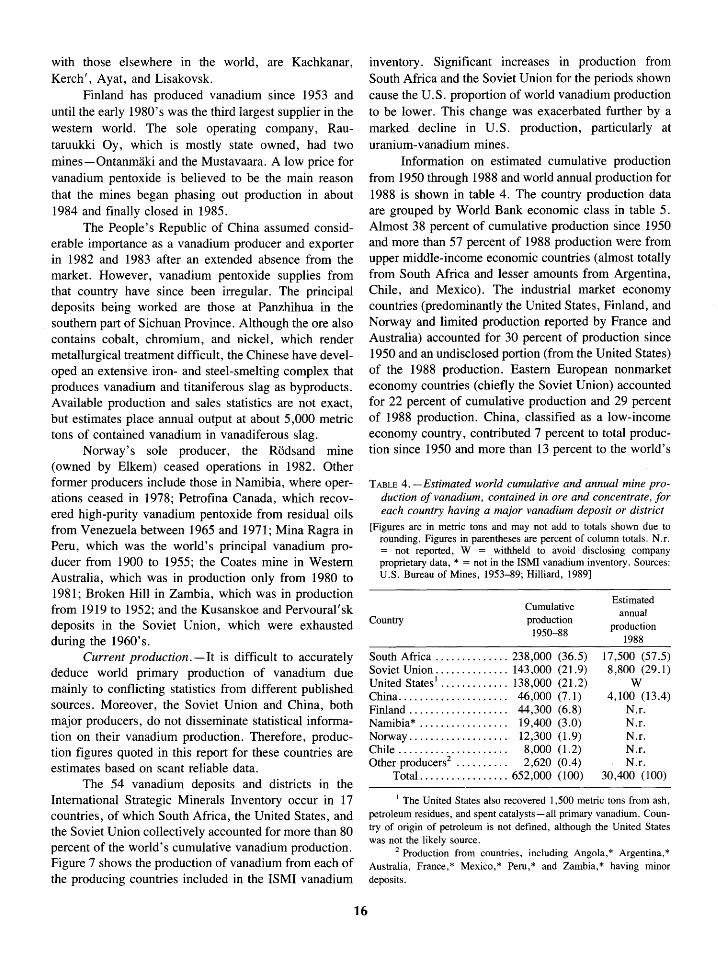
TABLE 4. -Estimated world cumulative and annual mine production of vanadium, contained in ore and concentrate, for each country having a major vanadium deposit or district
[Figures are in metric tons and may not add to totals shown due to rounding. Figures in parentheses are percent of column totals. N.r. = not reported, W = withheld to avoid disclosing company proprietary data, * = not in the ISMI vanadium inventory. Sources: U.S. Bureau of Mines, 1953-89; Hilliard, 1989]
Country Cumulative production 1950-88
South Africa .............. 238,000 (36.5) Soviet Union .............. 143,000 (21.9) United States1
.••••....•••• 138,000 (21.2) China ..................... 46,000 (7.1) Finland . . . . . . . . . . . . . . . . . . . 44,300 (6.8) Namibia* . . . . . . . . . . . . . . . . . 19,400 (3.0) Norway................... 12,300 (1.9) Chile . . . . . . . . . . . . . . . . . . . . . 8,000 (1.2) Other producers2
• • • • • • • • • • 2,620 (0.4) Total. ................ 652,000 (100)
Estimated annual
production 1988
17,500 (57 .5) 8,800 (29.1)
w 4,100 (13.4)
N.r. N.r. N.r. N.r. N.r.
30,400 (100)
1 The United States also recovered 1,500 metric tons from ash, petroleum residues, and spent catalysts-all primary vanadium. Country of origin of petroleum is not defined, although the United States was not the likely source.
2 Production from countries, including Angola,* Argentina,* Australia, France,* Mexico,* Peru,* and Zambia,* having minor deposits.
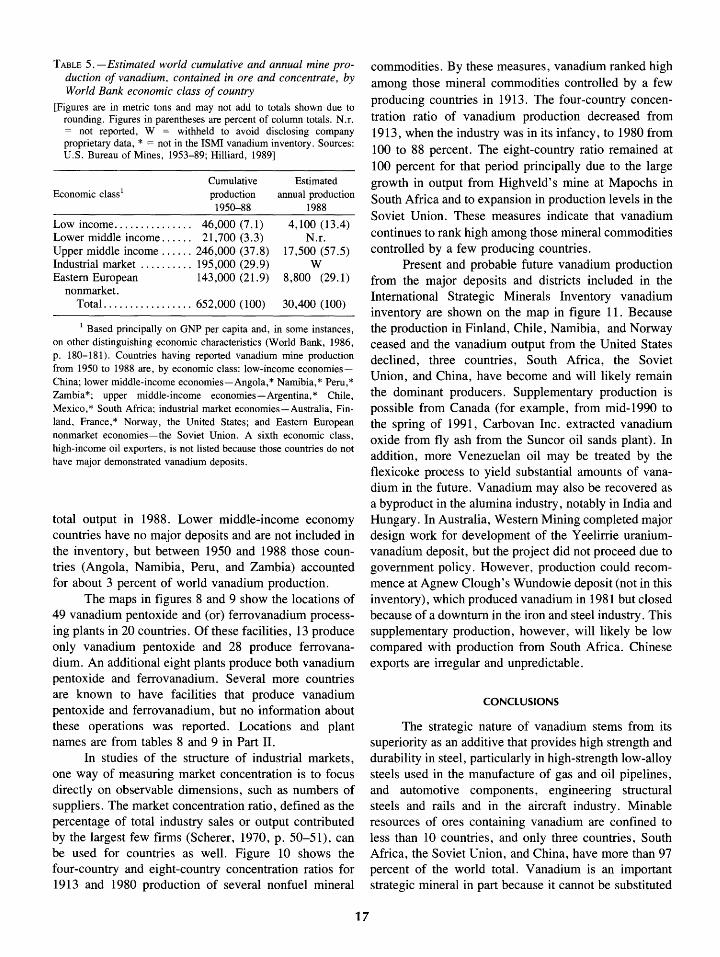
TABLE 5. -Estimated world cumulative and annual mine production of vanadium, contained in ore and concentrate, by World Bank economic class of country
[Figures are in metric tons and may not add to totals shown due to rounding. Figures in parentheses are percent of column totals. N.r. = not reported, W = withheld to avoid disclosing company proprietary data, * = not in the ISMI vanadium inventory. Sources: U.S. Bureau of Mines, 1953-89; Hilliard, 1989]
Cumulative Economic class 1 production
1950-88
Low income. . . . . . . . . . . . . . . 46,000 (7 .1) Lower middle income ...... 21,700 (3.3) Upper middle income ...... 246,000 (37 .8) Industrial market .......... 195,000 (29.9) Eastern European 143,000 (21.9)
nonmarket. Total. ................ 652,000 (100)
Estimated annual production
1988
4,100 (13.4) N.r.
17,500 (57 .5) w
8,800 (29.1)
30,400 (100)
1 Based principally on GNP per capita and, in some instances, on other distinguishing economic characteristics (World Bank, 1986, p. 180-181). Countries having reported vanadium mine production from 1950 to 1988 are, by economic class: low-income economiesChina; lower middle-income economies-Angola,* Namibia,* Peru,* Zambia*; upper middle-income economies-Argentina,* Chile, Mexico,* South Africa; industrial market economies-Australia, Finland, France,* Norway, the United States; and Eastern European nonmarket economies-the Soviet Union. A sixth economic class, high-income oil exporters, is not listed because those countries do not have major demonstrated vanadium deposits.
total output in 1988. Lower middle-income economy countries have no major deposits and are not included in the inventory, but between 1950 and 1988 those countries (Angola, Namibia, Peru, and Zambia) accounted for about 3 percent of world vanadium production.
The maps in figures 8 and 9 show the locations of 49 vanadium pentoxide and (or) ferrovanadium processing plants in 20 countries. Of these facilities, 13 produce only vanadium pentoxide and 28 produce ferrovanadium. An additional eight plants produce both vanadium pentoxide and ferrovanadium. Several more countries are known to have facilities that produce vanadium pentoxide and ferrovanadium, but no information about these operations was reported. Locations and plant names are from tables 8 and 9 in Part II.
In studies of the structure of industrial markets, one way of measuring market concentration is to focus directly on observable dimensions, such as numbers of suppliers. The market concentration ratio, defined as the percentage of total industry sales or output contributed by the largest few firms (Scherer, 1970, p. 50-51), can be used for countries as well. Figure 10 shows the four-country and eight-country concentration ratios for 1913 and 1980 production of several nonfuel mineral
17
commodities. By these measures, vanadium ranked high among those mineral commodities controlled by a few producing countries in 1913. The four -country concentration ratio of vanadium production decreased from 1913, when the industry was in its infancy, to 1980 from 100 to 88 percent. The eight-country ratio remained at 100 percent for that period principally due to the large growth in output from Highveld's mine at Mapochs in South Africa and to expansion in production levels in the Soviet Union. These measures indicate that vanadium continues to rank high among those mineral commodities controlled by a few producing countries.
Present and probable future vanadium production from the major deposits and districts included in the International Strategic Minerals Inventory vanadium inventory are shown on the map in figure 11. Because the production in Finland, Chile, Namibia, and Norway ceased and the vanadium output from the United States declined, three countries, South Africa, the Soviet Union, and China, have become and will likely remain the dominant producers. Supplementary production is possible from Canada (for example, from mid-1990 to the spring of 1991 , Carbo van Inc. extracted vanadium oxide from fly ash from the Suncor oil sands plant). In addition, more Venezuelan oil may be treated by the flexicoke process to yield substantial amounts of vanadium in the future. Vanadium may also be recovered as a byproduct in the alumina industry, notably in India and Hungary. In Australia, Western Mining completed major design work for development of the Y eelirrie uraniumvanadium deposit, but the project did not proceed due to government policy. However, production could recommence at Agnew Clough's Wundowie deposit (not in this inventory), which produced vanadium in 1981 but closed because of a downturn in the iron and steel industry. This supplementary production, however, will likely be low compared with production from South Africa. Chinese exports are irregular and unpredictable.
CONCLUSIONS
The strategic nature of vanadium stems from its superiority as an additive that provides high strength and durability in steel, particularly in high-strength low-alloy steels used in the manufacture of gas and oil pipelines, and automotive components, engineering structural steels and rails and in the aircraft industry. Minable resources of ores containing vanadium are confined to less than 10 countries, and only three countries, South Africa, the Soviet Union, and China, have more than 97 percent of the world total. Vanadium is an important strategic mineral in part because it cannot be substituted
THOUSAND METRIC TONS OF CONTAINED VANADIUM
ex: <( w >-
1950
88
0
Chile
China
Finland
Namibia
20
ex: <( w >-
0 20
1950 Norway
70
• 88
1950 South Africa
Soviet Union
United States
88 w e Reported mine production less than 1,000 metric tons of contained vanadium
W Withheld to avoid disclosing company proprietary data
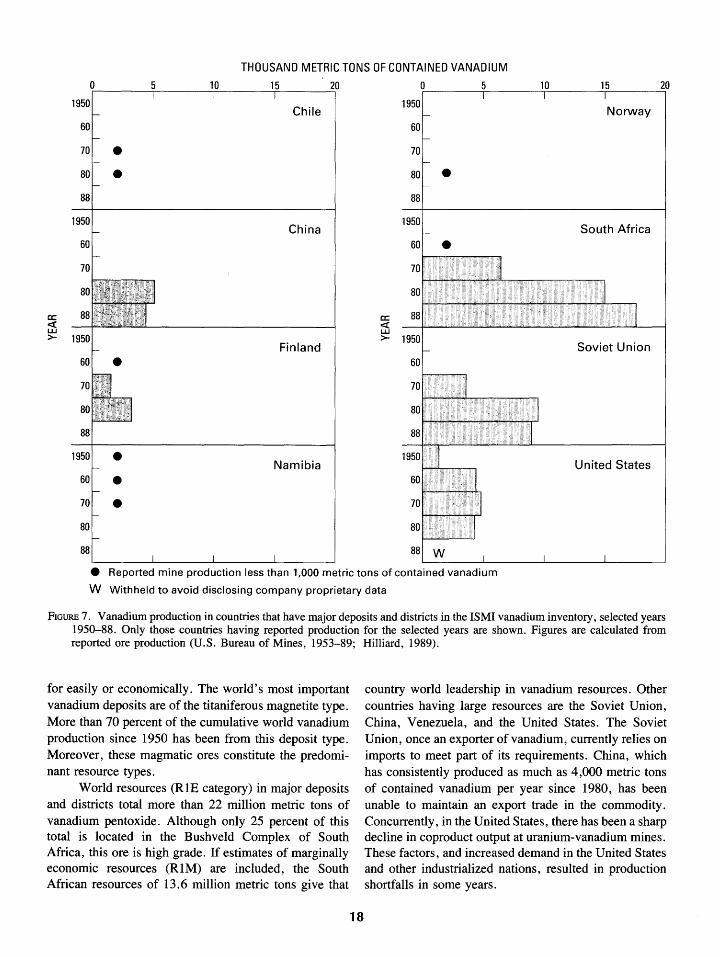
FIGURE 7. Vanadium production in countries that have major deposits and districts in the ISMI vanadium inventory, selected years 1950-88. Only those countries having reported production for the selected years are shown. Figures are calculated from reported ore production (U.S. Bureau of Mines, 1953-89; Hilliard, 1989).
for easily or economically. The world's most important vanadium deposits are of the titaniferous magnetite type. More than 70 percent of the cumulative world vanadium production since 1950 has been from this deposit type. Moreover, these magmatic ores constitute the predominant resource types.
World resources (RlE category) in major deposits and districts total more than 22 million metric tons of vanadium pentoxide. Although only 25 percent of this total is located in the Bushveld Complex of South Africa, this ore is high grade. If estimates of marginally economic resources (RIM) are included, the South African resources of 13.6 million metric tons give that
18
country world leadership in vanadium resources. Other countries having large resources are the Soviet Union, China, Venezuela, and the United States. The Soviet Union, once an exporter of vanadium, currently relies on imports to meet part of its requirements. China, which has consistently produced as much as 4,000 metric tons of contained vanadium per year since 1980, has been unable to maintain an export trade in the commodity. Concurrently, in the United States, there has been a sharp decline in coproduct output at uranium-vanadium mines. These factors, and increased demand in the United States and other industrialized nations, resulted in production shortfalls in some years.
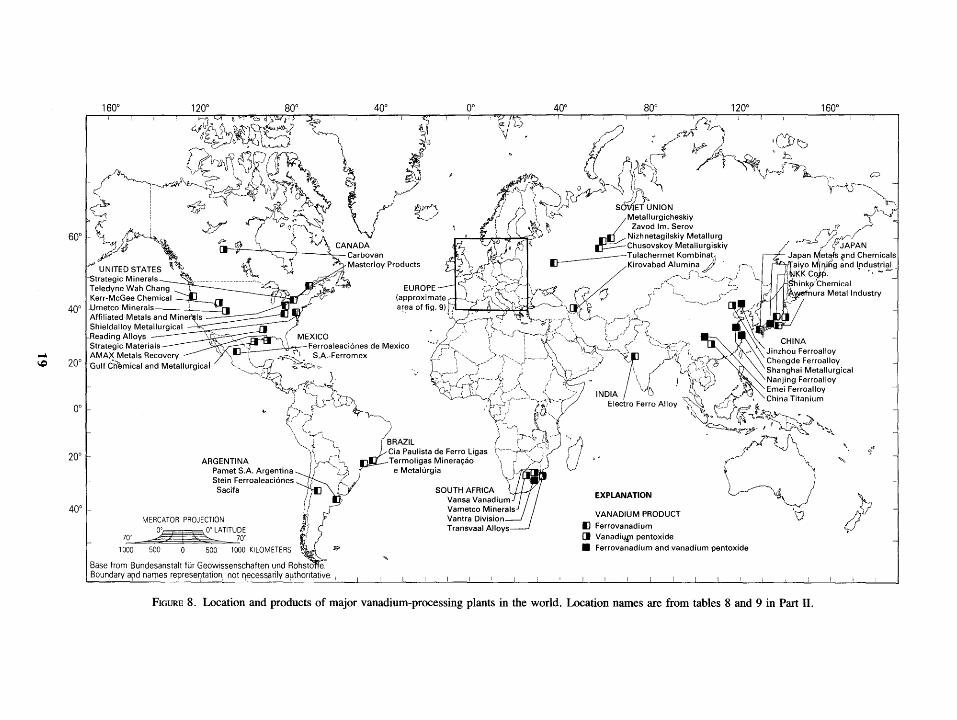
-I..C
160c 120c soc 40c oc 40c soc 120° 160c
' ' ' '~~?ifJ~ =t: n ~~ ~~-~ 0 ':~~ -, ' -~"~~~\~~·· ·."~\~-~ ~_}L"''. ~~
i ~ ~ u~ · / 1 ~ - ~ S~NION ,.; ~ i .':/jJ ~ ~"' ~=) r'' f '1,'\s~, Metallurgicheskiy ~'
~~RG~~ , f n~ ~~~ft._~ co
(
1 \...A'"' 7 W'o t (( ,~.z ~ / Zavodlm.Serov ~)( ~ 60c 1- l't~..,_ !. -..£?' ~ < ' ,\,J ~Nizhnetagilskiy Metall~rg_ ...,....r.J 1/"'~,_...--, -
ly =:\' , ifJ [J=---Chusovskoy Metallurgtskty ~ • [';.].JAPAN """'!J/117 ·, _ ---Tulachermet Kombina~J Ja~an 1\fe~ ~nd Chemi~als r - ~ .Kirovabad Alumina..}/ c--., atyo Mp} g and l:Jdustnal .
?" UNITED STATES ~.' ' /-._I-'---.. /'~/ \. KK C~JP- . '' - ..... _
Teledyne Wah Chang EUROPE ~..r':l 0 ,I .. , /- ro f,....,,, Metollnd"""' !-strategic Minerals r''< -- .:., •J inkp'Chemtcal
oc
Kerr-McGee Chemical ":2. ) \ ______ .--"' ' 40c JJJmetco Minerals I (J . ·~--' ~- I c·
Affiliated Metals and Mine~ I '=" "-"'<f1' .TJ.,, --~-_r--' r~:.J-) Shiel?alloy Metallu~gical ~ • , f~ \~~['(--~\i,, · \ j ;, ~~~ Readtng Alloys '··- MEXICO . . ./ i 1 '-<x-:\\ \--.J ,' '· ••• "y
Strategic Materials ~-- 1 Ferroaleaci6nes de Mexico '(!' ;:L ', i \'--...~ ( ·-<:.:r~:. /) -~-·~'Jinzhou Ferroalloy
~ ,., ?-. , I ~ 'f"o < .r• '• ' \\ AMAX Metals Recovery " ~· S.A.-Ferromex .l l, ', /r-..)· •. _ ~-----~ ' 11, i.>f\-;· ' Chengde Ferroalloy
20c I"Gulf diemical and Metallurgical \..._·~-~fl "'" ~ = ··,,. ~-r-J _)·' j J .1
' \ ( 'v,('c--{}! Sha~_ghai Metallurgical
~~~- ). ~ / \ ·-·.--J'? ' ,.. • \ 1 ~~ -\.. __ )) , NanJtng Ferroalloy • 11 ' ' -,-~)-.{-f\\ ( f~_.J\ / \ ., \ () · V / ~ Emei Ferroalloy ' --, 1 ~ .:v--i- ' rJ ', ..... c._ ' • _ / INDIA , · ,. • , China Titanium
¢ ! 7.--t\JA ~-.,--:;-4.. f"+:" -r ElectroFerroAIIoy ~- ~~ ~
>,}"-- .- h~ ·1-!/ VO', •. l ·~,\:}~"\:,;.~~-.:)-~ \ / ~ ··-,,_,.,, \.._ • ~--_p;;>· I f ~ '.-.\
\ '--·~--' 17·-~. Jt--· •., . ~"' - ~, I '·--, BRAZIL I .c·'-,, ' . •, ~'~~ '-_) ;:-Cia Paulista de Ferro Ligas • -----;~"</ '\ '' (If
1 \r~·C:L-. Termoligas Mineracao \\ ~ >-<' U ' ' ' Stem Ferroaleactones l /......
20c •. ARGENTINA
.. c
40c ·-
Pa~et S.A. Arge_~tina ~( L;~ e Metalurgia _jv ~ J Sacifa I 1 SOUTH AFRICA. EXPLANATION ~
Vansa Vanadtum
MERCATOR PROJECTION 0'~~-~ 0' LATITUDE
70'..:., ,__20°
Vantra Division Transvaal Alloys
VANADIUM PRODUCT
1J Ferrovanadium [) VanadifW1 pentoxide
·v J"v 1000 500 0 500 1000 KILOMETERS l1P • Ferrovanadium and vanadium pentoxide
Base from Bundesanstalt fUr Geow1ssenschaften und Rohsto'ffe~ Bounpary ard nafTieS representation, not l")ecessprily a~thontptive I
FIGURE 8. Location and products of major vanadium-processing plants in the world. Location names are from tables 8 and 9 in Part II.
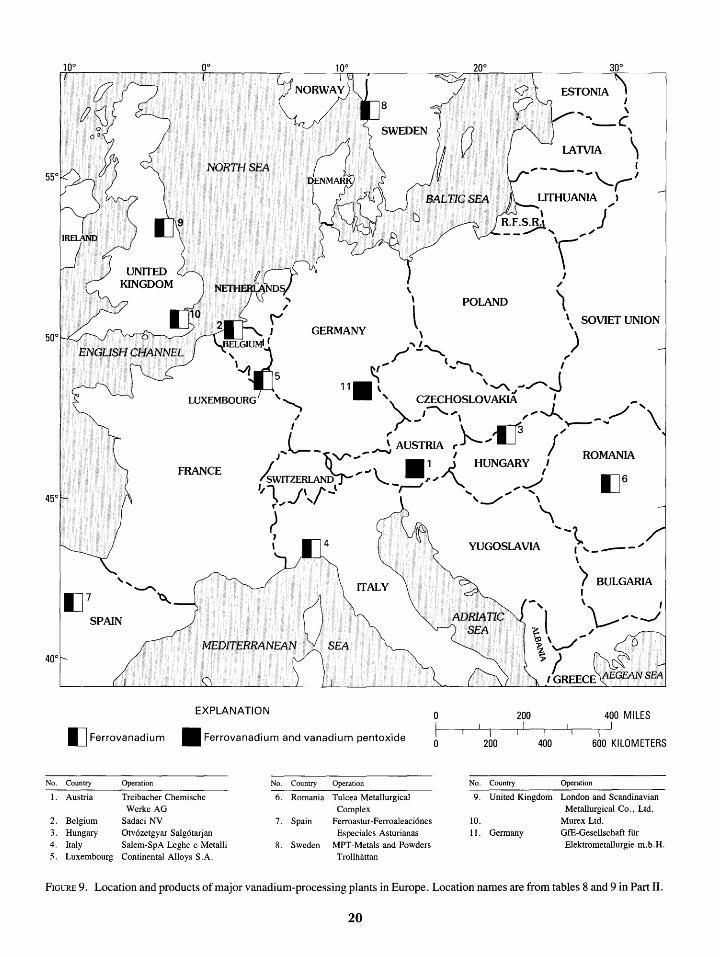
No.
I.
2. 3. 4. 5.
ESTONIA I
.... \
"'-C ' \
NORTH SEA ,___ I
.... _'-r-' LITHUANIA l ,
R.F.S.RJ ) __ _........,\,..-I
\ /
\ POLAND l t \ SOVIET UNION
/'--1, ) I GERMANY
~, (-'\ I
1111 \ .... ,""""J.,#~J '~ CZECHOSLOVAKIA I -
_,~ .... , ,'~....,.___- ... / '\
~Q:J ')J
WXEMBOURG :.......,
FRANCE
I I \ .-rJ ; L r AUSTRIA c-.1'-,~- 1
/.... -~--~ I ROMANIA / 111 ~ HUNGARY I
/swiTZERLAND "J \.. I''" " ._/I IJ 6 ,,, J' r-t -,.-J , ,, .... \, ' '-./ \ r '\
~ ,,~ l YUGOSLAVIA 1 , ____ ,
\
) BULGARIA I
' \ I
SPAIN
MEDITERRANEAN v SEA
l ~,,_J
EXPLANATION 0
I IJ Ferrovanadium II Ferrovanadium and vanadium pentoxide 0
Country Operation No. Country Operation
Austria Treibacher Chemische 6. Romania Tulcea Metallurgical Werke AG Complex
Belgium Sadaci NV 7. Spain Ferroastur-Ferroaleaci6nes Hungary Otv6zetgyar Salg6tarjan Especiales Asturianas Italy Salem-SpA Leghe e Metalli 8. Sweden MPT-Metals and Powders Luxembourg Continental Alloys S.A. Trollhiittan
No.
9.
10. 11.
200
I I I
200
Country
t \ -/ ~~ ~;
I GREECE AEGEAN SEA
400 MILES
I I I I
I
400 600 KILOMETERS
Operation
United Kingdom London and Scandinavian Metallurgical Co., Ltd.
Murex Ltd. Germany Gffi-Gesellschaft ftir
Elektrometallurgie m.b.H.
FIGURE 9. Location and products of major vanadium-processing plants in Europe. Location names are from tables 8 and 9 in Part II.
20
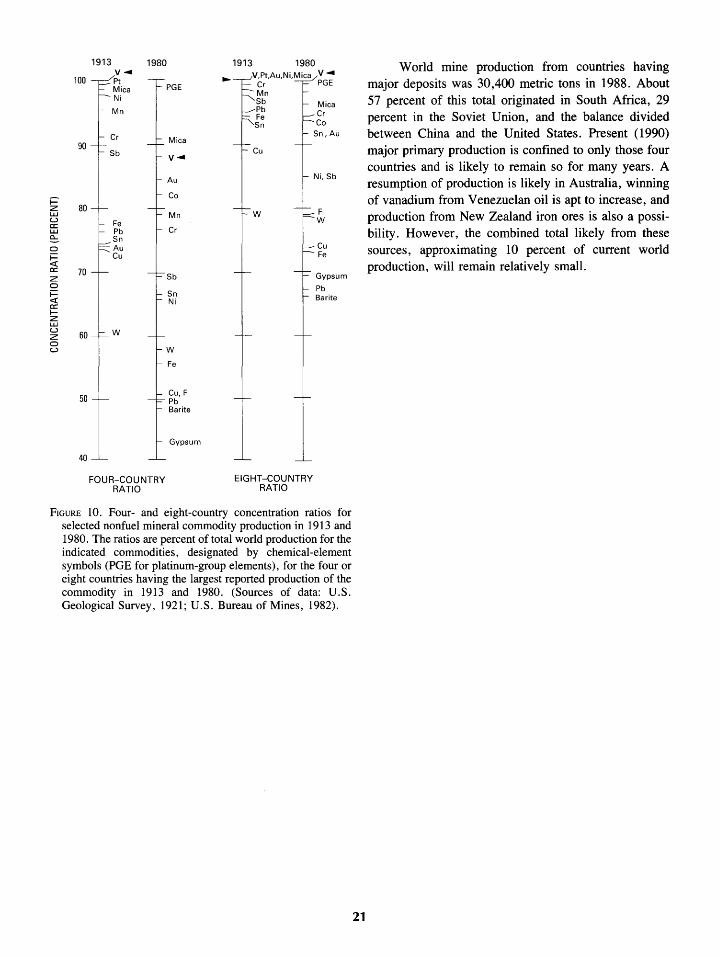
100
90
;=:-z 80 UJ u a: UJ
!?=. Cl i= <( 0::: 70 z Cl i= <( 0::: I-z UJ u
60 z Cl u
50
40
1913 1980 v ....
/pt Mica PGE Ni
Mn
Mica
v ....
Au
Co
Mn Fe Pb Cr Sn Au Cu
Sb
Sn Ni
w
w
FOUR-COUNTRY RATIO
Fe
Cu, F Pb Barite
Gypsum
• 1913 1980
V,Pt,Au,Ni,Mica Cr Mn Sb Pb Fe Sn
EIGHT -COUNTRY RATIO
v .... PGE
Mica Cr Co
F w
Cu Fe
Gypsum
Pb Barite
FrGURE 10. Four- and eight-country concentration ratios for selected nonfuel mineral commodity production in 1913 and 1980. The ratios are percent of total world production for the indicated commodities, designated by chemical-element symbols (PGE for platinum-group elements), for the four or eight countries having the largest reported production of the commodity in 1913 and 1980. (Sources of data: U.S. Geological Survey, 1921; U.S. Bureau of Mines, 1982).
World mine production from countries having major deposits was 30,400 metric tons in 1988. About 57 percent of this total originated in South Africa, 29 percent in the Soviet Union, and the balance divided between China and the United States. Present (1990) major primary production is confined to only those four countries and is likely to remain so for many years. A resumption of production is likely in Australia, winning of vanadium from Venezuelan oil is apt to increase, and production from New Zealand iron ores is also a possi-bility. However, the combined total likely from these sources, approximating 10 percent of current world production, will remain relatively small.
21
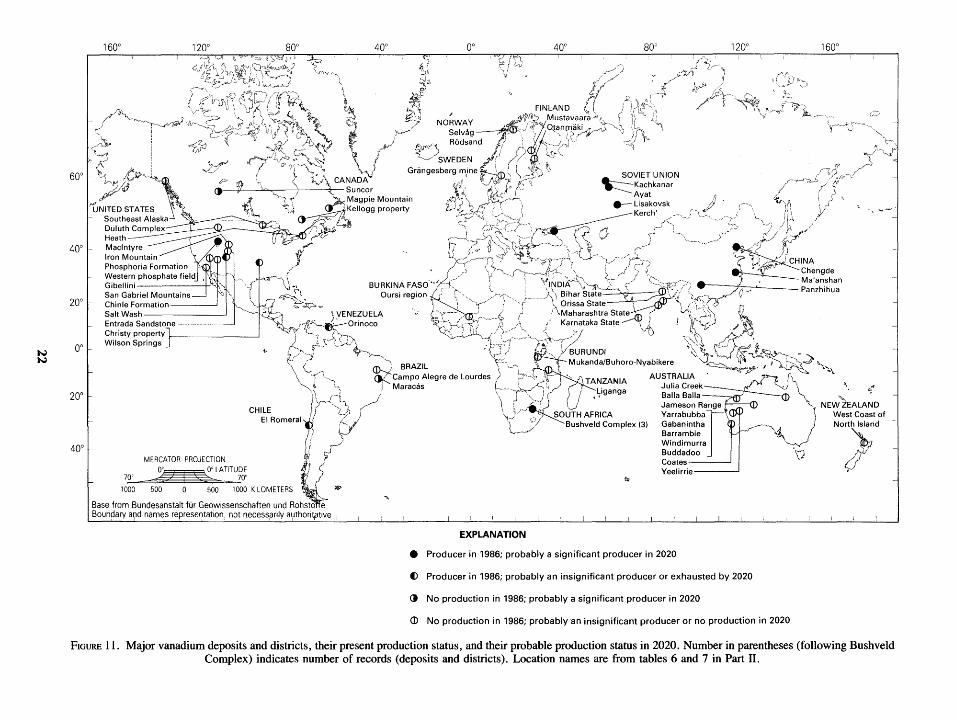
~ ~
40° ·-
20° ·-
oo
20°
40°
160° 120° 80° 40° oo 40° goo 120° 160° J ' '?_,
"" r (L-~ ~j ~/) .~-~ "
\ ~- 'i ~~ ,..// />- ") ~I
'~ ~c, (,/ ( /? /,~· ) ,;;, - r---,, · 1•''-}--- r· ,.~!::....._ 'l, 4 I~ l_ - 'o,....il:.~ ~ FINLAND l( ) ); 1(r'S'-~, / '1 "\~";1 , (';Jr~
~ !?-"#] NO~WAY . £!~!:.~ Mustavaar~"'r ] ), """'- J. \)·r-..J' f!J..oc.~-·· _
t ~/ s 1
, ·,J$,-Otanmaki.<r~__,)."'-~ tl(_ '\ 'r-y\j~----. ~vag , f! , I,~(Y J j ,~ '-.,
l'r'J f'>r <"'\ Rodsand , , _ __;d ~ -:::,~ . \;"·, ' {" :?,v"' / 0 ' I;:.._'~ ' /'l' I ~ I ~/ SWEDEN • I ' l._\, ""f "-r.
\ } .. . f\ ' fl r? /
:.J Grangesberg mme ( \ ::?!:'"j 0 SOVIET UNION ,~1/ r CANADA , ' if J~t; i y;:""(' ~ F..,_;~ ( . · ;j"-v
~ p _, l 4: Suncor '{;."-, "~ \ )' (~ ------- Kachkanar / · -- ./ 1' ;t:~~ \ ·~$k .J-<. Ayat ,1 ~ I f , V J ;y:{l , · Y'( > e-- Lisakovsk jj · ,--- -0)(1\ , J
•y <: .,- r ·. r , .-. e , , 1 v ••. .------.,,4 ·-~---..., _. ~Kerch .--., "'--•. -. ,· , ,,, ;I'
"~t t;'~~~:~~-:~:v ~ ~ ~rf\ __ .-- -~~~!?;. ·--.? ) ~~ t' · ..
r --;:J ~:\,\-, -~ ~. \ {- v I '---,,f-' ,+·/ ~ ' ,J ( o• ."'\')' ~ 1.\ ' rrv- "'" ( ) \l I'' • \ _ _.....-, .......... , ./", ll \ v----:~-n "'f ~ ,-.r-J~,---7-, .... J ., ,----' ,~ ..... ,_. ? I I ' CHINA
! ----( / ( = "'} . .I 7 t•' ) ,--' ) r, w. ,c0 \/ -..,~_)(·------1t~i, '-. S ,f > ~- ' ' Chengde
\b
• ~ ~ ..o...•
, - , ,.~ h- {\-, .~ ~-ss ),;1"
BURKINA FAso·~,,---(.- ; . 1 'V'fNDI~"'~·-_, '~-__r ,/ ~~:::::"r/( ... 7. ·-_>· . ." Ma'anshan ,-' i'- \ I \\ ,, /!\.~,-.,_ ' / ' P h'h
,..... ~ '. Oursi region ,, l · -.. >·-]'-.. L_--__ _}, \ Bihar State ~ ', ":( 'I ,---- (j ·' anz 1
ua Chinle Formation 1 "- q./ ~~ Q •• \
1
: ''f/ / ',f l Orissa State ~ ~'\ ('\:~,\c5 Salt Wash -· _ 1 VENEZUELA ,.- ~.r- , -' · ~ J\Maharashtra State~ 1--"'1; ·,·. Eotmd• Sood"""' tj~ ~O,Ioooo '·~·;-{q)'~··~ )\ . ( · Karnataka State~}. ! '§t¥) / ~ San Gabriel Mountains
Chnsty property J ~fV '--,_, ,' ~ ""'· ,' I, • J )·-· -., \ ;, .r{) *'- f\i Wilson Springs f: ,J,_::-t~~~l\ :~"\--r----'-,.{.~;\--y-- C:::::<.~ A· '
~· ').,_,) ~~ 'CJ) /_. l BURUNDI '~' ~'C:J( .J.~ /- (' ---~ BRAZIL ~~-::'-·-"' '• . Mukanda/Buhoro-Nyabikere '~~~:~~=:; ~ "''., \
"'" ~ \If'. '>27//~ ~\ '!' \..,_, ctt(_ Campo Alegre de Lourdes I ::-r-o~, }\\___ ·.. TANZANIA AUSTRALIA ~-• , ' "'--,~ '•) I Maracas ~~----r~""_...-..c,\ '·I r Li an a Julia Creek . '·
\ ~--!--L ' j ··,,j , • g g Balla Balla ""' CHILE / ''., } ~ ~ ,-~ ,- l J Jameson Range \ NEW ZEALAND
El Romeral ~~v ';·' \_j' ~UTH AFRICA Y"mbobb•r \ J West Coast of
.. "
,'"'-, L .... _ . ./ Bushveld Complex (3) Gabanintha North Island 1 Barrambie '\...,
; ,--/ Windimurra b:;1 (> ..J ' •. "
MERCATOR PROJECTION ~~ ( Buddadoo V /li./ _ 0 0 LATITUDE , Yeelirrie •
70 70' i "' 1000 500 0 500 1000 KILOMETERS ,' · liP
, , ~~ Coates {__)
Base from Bundesanstalt fur Geowtssenschaften und Rohsto e Bounpary ard names representation, n8t necessprily a~thorttpttve I
EXPLANATION
e Producer in 1986; probably a significant producer in 2020
(> Producer in 1986; probably an insignificant producer or exhausted by 2020
() No production in 1986; probably a significant producer in 2020
()) No production in 1986; probably an insignificant producer or no production in 2020
FIGURE 11. Major vanadium deposits and districts, their present production status, and their probable production status in 2020. Number in parentheses (following Bushveld Complex) indicates number of records (deposits and districts). Location names are from tables 6 and 7 in Part II.
PART II-SELECTED INVENTORY INFORMATION FOR VANADIUM DEPOSITS AND DISTRICTS
Tables 6 and 7 contain information from the International Strategic Minerals Inventory records forms for vanadium deposits and districts. Only selected items of information about the location and geology (table 6) and mineral production and resources (table 7) of the deposits are listed here; some of this information has been abbreviated. However, only vanadium deposits that have resources in excess of 10,000 metric tons of contained vanadium metal are included in the inventory. Past producers and selected small deposits are listed separately in table 1 of Part I.
Summary descriptions and data are presented in the tables essentially as they were reported in the inventory
23
records. For instance, significant digits for amounts of production or resources have been maintained as reported. Data that were reported in units other than metric tons have been converted to metric tons for comparability. Some of the data ill the tables are more aggregated than i:R the htvefttory records, such as cumulative production totals that for some mines have been reported by year or by groups of years. Some of the abbreviations used in the inventory records forms have been used in these tables; they are explained in the headnotes.
Tables 8 and 9 contain information on the world's vanadium-producing facilities (Hilliard, 1989). Selected information on plants that produce vanadium pentoxide (table 8) and ferrovanadium (table 9) was made available by the participating agencies.
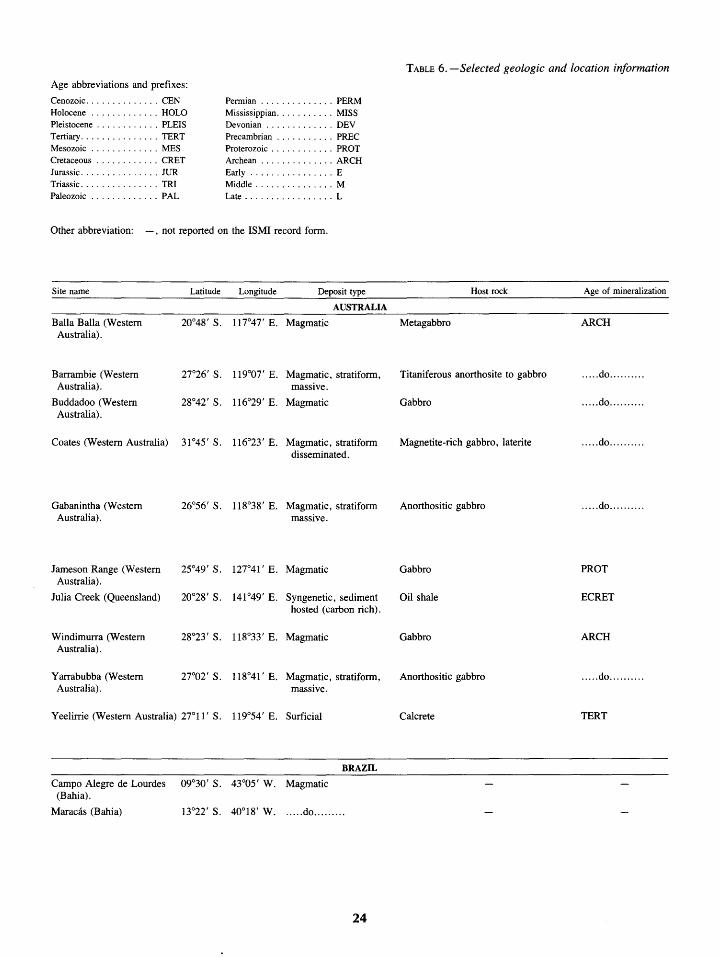
Age abbreviations and prefixes:
Cenozoic .............. CEN Holocene . . . . . . . . . . . . . HOLO Pleistocene . . . . . . . . . . . . PLEIS Tertiary ............... TERT Mesozoic . . . . . . . . . . . . . MES Cretaceous . . . . . . . . . . . . CRET Jurassic. . . . . . . . . . . . . . . JUR Triassic. . . . . . . . . . . . . . . TRI Paleozoic . . . . . . . . . . . . . PAL
Permian .............. PERM Mississippian ........... MISS Devonian . . . . . . . . . . . . . DEV Precambrian . . . . . . . . . . . PREC Proterozoic . . . . . . . . . . . . PROT Archean . . . . . . . . . . . . . . ARCH Early ................ E Middle ............... M Late ................. L
Other abbreviation: -, not reported on the ISMI record form.
Site name
Balla Balla (Western Australia).
Barrambie (Western Australia).
Buddadoo (Western Australia).
Coates (Western Australia)
Gabanintha (Western Australia).
Jameson Range (Western Australia).
Julia Creek (Queensland)
Windimurra (Western Australia).
Yarrabubba (Western Australia).
Latitude Longitude Deposit type
AUSTRALIA
20°48' s. 117°47' E. Magmatic
27°26' S. 119°07' E. Magmatic, stratiform, massive.
28°42' s. 116°29' E. Magmatic
31°45' s. 116°23' E. Magmatic, stratiform disseminated.
26°56' S. 118°38' E. Magmatic, stratiform massive.
25°49' s. 127°41' E. Magmatic
20°28' s. 141°49' E. Syngenetic, sediment hosted (carbon rich).
28°23' s. 118°33' E. Magmatic
2ro2' s. 118°41' E. Magmatic, stratiform, massive.
Yeelirrie (Western Australia) 27°11' S. 119°54' E. Surficial
BRAZIL
Campo Alegre de Lourdes 09°30' S. 43°05' W. Magmatic (Bahia).
Maracas (Bahia) 13°22' S. 40°18' W. .. ... do ........ .
24
TABLE 6. -Selected geologic and location information
Host rock Age of mineralization
Metagabbro ARCH
Titaniferous anorthosite to gabbro ..... do ..........
Gabbro ..... do ..........
Magnetite-rich gabbro, laterite ..... do ..........
Anorthositic gabbro ..... do ......... .
Gabbro PROT
Oil shale ECRET
Gabbro ARCH
Anorthositic gabbro ..... do ..........
Calcrete TERT
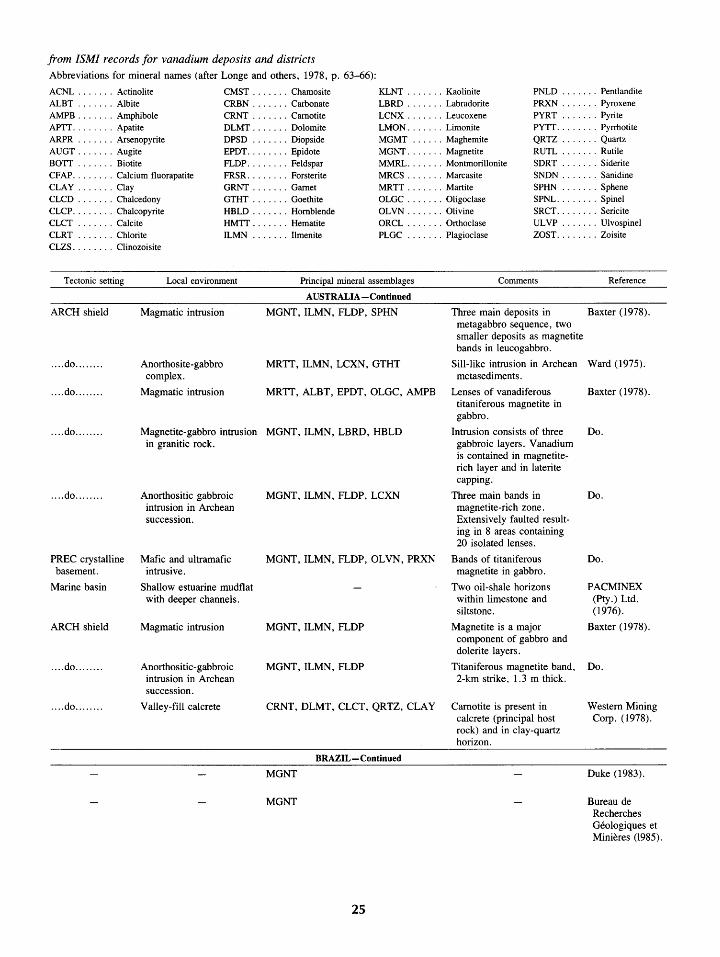
from ISM/ records for vanadium deposits and districts Abbreviations for mineral names (after Longe and others, 1978, p. 63-66):
ACNL . . . . . . . Actinolite ALBT ....... Albite AMPB ....... Amphibole APTT. . . . . . . . Apatite ARPR . . . . . . . Arsenopyrite AUGT ....... Augite BOTT . . . . . . . Biotite CF AP. . . . . . . . Calcium fluorapatite CLAY ....... Clay CLCD . . . . . . . Chalcedony CLCP. . . . . . . . Chalcopyrite CLCT . . . . . . . Calcite CLRT . . . . . . . Chlorite CLZS. . . . . . . . Clinozoisite
CMST . . . . . . . Chamosite CRBN . . . . . . . Carbonate CRNT . . . . . . . Carnotite DLMT ....... Dolomite DPSD . . . . . . . Diopside EPDT. . . . . . . . Epidote FLDP. . . . . . . . Feldspar FRSR. . . . . . . . Forsterite GRNT . . . . . . . Garnet GTHT . . . . . . . Goethite HBLD . . . . . . . Hornblende HMTT ....... Hematite ILMN ....... Ilmenite
KLNT . . . . . . . Kaolinite LBRD . . . . . . . Labradorite LCNX . . . . . . . Leucoxene LMON ....... Limonite MGMT ...... Maghemite MGNT ....... Magnetite MMRL. . . . . . . Montmorillonite MRCS . . . . . . . Marcasite MRTT ....... Martite OLGC . . . . . . . Oligoclase OL VN ....... Olivine ORCL ....... Orthoclase PLGC . . . . . . . Plagioclase
PNLD . . . . . . . Pentlandite PRXN . . . . . . . Pyroxene PYRT ....... Pyrite PYTT. . . . . . . . Pyrrhotite QRTZ ....... Quartz RUTL ....... Rutile SDRT ....... Siderite SNDN . . . . . . . Sanidine SPHN . . . . . . . Sphene SPNL. . . . . . . . Spinel SRCT. . . . . . . . Sericite UL VP . . . . . . . Ulvospinel ZOST. . . . . . . . Zoisite
Tectonic setting Local environment Principal mineral assemblages Comments Reference
ARCH shield
.... do ........
.... do ....... .
Magmatic intrusion
Anorthosite-gabbro complex.
Magmatic intrusion
AUSTRALIA-Continued
MGNT, ILMN, FLOP, SPHN
MRTT, ILMN, LCXN, GTHT
Three main deposits in Baxter (1978). metagabbro sequence, two smaller deposits as magnetite bands in leucogabbro.
Sill-like intrusion in Archean Ward (1975). metasediments.
MRTT, ALBT, EPDT, OLGC, AMPB Lenses of vanadiferous Baxter (1978) . titaniferous magnetite in gabbro .
.... do ....... . Magnetite-gabbro intrusion MGNT, ILMN, LBRD, HBLD in granitic rock.
Intrusion consists of three Do. gabbroic layers. Vanadium is contained in magnetiterich layer and in laterite capping.
.... do........ Anorthositic gabbroic intrusion in Archean succession.
PREC crystalline Mafic and ultramafic basement. intrusive.
Marine basin
ARCH shield
.... do ....... .
.... do ....... .
Shallow estuarine mudflat with deeper channels.
Magmatic intrusion
Anorthositic-gabbroic intrusion in Archean succession.
Valley-fill calcrete
MGNT, ILMN, FLOP, LCXN Three main bands in Do. magnetite-rich zone. Extensively faulted resulting in 8 areas containing 20 isolated lenses.
MGNT, ILMN, FLOP, OLVN, PRXN Bands of titaniferous Do.
MGNT, ILMN, FLOP
MGNT, ILMN, FLOP
magnetite in gabbro.
Two oil-shale horizons within limestone and siltstone.
PACMINEX (Pty.) Ltd. (1976).
Magnetite is a major Baxter (1978). component of gabbro and dolerite layers.
Titaniferous magnetite band, Do. 2-km strike, 1.3 m thick.
CRNT, DLMT, CLCT, QRTZ, CLAY Carnotite is present in Western Mining Corp. (1978).
BRAZIL-Continued
MGNT
MGNT
25
calcrete (principal host rock) and in clay-quartz horizon.
Duke (1983).
Bureau de Recherches Geologiques et Minieres (1985).

Site name Latitude Longitude Deposit type
BURKINA FASO
Oursi region 14°35 1 N. 00°301 W. Magmatic
BURUNDI
Mukanda/Buhoro-Nyabikere 03°24 1 S. 30°00 1 E. Magmatic (Kibara-Burundi-Kacagwe-Ankole metallogenic zooe).
CANADA
Kellogg property (Quebec) 49°49 1 N. 740001 W. Magmatic, stratiform
TABLE 6. -Selected geologic and location information
Host rock
Gabbro, ophiolitic series, volcanosediments, granite.
Titanomagnetite in gabbroic massif
Metaferro-pyroxenite; gabbro
Age of mineralization
PREC
ARCH
Magpie Mountain (Quebec) 51°23 1 N. 64°04 1 W. Magmatic, nonstratiform Gabbroic anorthosite PROT
Suncor (Alberta)
El Romeral (Coquimbo)
57°00 1 N. 111°291 W. Syngenetic sediment hosted (carbon rich).
CIDLE
29°42 1 S. 71°15 1 W. Magmatic
CHINA
Chengde (Hebei) 40°46 1 N. 118°11 1 E. Magmatic
Ma1anshan (Washan) (Anhui 31°47' N. ll8°35 1 E. Epigenetic Province).
Panzhihua (Sichuan Province).
FINLAND
Mustavaara (Northern 65°47 1 N. 27°59 1 E. Magmatic Finland).
Otanmaki (Middle Finland) 64°15 1 N. 28°101 E. .. ... do ..........
INDIA
Bihar State 25°13 1 N. 85°31 1 E. Magmatic
Kamataka State 13°18 1 N. 75°18 1 E. .. ... do ..........
Maharashtra State 21°08 1 N. 79°41 1 E. .. ... do ..........
Orissa State 21°49 1 N. 86°23 1 E. ..... do ..........
NEW ZEALAND
West Coast of North Island 36°391 s. 174°201 E. Syngenetic, sediment to to hosted (noncarbon-
39°48 1 s. 174°35 1 E. aceous).
NORWAY
Rodsand (More og Romsdal) 62°48 1 N. 08°10 1 E. Magmatic
Selvag (Lofoten Islands, Nordland).
68°46 1 N. 14°35 1 E. .. ... do ..........
26
Sandstone with shale layers and clay lenses.
Andesite porphyry
Anorthosite
Amphibolite, anorthosite, and gabbro
Gabbro to anorthosite
LCRET
LCRET
PREC
MPREC
PREC
Titaniferous magnetite in beach sands. PLEIS-HOLO
Metabasite PREC
Gneiss, syenite, gabbro, anorthosite

from ISM/ records for vanadium deposits and districts-Continued
Tectonic setting Local environment Principal mineral assemblages Comments Reference
BURKINA FASO-Continued
PREC shield MGNT, ILMN, PYTI, PNLD, ARPR Ten significant magnetite Neybergh and deposits. Magnetite others (1980). concentration is in gabbros.
BURUNDI-Continued
MGNT Mining Annual Review (1983).
CANADA-Continued
ARCH volcanic Subvolcanic layered V- and Ti-rich MGNT; ILMN, PRXN Three magnetite-rich zones Rose (1969). greenstone belt. anorthosite-gabbro sill. AMPB, PLGC, OLVN, PYRT, CLRT, as discontinuous layered
CRBN, LMON, GTHT, ZOST, EPDT, magmatic segregations. SPHN.
PROT orogenic Oxide-rich gabbroic Ti- and V-rich MGNT, ILMN, SPNL, Massive or interbanded Vallee and Raby belt. anorthosite. PLGC, PRXN, BOTI. titaniferous magnetite. (1971), Rose
(1969).
Rose (1973).
CHILE-Continued
MES-CEN mobile Romeral fault MGNT, HMTI, ACNL, PLGC, DPSD, Schmidt and belt; Atacama CLZS, SPHN, Cl-APTI. others (1981). fault system.
CIDNA-Continued
MGNT Chin (1982).
MGNT, HMTI Do.
V-bearing MGNT, ILMN; sulphates and World Mining silicates. (1980).
FINLAND-Continued
MGNT,PLGC,AUGT,HBLD Disseminated and tabular Busch (1977). deposit.
PREC shield MGNT, ILMN, PYRT, AMPB, PLGC The deposit is compound of Do. a large number of small lenticular ore lenses.
INDIA- Continued
MGNT Fortnightly Journal of Industry and Commerce Review (1979).
Platform, Dharwar greenstone belts MGNT; ILMN, ULVP, MGMT, MRTT, Vasudev and miogeosynclinal. CLCP, PYTI. Srinivasan
(1979).
MGNT Fortnightly Journal of Industry and Commerce Review (1979).
MGNT Do.
NEW ZEALAND-Continued
Platform MGNT New Zealand Geological Survey (1981).
NORWAY -Continued
PAL mobile belt MGNT, ILMN, HMTI, PYRT, PYTT, Horizontal ore section of Svinndal (1976). CLCP. 20,000 m2
.
MGNT, ILMN, SPNL, PYTT, MRCS, Geis (1971 ). PYRT.
27
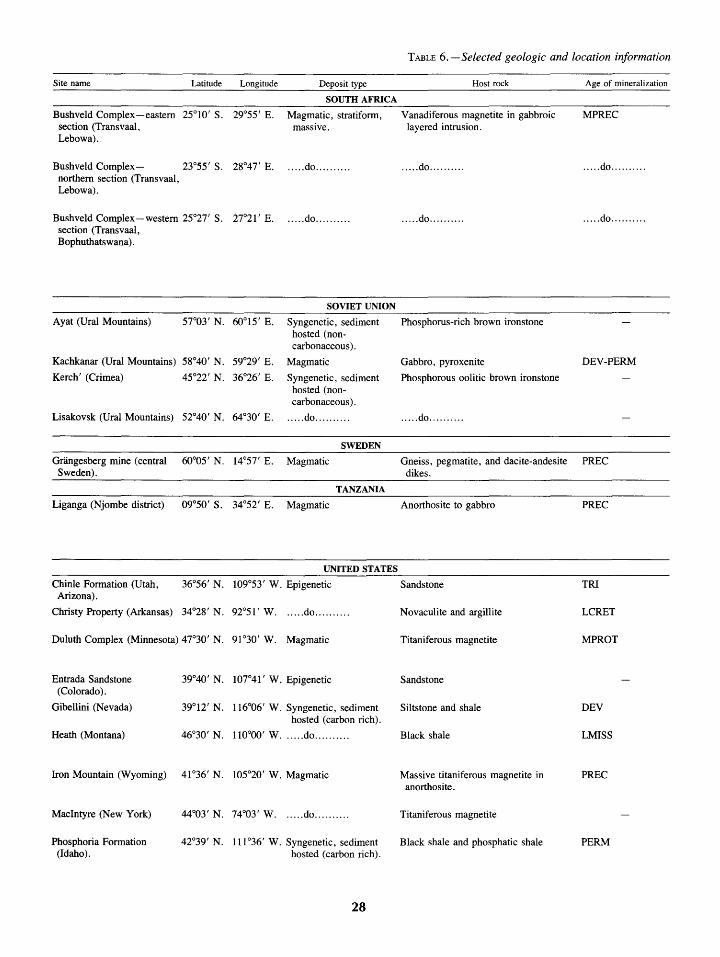
Site name Latitude Longitude Deposit type
SOUTH AFRICA
Bushveld Complex-eastern 25°10' S. 29°55' E. section (Transvaal,
Magmatic, stratiform, massive.
Lebowa).
Bushveld Complex- 23°55' S. 28°47' E. .. ... do .......... northern section (Transvaal, Lebowa).
Bushveld Complex-western 25°27' S. 27°21' E. .. ... do ......... . section (Transvaal, Bophuthatswana).
Ayat (Ural Mountains)
SOVIET UNION
Syngenetic, sediment hosted (noncarbonaceous).
Kachkanar (Ural Mountains) 58°40' N. 59°29' E. Magmatic
Syngenetic, sediment hosted (noncarbonaceous).
Kerch' (Crimea)
Lisakovsk (Ural Mountains) 52°40' N. 64°30' E. . .... do ......... .
SWEDEN
Grangesberg mine (central 60°05' N. 14°57' E. Magmatic Sweden).
TANZANIA
Liganga (Njombe district) 09°50' S. 34°52' E. Magmatic
UNITED STATES
Chinle Formation (Utah, 36°56' N. 109°53' W. Epigenetic Arizona).
Christy Property (Arkansas) 34°28' N. 92°51' W. .. ... do ..........
Duluth Complex (Minnesota) 47°30' N. 91 °30' W. Magmatic
Entrada Sandstone 39°40' N. 107° 41 ' W. Epigenetic (Colorado).
Gibellini (Nevada) 39°12' N. 116°06' W. Syngenetic, sediment hosted (carbon rich).
Heath (Montana) 46°30' N. 110°00' W ...... do ..........
Iron Mountain (Wyoming) 41°36' N. 105°20' W. Magmatic
Macintyre (New York)
Phosphoria Formation (Idaho).
44°03' N. 74°03' W. .. ... do ..........
42°39' N. 111°36' W. Syngenetic, sediment hosted (carbon rich).
28
TABLE 6. -Selected geologic and location information
Host rock
Vanadiferous magnetite in gabbroic layered intrusion.
..... do ......... .
..... do ......... .
Phosphorus-rich brown ironstone
Gabbro, pyroxenite
Phosphorous oolitic brown ironstone
. .... do ......... .
Age of mineralization
MPREC
. .... do ......... .
. .... do ......... .
DEY-PERM
Gneiss, pegmatite, and dacite-andesite PREC dikes.
Anorthosite to gabbro
Sandstone
Novaculite and argillite
Titaniferous magnetite
Sandstone
Siltstone and shale
Black shale
Massive titaniferous magnetite in anorthosite.
Titaniferous magnetite
Black shale and phosphatic shale
PREC
TRI
LCRET
MPROT
DEV
LMISS
PREC
PERM
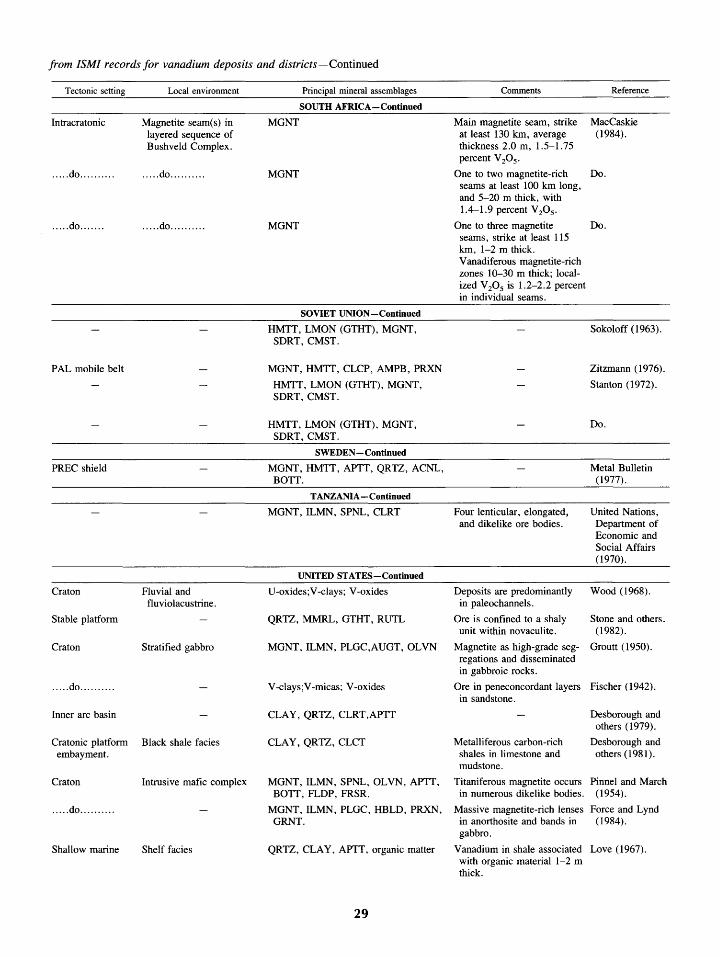
from ISM! records for vanadium deposits and districts-Continued
Tectonic setting Local environment Principal mineral assemblages Comments Reference
SOUTH AFRICA-Continued
Intracratonic Magnetite seam(s) in MGNT Main magnetite seam, strike MacCaskie layered sequence of at least 130 km, average (1984). Bushveld Complex. thickness 2.0 m, 1.5-1.75
percent V20 5 .
..... do .......... ..... do .......... MGNT One to two magnetite-rich Do. seams at least 100 km long, and 5-20 m thick, with 1.4-1.9 percent V20 5 •
..... do ....... ..... do .......... MGNT One to three magnetite Do . seams, strike at least 115 km, 1-2m thick. Vanadiferous magnetite-rich zones 10-30 m thick; local-ized V 20 5 is 1.2-2.2 percent in individual seams.
SOVIET UNION-Continued
HMTI, LMON (GTHT), MGNT, Sokoloff (1963). SDRT, CMST.
PAL mobile belt MGNT, HMTI, CLCP, AMPB, PRXN Zitzmann (1976).
HMTI, LMON (GTHT), MGNT, Stanton (1972). SDRT, CMST.
HMTI, LMON (GTHT), MGNT, Do. SDRT, CMST.
SWEDEN -Continued
PREC shield MGNT, HMTI, APTI, QRTZ, ACNL, Metal Bulletin BOTI. (1977).
TANZANIA-Continued
MGNT, ILMN, SPNL, CLRT Four lenticular, elongated, United Nations, and dikelike ore bodies. Department of
Economic and Social Affairs (1970).
UNITED STATES-Continued
Craton Fluvial and U-oxides;V-clays; V-oxides Deposits are predominantly Wood (1968). fluviolacustrine. in paleochannels.
Stable platform QRTZ, MMRL, GTHT, RUTL Ore is confined to a shaly Stone and others. unit within novaculite. (1982).
Craton Stratified gabbro MGNT, ILMN, PLGC,AUGT, OLVN Magnetite as high-grade seg- Groutt (1950). regations and disseminated in gabbroic rocks.
..... do .......... V-clays;V-micas; V-oxides Ore in peneconcordant layers Fischer (1942). in sandstone.
Inner arc basin CLAY, QRTZ, CLRT,APTI Desborough and others (1979).
Cratonic platform Black shale facies CLAY,QRTZ,CLCT Metalliferous carbon-rich Desborough and embayment. shales in limestone and others (1981).
mudstone.
Craton Intrusive mafic complex MGNT, ILMN, SPNL, OLVN, APTI, Titaniferous magnetite occurs Pinnel and March BOTI, FLDP, FRSR. in numerous dikelike bodies. (1954).
..... do .......... MGNT, ILMN, PLGC, HBLD, PRXN, Massive magnetite-rich lenses Force and Lynd GRNT. in anorthosite and bands in (1984).
gabbro.
Shallow marine Shelf facies QRTZ, CLAY, APTI, organic matter Vanadium in shale associated Love (1967). with organic material 1-2m thick.
29
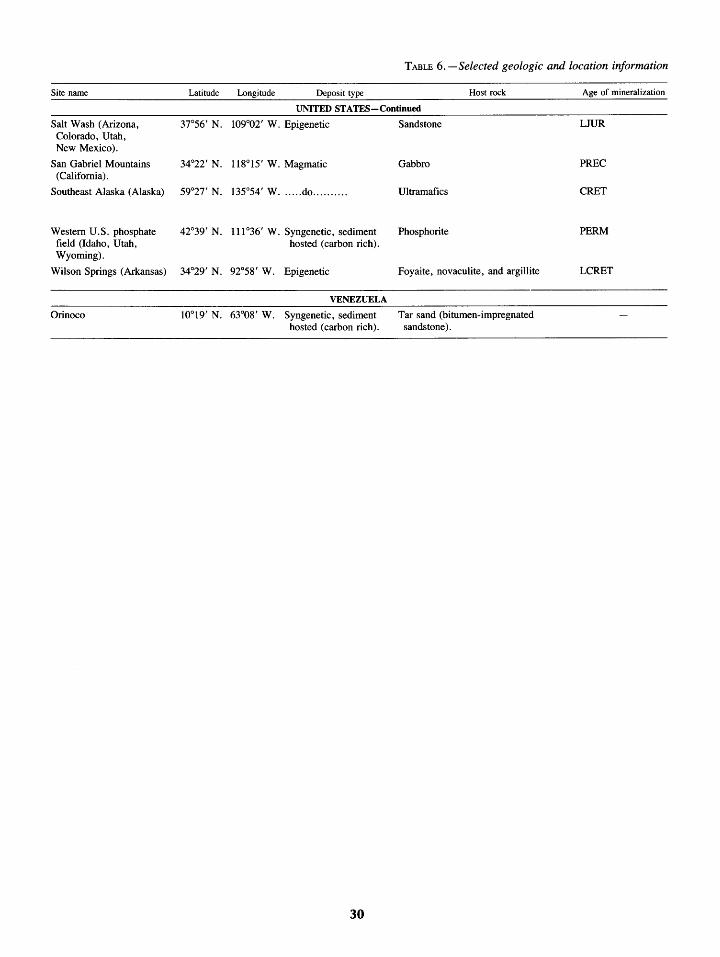
Site name
Salt Wash (Arizona, Colorado, Utah, New Mexico).
San Gabriel Mountains (California).
Southeast Alaska (Alaska)
Western U.S. phosphate field (Idaho, Utah, Wyoming).
Wilson Springs (Arkansas)
Orinoco
TABLE 6. -Selected geologic and location information
Latitude Longitude Deposit type Host rock Age of mineralization
UNITED STATES-Continued
37°56' N. 109°02' W. Epigenetic
34°22' N. 118°15' W. Magmatic
59°27' N. 135°54' W ...... do ..........
42°39' N. 111°36' W. Syngenetic, sediment hosted (carbon rich).
34°29' N. 92°58' W. Epigenetic
VENEZUELA
10°19' N. 63°08' W. Syngenetic, sediment hosted (carbon rich).
30
Sandstone
Gabbro
Ultramafics
Phosphorite
Foyaite, novaculite, and argillite
Tar sand (bitumen-impregnated sandstone).
UUR
PREC
CRET
PERM
LCRET
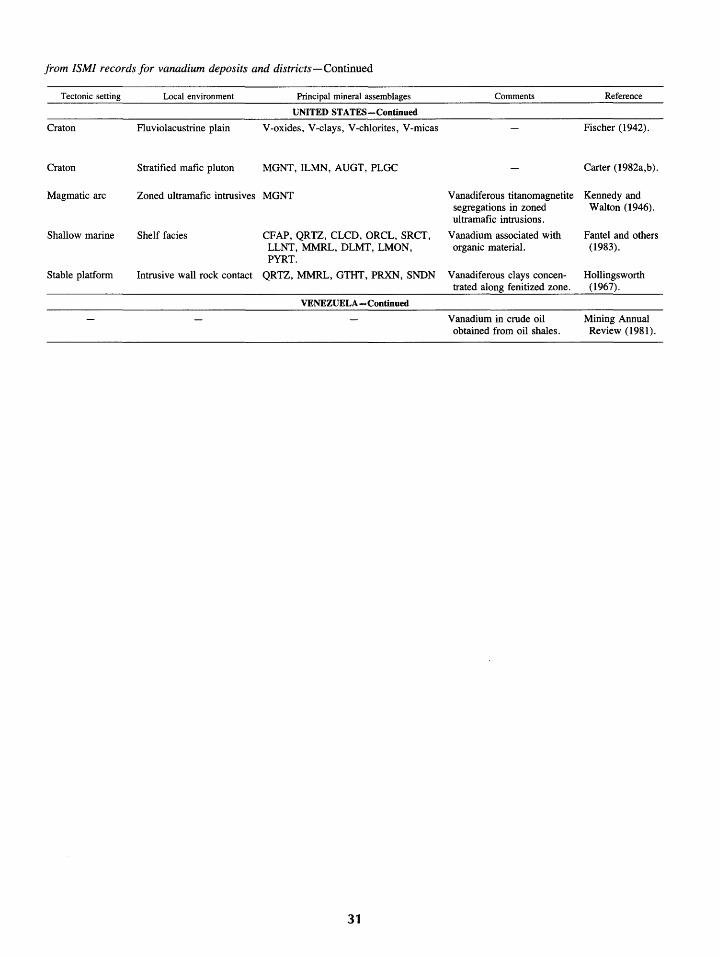
from ISM! records for vanadium deposits and districts-Continued
Tectonic setting Local environment Principal mineral assemblages Comments Reference
UNITED STATES-Continued
Craton Fluviolacustrine plain V-oxides, V-clays, V-chlorites, V-micas Fischer (1942).
Craton Stratified mafic pluton MGNT, ILMN, AUGT, PLGC Carter (1982a,b).
Magmatic arc Zoned ultramafic intrusives MGNT Vanadiferous titanomagnetite Kennedy and segregations in zoned Walton (1946). ultramafic intrusions.
Shallow marine Shelf facies CFAP,QRTZ,CLCD,ORCL,SRCT, Vanadium associated with Pantel and others LLNT, MMRL, DLMT, LMON, organic material. (1983). PYRT.
Stable platform Intrusive wall rock contact QRTZ,MMRL,GTHT,PRXN,SNDN Vanadiferous clays concen- Hollingsworth trated along fenitized zone. (1967).
VENEZUELA-Continued
Vanadium in crude oil Mining Annual obtained from oil shales. Review (1981).
31
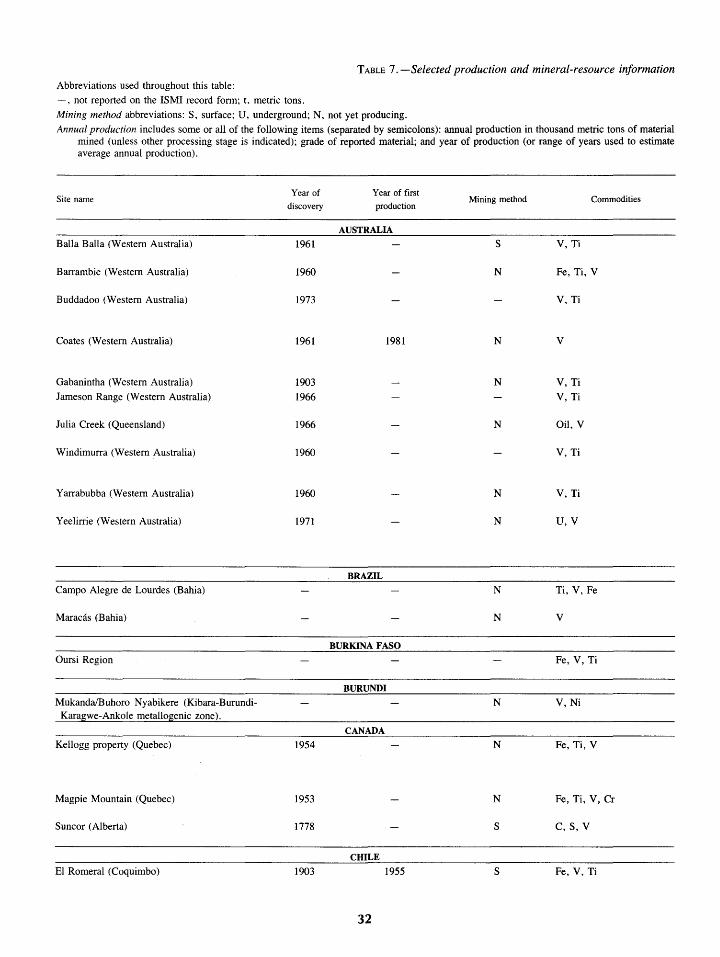
TABLE 7.-Selected production and mineral-resource information Abbreviations used throughout this table:
-, not reported on the ISMI record form; t, metric tons.
Mining method abbreviations: S, surface; U, underground; N, not yet producing.
Annual production includes some or all of the following items (separated by semicolons): annual production in thousand metric tons of material mined (unless other processing stage is indicated); grade of reported material; and year of production (or range of years used to estimate average annual production).
Site name Year of Year of first
Commodities discovery production
Mining method
AUSTRALIA
Balla Balla (Western Australia) 1961 s V, Ti
Barrambie (Western Australia) 1960 N Fe, Ti, V
Buddadoo (Western Australia) 1973 V, Ti
Coates (Western Australia) 1961 1981 N v
Gabanintha (Western Australia) 1903 N V, Ti
Jameson Range (Western Australia) 1966 V, Ti
Julia Creek (Queensland) 1966 N Oil, V
Windimurra (Western Australia) 1960 V, Ti
Yarrabubba (Western Australia) 1960 N V, Ti
Yeelirrie (Western Australia) 1971 N U, V
BRAZIL
Campo Alegre de Lourdes (Bahia) N Ti, V, Fe
Maracas (Bahia) N v
BURKINA FASO
Oursi Region Fe, V, Ti
BURUNDI
Mukanda!Buhoro Nyabikere (Kibara-Burundi- N V,Ni Karagwe-Ankole metallogenic zone).
CANADA
Kellogg property (Quebec) 1954 N Fe, Ti, V
Magpie Mountain (Quebec) 1953 N Fe, Ti, V, Cr
Suncor (Alberta) 1778 s C,S, V
CIDLE
EL Romeral (Coquimbo) 1903 1955 s Fe, V, Ti
32
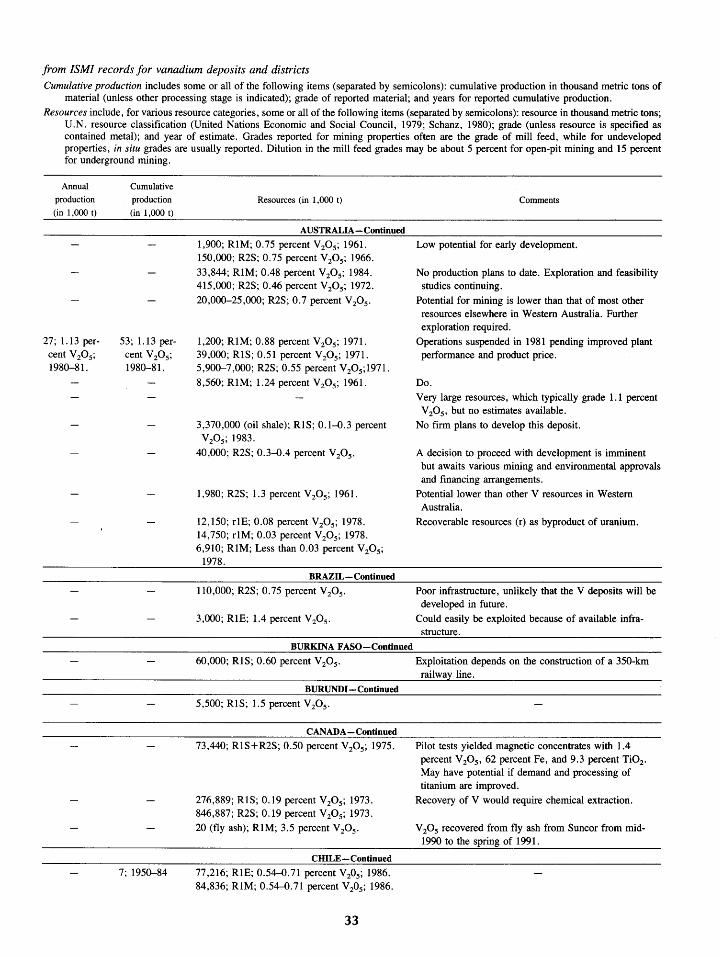
from ISM/ records for vanadium deposits and districts Cumulative production includes some or all of the following items (separated by semicolons): cumulative production in thousand metric tons of
material (unless other processing stage is indicated); grade of reported material; and years for reported cumulative production. Resources include, for various resource categories, some or all of the following items (separated by semicolons): resource in thousand metric tons;
U.N. resource classification (United Nations Economic and Social Council, I979; Schanz, I980); grade (unless resource is specified as contained metal); and year of estimate. Grades reported for mining properties often are the grade of mill feed, while for undeveloped properties, in situ grades are usually reported. Dilution in the mill feed grades may be about 5 percent for open-pit mining and IS percent for underground mining.
Annual
production
(in 1,000 t)
27; 1.13 percent V20 5 ;
I980-81.
Cumulative
production
(in 1,000 t)
53; l.I3 percent V20 5;
I980-81.
7; I950-84
Resources (in 1 ,000 t)
AUSTRALIA-Continued
I,900; RIM; 0.75 percent V20 5 ; I961. ISO,OOO; R2S; 0.75 percent V20 5 ; I966. 33,844; RIM; 0.48 percent V20 5 ; I984. 4I5,000; R2S; 0.46 percent V20 5 ; I972. 20,000-25,000; R2S; 0.7 percent V20 5 .
1,200; RIM; 0.88 percent V20 5 ; 1971. 39,000; RlS; O.SI percent V20 5 ; I971. 5,900-7,000; R2S; 0.55 percent V20 5;I971. 8,560; RIM; 1.24 percent V20 5 ; I961.
3,370,000 (oil shale); RIS; O.I-0.3 percent V20 5 ; 1983.
40,000; R2S; 0.3-0.4 percent V20 5 •
I,980; R2S; 1.3 percent V20 5 ; I961.
I2,I50; rlE; 0.08 percent V20 5 ; 1978. 14,750; rlM; 0.03 percent V20 5 ; 1978. 6,910; RIM; Less than 0.03 percent V20 5 ;
I978. BRAZIL-Continued
110,000; R2S; 0. 75 percent V 20 5 .
3,000; RlE; 1.4 percent V20 5 .
BURKINA FASO-Continued
60,000; RIS; 0.60 percent V20 5 •
BURUNDI-Continued
5,500; RIS; 1.5 percent V20 5 •
CANADA-Continued
73,440; RIS+R2S; 0.50 percent V20 5 ; I975.
276,889; RIS; O.I9 percent V20 5; I973. 846,887; R2S; O.I9 percent V20 5; 1973. 20 (fly ash); RIM; 3.5 percent V20 5 •
CHILE-Continued
77,216; RlE; 0.54-0.7I percent V205; I986. 84,836; RIM; 0.54-0.71 percent V205 ; I986.
33
Comments
Low potential for early development.
No production plans to date. Exploration and feasibility studies continuing.
Potential for mining is lower than that of most other resources elsewhere in Western Australia. Further exploration required.
Operations suspended in I98I pending improved plant performance and product price.
Do. Very large resources, which typically grade l.I percent V20 5 , but no estimates available.
No firm plans to develop this deposit.
A decision to proceed with development is imminent but awaits various mining and environmental approvals and financing arrangements.
Potential lower than other V resources in Western Australia.
Recoverable resources (r) as byproduct of uranium.
Poor infrastructure, unlikely that the V deposits will be developed in future.
Could easily be exploited because of available infrastructure.
Exploitation depends on the construction of a 350-km railwa line.
Pilot tests yielded magnetic concentrates with I.4 percent V20 5 , 62 percent Fe, and 9.3 percent Ti02 •
May have potential if demand and processing of titanium are improved.
Recovery of V would require chemical extraction.
V 20 5 recovered from fly ash from Suncor from midI990 to the spring of I991.
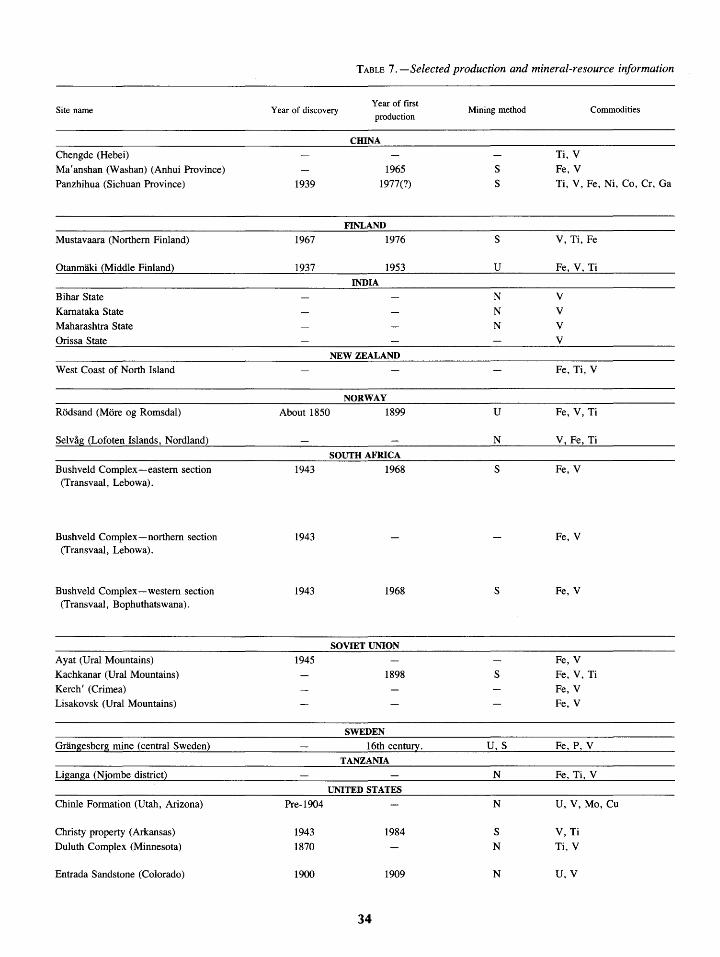
Site name
Chengde (Hebei)
Ma'anshan (Washan) (Anhui Province)
Panzhihua (Sichuan Province)
Mustavaara (Northern Finland)
Otanmaki (Middle Finland)
Bihar State
Kamataka State Maharashtra State
Orissa State
West Coast of North Island
ROdsand (More og Romsdal)
Selvag (Lofoten Islands, Nordland)
Bushveld Complex-eastern section (Transvaal, Lebowa).
Bushveld Complex-northern section (Transvaal, Lebowa).
Bush veld Complex-western section (Transvaal, Bophuthatswana).
Ayat (Ural Mountains)
Kachkanar (Ural Mountains) Kerch' (Crimea)
Lisakovsk (Ural Mountains)
Granges berg mine (central Sweden)
Liganga (Njombe district)
Chinle Formation (Utah, Arizona)
Christy property (Arkansas)
Duluth Complex (Minnesota)
Entrada Sandstone (Colorado)
TABLE 7. -Selected production and mineral-resource information
Year of discovery Year of first
production
ClllNA
1965
1939 1977(?)
FINLAND
1967 1976
1937 1953
INDIA
NEW ZEALAND
NORWAY
About 1850 1899
SOUTH AFRICA
1943 1968
1943
1943 1968
SOVIET UNION
1945 1898
SWEDEN
16th century.
TANZANIA
UNITED STATES
Pre-1904
1943 1984
1870
1900 1909
34
Mining method
s s
s
u
N
N N
u
N
s
s
s
u.s
N
N
s N
N
Ti, V
Fe, V
Commodities
Ti, V, Fe, Ni, Co, Cr, Ga
V, Ti, Fe
Fe, V, Ti
v v v v
Fe, Ti, V
Fe, V, Ti
V, Fe, Ti
Fe, V
Fe, V
Fe, V
Fe, V
Fe, V, Ti
Fe, V Fe, V
Fe, P, V
Fe, Ti, V
U, V, Mo. Cu
V, Ti
Ti, V
u.v
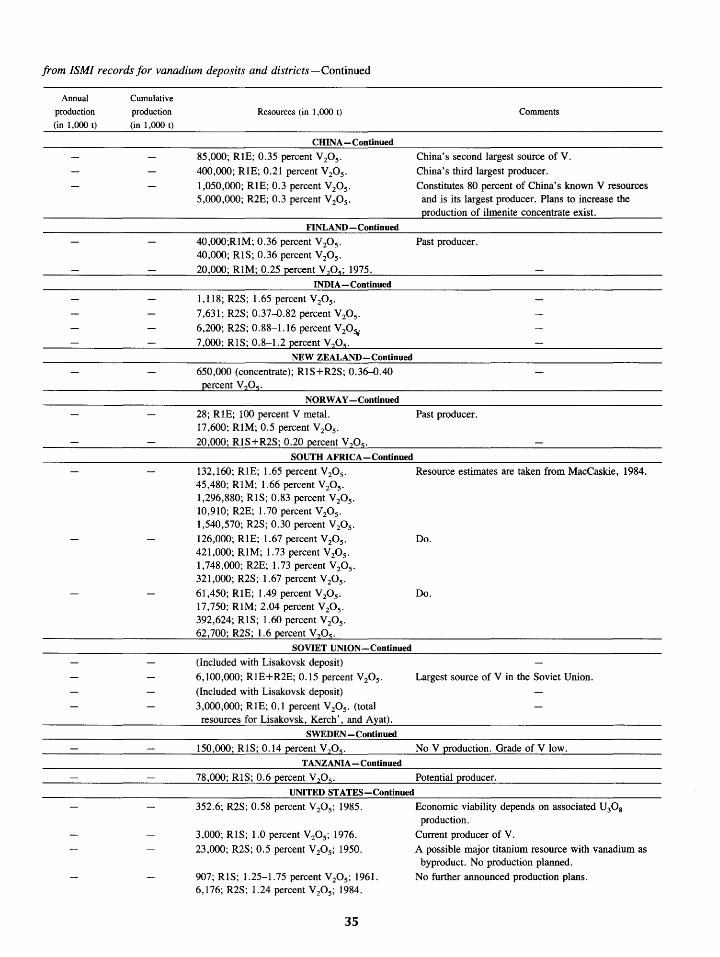
from ISM/ records for vanadium deposits and districts-Continued
Annual
production
(in 1,000 t)
Cumulative
production
(in 1,000 t)
Resources (in 1 ,000 t)
CIDNA-Continued
85,000; RIB; 0.35 percent V20 5 .
400,000; RIE; 0.21 percent V 20 5 .
1,050,000; RIB; 0.3 percent V20 5 .
5,000,000; R2E; 0.3 percent V20 5 •
FINLAND-Continued
40,000;R1M; 0.36 percent V20 5 .
40,000; RlS; 0.36 percent V 20 5 .
20,000; RIM; 0.25 percent V20 5; 1975. INDIA-Continued
1,118; R2S; 1.65 percent V20 5 •
7,631; R2S; 0.37-0.82 percent V20 5 .
6,200; R2S; 0.88-1.16 percent V20s.; 7,000; RlS; 0.8-1.2 percent V205.
NEW ZEALAND-Continued
650,000 (concentrate); R1S+R2S; 0.36-0.40
NORWAY -Continued
Comments
China's second largest source of V. China's third largest producer. Constitutes 80 percent of China's known V resources
and is its largest producer. Plans to increase the production of ilmenite concentrate exist.
Past producer.
28; RlE; 100 percent V metal. Past producer. 17,600; RIM; 0.5 percent V20 5 .
20,000; R1S+R2S; 0.20 percent V70 5•
SOUTH AFRICA-Continued
132,160; RIB; 1.65 percent V20 5 • Resource estimates are taken from MacCaskie, 1984. 45,480; RIM; 1.66 percent V20 5 .
1,296,880; R1S; 0.83 percent V20 5 •
10,910; R2E; 1.70 percent V20 5 .
1,540,570; R2S; 0.30 percent V20 5 •
126,000; R1E; 1.67 percent V 20 5 • Do. 421,000; R1M; 1.73 percent V20 5 .
1,748,000; R2E; 1.73 percent V20 5 •
321,000; R2S; 1.67 percent V20 5 .
61 ,450; RlE; 1.49 percent V 20 5 • Do. 17,750; R1M; 2.04 percent V20 5 •
392,624; RlS; 1.60 percent V20 5 .
62,700; R2S; 1.6 percent Vz05 .
SOVIET UNION-Continued
(Included with Lisakovsk deposit) 6,100,000; RIB+R2E; 0.15 percent V20 5 . Largest source of V in the Soviet Union. (Included with Lisakovsk deposit) 3,000,000; RlE; 0.1 percent V20 5 . (total resources for Lisakovsk, Kerch', and Ayat).
SWEDEN -Continued
150,000; R1S; 0.14 percent V205 • NoV production. Grade of V low. TANZANIA-Continued
78,000; R1S; 0.6 percent V20 5 • Potential producer. UNITED STATES-Continued
352.6; R2S; 0.58 percent V20 5 ; 1985. Economic viability depends on associated U30 8
3,000; RlS; 1.0 percent V20 5 ; 1976. 23,000; R2S; 0.5 percent V20 5 ; 1950.
907; R1S; 1.25-1.75 percent V20 5 ; 1961. 6,176; R2S; 1.24 percent V20 5 ; 1984.
35
production. Current producer of V. A possible major titanium resource with vanadium as
byproduct. No production planned. No further announced production plans.
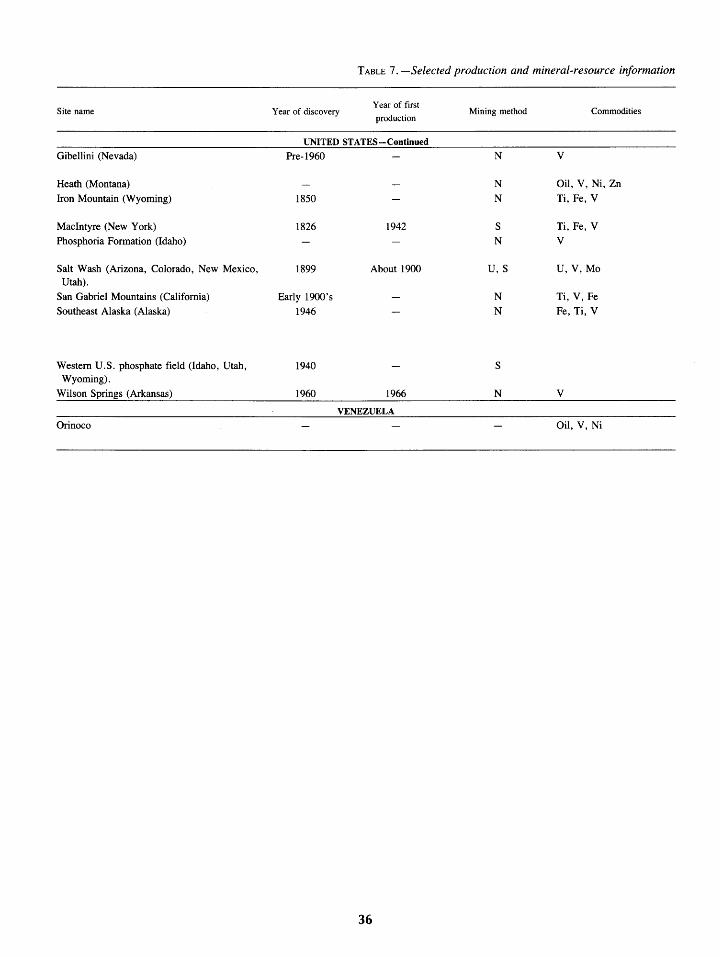
Site name
Gibellini (Nevada)
Heath (Montana)
Iron Mountain (Wyoming)
Macintyre (New York)
Phosphoria Formation (Idaho)
Salt Wash (Arizona, Colorado, New Mexico, Utah).
San Gabriel Mountains (California)
Southeast Alaska (Alaska)
Western U.S. phosphate field (Idaho, Utah, Wyoming).
Wilson Springs (Arkansas)
Orinoco
TABLE 7. -Selected production and mineral-resource information
Year of discovery Year of first
Mining method Commodities production
UNITED STATES-Continued
Pre-1960 N v
N Oil, V, Ni, Zn
1850 N Ti, Fe, V
1826 1942 s Ti, Fe, V
N v
1899 About 1900 U, S U,V,Mo
Early 1900's N Ti, V, Fe
1946 N Fe, Ti, V
1940 s
1960 1966 N v VENEZUELA
Oil, V, Ni
36
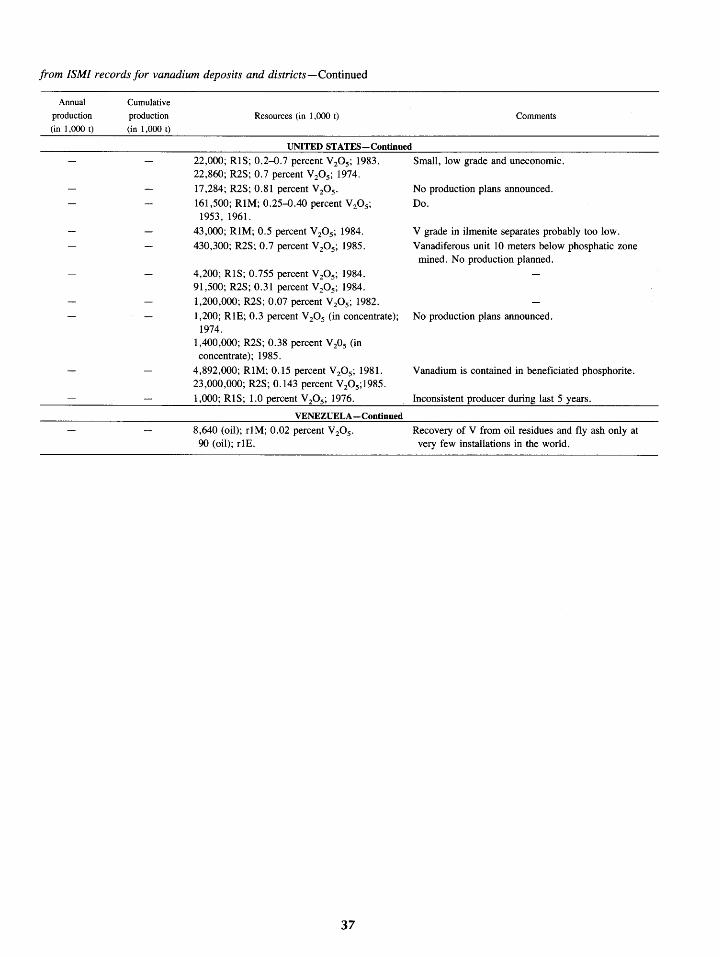
from ISM/ records for vanadium deposits and districts-Continued
Annual
production
(in 1,000 t)
Cumulative
production
(in 1,000 t)
Resources (in 1,000 t)
UNITED STATES-Continued
22,000; RIS; 0.2--0.7 percent V20 5 ; I983. 22,860; R2S; 0.7 percent V20 5 ; I974. I7,284; R2S; 0.8I percent V20 5 •
I6I,500; RIM; 0.25--0.40 percent V20 5 ;
I953, I961. 43,000; RIM; 0.5 percent V20 5 ; I984. 430,300; R2S; 0.7 percent V20 5 ; I985.
4,200; RIS; 0.755 percent V20 5 ; I984. 9I,500; R2S; 0.3I percent V20 5 ; I984. I,200,000; R2S; 0.07 percent V20 5 ; I982. I,200; RIB; 0.3 percent V20 5 (in concentrate); I974.
I,400,000; R2S; 0.38 percent V205 (in concentrate); I985.
4,892,000; RIM; O.I5 percent V20 5 ; I981. 23,000,000; R2S; O.I43 percent V20 5;1985.
I,OOO; RIS; 1.0 percent V20 5 ; I976.
VENEZUELA-Continued
8,640 (oil); riM; 0.02 percent V20 5 .
90 (oil); rlE.
37
Comments
Small, low grade and uneconomic.
No production plans announced. Do.
V grade in ilmenite separates probably too low. Vanadiferous unit IO meters below phosphatic zone
mined. No production planned.
No production plans announced.
Vanadium is contained in beneficiated phosphorite.
Inconsistent producer during last 5 years.
Recovery of V from oil residues and fly ash only at very few installations in the world.
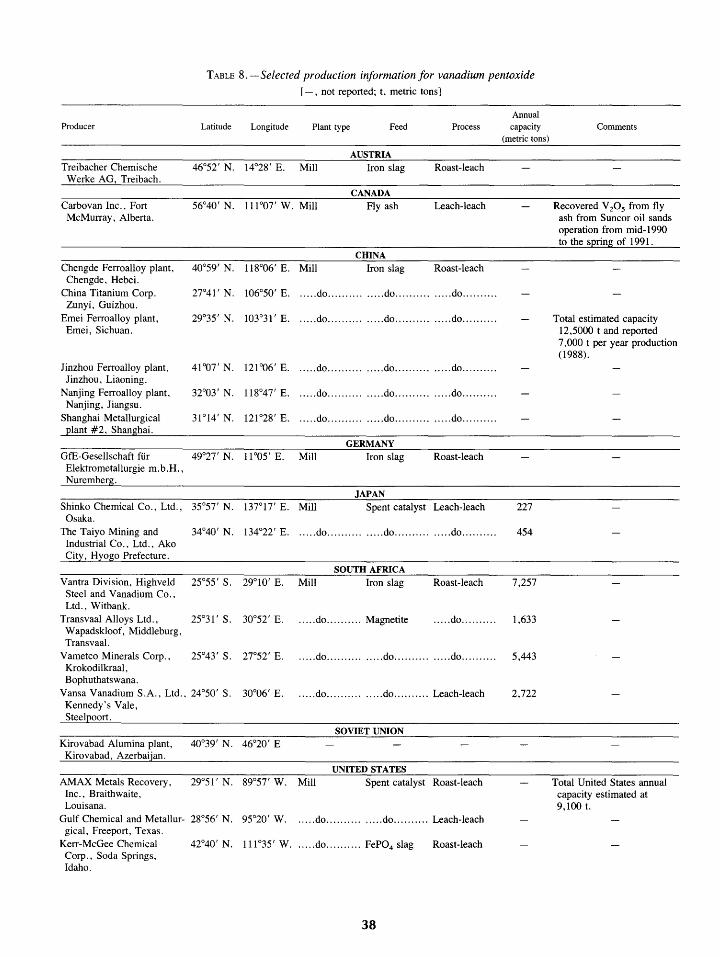
TABLE 8. -Selected production information for vanadium pentoxide [-, not reported; t, metric tons]
Producer
Treibacher Chemische Werke AG, Treibach.
Carbovan Inc., Fort McMurray, Alberta.
Chengde Ferroalloy plant, Chengde, Hebei.
China Titanium Corp. Zunyi, Guizhou.
Emei Ferroalloy plant, Emei, Sichuan.
Jinzhou Ferroalloy plant, Jinzhou, Liaoning.
Nanjing Ferroalloy plant, Nanjing, Jiangsu.
Shanghai Metallurgical plant #2, Shanghai.
GfE-Gesellschaft fiir Elektrometallurgie m.b.H., Nurember .
Shinko Chemical Co., Ltd., Osaka.
The Taiyo Mining and Industrial Co., Ltd., Ako City, Hyogo Prefecture.
Vantra Division, Highveld Steel and Vanadium Co., Ltd., Witbank.
Latitude Longitude Plant type Feed Process
AUSTRIA 46°52' N. 14°28' E. Mill Iron slag Roast-leach
CANADA 56°40' N. 111 °07' W. Mill Fly ash Leach-leach
CHINA
Iron slag Roast-leach
27°41' N. 106°50' E. . .... do ............... do ............... do ........ ..
29°35' N. 103°31' E. .. ... do ............... do ............... do ........ ..
41 °07' N. 121 °06' E. ..... do .......... . .... do .......... ..... do ..........
32°03' N. 118°47' E. ..... do .......... . .... do .......... ..... do ..........
31°14' N. 121 °28' E. ..... do .......... ..... do .......... .. ... do ..........
GERMANY 49°27' N. 11 °05' E. Mill Iron slag Roast-leach
JAPAN 35°57' N. 137°17' E. Mill Spent catalyst Leach-leach
34°40' N. 134°22' E. ..... do ............... do ............... do ..........
SOUTH AFRICA 25°55' s. 29°10' E. Mill Iron slag Roast-leach
Transvaal Alloys Ltd., 25°31' S. 30°52' E. .. .. . do .......... Magnetite ..... do ......... . W apadskloof, Middleburg, Transvaal.
Vametco Minerals Corp., 25°43' S. 27°52' E. Krokodilkraal, Bophuthatswana.
Vansa Vanadium S.A., Ltd., 24°50' S. 30°06' E. Kennedy's Vale, Steel oort.
Kirovabad Alumina plant, Kirovabad, Azerbaijan.
..... do ............... do ............... do ......... .
..... do ............... do .......... Leach-leach
SOVIET UNION
UNITED STATES AMAX Metals Recovery, 29°51' N. 89°57' W. Mill Spent catalyst Roast-leach
Inc., Braithwaite, Louisana.
Gulf Chemical and Metallur- 28°56' N. 95°20' W. .. ... do ............... do .......... Leach-leach gical, Freeport, Texas.
Kerr-McGee Chemical Corp., Soda Springs, Idaho.
42°40' N. 111°35' W ...... do .......... FeP04 slag Roast -leach
38
Annual capacity
(metric tons)
227
454
7,257
1,633
5,443
2,722
Comments
Recovered V 20 5 from fly ash from Suncor oil sands operation from mid-1990 to the spring of 1991.
Total estimated capacity 12,5000 t and reported 7,000 t per year production (1988).
Total United States annual capacity estimated at 9,100 t.
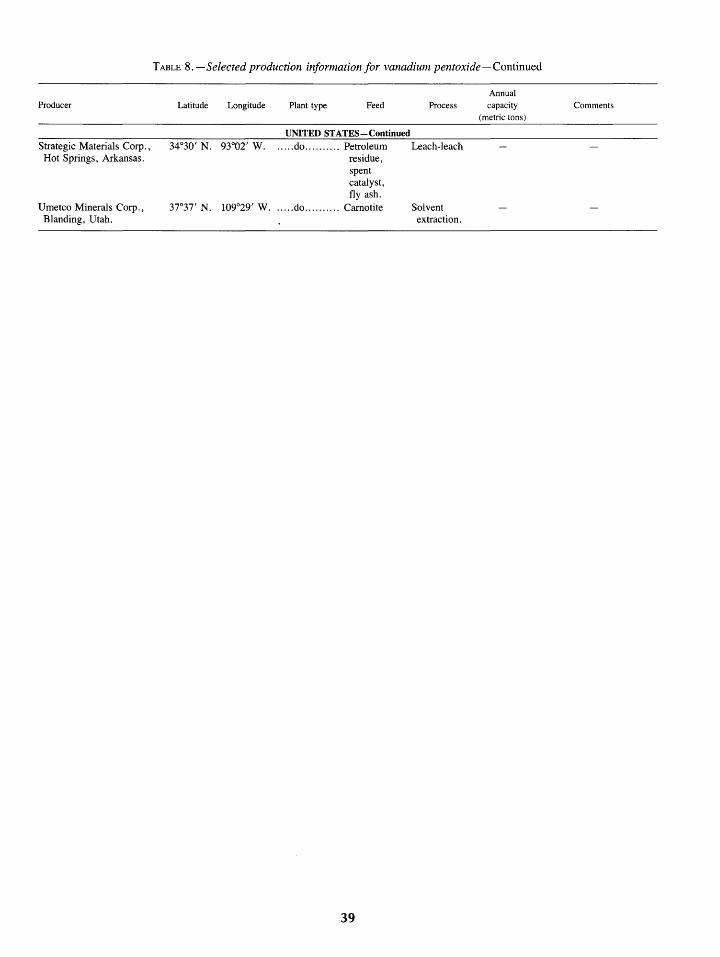
Producer
Strategic Materials Corp., Hot Springs, Arkansas.
Umetco Minerals Corp., Blanding, Utah.
TABLE 8. -Selected production information for vanadium pentoxide-Continued
Latitude Longitude Plant type Feed
UNITED STATES-Continued 34°30' N. 93°02' W. . .... do .......... Petroleum
residue, spent catalyst, fly ash.
37°37' N. 109°29' W ...... do .......... Carnotite
39
Process
Leach-leach
Solvent extraction.
Annual capacity
(metric tons) Comments
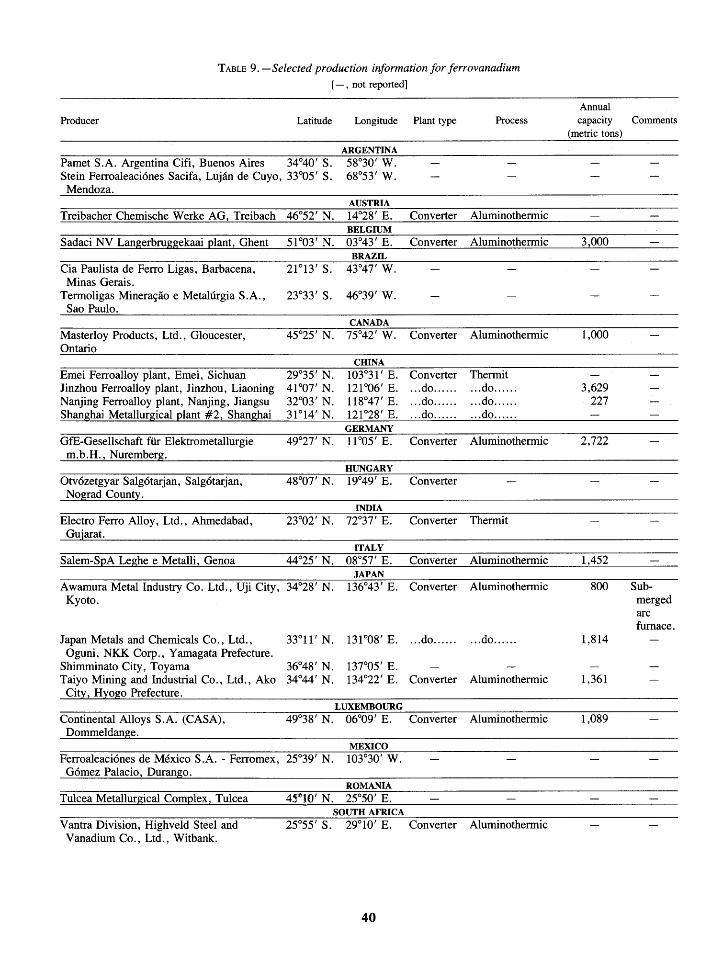
TABLE 9.-Selected production information for ferrovanadium [- , not reported]
Annual Producer Latitude Longitude Plant type Process capacity Comments
(metric tons)
ARGENTINA
Pamet S.A. Argentina Cifi, Buenos Aires 34°40' s. 58°30' w. Stein Ferroaleaci6nes Sacifa, Lujan de Cuyo, 33°05' S. 68°53' w. Mendoza.
AUSTRIA
Treibacher Chemische Werke AG, Treibach 46°52' N. 14°28' E. Converter Aluminothermic BELGIUM
Sadaci NV Langerbruggekaai Qlant, Ghent 51°03' N. 03°43' E. Converter Aluminothermic 3,000 BRAZIL
Cia Paulista de Ferro Ligas, Barbacena, 21°13' S. 43°47' w. Minas Gerais.
Termoligas Minera~iio e Metalurgia S.A., 23°33' s. 46°39' w. Sao Paulo.
CANADA
Masterloy Products, Ltd., Gloucester, 45°25' N. 75°42' w. Converter Aluminothermic 1,000 Ontario
CHINA
Emei Ferroalloy plant, Emei, Sichuan 29°35' N. 103°31' E. Converter Thermit Jinzhou Ferroalloy plant, Jinzhou, Liaoning 41°07' N. 121°06' E. ... do ...... . .. do ...... 3,629 Nanjing Ferroalloy plant, Nanjing, Jiangsu 32°03' N. 118°47' E. . .. do ...... ... do ...... 227 Shanghai Metallurgical Qlant #2, Shanghai 31 °14' N. 121°28' E. . .. do ...... . .. do ......
GERMANY
GfE-Gesellschaft ftir Elektrometallurgie 49°27' N. 11 °05' E. Converter Aluminothermic 2,722 m.b.H., Nuremberg.
HUNGARY
Otv6zetgyar Salg6tarjan, Salg6tarjan, 48°07' N. 19°49' E. Converter Nograd County.
INDIA
Electro Ferro Alloy, Ltd., Ahmedabad, 23°02' N. 72°37' E. Converter Thermit Gu·arat.
ITALY
Salem-SQA Leghe e Metalli, Genoa 44°25' N. 08°57' E. Converter Aluminothermic 1,452 JAPAN
Awamura Metal Industry Co. Ltd., Uji City, 34°28' N. 136°43' E. Converter Aluminothermic 800 Sub-Kyoto. merged
arc furnace.
Japan Metals and Chemicals Co., Ltd., 33°11' N. 131°08' E. . .. do ...... . .. do ...... 1,814 Oguni, NKK Corp., Yamagata Prefecture.
Shimminato City, Toyama 36°48' N. 137°05' E. Taiyo Mining and Industrial Co., Ltd., Ako 34°44' N. 134°22' E. Converter Aluminothermic 1,361
City, Hyogo Prefecture. LUXEMBOURG
Continental Alloys S.A. (CASA), 49°38' N. 06°09' E. Converter Aluminothermic 1,089 Dommeldange.
MEXICO
Ferroaleaci6nes de Mexico S.A. - Ferromex, 25°39' N. 103°30' w. Gomez Palacio, Durango.
ROMANIA
Tulcea Metallurgical ComQlex, Tulcea 45~10' N. 25°50' E. SOUTH AFRICA
Vantra Division, Highveld Steel and 25°55' S. 29°10' E. Converter Aluminothermic Vanadium Co., Ltd., Witbank.
40
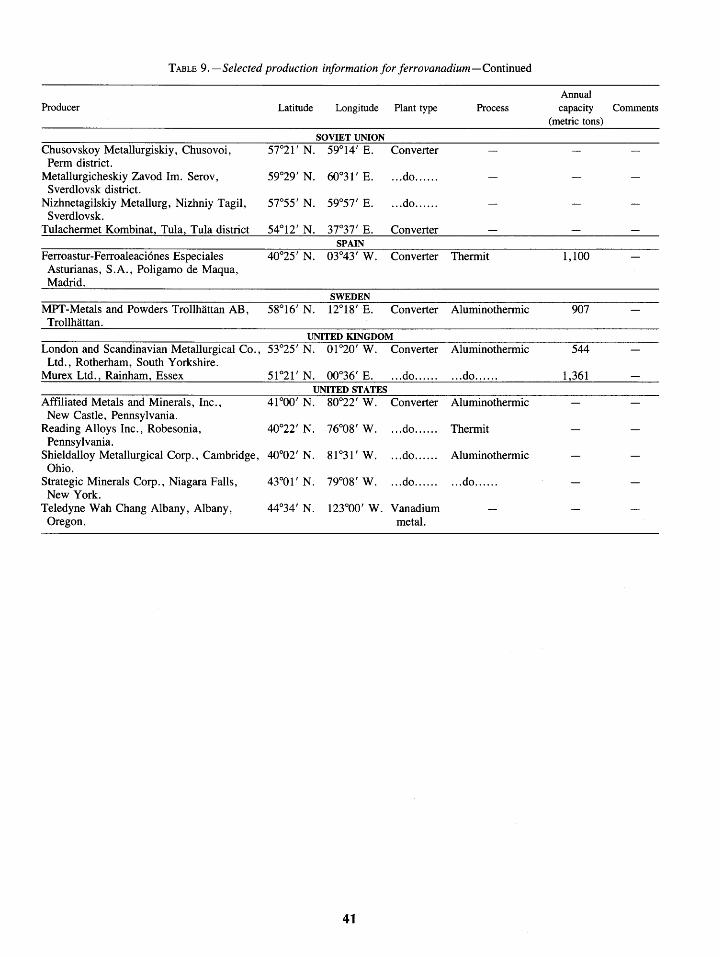
TABLE 9. -Selected production information for ferrovanadium-Continued
Annual Producer Latitude Longitude Plant type Process capacity Comments
(metric tons)
SOVIET UNION Chusovskoy Metallurgiskiy, Chusovoi, 57°21' N. 59°14' E. Converter
Perm district. Metallurgicheskiy Zavod Im. Serov, 59°29' N. 60°31' E. ... do ...... Sverdlovsk district.
Nizhnetagilskiy Metallurg, Nizhniy Tagil, 57°55' N. 59°57' E. ...do ...... Sverdlovsk.
Tulachermet Kombinat, Tula, Tula district 54°12' N. 37°37' E. Converter SPAIN
Ferroastur-Ferroaleaci6nes Especiales 40°25' N. 03°43' w. Converter Thermit 1,100 Asturianas, S.A., Poligamo de Maqua, Madrid.
SWEDEN
MPT-Metals and Powders Trollhattan AB, 58°16' N. 12°18' E. Converter Aluminothermic 907 Trollhattan.
UNITED KINGDOM London and Scandinavian Metallurgical Co., 53°25' N. 01°20' w. Converter Aluminothermic 544
Ltd., Rotherham, South Yorkshire. Murex Ltd., Rainham, Essex 51°21' N. 00°36' E. ... do ...... ... do ...... 1,361
UNITED STATES Affiliated Metals and Minerals, Inc. , 41°00' N. 80°22' w. Converter Aluminothermic
New Castle, Pennsylvania. Reading Alloys Inc. , Robesonia, 40°22' N. 76°08' w. ... do ...... Thermit
Pennsylvania. Shieldalloy Metallurgical Corp., Cambridge, 40°02' N. 81°31' w. ... do ...... Aluminothermic Ohio.
Strategic Minerals Corp., Niagara Falls, 43°01' N. 79°08' w. ... do ...... . .. do ...... New York.
Teledyne Wah Chang Albany, Albany, 44°34' N. 123°00' w. Vanadium Oregon. metal.
41
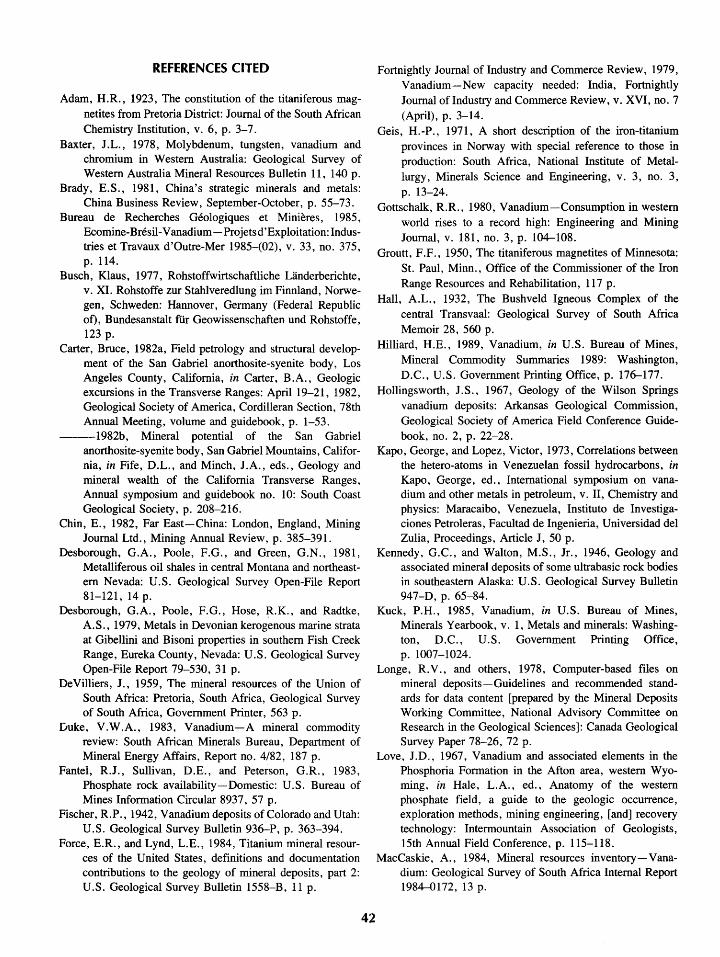
REFERENCES CITED
Adam, H.R., 1923, The constitution of the titaniferous magnetites from Pretoria District: Journal of the South African Chemistry Institution, v. 6, p. 3-7.
Baxter, J.L., 1978, Molybdenum, tungsten, vanadium and chromium in Western Australia: Geological Survey of Western Australia Mineral Resources Bulletin 11, 140 p.
Brady, E.S., 1981, China's strategic minerals and metals: China Business Review, September-October, p. 55-73.
Bureau de Recherches Geologiques et Minieres, 1985, Ecomine-Bresil-Vanadium-Pro jets d 'Exploitation: Industries et Travaux d'Outre-Mer 1985-(02), v. 33, no. 375, p. 114.
Busch, Klaus, 1977, Rohstoffwirtschaftliche Uinderberichte, v. XI. Rohstoffe zur Stahlveredlung im Finnland, Norwegen, Schweden: Hannover, Germany (Federal Republic of), Bundesanstalt fiir Geowissenschaften und Rohstoffe, 123 p.
Carter, Bruce, 1982a, Field petrology and structural development of the San Gabriel anorthosite-syenite body, Los Angeles County, California, in Carter, B.A., Geologic excursions in the Transverse Ranges: April 19-21, 1982, Geological Society of America, Cordilleran Section, 78th Annual Meeting, volume and guidebook, p. 1-53.
---1982b, Mineral potential of the San Gabriel anorthosite-syenite body, San Gabriel Mountains, California, in Fife, D.L., and Minch, J.A., eds., Geology and mineral wealth of the California Transverse Ranges, Annual symposium and guidebook no. 10: South Coast Geological Society, p. 208-216.
Chin, E., 1982, Far East-China: London, England, Mining Journal Ltd., Mining Annual Review, p. 385-391.
Desborough, G.A., Poole, F.G., and Green, G.N., 1981, Metalliferous oil shales in central Montana and northeastem Nevada: U.S. Geological Survey Open-File Report 81-121, 14 p.
Desborough, G.A., Poole, F.G., Hose, R.K., and Radtke, A.S., 1979, Metals in Devonian kerogenous marine strata at Gibellini and Bisoni properties in southern Fish Creek Range, Eureka County, Nevada: U.S. Geological Survey Open-File Report 79-530, 31 p.
DeVilliers, J., 1959, The mineral resources of the Union of South Africa: Pretoria, South Africa, Geological Survey of South Africa, Government Printer, 563 p.
Duke, V.W.A., 1983, Vanadium-A mineral commodity review: South African Minerals Bureau, Department of Mineral Energy Affairs, Report no. 4/82, 187 p.
Pantel, R.J., Sullivan, D.E., and Peterson, G.R., 1983, Phosphate rock availability-Domestic: U.S. Bureau of Mines Information Circular 8937, 57 p.
Fischer, R.P., 1942, Vanadium deposits of Colorado and Utah: U.S. Geological Survey Bulletin 936-P, p. 363-394.
Force, E.R., and Lynd, L.E., 1984, Titanium mineral resources of the United States, definitions and documentation contributions to the geology of mineral deposits, part 2: U.S. Geological Survey Bulletin 1558-B, 11 p.
42
Fortnightly Journal of Industry and Commerce Review, 1979, Vanadium-New capacity needed: India, Fortnightly Journal oflndustry and Commerce Review, v. XVI, no. 7 (April), p. 3-14.
Geis, H.-P., 1971, A short description of the iron-titanium provinces in Norway with special reference to those in production: South Africa, National Institute of Metallurgy, Minerals Science and Engineering, v. 3, no. 3, p. 13-24.
Gottschalk, R.R., 1980, Vanadium-Consumption in western world rises to a record high: Engineering and Mining Journal, v. 181, no. 3, p. 104-108.
Groutt, F.F., 1950, The titaniferous magnetites of Minnesota: St. Paul, Minn., Office of the Commissioner of the Iron Range Resources and Rehabilitation, 117 p.
Hall, A.L., 1932, The Bushveld Igneous Complex of the central Transvaal: Geological Survey of South Africa Memoir 28, 560 p.
Hilliard, H.E., 1989, Vanadium, in U.S. Bureau of Mines, Mineral Commodity Summaries 1989: Washington, D.C., U.S. Government Printing Office, p. 176-177.
Hollingsworth, J. S., 1967, Geology of the Wilson Springs vanadium deposits: Arkansas Geological Commission, Geological Society of America Field Conference Guidebook, no. 2, p. 22-28.
Kapo, George, and Lopez, Victor, 1973, Correlations between the hetero-atoms in Venezuelan fossil hydrocarbons, in Kapo, George, ed., International symposium on vanadium and other metals in petroleum, v. II, Chemistry and physics: Maracaibo, Venezuela, Instituto de Investigaciones Petroleras, Facultad de Ingenieria, Universidad del Zulia, Proceedings, Article J, 50 p.
Kennedy, G.C., and Walton, M.S., Jr., 1946, Geology and associated mineral deposits of some ultrabasic rock bodies in southeastern Alaska: U.S. Geological Survey Bulletin 947-D, p. 65-84.
Kuck, P.H., 1985, Vanadium, in U.S. Bureau of Mines, Minerals Yearbook, v. 1, Metals and minerals: Washington, D.C., U.S. Government Printing Office, p. 1007-1024.
Longe, R.V., and others, 1978, Computer-based files on mineral deposits-Guidelines and recommended standards for data content [prepared by the Mineral Deposits Working Committee, National Advisory Committee on Research in the Geological Sciences]: Canada Geological Survey Paper 78-26, 72 p.
Love, J.D. , 1967, Vanadium and associated elements in the Phosphoria Formation in the Afton area, western Wyoming, in Hale, L.A., ed., Anatomy of the western phosphate field, a guide to the geologic occurrence, exploration methods, mining engineering, [and] recovery technology: Intermountain Association of Geologists, 15th Annual Field Conference, p. 115-118.
MacCaskie, A., 1984, Mineral resources inventory- Vanadium: Geological Survey of South Africa Internal Report 1984-0172, 13 p.
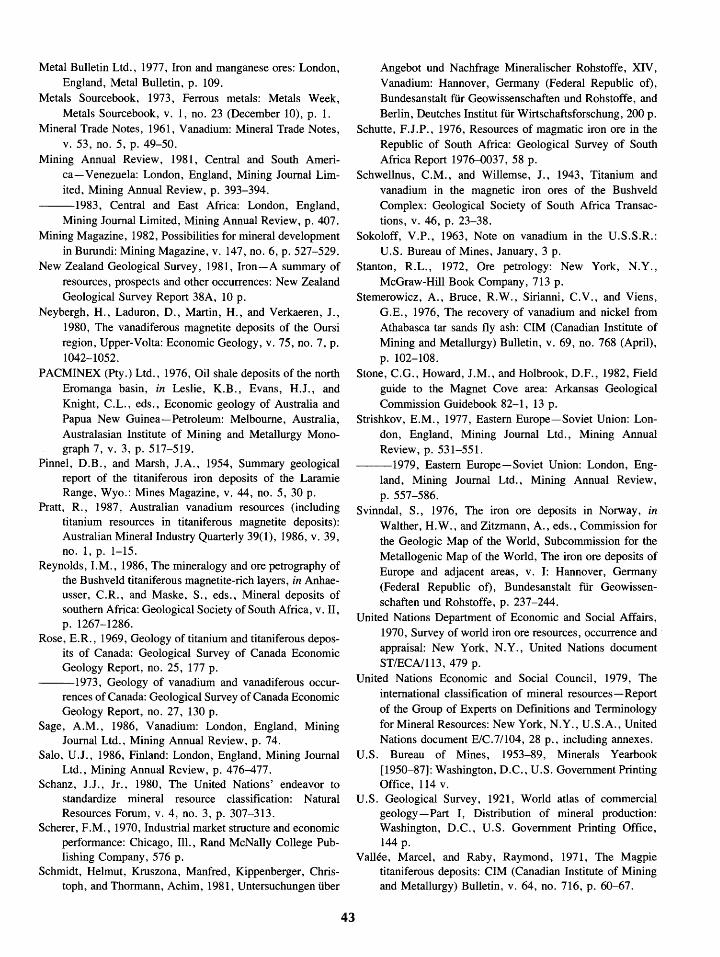
Metal Bulletin Ltd., 1977, Iron and manganese ores: London, England, Metal Bulletin, p. 109.
Metals Sourcebook, 1973, Ferrous metals: Metals Week, Metals Sourcebook, v. 1, no. 23 (December 10), p. 1.
Mineral Trade Notes, 1961, Vanadium: Mineral Trade Notes, v. 53, no. 5, p. 49-50.
Mining Annual Review, 1981, Central and South America-Venezuela: London, England, Mining Journal Limited, Mining Annual Review, p. 393-394.
---1983, Central and East Africa: London, England, Mining Journal Limited, Mining Annual Review, p. 407.
Mining Magazine, 1982, Possibilities for mineral development in Burundi: Mining Magazine, v. 147, no. 6, p. 527-529.
New Zealand Geological Survey, 1981, Iron-A summary of resources, prospects and other occurrences: New Zealand Geological Survey Report 38A, 10 p.
Neybergh, H., Laduron, D., Martin, H., and Verkaeren, J., 1980, The vanadiferous magnetite deposits of the Oursi region, Upper-Volta: Economic Geology, v. 75, no. 7, p. 1042-1052.
PACMINEX (Pty.) Ltd., 1976, Oil shale deposits of the north Eromanga basin, in Leslie, K.B., Evans, H.J., and Knight, C.L., eds., Economic geology of Australia and Papua New Guinea-Petroleum: Melbourne, Australia, Australasian Institute of Mining and Metallurgy Monograph 7, v. 3, p. 517-519.
Pinnel, D.B., and Marsh, J.A., 1954, Summary geological report of the titaniferous iron deposits of the Laramie Range, Wyo.: Mines Magazine, v. 44, no. 5, 30 p.
Pratt, R., 1987, Australian vanadium resources (including titanium resources in titaniferous magnetite deposits): Australian Mineral Industry Quarterly 39(1), 1986, v. 39, no. 1, p. l-15.
Reynolds, I.M., 1986, The mineralogy and ore petrography of the Bushveld titaniferous magnetite-rich layers, in Anhaeusser, C.R., and Maske, S., eds., Mineral deposits of southern Africa: Geological Society of South Africa, v. II, p. 1267-1286.
Rose, E.R., 1969, Geology of titanium and titaniferous deposits of Canada: Geological Survey of Canada Economic Geology Report, no. 25, 177 p.
---1973, Geology of vanadium and vanadiferous occurrences of Canada: Geological Survey of Canada Economic Geology Report, no. 27, 130 p.
Sage, A.M., 1986, Vanadium: London, England, Mining Journal Ltd., Mining Annual Review, p. 74.
Salo, U.J., 1986, Finland: London, England, Mining Journal Ltd., Mining Annual Review, p. 47~77.
Schanz, J.J., Jr., 1980, The United Nations' endeavor to standardize mineral resource classification: Natural Resources Forum, v. 4, no. 3, p. 307-313.
Scherer, F. M. , 1970, Industrial market structure and economic performance: Chicago, Ill., Rand McNally College Publishing Company, 576 p.
Schmidt, Helmut, Kruszona, Manfred, Kippenberger, Christoph, and Thormann, Achim, 1981, Untersuchungen tiber
43
Angebot und Nachfrage Mineralischer Rohstoffe, XIV, Vanadium: Hannover, Germany (Federal Republic of), Bundesanstalt fur Geowissenschaften und Rohstoffe, and Berlin, Deutches Institut ftir Wirtschaftsforschung, 200 p.
Schutte, F.J.P., 1976, Resources of magmatic iron ore in the Republic of South Africa: Geological Survey of South Africa Report 1976-0037, 58 p.
Schwellnus, C.M., and Willemse, J., 1943, Titanium and vanadium in the magnetic iron ores of the Bushveld Complex: Geological Society of South Africa Transactions, v. 46, p. 23-38.
Sokoloff, V.P., 1963, Note on vanadium in the U.S.S.R.: U.S. Bureau of Mines, January, 3 p.
Stanton, R.L., 1972, Ore petrology: New York, N.Y., McGraw-Hill Book Company, 713 p.
Stemerowicz, A., Bruce, R.W., Sirianni, C.V., and Viens, G.E., 1976, The recovery of vanadium and nickel from Athabasca tar sands fly ash: CIM (Canadian Institute of Mining and Metallurgy) Bulletin, v. 69, no. 768 (April), p. 102-108.
Stone, C.G., Howard, J.M., and Holbrook, D.F., 1982, Field guide to the Magnet Cove area: Arkansas Geological Commission Guidebook 82-1, 13 p.
Strishkov, E.M., 1977, Eastern Europe-Soviet Union: London, England, Mining Journal Ltd., Mining Annual Review, p. 531-551.
---1979, Eastern Europe-Soviet Union: London, England, Mining Journal Ltd., Mining Annual Review, p. 557-586.
Svinndal, S., 1976, The iron ore deposits in Norway, in Walther, H.W., and Zitzmann, A., eds., Commission for the Geologic Map of the World, Subcommission for the Metallogenic Map of the World, The iron ore deposits of Europe and adjacent areas, v. 1: Hannover, Germany (Federal Republic of), Bundesanstalt ftir Geowissenschaften und Rohstoffe, p. 237-244.
United Nations Department of Economic and Social Affairs, 1970, Survey of world iron ore resources, occurrence and appraisal: New York, N.Y., United Nations document ST/ECA/113, 479 p.
United Nations Economic and Social Council, 1979, The international classification of mineral resources-Report of the Group of Experts on Definitions and Terminology for Mineral Resources: New York, N.Y., U.S.A., United Nations document E/C.7/104, 28 p., including annexes.
U.S. Bureau of Mines, 1953-89, Minerals Yearbook [1950-87]: Washington, D.C., U.S. Government Printing Office, 114 v.
U.S. Geological Survey, 1921, World atlas of commercial geology-Part I, Distribution of mineral production: Washington, D.C., U.S. Government Printing Office, 144 p.
Vallee, Marcel, and Raby, Raymond, 1971, The Magpie titaniferous deposits: CIM (Canadian Institute of Mining and Metallurgy) Bulletin, v. 64, no. 716, p. 60-67.
Vasudev, V .N., and Srinivasan, R., 1979, Vanadium bearing titaniferous magnetite deposits of Karnataka, India: Journal of the Geological Society of India, v. 20, no. 4, p. 170-178.
von Gruenewaldt, Gerhard, 1977, The mineral resources of the Bushveld Complex: South Africa, National Institute of Metallurgy, Minerals Science and Engineering, v. 9, no. 2, p. 83-95.
Wang, K.P., 1980, Far East-China: London, England, Mining Journal Ltd., Mining Annual Review, p. 435-456.
Ward, H.J., 1975, Barrambie iron-titanium-vanadium deposit, in Knight, C.L., ed., Economic geology of Australia and Papua New Guinea, v. 1, Metals: Australasian Institute of Mining and Metallurgy, Monograph 5, p. 207-211.
Western Mining Corporation Holdings Limited, 1978, Yeelirrie uranium project-W.A.: Western Mining Corporation Holdings Limited, Draft environmental impact statement and environmental review and management programme.
Willemse, J. , 1969, The vanadiferous magnetic iron ore of the Bush veld Igneous Complex: Economic Geology, Monograph 4, p. 187-208.
Williams, G.J., 1965, Iron- and titanium-bearing minerals: in Williams, G.J., ed., Eighth Commonwealth Mining and Metallurgical Congress, Australia and New Zealand, v. 4, Economic Geology of New Zealand: Melbourne, Australia, Australasian Institute of Mining and Metallurgy, p. 127-142.
Wood, H.B., 1968, Geology and exploitation of uranium deposits in the Lisbon Valley area, Utah, in Ridge, J.D., ed., Ore deposits of the United States, 1933-1967 (Graton-Sales volume): New York, N.Y., American Institute of Mining, Metallurgical, and Petroleum Engineers, V. 1, p. 770-789.
World Bank, 1986, World development report 1986: New York, N.Y., Oxford University Press, 256 p.
World Mining, 1980, Panzhihua: World Mining, v. 33, no. 7, p. 52-53.
Zitzmann, A., 1976, The iron ore deposits of the western U.S.S.R., in Walther, H.W., and Zitzmann, A., eds., Commission for the Geologic Map of the World, Subcommission for the Metallogenic Map of the World, The iron ore deposits of Europe and adjacent areas, v. 1: Hannover, Germany (Federal Republic of), Bundesanstalt fUr Geowissenschaften und Rohstoffe, p. 325-391.
ADDITIONAL REFERENCES ON VANADIUM RESOURCES
Allard, G.O., 1976, Dorc~ Lake Complex and its importance to Chibougamau geology and metallogeny: Quebec, Quebec, Canada, Ministere des Richesses Naturelles [du Quebec], DP 368, 446 p.
Bookstrom, A.A., 1977, The magnetite deposits of El Romeral: Economic Geology, v. 72, no. 6, p. 1101-1130.
44
Brooks, P.T., and Potter, G.M., 1974, Recovering vanadium from dolomitic Nevada shale: U.S. Bureau of Mines Report of Investigations, no. 7932, 20 p.
Busch, P.M., 1961, Vanadium-A materials survey: U.S. Bureau of Mines Information Circular 8060, 95 p.
Camp, F.W., 1974, The tar sands of Alberta, Canada, 2d ed.: Denver, Colo., Cameron Engineers Incorporated, 77 p.
Carter, Bruce, and Silver, L.T., 1982, Geology of the San Gabriel anorthosite-syenite body, Los Angeles County, California. Geology and mineral wealth of the California Traverse Ranges: South Coast Geological Society, p. 294-296.
Cathcart, J.B., Sheldon, R.P., and Gulbrandsen, R.A., 1984, Phosphate-rock resources of the United States: U.S. Geological Survey Circular 888, 48 p.
Colorado Metal Mining Fund Board, 1961, Colorado vanadium-A composite study: Denver, Colo., Colorado Metal Mining Fund Board, 155 p.
Daniels, J.L., 1974, The geology of the Blackstone region, Western Australia: Geological Survey of Western Australia Bulletin 123, 257 p.
Des borough, G. A. , 1977, Preliminary report on certain metals of potential economic interest in the vanadium-rich zones in the Meade Peak Member of the Phosphoria Formation in western Wyoming and eastern Idaho: U.S. Geological Survey Open-File Report 77-341, 27 p.
De Witt, M. J. , 1985, Minerals and mining in AntarcticaScience and technology, economics and politics: Oxford, England, Clarendon Press, 127 p.
Dow, V.J., 1961, Magnetite and ilmenite resources, Iron Mountain area, Albany County, Wyoming: U.S. Bureau of Mines Information Circular 8037, p. 1-15.
Energy, Mines and Resources Canada, 1981, Vanadium-An imported mineral commodity: Department of Energy, Mines and Resources Canada, Mineral Bulletin MR 188, 37 p.
Fischer, R.P., 1968, The uranium and vanadium deposits of the Colorado Plateau region, in Ridge, J.D., ed., Ore deposits of the United States, 1933-1967 (Graton-Sales volume): New York, N.Y., American Institute of Mining, Metallurgical, and Petroleum Engineers, v. 1, p. 735-745.
---1973, Vanadium, in Brobst, D.A., and Pratt, W.P., eds., United States Mineral Resources: U.S. Geological Survey Professional Paper 820, p. 679-688.
---1975, Vanadium resources in titaniferous magnetite deposits: U.S. Geological Survey Professional Paper 926-B, 10 p.
Fischer, R.P., Haff, J.C., and Rominger, J.F., 1947, Vanadium deposits near Placerville, San Miguel County, Colorado: Colorado Scientific Society Proceedings, v. 15, no. 3, p. 115-134.
Huber, G.C., 1980, Stratigraphy and uranium deposits, Lisbon Valley district, San Juan County, Utah: Quarterly of the Colorado School of Mines, v. 75, no. 2, 45 p.
Jones, W.R., 1965, Vanadium deposits of Western Australia, in McAndrew, John, ed., Eighth Commonwealth Mining
and Metallurgical Congress, Australia and New Zealand, v. 1, Geology of Australian ore deposits: Melbourne, Australia, Australasian Institute of Mining and Metallurgy, p. 154-155.
Kapo, George, 1978, Vanadium-Key to Venezuelan fossil hydrocarbons, in Chilingarian, G.V., and Yen, T.F., eds. , Developments in petroleum science, v. 7, Bitumens, asphalts and tar sands: Amsterdam, Netherlands, Elsevier Scientific Publishing Company, p. 213-241.
Nichols, N. M. , 1982, Mineral potential, Gill brand mining operations, San Gabriel anorthosite complex, Los Angeles County, California: Geology and mineral wealth of the California Traverse Ranges: South Coast Geological Society, p. 431-438.
Oakshott, G.B., 1948, Titaniferous iron ore deposits of the western San Gabriel Mountains, Los Angeles County: California Division of Mines Bulletin 129, p. 245-266.
Pratt, R., 1982, Vanadium: [Australia] Bureau of Mineral Resources, Geology and Geophysics, Australian Mineral Industry Annual Review, 1980, p. 289-290.
45
---1984, Vanadium: [Australia] Bureau of Mineral Resources, Geology and Geophysics, Australian Mineral Industry Annual Review, 1981, p. 272-273.
Reed, D.F., 1949, Investigation of Christy titanium deposit, Hot Spring County, Arkansas: U.S. Bureau of Mines Report of Investigations 4592, 10 p.
Serjeantson, R., ed., 1988, Ferro-alloy directory and databook, 2d ed.: Worcester Park, Surrey, England, Metal Bulletin Books Ltd., 404 p.
Sharma, K.N.M., and Franconi, A., 1975, Magpie, SaintJean, Romaine Rivers area: Quebec, Quebec, Canada, Ministere des Richesses Naturelles du Quebec, Geological Report 163, 73 p.
Shimkin, D.B., 1953, Minerals-A key to Soviet Power: Cambridge, Mass., Harvard University Press, 452 p.
Thakur, R.S., and Sant, B.R., 1976, Vanadium in India: Metals and Minerals Review, v. XV, no. 12, p. 8-10.
Young, R.G., 1964, Distribution of uranium deposits in the White Canyon-Monument Valley district, Utah-Arizona: Economic Geology, v. 59, no. 5, p. 850-873.

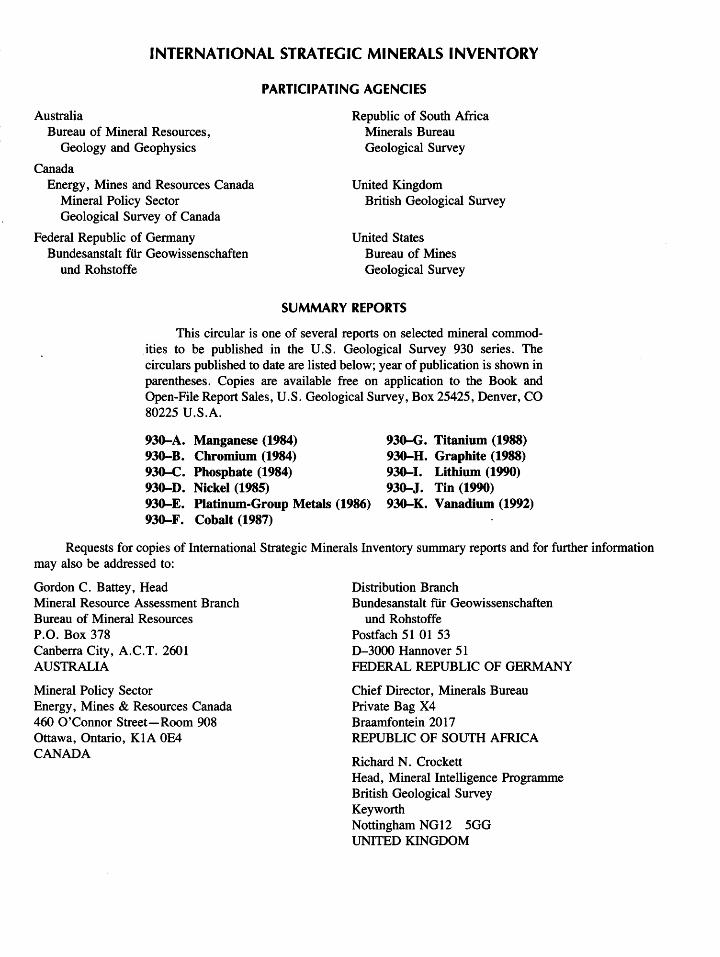
INTERNATIONAL STRATEGIC MINERALS INVENTORY
PARTICIPATING AGENCIES
Australia Bureau of Mineral Resources,
Geology and Geophysics
Canada Energy, Mines and Resources Canada
Mineral Policy Sector Geological Survey of Canada
Federal Republic of Germany Bundesanstalt filr Geowissenschaften
und Rohstoffe
Republic of South Africa Minerals Bureau Geological Survey
United Kingdom British Geological Survey
United States Bureau of Mines Geological Survey
SUMMARY REPORTS
This circular is one of several reports on selected mineral commod.ities to be published in the U.S. Geological Survey 930 series. The circulars published to date are listed below; year of publication is shown in parentheses. Copies are available free on application to the Book and Open-File Report Sales, U.S. Geological Survey, Box 25425, Denver, CO 80225 U.S.A.
930-A. Manganese (1984) 930-B. Chromium (1984) 930-C. Phosphate (1984) 930-D. Nickel (1985) 930-E. Platinum-Group Metals (1986) 930-F. Cobalt (1987)
930-G. Titanium (1988) 930-H. Graphite (1988) 930-1. Lithium (1990) 930-J. Tin (1990) 930-K. Vanadium (1992)
Requests for copies of International Strategic Minerals Inventory summary reports and for further information may also be addressed to:
Gordon C. Battey, Head Mineral Resource Assessment Branch Bureau of Mineral Resources P.O. Box 378 Canberra City, A.C.T. 2601 AUSTRALIA
Mineral Policy Sector Energy, Mines & Resources Canada 460 O'Connor Street-Room 908 Ottawa, Ontario, KIA OE4 CANADA
Distribution Branch Bundesanstalt filr Geowissenschaften
und Rohstoffe Postfach 51 01 53 D-3000 Hannover 51 FEDERAL REPUBLIC OF GERMANY
Chief Director, Minerals Bureau Private Bag X4 Braamfontein 2017 REPUBLIC OF SOUTH AFRICA
Richard N. Crockett Head, Mineral Intelligence Programme British Geological Survey Keyworth Nottingham NG12 5GG UNITED KINGDOM
c c 2 c:: ~
O'C
e ~ c : § u I
r c (
... r
~ r (..
c ( c c
01 ( E
. (
.....