Stormwater Features Inventory Database: Standard Operating ...

International Stormwater Best Management Practices (BMP) Database
Pollutant Category Summary: Nutrients
Prepared by
Geosyntec Consultants, Inc. Wright Water Engineers, Inc.
Under Support From
Water Environment Research Foundation Federal Highway Administration
Environment and Water Resources Institute of the American Society of Civil Engineers
December 2010

International Stormwater BMP Database
Pollutant Category Summary: Nutrients Page ii December 2010
Disclaimer The BMP Database (“Database”) was developed as an account of work sponsored by the Water Environment Research Foundation (WERF), the American Society of Civil Engineers (ASCE)/Environmental and Water Resources Institute (EWRI), the American Public Works Association (APWA), the Federal Highway Administration (FHWA), and U.S. Environmental Protection Agency (USEPA) (collectively, the “Sponsors”). The Database is intended to provide a consistent and scientifically defensible set of data on Best Management Practice (“BMP”) designs and related performance. Although the individuals who completed the work on behalf of the Sponsors (“Project Team”) made an extensive effort to assess the quality of the data entered for consistency and accuracy, the Database information and/or any analysis results are provided on an “AS-IS” basis and use of the Database, the data information, or any apparatus, method, or process disclosed in the Database is at the user’s sole risk. The Sponsors and the Project Team disclaim all warranties and/or conditions of any kind, express or implied, including, but not limited to any warranties or conditions of title, non-infringement of a third party’s intellectual property, merchantability, satisfactory quality, or fitness for a particular purpose. The Project Team does not warrant that the functions contained in the Database will meet the user’s requirements or that the operation of the Database will be uninterrupted or error free, or that any defects in the Database will be corrected.
UNDER NO CIRCUMSTANCES, INCLUDING CLAIMS OF NEGLIGENCE, SHALL THE SPONSORS OR THE PROJECT TEAM MEMBERS BE LIABLE FOR ANY DIRECT, INDIRECT, INCIDENTAL, SPECIAL, OR CONSEQUENTIAL DAMAGES INCLUDING LOST REVENUE, PROFIT OR DATA, WHETHER IN AN ACTION IN CONTRACT OR TORT ARISING OUT OF OR RELATING TO THE USE OF OR INABILITY TO USE THE DATABASE, EVEN IF THE SPONSORS OR THE PROJECT TEAM HAVE BEEN ADVISED OF THE POSSIBILITY OF SUCH DAMAGES.
The Project Team’s tasks have not included, and will not include in the future, recommendations of one BMP type over another. However, the Project Team's tasks have included reporting on the performance characteristics of BMPs based upon the entered data and information in the Database, including peer reviewed performance assessment techniques. Use of this information by the public or private sector is beyond the Project Team’s influence or control. The intended purpose of the Database is to provide a data exchange tool that permits characterization of BMPs solely upon their measured performance using consistent protocols for measurements and reporting information.
The Project Team does not endorse any BMP over another and any assessments of performance by others should not be interpreted or reported as the recommendations of the Project Team or the Sponsors.

International Stormwater BMP Database
Pollutant Category Summary: Nutrients Page iii December 2010
Acknowledgements
Report Preparation1
Primary Authors:
Marc Leisenring, P.E., Geosyntec Consultants, Inc. Jane Clary, Wright Water Engineers, Inc. Julie Stephenson, Geosyntec Consultants, Inc. Paul Hobson, EIT, Geosyntec Consultants, Inc.
Reviewers:
Andrew Earles, P.E. Ph.D., D.WRE, Wright Water Engineers, Inc. Marcus Quigley, P.E., D.WRE, Geosyntec Consultants, Inc. Brandon Steets, P.E., Geosyntec Consultants, Inc. Eric Strecker, P.E. Geosyntec Consultants, Inc.
Project Information WERF Project Director: Jeff Moeller, P.E., Water Environment Research Foundation
Principal Investigators: Jonathan Jones, P.E, Wright Water Engineers, Inc. Eric Strecker, P.E., Geosyntec Consultants, Inc. Project Managers/Contacts for More information: Jane Clary, Project Manager, Wright Water Engineers, Inc. Marcus Quigley, P.E., Project Manager, Geosyntec Consultants, Inc. Project Steering Committee: Patricia A. Cazenas, Office of Project Development and Environmental Review, Federal Highway Administration (FHWA) Brian Parsons, P.E., Environmental and Water Resources Institute of American Society of Civil Engineers (EWRI-ASCE) Eric Strassler, Office of Water/Office of Science & Technology, U.S. Environmental Protection Agency (USEPA) Project Subcommittee: Michael E. Barrett, Ph.D., P.E., Center for Research in Water Resources, University of Texas Bob Carr, P.E., Water Resources Modeling, American Public Works Association (APWA) David R. Graves, Environmental Science Bureau, New York State Dept. of Transportation Gregory E. Granato, U.S. Geological Survey (USGS) Jesse Pritts, P.E., Engineering and Analysis Division Office of Water/Office of Science & Technology, USEPA
1 Contact Jane Clary ([email protected]) or Marc Leisenring ([email protected]) with questions regarding this summary.
International Stormwater BMP Database
Pollutant Category Summary: Nutrients Page iv December 2010
Table of Contents 1 INTRODUCTION .......................................................................................................... 1
1.1 REGULATORY CONTEXT .................................................................................................. 2 1.2 TYPICAL SOURCES OF NUTRIENTS .................................................................................. 3
2 PHOSPHORUS ............................................................................................................. 4
2.1 DOMINANT FORMS AND TYPICAL STORMWATER CONCENTRATIONS .......................... 4 2.2 SUMMARY OF TRANSPORT PROCESSES AND REMOVAL MECHANISMS ........................ 6 2.3 FACTORS INFLUENCING POLLUTANT REMOVAL ............................................................. 6
2.3.1 Particulate Association ............................................................................................... 6 2.3.2 pH and Oxidation Reduction Potential........................................................................ 8 2.3.3 Cation Exchange Coefficient/P-Index .......................................................................... 8 2.3.4 Temperature ............................................................................................................... 8
2.4 BMP DESIGN CONSIDERATIONS...................................................................................... 9
3 NITROGEN .................................................................................................................. 9
3.1 DOMINANT FORMS AND TYPICAL STORMWATER CONCENTRATIONS .......................... 9 3.2 SUMMARY OF TRANSPORT PROCESSES AND REMOVAL MECHANISMS ...................... 11 3.3 FACTORS INFLUENCING POLLUTANT REMOVAL ........................................................... 11
3.3.1 Temperature ............................................................................................................. 11 3.3.2 pH .............................................................................................................................. 12 3.3.3 Bacterial Community ................................................................................................. 12 3.3.4 Dissolved Oxygen ...................................................................................................... 13
3.4 BMP DESIGN CONSIDERATIONS.................................................................................... 13
4 GENERAL BMP PERFORMANCE DATA CHARACTERISTICS AND AVAILABILITY ............. 14
4.1 INVENTORY OF AVAILABLE DATA IN DATABASE ........................................................... 14 4.2 CATEGORY-LEVEL BMP ANALYSIS FOR NUTRIENTS ...................................................... 18
4.2.1 Phosphorus ................................................................................................................ 20 4.2.2 Nitrogen .................................................................................................................... 25 4.2.3 Organic Carbon ......................................................................................................... 29
5 CONCLUSIONS AND RECOMMENDATIONS ................................................................ 32
5.1 RECOMMENDATIONS FOR BMP SELECTION AND DESIGN ........................................... 32 5.2 RECOMMENDATIONS FOR APPROPRIATE USES OF DATA ............................................ 33 5.3 ADDITIONAL RESEARCH ................................................................................................ 33
6 ATTACHMENTS ......................................................................................................... 34
7 REFERENCES ............................................................................................................. 34

Pollutant Category Summary: Nutrients Page 1 December 2010
Basic Terminology (Adapted from USEPA 1999)
Nutrients: Primary elements necessary for the growth of living organisms.
Total Phosphorus: The total amount of phosphorus, including both organic and inorganic forms.
Particulate Phosphorus: That portion of total phosphorus that does not pass through a 0.45 micron membrane filter.
Dissolved Phosphorus: That portion of total phosphorus that passes through a 0.45 micron membrane filter.
Organophosphates: Phosphorus in a form that is bound to an organic compound.
Soluble Reactive Phosphorus (SRP): Phosphorus in a form that is most readily available to plants. It consists of the species H2PO4 1–, HPO4 2–, and PO4 3–.
Total Nitrogen: The total amount of nitrogen in a sample, including organic nitrogen, nitrate (NO3
-), nitrite (NO2-),
and ammonia (NH4+).
Total Kjeldahl Nitrogen: The total of organic and ammonia nitrogen in a sample determined by the Kjeldahl method.
Nitrate (NO3-) and Nitrite (NO2):
Oxidized inorganic nitrogen species. Nitrate is the form of nitrogen preferred by aquatic plants.
Ammonia (NH4+, NH3): Inorganic form
of nitrogen; product of hydrolysis of organic nitrogen and denitrification. Ammonia is preferentially used by phytoplankton over nitrate for uptake of inorganic nitrogen.
POLLUTANT CATEGORY SUMMARY: NUTRIENTS
1 INTRODUCTION As of 2010, over 14,000 water bodies across the country were listed as impaired for nutrients, organic enrichment, algal growth, and/or ammonia. While phosphorus and nitrogen compounds have only been found to be the direct cause of about 4,000 of these impairments, they likely play a major role in most of the other unspecified nutrient and eutrophication-related impairments.
This technical summary has been developed to assist federal, state and local governments, watershed organizations, environmental groups and other interested parties in selecting, designing and developing reasonable performance expectations for stormwater best management practices (BMPs) with regard to nutrients.
Although numeric effluent limits for municipal stormwater discharges are not typically required in most communities, the implementation phase of Total Maximum Daily Loads (TMDLs) may result in National Pollutant Discharge Elimination System (NPDES) stormwater discharge permit requirements to address nutrients and related impairments. Such requirements are typically based on BMPs (i.e., “technology-based”); therefore, it is important to have a good understanding of sources of nutrients, treatment processes expected to be effective in reducing nitrogen and phosphorus and the performance of BMPs. This technical summary addresses these topics:
Regulatory context for nutrients in receiving waters Sources of nitrogen and phosphorus Fate and transport processes, removal mechanisms
and associated BMP design considerations for nitrogen and phosphorus
Overview and analysis of nitrogen, phosphorus and organic carbon data included in the International Stormwater BMP Database (BMP Database)
Conclusions and recommendations

International Stormwater BMP Database
Pollutant Category Summary: Nutrients Page 2 December 2010
1.1 Regulatory Context
Under the Clean Water Act (CWA) Section 401(a)(1), the U.S. Environmental Protection Agency (EPA) is required to develop criteria for water quality based on the latest scientific knowledge. Criteria are developed by EPA pursuant to CWA Section 304 requirements; however, these are not laws or regulations, but rather represent scientific assessments for ecological and human health effects that EPA recommends to States and authorized Tribes for establishing water quality standards. Under Section 303(c) of the CWA, States and authorized Tribes have the primary responsibility for adopting water quality standards as laws or regulation. These standards must define the level of a pollutant necessary to protect designated uses in ambient waters. This discussion focuses on the newly developing and more stringent biostimulatory, or nutrient enrichment-based, nutrient standards as opposed to the older and more established aquatic toxicity (e.g., for ammonia) or drinking water (e.g., for nitrate) standards. Historically, narrative biostimulatory standards have been provided as guidance to States and Tribes in developing water quality standards related to nutrients (e.g., “in no case shall nutrient concentrations be altered so as to cause an imbalance in natural populations of flora or fauna”). National Water Quality Inventories have repeatedly shown that nutrients are a major cause of ambient water quality use impairments contributing to roughly 25-50% of impairments nationally (EPA, 2002). In recognition of the widespread nutrient impairments and the detrimental impacts of excessive levels of nutrients, EPA has begun the process of developing recommendations for nutrients to assist States and Tribes in establishing numeric nutrient criteria to protect uses when adopting water quality standards. In June 1998, EPA published the National Strategy for Development of Regional Nutrient Criteria, describing the approach that EPA will follow in developing nutrient information and working with States and Tribes to adopt nutrient criteria as part of State water quality standards. The National Strategy for Development of Regional Nutrient Criteria (EPA, 1998) describes a geographic- and waterbody-specific approach to developing numeric nutrient criteria to account for natural variability due to differences in geology, climate and waterbody type. Ecological regions, or ecoregions, were delineated for the purposes of criteria development to group areas of similar climate, hydrology, geology, physiology, soils, land use, vegetation, and wildlife. Since 1998, EPA has published technical guidance for developing criteria for three different waterbody types, including lakes and reservoirs, rivers and streams, and estuaries and coastal waters. EPA also plans to develop guidance for developing criteria for wetlands. EPA is currently encouraging all States, Territories and authorized Tribes to accelerate efforts related to the development of water quality standards for nutrients. EPA guidance to States recommends that water quality standards address causal (both nitrogen and phosphorus) and response (chlorophyll-a and clarity) variables for all waters because of the interrelationships between these parameters. States, Territories and authorized Tribes have the flexibility to address nutrient pollution using a subset of these parameters or other alternatives if they are shown to be scientifically defensible and protective of designated uses. Currently, most states are in the process of developing numeric nutrient water quality standards based on recent guidance provided by the EPA. It is expected that these new ecoregion-based standards will be adopted by

International Stormwater BMP Database
Pollutant Category Summary: Nutrients Page 3 December 2010
States soon, and that some of the total phosphorus and nitrogen values may be below concentrations typically measured in urban stormwater runoff. The water quality standards developed by States serve as the basis for a biennial assessment of water body use attainment. As a result of biennial assessments, States develop “303(d)” lists of waters not attaining water quality standards. States are then required to initiate the TMDL process to address these impairments. The TMDL process typically involves the assignment of pollutant load allocations to various watershed sources, including wasteload allocations (WLAs) for point sources and load allocations (LAs) for non-point sources. These WLAs and LAs may then be incorporated into NPDES permits as numeric water quality-based effluent limits or technology-based requirements, making permittees legally responsible for TMDL compliance. For this reason, TMDLs currently serve as the most direct regulatory driver for NPDES stormwater permittees to design and implement source control and stormwater treatment BMPs.
1.2 Typical Sources of Nutrients
Like bacteria, metals, sediment and other water quality constituents, nutrients occur naturally in the environment and are necessary for the health of aquatic systems. If available in insufficient amounts, the growth of primary producers may be limited, which impacts the health of life on other trophic levels. Excessive nutrients, however, can result in the accelerated growth of macrophytes and phytoplankton and potentially harmful algal blooms which lead to declines in oxygen, aquatic species imbalances, public health threats, and general declines in aquatic resource value. Investigations have shown that the key causative factors are excessive concentrations of the primary nutrients phosphorus and nitrogen, which are the focus of subsequent sections of this technical summary.
While nutrients occur naturally in the environment, human activities are a common cause of excessive nutrient loading to waterbodies. Human activities associated with nutrient over-enrichment in waterbodies include agricultural and urban/residential fertilization, treated sewage effluent, detergents, septic systems, combined sewer overflows, sediment mobilization, and animal waste. Human activities can also affect natural processes such as atmospheric deposition (e.g., fuel combustion resulting in NOx emissions), internal nutrient recycling from sediment, and stream channel erosion.
Nutrient loading to receiving waters as a result of the above activities varies for each primary nutrient because of the unique chemical characteristics of each. Phosphorus, because of its tendency to sorb to soil particles and organic matter, is primarily transported in surface runoff with eroded sediments. Inorganic phosphate and organophosphate components of total phosphorus are typically derived from soil, plant, and animal materials associated with undisturbed and agricultural land uses – primarily due to the use of fertilizers and manures, and to a lesser extent the use of phosphorus-containing pesticides on agricultural lands. In urban and suburban rainfall-runoff, phosphorus sources include fertilizer use, detergents, flame-retardants in many applications (including lubricants), corrosion inhibitors, and plasticizers. In areas with high phosphorus content in soils, deposition of sediment due to construction or other land disturbance activities can also represent a significant source. Phosphorus can also be associated with fine-grained particulate matter found in the atmosphere which can enter natural waters through both dry fallout and rainfall.

International Stormwater BMP Database
Pollutant Category Summary: Nutrients Page 4 December 2010
Nitrogen, on the other hand, does not sorb as strongly to soil particles and is transported in surface runoff in both particulate and dissolved phases. Dissolved inorganic nitrogen can be transported to surface waters through the unsaturated zone and groundwater. Because nitrogen species may occur as a gaseous phase in the environment, it can be transported to surface water via atmospheric deposition as well. Both phosphorus and nitrogen are also present in treated wastewater discharged to surface water bodies.
While nutrients can be found in the environment from a variety of point and non-point sources, the objective of this technical summary is to provide guidance on the selection and design of stormwater BMPs for nutrient removal. The remainder of this technical summary focuses primarily on phosphorus and nitrogen in stormwater. Some limited discussion of organic carbon is also provided.
2 PHOSPHORUS
2.1 Dominant Forms and Typical Stormwater Concentrations
Phosphorus occurs in natural waters almost solely as phosphates. These are classified as orthophosphates (yzPO4
-x), condensed phosphates (pyro-, meta-, and other polyphosphates), and organically-bound phosphates. Orthophosphates exist in solution, bound to particles or detritus, or in the bodies of aquatic organisms. In rainfall-runoff, the predominant (> 30%) phosphate forms are HPO4
-2 and H2PO4-1 and to a lesser degree (10%) MgHPO4(aq) and CaHPO4(aq)
(WERF, 2005; directly quoted). In laboratory analysis, total phosphorus is usually first separated into dissolved and particulate portions. The dissolved portion is then typically divided into soluble reactive phosphorus (SRP) and soluble unreactive phosphorus (SUP). SRP is primarily composed of inorganic orthophosphates and is readily available for plants, algae, and microorganisms. SUP is primarily composed of polyphosphates and various organic compounds. Particulate phosphorus is primarily composed of bacteria, algae, detritus, zooplankton, and inorganic particulates such as silt and clay. Organic particulate phosphorus in water can be broken down and eventually converted to orthophosphates by bacteria (Tchobanoglous and Schroeder, 1985). Figure 1 illustrates the analytical procedure for differentiating between the various forms of phosphorus commonly analyzed using EPA methods.

International Stormwater BMP Database
Pollutant Category Summary: Nutrients Page 5 December 2010
Figure 1. Analytical Procedure for the Differentiation of Phosphorus Forms.
Source: USEPA (1993). Because phosphorus is typically the limiting nutrient in most freshwater systems, stormwater discharge of phosphorus, especially SRP, has the potential to cause significant water quality impairment to receiving waters. While phosphorus is an essential nutrient for all life forms, increased amounts of bioavailable phosphorus in surface waters can stimulate excessive algae growth and result in associated water quality problems such as decreased water clarity, disagreeable odors, habitat loss, and fish kills (WERF, 2005). Excess phosphorus concentrations have also recently been implicated with the regrowth of fecal indicator bacteria in urban flood control channels in Southern California (Surbeck et al., 2010). Most dissolved phosphorus is fairly readily bioavailable. Among particulate-bound forms of phosphorus, some are more readily converted to bioavailable forms than others. Generally, as complexity (molecular weight) of forms increases, phosphorus species become less readily bio-available (WERF, 2005).

International Stormwater BMP Database
Pollutant Category Summary: Nutrients Page 6 December 2010
2.2 Summary of Transport Processes and Removal Mechanisms2
Treatability for phosphorus is a function of partitioning (particulate vs. dissolved). If dissolved, treatability is a function of concentration and speciation. If particulate-bound, treatability is a function the association of phosphorus to particles across the particle size and density distribution. Phosphorus can readily undergo surface complexation reactions, be adsorbed or precipitated. Media or soils containing iron, aluminum, calcium, or hydrated Portland cement can be very effective at removing phosphorus species from solution through surface complexation or precipitation. However, complexation or partitioning to engineered media or particulate matter can be reversible; and particulate-bound phosphorus can be a chronic threat, especially in a cyclic redox environment (WERF, 2005). In other words, phosphorus release from sediment or organic matter is a major concern with respect to long-term phosphorus removal. Thus, routine maintenance of BMPs to remove sequestered forms of phosphorus before they become bioavailable again is a critical factor in effective phosphorus removal.
Table 1 provides a summary of the primary transformation and removal mechanisms of major phosphorus species along with the factors that may affect those mechanisms. Table 1: Summary of Phosphorus Transformations, Removal Mechanisms, and Important Factors.
Species Transformation and
Removal Mechanisms Important Factors Particulate Phosphorus Physical separation (inert
filtration and sedimentation) Partitioning of phosphorus between particulate and soluble forms. Oxidation-reduction potential, pH, and bacterial communities that may transform phosphorus into soluble forms thereby releasing previously captured phosphorus.
Orthophosphates Adsorption/precipitation
Contact with reactive media/soils, pH, temperature
Plant and microbial uptake Vegetation and root density, presence of nitrogen and other essential nutrients, bacterial communities. Periodic harvesting of vegetation.
2.3 Factors Influencing Pollutant Removal
2.3.1 Particulate Association
Particle size and density are important factors in determining particle settling velocity (or time required for particles to settle) and filtration effectiveness. Therefore, particle size distribution3
2 Acknowledgements:
(PSD) and densities of suspended solids in untreated stormwater are major factors that affect the
This section has been adapted from: Strecker, E.; Leisenring, M.; Poresky, A.; Pomeroy, C.; Mattson, J., and Barrett, M. (2009). Recommended Initial Set of Water Quality Constituents and BMPs to Address in BMP Algorithms - Task 3A Technical Memo of Linking BMP Performance to Receiving Water Protection to Improve BMP Selection and Design. WERF Project SW1R06. Submitted to Project Issue Area Team August 24, 2009.
3 Particle size distribution refers to the relative mass of particles present for each size category.

International Stormwater BMP Database
Pollutant Category Summary: Nutrients Page 7 December 2010
overall fraction of particles that may be removed in a stormwater treatment system. The fraction of phosphorus that can be removed through sedimentation and filtration – two of the most common unit processes harnessed in stormwater treatment BMPs – is dependent on two additional factors:
• The fraction of total phosphorus bound to particulates, and • The fraction of particulate-bound phosphorus associated with each particle size bin.
Results from the National Urban Runoff Program can be used to estimate average partitioning by land use. Table 2 shows average results from the NURP study (USEPA, 1983) and National Stormwater Quality Database (NSQD, Pitt, 2005) by land use.
Table 2: Median Total and Soluble Phosphorus Concentrations by Land Use.
Residential Mixed Commercial
Open Space/Non-
Urban Total P1,2, mg/L 0.17 -- 0.11 0.13 Total P2, mg/L 0.38 0.26 0.20 0.12
Soluble P, mg/L 0.14 0.056 0.08 0.026 1-From Pitt (2005). Data in all other rows from USEPA (1983). 2-Analytical labs typically use inert 0.45 µm pore size filters to distinguish between soluble and particulate bound fractions.
A study of stormwater treatability found that, on average, approximately 70 percent of total phosphorus and phosphate were removed from stormwater through removal of particles with diameter greater than 20 µm (WERF, 2003). Unfiltered (i.e., starting) concentrations for these tests were 0.38 and 0.8 mg/L, respectively. Removing particulates down to 5 µm increased removal efficiency to approximately 80 percent, and removing particles greater than 0.45 µm increased the removal efficiency to approximately 90 percent for both. Other studies on phosphorus fractionation (i.e., mass associated with various particle size ranges) in soils and sediment suggest that concentrations are typically greatest on fine particles (clays and silts); however, the particle size distribution also determines where most of the phosphorus mass resides. For example, if most of the suspended particles are sands, then most of the particulate-bound phosphorus mass in stormwater will be associated with sand (Dong et al., 2003; Vaze and Chiew, 2004). More easily filterable larger solids such as leaves and other organic matter may also occasionally contribute significant fractions of phosphorus in stormwater (Washbush et al., 1999). Overall, sediment removal mechanisms are likely to be relatively effective in removing phosphorus; however, partitioning between particulate and soluble forms has been observed to vary greatly; therefore, sediment removal alone is not expected to result in consistently high performance. BMPs will also likely need to address dissolved phosphorus in order to achieve high and/or consistent pollutant removal, or achieve TMDL numeric targets that are based on new biostimulatory criteria.

International Stormwater BMP Database
Pollutant Category Summary: Nutrients Page 8 December 2010
2.3.2 pH and Oxidation Reduction Potential
Both pH and oxidation-reduction potential (ORP) have important and complex interrelated effects on partitioning and sorption. Solubility of phosphorus species in rainfall-runoff ranges from >80% at a pH of 6 to <1% at a pH of 8 (WERF, 2005). As a result, phosphorus tends to precipitate onto particles at high pH. Additionally, at higher pH, metals tend to precipitate onto particulates, which creates more sorption sites for phosphorus (Holford and Patrick, 1979). However, with increasing pH, the electrostatic potential at the surface of particles decreases and generally reduces the sorption capacity of particles (Barrow, 1984). Phosphorus complexation with metals is also strongly influenced by pH. Phosphorus complexes with aluminum and iron in acidic conditions and with calcium in alkaline conditions (Minton, 2005). These interactions and other factors suggest a complex, non-monotonic relationship between pH and sorption capacity. ORP is especially important in interactions between phosphorus and iron in soils. Phosphorus may be removed from solution in oxidizing conditions (i.e., high ORP) as iron oxidizes from Fe+2 to Fe+3, causing phosphorus to precipitate. However, this reaction is reversible, with phosphorus being released under reducing (i.e., low ORP) conditions. In fact, studies have shown that anaerobic conditions in BMPs can result in lower removal effectiveness for phosphorus (Minton, 2005). 2.3.3 Cation Exchange Coefficient/P-Index
Related to the above, the removal of dissolved phosphorus through sorption, precipitation, and complexation is dependent on the sorption capacity of media/soil. Two media/soil properties thought to be important factors in sorption are cation exchange capacity (CEC) and amount of phosphorus already present in the soil. While there is debate over the most appropriate and accurate method for measuring and specifying the maximum acceptable leachable soil phosphorus, Hunt et al. (2006) suggested the use of soils with a low “P-index” (an index describing the amount of phosphorus in soil) to improve phosphorus removal in bioretention cells and prevent leaching. Organic material with high CEC (such as hemic peat) has been shown to provide good phosphorus removal. Conversely, highly decomposed peat (sapric) can be a source of phosphorus. As a result, some BMP design manuals have specified the use of partially decomposed fibric or hemic peat (e.g., NYSDEC, 2010). In addition, a variety of mineral substances such as zeolites, iron, aluminum oxide-coated sand, and similar filtration media have been found to promote the sorption of phosphorus (WERF, 2005). 2.3.4 Temperature
Changes in temperature can influence sedimentation by impacting water viscosity and settling velocities for sediments, which in turn would affect removal rates for particulate bound phosphorus. For example, decreases in temperature increase the viscosity of water, which in turn decrease rates of sedimentation. Although temperature has a substantial impact on microbial and plant activity, these processes are generally considered to be minor overall removal mechanisms for phosphorus. During winter months, some have found that phosphorus export may occur as a result of decaying of biological matter (NYSDEC, 2010); however, additional study of this phenomenon is needed.

International Stormwater BMP Database
Pollutant Category Summary: Nutrients Page 9 December 2010
2.4 BMP Design Considerations
Effective phosphorus control is essential for protecting receiving waters from nutrient enrichment impacts because phosphorus is often the limiting nutrient in freshwater bodies. Several unit treatment processes can help to reduce phosphorus concentrations in stormwater BMPs. Infiltration can be an effective mechanism for reducing phosphorus loads, particularly since phosphorus presents very little risk to groundwater, even in the dissolved state, due to its affinity to adsorb to minerals and organics. Sedimentation/settling is also a reasonably effective removal process when phosphorus is mostly particulate-bound and when treatment processes can be designed to remove particles in the 10µm range and larger. Filtration can also be an effective process for physical removal of particulate phosphorus when media properties (e.g., CEC and P-index) are suitable for sorption, precipitation, and complexation of soluble or dissolved phosphorus. Underdrain placement in certain BMP types also determines whether anaerobic or anoxic conditions will be present, which can result in export of phosphorus bound to media. Water and media chemistry are likely more important for phosphorus removal than biological activity, in contrast to other nutrients such as nitrate.
3 NITROGEN
3.1 Dominant Forms and Typical Stormwater Concentrations
Nitrogen is present in runoff and natural waters in one or more forms, depending on the source and the environmental conditions. Common forms include organic nitrogen, which can be either dissolved or particulate, and the inorganic ions ammonium (NH4
+), nitrite (NO2-), and nitrate
(NO3-). The nitrogen cycle is a series of biologically-catalyzed reactions by which one form of
nitrogen is transformed into another (USGS, 2010), as illustrated in Figure 2. Nitrite (NO2
-) is a short-lived intermediate state, whereas nitrate (NO3-) tends to be more mobile
and persistent (WERF, 2005). Figure 2 is a simplified illustration of the nitrogen cycle. Nitrogen concentrations are typically reported using the following indices:
Total ammonia nitrogen TAN = (NH3 + NH4+)aq
Total inorganic nitrogen TIN = (NH3 + NH4+ + NO2
-1 + NO3-1)aq
Total Kjeldahl nitrogen TKN = Organic N + NH3 + NH4+
Organic nitrogen ON = TKN – (NH3 + NH4+)
Total nitrogen TN = TKN + NO2-1 + NO3
-1
For the purpose of characterizing nitrogen processes in BMPs, the dominant forms of nitrogen found in stormwater can generally be characterized as (listed from highest concentration to lowest concentration):
• Nitrogenous organic solids • Nitrate (NO3
-) • Ammonia (NH3)

International Stormwater BMP Database
Pollutant Category Summary: Nutrients Page 10 December 2010
Figure 2. Simplified Illustration of the Nitrogen Cycle.
Source: U.S. EPA. http://www.epa.gov/caddis/ssr_amm_nitrogen_cycle_popup.html
The two primary concerns with nitrogen in stormwater are eutrophication and toxicity. Nitrate is readily available for biological uptake and, when present with sufficient amounts of phosphorus, which is often the case for estuaries and coastal environments, can cause eutrophication. Ammonia is of concern due to its fairly rapid transformation to nitrate, but also because it can be toxic to some aquatic species at fairly low concentrations. Although nitrate and ammonia in stormwater runoff are typically below applicable drinking water and aquatic toxicity standards, respectively, forthcoming biostimulatory-based nutrient criteria may result in a total nitrogen limit for stormwater discharges to levels below those often found in urban runoff, perhaps even after implementation of effective source controls. Table 3 provides a summary of median observed nitrogen species concentrations from various land uses reported in the National Stormwater Quality Database (NSQB) (Pitt, 2005).
Table 3: Median Ammonia and Nitrate/Nitrite Concentrations by Land Use (Pitt, 2005).
Residential Commercial Open
Space/Non-Urban
Ammonia, mg/L 0.32 0.50 0.18 Nitrate and Nitrite, mg/L 0.60 0.60 0.59

International Stormwater BMP Database
Pollutant Category Summary: Nutrients Page 11 December 2010
3.2 Summary of Transport Processes and Removal Mechanisms
The transport of nitrogen compounds in surface waters and stormwater runoff, and the transformation and removal of nitrogen in stormwater treatment BMPs is a very complex subject. This technical summary is intended to provide only a basic framework for discussing BMP performance. Table 4 provides a brief summary of dominant transformation and removal mechanisms factors understood to be important in each of these mechanisms.
Table 4: Summary of Transformations, Removal Mechanisms, and Important Factors.
Species Transformation and Removal Mechanisms Important Factors
Nitrogenous Organic Solids
Physical separation (removal) Partitioning of nitrogen between particulate and soluble forms
Ammonification (transform via microbial decomposition to NH4)
Temperature, pH, bacterial community
Nitrate (NO3) Plant uptake (removal)
Vegetation density, presence of phosphorus. Periodic harvesting of vegetation.
Denitrification (removal via biological reduction to N2 gas and volatilization)
Bacterial community, oxidation-reduction potential/dissolved oxygen
Ammonia (NH4+, NH3) Volatilization (removal) Temperature, pH, circulation and
air flow Nitrification (transform via biological oxidation to NO3 via NO2)
Temperature, pH, bacterial community
3.3 Factors Influencing Pollutant Removal
3.3.1 Temperature
The effectiveness of removal processes for the two most dominant forms of nitrogen (nitrogenous organic solids, nitrate) found in stormwater have been shown to be temperature dependent (Kadlec and Knight, 1996). In general, higher temperatures have been shown to improve microbially-mediated processes such as ammonification, volatilization, nitrification and denitrification. Descriptions of these processes (illustrated in Figure 2) and their relationships to temperature include:
• Ammonification is the biological transformation of organic nitrogen to ammonia through microbial breakdown of organic tissues, excretion of ammonia directly by plants and animals, and hydrolysis of urea and uric acid. Ammonification rates increase with temperature increases. Optimum temperatures for ammonification range from 40º to 60º C (Kadlec and Knight, 1996).
• Volatilization is the diffusion of un-ionized ammonia through water upward to the surface and through mass transfer from the water surface to the atmosphere. As

International Stormwater BMP Database
Pollutant Category Summary: Nutrients Page 12 December 2010
temperature increases, the solubility of ammonia decreases, thereby enhancing the release of ammonia from water into the overlying atmosphere through volatilization.
• Nitrification is the conversion of ammonia to nitrate through a two step biological oxidation process predominantly dependent on the two nitrifiers Nitrosomonas and Nitrobacter. Because nitrification is mediated by microbes, the rate at which is takes place is directly proportional to the growth of the nitrifier bacteria. Temperature has been found to have significant effects on both the maximum nitrifier growth rate and the nitrification half-saturation constant. The maximum nitrifier growth rate increases significantly at higher water temperatures. Optimum temperatures for nitrification in pure bacterial cultures range from 25º to 35º C.
• Denitrification is a reduction process where electrons are added to nitrate or nitrite nitrogen, resulting in the production of nitrogen gas, nitrous oxide and nitric oxide. Denitrification accompanies heterotrophic metabolism in aquatic and soil environments under anoxic conditions. Studies have shown that rates of denitrification are controlled primarily by temperature, with higher temperatures resulting in higher rates of denitrification.
3.3.2 pH
Nitrogen removal processes are also highly dependent on pH, with optimal rates of removal processes occurring when the pH is near neutral or slightly higher than neutral. Specific pH ranges affecting these removal processes include:
• For ammonification, the optimum pH range is between 6.5 and 8.5 (Reddy and Patrick, 1984).
• Denitrification processes are optimized at pH values ranging from 7 to 8 (USEPA, 1975).
• Volatilization is optimized when pH is greater than 8 (Metcalf and Eddy, 1991).
• For nitrification processes, the optimal pH range has been observed to be between 7.2 and 9 (Metcalf and Eddy, 1991). The nitrification process can often lower pH through the formation of carbonic acid, which can further limit nitrification in systems where losses of carbon dioxide are limited.
3.3.3 Bacterial Community
Ammonification, nitrification and denitrification processes rely on bacteria mediation; therefore, the presence and abundance of specific bacterial communities affects the rates of nitrogen removal from these processes. Relationships of these processes to the bacterial community include:
• Ammonification processes depend on bacteria to breakdown organic tissues containing amino acids. In some cases, microbes use the energy released in the ammonification process to grow and ammonia is incorporated into microbial biomass. Ammonification

International Stormwater BMP Database
Pollutant Category Summary: Nutrients Page 13 December 2010
typically occurs more rapidly under conditions conducive to heterotrophic decomposition (aerobic conditions).
• Nitrification, as discussed in Section 3.3.1, is mediated primarily by the bacteria Nitrosomonas and Nitrobacter. As a result, the nitrification rate is directly related to the growth of nitrifier bacteria. Therefore, conditions that facilitate nitrifier bacterial growth such as oxygen availability, micronutrients and various environmental factors enhance nitrogen removal through nitrification.
• Denitrification is mediated primarily by heterotrophic denitrifying bacteria in an anaerobic environment (e.g., wetland sediments) where nitrate is used in place of oxygen as the primary terminal electron acceptor. Organic carbon is also typically necessary to serve as the energy source or electron donor. An emerging technology for nitrate-nitrogen removal that does not require organic carbon is autotrophic biological denitrification using elemental sulfur as the electron donor (Sengupta and Ergas, 2006).
3.3.4 Dissolved Oxygen
Dissolved oxygen (DO) is an important environmental factor for nitrification and denitrification processes.
• For nitrification to occur, DO must be present. Low DO levels can limit nitrification rates because oxidation processes of nitrification can consume significant amounts of DO. To maintain nitrification processes, there must be a renewable and continual source of DO at rates equivalent to the consumption rate of optimal oxidation processes.
• Denitrification, in contrast, only occurs under anaerobic conditions, when little to no DO is present. The process of denitrification requires that nitrate act as an alternative terminal electron acceptor. When DO is present, it acts as the preferential terminal electron acceptor instead of nitrate, thereby inhibiting the denitrification process.
3.4 BMP Design Considerations
Because the various forms of nitrogen are removed through different processes, the most important consideration for BMP design is the dominant form of nitrogen that the system is designed to treat, based on loading sources and downstream impairments. The factors affecting removal of various nitrogen forms, as summarized in Table 4, should be taken into account in selecting BMP(s) for a particular site. As previously noted, nitrogen in stormwater runoff is predominantly organic nitrogen (e.g., leaves and other organic debris) and nitrate. For removal of organic nitrogen (which is predominantly particulate matter), BMPs that facilitate settling and filtration, as well as biological activity under aerobic conditions, will be the most effective. Conversely, for removal of nitrate (which is soluble), treatment processes conducive to biological activity under anaerobic conditions (e.g., surface or subsurface flow wetlands) will be most effective. Wetlands are ideal for nitrogen removal due to the variable depth zones that provide a diversity of oxidation-reduction potential conditions, and the shallow depths and long residence times that allow for microbial transformation processes to occur. Filtration processes

International Stormwater BMP Database
Pollutant Category Summary: Nutrients Page 14 December 2010
are not expected to be effective for nitrate (Davis et al., 2006) except in special circumstances such as with engineered bioretention designed to incorporate a continuously submerged anoxic zone with an overdrain (Kim et al., 2003). Ammonia, which occurs at relatively low levels in typical urban runoff, would be effectively removed in wetlands and other long residence time treatment BMPs through volatilization and microbially-mediated oxidation/nitrification processes.
4 GENERAL BMP PERFORMANCE DATA CHARACTERISTICS AND
AVAILABILITY
4.1 Inventory of Available Data in Database
As of August 2010, the BMP Database contains over 40,000 individual analysis results for nutrients including various nitrogen, phosphorus, and organic carbon species. Total Kjeldahl nitrogen (TKN) and total phosphorus are the most commonly reported nutrient species followed by nitrate plus nitrite (NO3/NO2 as N) and orthophosphate (PO4 as P). Nitrate (NO3 as N), total nitrogen (TN), total phosphorus, dissolved phosphorus (DP), and total organic carbon (TOC) are also frequently reported. For some studies, either nitrate plus nitrite is reported or just nitrate is reported. Very few studies report both quantities; presumably because nitrite is typically found in low concentrations relative to nitrate in surface waters. Consequently, NO3/NO2 and NO3 were combined prior to data analysis. Only NO3/NO2 concentrations were used in the analysis for studies that reported both quantities. While many other nutrient species are also reported in the database (e.g., ammonia nitrogen, organic nitrogen, particulate phosphorus), they are not consistently reported among the studies to allow for a valid comparison among BMP types. The focus of this report is on the more commonly reported nutrient species. Tables 5 through 9 summarize the number of studies and number of individual EMC data points for various BMP categories and commonly reported nutrient concentrations, following application of basic data screening.4
For BMP categories without permanent pools, these data points are restricted to EMC data. For BMPs with permanent pools (i.e., retention ponds and wetland basins), grab samples were included in these summaries. For BMP studies where grab samples were included, averages were used to represent the storm event. As shown in the tables some BMP categories and nutrients are well represented in the database (e.g., wet ponds for total phosphorus), while some others are not (e.g., grass strips for total nitrogen). Data for media filters and porous pavement are very limited for all nutrient species.
4 Studies excluded from analysis are listed in Attachment 2. Representative reasons that a study may have been excluded from analysis include: lack of EMC data for BMPs without a permanent pool, fewer than three storm events with nutrient data, agricultural BMP settings, multiple monitoring iterations of the same physical BMP (e.g., Caltrans swales monitored at multiple lengths), severely unbalanced number of data points between influent and effluent, and other basic screening criteria. Certain BMP categories were also excluded due to small numbers of BMP studies within the BMP category. Poor performance or poor design of a BMP are not included as screening criteria.

International Stormwater BMP Database
Pollutant Category Summary: Nutrients Page 15 December 2010
In Tables 5 through 9, the term “manufactured device” is listed as a BMP category. Manufactured devices included in the BMP Database incorporate a broad range of unit treatment processes that may result in widely varying performance for individual devices within this broad category. For example, some manufactured devices rely on hydrodynamic gravitational separation only, some provide filtration, others provide peak attenuation, and some provide a treatment train of multiple unit processes. The “manufactured device” category summarized in this document provides only a gross characterization of the range of performance provided by the broad category. More refined analysis is required based on finer segmentation by unit treatment processes in order to draw conclusions for a particular type of device. As of 2010, each manufactured device is characterized according to primary, secondary and tertiary unit treatment processes in place for the device, so additional unit process-based analysis can be conducted independently, if desired. Four “filter” and three “porous pavement” BMP categories are included in Tables 5 through 9. As shown in the tables, the number of studies for many constituents is very limited for these BMP sub-classes. While the performance of these BMP sub-classes may differ, the limited number of data points does not allow for a robust analysis of statistical differences. Therefore, these BMP sub-classes were lumped into the two parent BMP categories of “media filter” and “porous pavement.” While “biofilter - grass strips” and “biofilter - grass swales” have been kept separate for this analysis, the “biofilter” category also includes a sub-class called “wetland vegetation swale.” The two “wetland vegetation swale” studies in the database were combined with the “wetland channel” category for analysis purposes. Finally, four porous pavement studies and two grass swale studies utilized a reference watershed approach to characterize the influent concentrations. The analysis presented here assumes the reference watershed was representative of the influent concentrations to these BMPs; therefore, the reference outflows were included in the data sets representing inflow to the BMPs. Several other BMP sub-classes are included in the database that were not analyzed due to limited data sets. Attachment 2 provides a summary of the studies that were excluded from this analysis.

International Stormwater BMP Database
Pollutant Category Summary: Nutrients Page 16 December 2010
Table 5. Number of BMP Studies and Data Points for Total Nitrogen and TKN.
BMP Category/Subclass
Total Nitrogen Total Kjeldahl Nitrogen
(TKN) No. of Studies
No. of Data Points
No. of Studies
No. of Data Points
In Out In Out In Out In Out Biofilter - Grass Strip 2 2 11 11 13 13 237 161 Bioretention 7 7 136 116 8 8 122 107 Biofilter - Grass Swale 4 6 138 197 14 16 211 253 Detention Basin (Dry) - Surface Grass-Lined Basin 3 3 52 64 10 10 157 161 Filter - Other Media 2 2 54 41 3 3 72 59 Filter - Peat Mixed With Sand 0 0 0 0 2 2 18 18 Filter - Sand 1 1 20 20 12 12 181 176 Manufactured Device 8 8 133 117 18 25 292 341 Porous Pavement - Porous Asphalt 0 1 0 3 1 2 3 6 Porous Pavement - Pervious Concrete 0 0 0 0 1 2 11 14 Porous Pavement - Modular Blocks 0 1 0 3 2 3 39 42 Retention Pond (Wet) - Pond w/ a Permanent Pool 19 19 291 288 28 31 371 376 Wetland - Basin With Open Water Surfaces 6 6 222 223 5 8 67 176 Wetland - Channel With Wetland Bottom 3 4 40 50 3 4 37 72
Table 6. Number of BMP Studies and Data Points for NO2+NO3 and NO3.
BMP Category/Subclass
Nitrogen, Nitrite (NO2) + Nitrate (NO3) as N
Nitrogen, Nitrate (NO3) as N
No. of Studies
No. of Data Points
No. of Studies
No. of Data Points
In Out In Out In Out In Out Biofilter - Grass Strip 1 1 3 3 13 13 240 171 Bioretention 10 10 180 147 1 1 14 11 Biofilter - Grass Swale 6 8 172 224 11 11 95 77 Detention Basin (Dry) - Surface Grass-Lined Basin 5 5 69 82 7 7 104 97 Filter - Other Media 2 2 54 42 1 1 18 17 Filter - Peat Mixed With Sand 0 0 0 0 2 2 18 18 Filter - Sand 3 3 54 47 10 10 152 148 Manufactured Device 23 23 383 298 5 12 97 159 Porous Pavement - Porous Asphalt 2 2 26 17 0 1 0 3 Porous Pavement - Pervious Concrete 1 1 12 12 0 0 0 0 Porous Pavement - Modular Blocks 2 2 39 39 0 1 0 3 Retention Pond (Wet) - Pond w/ a Permanent Pool 24 24 361 345 11 11 198 185 Wetland - Basin With Open Water Surfaces 7 7 218 214 3 4 31 24 Wetland - Channel With Wetland Bottom 2 2 24 24 3 5 40 48

International Stormwater BMP Database
Pollutant Category Summary: Nutrients Page 17 December 2010
Table 7. Number of BMP Studies and Data Points for Total and Dissolved Phosphorus.
BMP Category/Subclass
Total Phosphorus Dissolved Phosphorus No. of Studies
No. of Data Points
No. of Studies
No. of Data Points
In Out In Out In Out In Out Biofilter - Grass Strip 14 14 245 169 3 3 21 17 Bioretention 12 12 187 157 1 1 10 10 Biofilter - Grass Swale 17 19 257 293 6 6 37 24 Detention Basin (Dry) - Surface Grass-Lined Basin 17 17 222 241 7 7 63 60 Filter - Other Media 4 4 79 69 1 1 9 9 Filter - Peat Mixed With Sand 2 2 18 18 2 2 10 10 Filter - Sand 13 13 194 189 6 7 49 54 Manufactured Device 34 41 457 456 12 19 132 164 Porous Pavement - Porous Asphalt 2 2 16 13 1 1 3 3 Porous Pavement - Pervious Concrete 1 2 11 14 0 0 0 0 Porous Pavement - Modular Blocks 2 2 38 38 1 1 3 3 Retention Pond (Wet) - Pond w/ a Permanent Pool 38 40 578 561 15 15 331 319 Wetland - Basin With Open Water Surfaces 12 13 284 271 4 4 104 103 Wetland - Channel With Wetland Bottom 5 6 82 83 5 5 92 89
Table 8. Number of BMP Studies and Data Points for Orthophosphate.
BMP Category/Subclass
Orthophosphate as P No. of Studies
No. of Data Points
In Out In Out Biofilter - Grass Strip 10 10 206 142 Bioretention 7 7 79 77 Biofilter - Grass Swale 5 7 140 197 Detention Basin (Dry) - Surface Grass-Lined Basin 1 1 22 22 Filter - Other Media 2 2 54 42 Filter - Peat Mixed With Sand 0 0 0 0 Filter - Sand 5 5 90 89 Manufactured Device 14 14 201 185 Porous Pavement - Porous Asphalt 0 0 0 0 Porous Pavement - Pervious Concrete 1 1 10 10 Porous Pavement - Modular Blocks 1 1 35 33 Retention Pond (Wet) - Pond w/ a Permanent Pool 26 27 362 346 Wetland - Basin With Open Water Surfaces 6 7 179 171 Wetland - Channel With Wetland Bottom 3 3 43 36

International Stormwater BMP Database
Pollutant Category Summary: Nutrients Page 18 December 2010
Table 9. Number of BMP Studies and Data Points for Total and Dissolved Organic Carbon.
BMP Category/Subclass
Total Organic Carbon (TOC)
Dissolved Organic Carbon (DOC)
No. of Studies
No. of Data Points
No. of Studies
No. of Data Points
In Out In Out In Out In Out Biofilter - Grass Strip 12 12 217 156 11 11 208 149 Bioretention 0 0 0 0 0 0 0 0 Biofilter - Grass Swale 7 7 56 44 6 6 37 25 Detention Basin (Dry) - Surface Grass-Lined Basin 6 6 47 45 4 4 34 31 Filter - Other Media 2 2 20 20 1 1 9 9 Filter - Peat Mixed With Sand 2 2 10 10 2 2 10 10 Filter - Sand 9 9 121 116 8 8 101 95 Manufactured Device 11 17 167 176 8 14 142 151 Porous Pavement - Porous Asphalt 0 0 0 0 0 0 0 0 Porous Pavement - Pervious Concrete 1 1 10 10 0 0 0 0 Porous Pavement - Modular Blocks 1 1 33 33 0 0 0 0 Retention Pond (Wet) - Pond w/ a Permanent Pool 11 11 177 165 2 2 30 25 Wetland - Basin With Open Water Surfaces 2 2 71 68 0 0 0 0 Wetland - Channel With Wetland Bottom 2 2 20 17 0 0 0 0
4.2 Category-level BMP Analysis for Nutrients
An overview of BMP performance for phosphorus, nitrogen, and organic carbon is provided in the subsections below. The analysis focuses on the distribution of effluent water quality for individual events by BMP category, thereby providing greater weight to those BMPs for which there are a larger number of data points reported. In other words, the performance analysis presented in this technical summary is “storm-weighted,” as opposed to “BMP weighted.”5
Data sets included in the analysis were screened and categorized according to the criteria in Section 4.1.
The BMP categories included in this analysis are bioretention with underdrains, dry detention basins (surface/grass-lined), filter strips, bioswales, manufactured devices, media filters, porous pavement, retention ponds (surface pond with a permanent pool), wetland basins (basin with open water surface), and wetland channels (swales and channels with wetland vegetation). The effectiveness and range of unit treatment processes present in a particular BMP may vary depending on the BMP design. Several other BMP categories and sub-classes are included in the database, but these have been excluded from this analysis due to limited data sets available for meaningful categorical comparisons.
5 There are several viable approaches to evaluating the BMP Database. Two general approaches that have been presented in the past (Geosyntec and WWE 2008) are the “BMP-weighted” and “storm-weighted” approaches. The BMP-weighted approach represents each BMP with one value representing the central tendency of the BMP study, whereas the storm-weighted approach combines all of the storm events for the BMPs in each category and analyzes the overall storm-based data set. The storm-weighted approach has been selected for this memorandum.

International Stormwater BMP Database
Pollutant Category Summary: Nutrients Page 19 December 2010
In the subsections below, side-by-side box plots for the various BMPs and nutrient species have been generated using the influent and effluent concentrations from the studies. For each BMP category, the influent box plots are provided on the left and the effluent box plots are provided on the right. A key to the box plots is provided in Figure 3. In addition to the box plots, tables of influent/effluent medians, 25th and 75th percentiles, and number of studies and data points are provided, along with 95% confidence intervals about the medians. The median and interquartile ranges were selected as descriptive statistics for BMP performance because they are non-parametric (do not require distributional assumptions for the underlying data set) and are less affected by extreme values than means and standard deviations. Additionally, the median is less affected by assumptions regarding values below detection limits and varying detection limits for studies conducted by independent parties over many years. Simple substitution was used to represent values below detection limits with one-half of the reported detection limit being substituted for non-detects. Other metrics for central tendency and spread are available and may be useful in many circumstances. However, the median, along with its 95% confidence interval, is deemed appropriate for reporting the average performance of BMPs based on many data points from a variety of individual studies. Confidence intervals in the figures and tables were generated using the bias corrected and accelerated (BCa) bootstrap method described by Efron and Tibishirani (1993). This method is a robust approach for computing confidence intervals that is resistant to outliers and does not require any restrictive distributional assumptions. Comparison of the confidence intervals about the influent and effluent medians can be used to identify statistically significant differences between the central tendencies of the data. Effluent values in bold green indicate the effluent medians are significantly less than the influent medians. Effluent values in red bold italics indicate the effluent medians are significantly greater than the influent medians. Values with no emphasis indicate no significant differences between the influent and effluent central tendencies. Be aware that for some BMP types, a statistically significant difference between influent and effluent concentrations may not be present, but the effluent concentrations achieved by the BMP are relatively low and may be comparable to the performance of other BMPs that have statistically significant differences between inflow and outflow. For example, data sets that have low influent concentrations and similarly low effluent concentration (i.e., clean water in = clean water out) may not show statistically significant differences. Attachment 1 to this memorandum is a data analysis report for nutrients, organized by BMP type. The report contains additional summary statistics (e.g., mean, median, standard deviation, skewness, 25th and 75th percentiles). Influent/effluent box plots and probability plots are also
Figure 3. Box Plot Key.
International Stormwater BMP Database
Pollutant Category Summary: Nutrients Page 20 December 2010
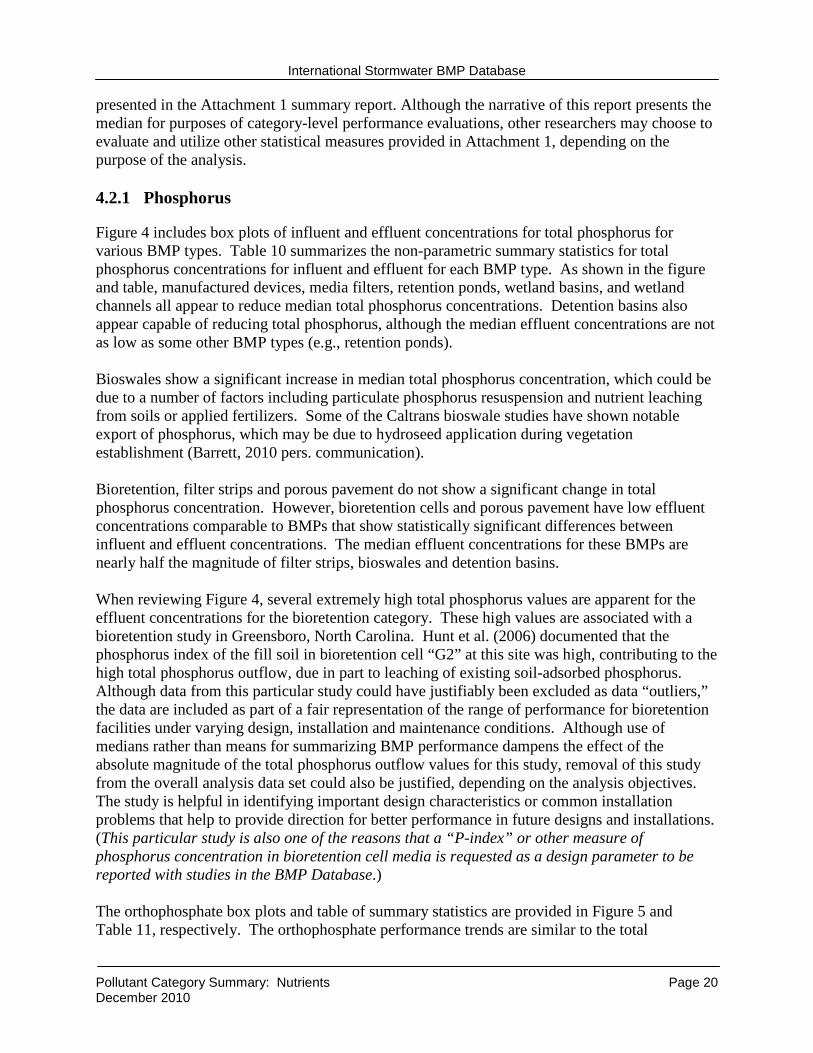
presented in the Attachment 1 summary report. Although the narrative of this report presents the median for purposes of category-level performance evaluations, other researchers may choose to evaluate and utilize other statistical measures provided in Attachment 1, depending on the purpose of the analysis. 4.2.1 Phosphorus
Figure 4 includes box plots of influent and effluent concentrations for total phosphorus for various BMP types. Table 10 summarizes the non-parametric summary statistics for total phosphorus concentrations for influent and effluent for each BMP type. As shown in the figure and table, manufactured devices, media filters, retention ponds, wetland basins, and wetland channels all appear to reduce median total phosphorus concentrations. Detention basins also appear capable of reducing total phosphorus, although the median effluent concentrations are not as low as some other BMP types (e.g., retention ponds). Bioswales show a significant increase in median total phosphorus concentration, which could be due to a number of factors including particulate phosphorus resuspension and nutrient leaching from soils or applied fertilizers. Some of the Caltrans bioswale studies have shown notable export of phosphorus, which may be due to hydroseed application during vegetation establishment (Barrett, 2010 pers. communication). Bioretention, filter strips and porous pavement do not show a significant change in total phosphorus concentration. However, bioretention cells and porous pavement have low effluent concentrations comparable to BMPs that show statistically significant differences between influent and effluent concentrations. The median effluent concentrations for these BMPs are nearly half the magnitude of filter strips, bioswales and detention basins. When reviewing Figure 4, several extremely high total phosphorus values are apparent for the effluent concentrations for the bioretention category. These high values are associated with a bioretention study in Greensboro, North Carolina. Hunt et al. (2006) documented that the phosphorus index of the fill soil in bioretention cell “G2” at this site was high, contributing to the high total phosphorus outflow, due in part to leaching of existing soil-adsorbed phosphorus. Although data from this particular study could have justifiably been excluded as data “outliers,” the data are included as part of a fair representation of the range of performance for bioretention facilities under varying design, installation and maintenance conditions. Although use of medians rather than means for summarizing BMP performance dampens the effect of the absolute magnitude of the total phosphorus outflow values for this study, removal of this study from the overall analysis data set could also be justified, depending on the analysis objectives. The study is helpful in identifying important design characteristics or common installation problems that help to provide direction for better performance in future designs and installations. (This particular study is also one of the reasons that a “P-index” or other measure of phosphorus concentration in bioretention cell media is requested as a design parameter to be reported with studies in the BMP Database.) The orthophosphate box plots and table of summary statistics are provided in Figure 5 and Table 11, respectively. The orthophosphate performance trends are similar to the total

International Stormwater BMP Database
Pollutant Category Summary: Nutrients Page 21 December 2010
phosphorus performance trends with median concentration reductions for manufactured devices, media filters, retention ponds, and wetland basins. However, bioswales, bioretention and filter strips show statistically significant increases for orthophosphate. All of these BMPs have low median influent concentrations and only five bioswale studies report influent values. There were less than three studies for detention basins and porous pavement. Manufactured devices have a relatively high median influent concentration and although statistically significant reductions are shown, the effluent concentration is higher than other BMPs with significant reductions. Figure 6 includes box plots of influent and effluent concentrations for dissolved phosphorus for various BMP types. Of the BMP types analyzed with influent and effluent dissolved phosphorus concentrations, only retention ponds and wetland basins appear to provide significant reductions in median concentrations. These BMPs also produced the lowest median effluent concentrations. Similar performance trends are shown in Table 12. As shown in both the figure and table, there is a pronounced net increase in dissolved phosphorus for bioswales and filter strips, but note that these medians are based on a small number of studies (6 for swales; 3 for filter strips). Detention basins, manufactured devices, media filters, and wetland channels do not show statistically significant differences, but all of these BMP types have low influent concentrations. Overall, the analysis of influent and effluent phosphorus concentrations indicates that BMPs with permanent pools can be effective at reducing the major forms of phosphorus. BMPs with sedimentation and filtration unit processes appear effective at reducing total phosphorus concentrations, which is consistent with the theoretical understanding of phosphorus partitioning and particulate removal mechanisms. The notable export of phosphorus from some vegetated BMPs indicates that the phosphorus content of planting media should be an important consideration in the design and maintenance of these systems.

International Stormwater BMP Database
Pollutant Category Summary: Nutrients Page 22 December 2010
Figure 4. Box Plots of Influent/Effluent Total Phosphorus Concentrations by BMP Type.
Table 10. Influent/Effluent Summary Statistics for Total Phosphorus.
BMP Type
Count (Studies/Data Pts.)
25th Percentile
(mg/L) Median (95% Conf. Interval)
(mg/L)
75th Percentile
(mg/L)
In Out In Out In Out In Out Bioretention 12/187 12/157 0.07 0.06 0.14 (0.12,0.15) 0.13 (0.10,0.16) 0.23 0.33
Detention Basin 17/222 17/241 0.18 0.12 0.26 (0.21,0.26) 0.21 (0.18,0.23) 0.48 0.34 Filter Strip 14/245 14/169 0.07 0.10 0.16 (0.14,0.19) 0.21 (0.16,0.23) 0.30 0.45 Bioswale 17/257 19/293 0.05 0.14 0.12 (0.09,0.16) 0.20 (0.17,0.20) 0.28 0.35
Manufactured Device 34/457 41/456 0.10 0.07 0.22 (0.16,0.22) 0.14 (0.11,0.14) 0.46 0.36 Media Filter 19/291 20/282 0.10 0.05 0.19 (0.16,0.20) 0.10 (0.08,0.11) 0.35 0.19
Porous Pavement 5/65 6/65 0.07 0.06 0.12 (0.09,0.13) 0.10 (0.07,0.11) 0.17 0.14 Retention Pond 38/578 40/561 0.14 0.06 0.27 (0.23,0.29) 0.11 (0.08,0.11) 0.53 0.22 Wetland Basin 12/284 13/271 0.08 0.04 0.12 (0.10,0.12) 0.08 (0.06,0.08) 0.20 0.14
Wetland Channel 6/88 6/83 0.13 0.10 0.18 (0.15,0.22) 0.14 (0.11,0.15) 0.30 0.25

International Stormwater BMP Database
Pollutant Category Summary: Nutrients Page 23 December 2010
Figure 5. Box Plots of Influent/Effluent Orthophosphate Concentrations by BMP Type.
Table 11. Influent/Effluent Summary Statistics for Orthophosphate.
BMP Type
Count (Studies/Data
Pts.)
25th Percentile
(mg/L) Median (95% Conf. Interval)
(mg/L)
75th Percentile
(mg/L)
In Out In Out In Out In Out Bioretention 7/79 7/77 0.01 0.05 0.04 (0.01,0.04) 0.16 (0.07,0.45) 0.13 0.75
Detention Basin NA NA NA NA NA NA NA NA Filter Strip 10/206 10/142 0.02 0.03 0.04 (0.03,0.04) 0.08 (0.05,0.1) 0.11 0.32 Bioswale 5/140 7/197 0.02 0.07 0.03 (0.03,0.03) 0.12 (0.11,0.13) 0.04 0.18
Manufactured Device 14/201 14/185 0.05 0.03 0.21 (0.13,0.25) 0.12 (0.07,0.13) 0.46 0.41 Media Filter 7/144 7/131 0.02 0.01 0.04 (0.03,0.05) 0.02 (0.02,0.03) 0.09 0.06
Porous Pavement NA NA NA NA NA NA NA NA Retention Pond 26/362 27/346 0.06 0.02 0.11 (0.09,0.13) 0.04 (0.04,0.05) 0.22 0.1 Wetland Basin 6/179 7/171 0.03 0.01 0.05 (0.04,0.06) 0.02 (0.02,0.03) 0.125 0.07
Wetland Channel 3/43 3/36 0.03 0.03 0.05 (0.02,0.05) 0.06 (0.03,0.07) 0.10 0.12 NA – not available or less than 3 studies for BMP/constituent.

International Stormwater BMP Database
Pollutant Category Summary: Nutrients Page 24 December 2010
Figure 6. Box Plots of Influent/Effluent Dissolved Phosphorus Concentrations by BMP Type.
Table 12. Influent/Effluent Summary Statistics for Dissolved Phosphorus.
BMP Type
Count (Studies/Data
Pts.)
25th Percentile
(mg/L) Median (95% Conf. Interval)
(mg/L)
75th Percentile
(mg/L)
In Out In Out In Out In Out Bioretention 0 NA NA NA NA NA NA NA
Detention Basin 7/63 7/60 0.05 0.05 0.09 (0.07,0.10) 0.09 (0.06,0.11) 0.16 0.14 Filter Strip 3/21 3/17 0.06 0.18 0.08 (0.06,0.08) 0.23 (0.16,0.26) 0.14 0.38 Bioswale 6/37 6/24 0.06 0.19 0.09 (0.06,0.11) 0.30 (0.21,0.35) 0.14 0.49
Manufactured Device 12/132 19/164 0.03 0.03 0.08 (0.05,0.11) 0.07 (0.05,0.08) 0.21 0.20 Media Filter 9/68 10/73 0.05 0.05 0.10 (0.07,0.11) 0.09 (0.08,0.11) 0.18 0.15
Porous Pavement 0 NA NA NA NA NA NA NA Retention Pond 15/331 15/319 0.06 0.03 0.11 (0.08,0.11) 0.06 (0.04,0.06) 0.20 0.11 Wetland Basin 4/104 4/103 0.04 0.02 0.08 (0.05,0.09) 0.04 (0.03,0.04) 0.13 0.13
Wetland Channel 5/92 5/89 0.05 0.06 0.08 (0.07,0.10) 0.09 (0.07,0.10) 0.15 0.14 NA – not available or less than 3 studies for BMP/constituent.

International Stormwater BMP Database
Pollutant Category Summary: Nutrients Page 25 December 2010
4.2.2 Nitrogen
Figure 7 includes box plots of influent and effluent EMCs for total nitrogen for various BMP types. The figure indicates bioretention and retention ponds can significantly reduce total nitrogen concentrations; however, other BMP types do not show statistically significant reductions. Detention basins show an average increase in total nitrogen, and bioswales, manufactured devices, media filters, wetland basins, and wetland channels do not show a significant change. As shown in Table 13, there are only small numbers of studies for bioswales (4), detention basins (3), and wetland channels (3) that report influent total nitrogen concentrations, so the findings may not be representative of typical total nitrogen treatment performance for these BMP types. Figure 8 includes influent/effluent box plots and Table 14 provides summary statistics for total Kjeldahl nitrogen (TKN). Media filters are the top performer with regard to statistically significant removals of TKN and low effluent concentrations. Filter strips and retention ponds also show significant treatment, but neither of these BMPs achieves median effluent concentrations below 1 mg/L. Wetland basins appear to slightly increase TKN concentrations on average, but the increase is not statistically significant. As compared to other BMP types, the median influent TKN concentration for bioswales is nearly half, which may contribute to the lack of significant reductions. Figure 9 includes influent/effluent box plots and Table 15 provides summary statistics for nitrate (NO3) and nitrite plus nitrate (NO2+NO3). As discussed above, the data sets for NO3 and NO2+NO3 have been combined and are referred to collectively as NOx with the underlying assumption that the magnitude of NO2 is typically insignificant relevant to NO3. As shown in the figure and table, only retention ponds and wetland basins appear to provide statistically significant reductions in median NOx concentrations; however, the influent concentrations of NOx for several of the BMP categories are relatively low compared to median runoff concentrations reported by Pitt (2005). Bioretention appears to show a reduction in median NOx concentrations, although not quite at a statistically significant level. The median influent NOx value reported for the bioretention data set is about half of the median influent value reported by Pitt (2005) (i.e., 0.3 mg/L, as compared to 0.6 mg/L). Porous pavement shows a significant increase in NOx; however, these findings may be statistically biased by the small number of studies and the unequal influent and effluent data points (5 influent/7 effluent studies for porous pavement). Also, two of the porous pavement studies use a reference watershed approach as the influent concentration; the representativeness of the reference watersheds is unknown. The analysis of BMP performance indicates that vegetated BMPs, especially those with permanent pools, can be effective at reducing commonly reported total nitrogen and soluble inorganic nitrogen compounds. Organic nitrogen, as indicated by TKN concentrations, may sometimes be released by wetland basins, which may be caused by the decomposition of vegetative matter. The relatively high effectiveness of media filters at reducing TKN indicates that this constituent may be largely associated with particulates. The data for bioswales indicate very low influent total nitrogen and TKN concentrations, which may contribute to the lack of statistically significant removals for these constituents. The difference in the influent and

International Stormwater BMP Database
Pollutant Category Summary: Nutrients Page 26 December 2010
effluent 75th percentiles indicates bioswales may provide significant reductions when influent TKN concentrations are higher than about 1.0 mg/L.
Figure 7. Box Plots of Influent/Effluent Total Nitrogen Concentrations by BMP Type.
Table 13. Influent/Effluent Summary Statistics for Total Nitrogen.
BMP Type
Count (Studies/Data Pts.)
25th Percentile
(mg/L) Median (95% Conf. Interval)
(mg/L)
75th Percentile
(mg/L)
In Out In Out In Out In Out Bioretention 7/136 7/116 0.95 0.76 1.38 (1.25,1.59) 1.09 (0.98,1.24) 2.21 2.87
Detention Basin 3/52 3/64 0.90 1.18 1.40 (1.13,1.62) 2.45 (1.77,2.75) 2.02 3.27 Filter Strip NA NA NA NA NA NA NA NA Bioswale 4/138 6/197 0.29 0.36 0.59 (0.5,0.63) 0.62 (0.54,0.66) 1.19 1.20
Manufactured Device 8/133 8/117 1.29 1.40 2.25 (1.98,2.65) 2.21 (1.85,2.34) 3.58 3.29 Media Filter 3/74 3/61 0.685 0.48 1.02 (0.85,1.39) 0.77 (0.67,0.91) 2.73 2.42
Porous Pavement NA NA NA NA NA NA NA NA Retention Pond 19/291 19/288 1.01 0.85 1.75 (1.50,1.90) 1.27 (1.16,1.35) 2.74 1.77 Wetland Basin 6/222 6/223 0.80 0.90 1.14 (1.05,1.28) 1.21 (1.06,1.21) 1.90 1.65
Wetland Channel 3/40 4/50 1.25 1.11 1.62 (1.38,1.89) 1.78 (1.40,2.00) 2.13 2.54 NA – not available or less than 3 studies for BMP/constituent.

International Stormwater BMP Database
Pollutant Category Summary: Nutrients Page 27 December 2010
Figure 8. Box Plots of Influent/Effluent Total Kjeldahl Nitrogen Concentrations by BMP Type.
Table 14. Influent/Effluent Summary Statistics for Total Kjeldahl Nitrogen.
BMP Type
Count (Studies/Data Pts.)
25th Percentile
(mg/L) Median (95% Conf. Interval)
(mg/L)
75th Percentile
(mg/L)
In Out In Out In Out In Out Bioretention 8/122 8/107 0.68 0.51 1.10 (0.92,1.20) 1.01 (0.84,1.30) 1.60 3.25
Detention Basin 10/157 10/161 0.84 0.90 1.40 (1.11,1.42) 1.60 (1.20,1.80) 2.40 2.60 Filter Strip 13/237 13/161 0.88 0.86 1.50 (1.40,1.60) 1.30 (1.10,1.40) 2.40 1.80 Bioswale 14/211 16/253 0.21 0.25 0.70 (0.46,0.86) 0.50 (0.43,0.62) 1.81 1.02
Manufactured Device 18/292 25/341 0.80 0.80 1.60 (1.43,1.75) 1.51 (1.40,1.60) 2.81 2.45 Media Filter 17/271 17/253 0.59 0.38 1.20 (0.92,1.25) 0.71 (0.61,0.80) 2.10 1.50
Porous Pavement 4/53 7/62 1.00 0.70 1.50 (1.10,2.20) 1.15 (0.91,1.35) 2.60 1.70 Retention Pond 28/371 31/376 0.80 0.77 1.30 (1.15,1.36) 1.10 (1.00,1.15) 2.07 1.60 Wetland Basin 5/67 8/176 0.56 0.79 0.99 (0.62,1.05) 1.06 (0.95,1.13) 1.25 1.31
Wetland Channel 3/37 4/72 1.20 0.80 1.60 (1.20,1.70) 1.20 (0.90,1.30) 2.00 1.60

International Stormwater BMP Database
Pollutant Category Summary: Nutrients Page 28 December 2010
Figure 9. Box Plots of Influent/Effluent NOx as Nitrogen Concentrations by BMP Type.
Table 15. Influent/Effluent Summary Statistics for NOx as Nitrogen.
BMP Type
Count (Studies/Data
Pts.)
25th Percentile
(mg/L) Median (95% Conf. Interval)
(mg/L)
75th Percentile
(mg/L)
In Out In Out In Out In Out Bioretention 10/194 10/158 0.19 0.10 0.30 (0.26,0.35) 0.23 (0.17,0.27) 0.44 0.38
Detention Basin 12/173 12/179 0.21 0.10 0.50 (0.36,0.53) 0.38 (0.22,0.47) 0.90 0.75 Filter Strip 14/243 14/174 0.31 0.18 0.63 (0.48,0.68) 0.42 (0.33,0.51) 1.20 0.93 Bioswale 17/267 19/301 0.13 0.13 0.30 (0.25,0.35) 0.28 (0.23,0.30) 0.60 0.50
Manufactured Device 27/480 34/457 0.22 0.22 0.38 (0.33,0.40) 0.43 (0.38,0.45) 0.79 0.77 Media Filter 18/296 18/272 0.18 0.20 0.34 (0.29,0.38) 0.53 (0.45,0.63) 0.67 0.98
Porous Pavement 5/77 7/74 0.34 0.62 0.66 (0.49,0.77) 1.00 (0.83,1.23) 1.01 1.56 Retention Pond 35/559 35/530 0.15 0.03 0.40 (0.32,0.42) 0.15 (0.11,0.16) 0.81 0.43 Wetland Basin 10/249 11/238 0.08 0.02 0.21 (0.15,0.23) 0.08 (0.05,0.10) 0.44 0.21
Wetland Channel 7/75 7/72 0.23 0.20 0.55 (0.39,1.15) 0.62 (0.33,0.96) 3.05 1.42

International Stormwater BMP Database
Pollutant Category Summary: Nutrients Page 29 December 2010
4.2.3 Organic Carbon
Figure 7 includes box plots and Table 16 provides summary statistics of influent and effluent EMCs for total organic carbon (TOC) for various BMP types. The figure and table show statistically significant reduction in TOC for retention ponds, but not for other BMPs. Filter strips show significant increases in median TOCs. The magnitude of the influent concentrations appears to play a role in the ability of a BMP to reduce TOC; filter strips have the lowest and manufactured devices have the highest median influent concentrations among the BMP types. None of the BMPs have effluent median TOC concentrations less than 10 mg/L. The performance trends for dissolved organic carbon (Figure 11 and Table 17) are similar to those for total organic carbon with statistically significant increases for filter strips, but no BMPs show significant reductions. However, there are very few BMPs with an adequate number of studies for analysis, so the conclusions that can be drawn are limited.

International Stormwater BMP Database
Pollutant Category Summary: Nutrients Page 30 December 2010
Figure 10. Box Plots of Influent/Effluent Total Organic Carbon Concentrations by BMP Type.
Table 16. Influent/Effluent Summary Statistics for Total Organic Carbon.
BMP Type
Count (Studies/Data Pts.)
25th Percentile
(mg/L) Median (95% Conf. Interval)
(mg/L)
75th Percentile
(mg/L)
In Out In Out In Out In Out Bioretention NA NA NA NA NA NA NA NA
Detention Basin 6/47 6/45 10.0 10.0 13.0 (11.0,17.0) 13.0 (11.0,16.0) 21.5 19.0 Filter Strip 12/217 12/156 5.1 9.4 9.2 (7.6,10.0) 13.0 (11.0,13.0) 16.0 22.0 Bioswale 7/56 7/44 9.05 10.9 13.4 (11.0,20.0) 13.0 (11.0,14.0) 27.8 21.0
Manufactured Device 11/167 17/176 12.9 10.0 26.6 (22.7,28.0) 23.0 (19.0,26.1) 34.7 30.6 Media Filter 13/151 13/146 5.1 3.9 12.0 (7.8,13.7) 11.0 (7.7,12.0) 21.0 17.0
Porous Pavement NA NA NA NA NA NA NA NA Retention Pond 11/177 11/165 9.8 8.4 14.4 (12.5,15.0) 10.8 (10.0,11.0) 18.2 13.3 Wetland Basin NA NA NA NA NA NA NA NA
Wetland Channel NA NA NA NA NA NA NA NA NA – not available or less than 3 studies for BMP/constituent.

International Stormwater BMP Database
Pollutant Category Summary: Nutrients Page 31 December 2010
Figure 11. Box Plots of Influent/Effluent Dissolved Organic Carbon Concentrations by BMP Type.
Table 17. Influent/Effluent Summary Statistics for Dissolved Organic Carbon.
BMP Type
Count (Studies/Data Pts.)
25th Percentile
(mg/L) Median (95% Conf. Interval)
(mg/L)
75th Percentile
(mg/L)
In Out In Out In Out In Out Bioretention NA NA NA NA NA NA NA NA
Detention Basin 4/34 4/31 9.6 8.5 11.0 (9.6,12.0) 12.0 (7.77,12.0) 20.8 20.5 Filter Strip 11/208 11/149 4.5 8.2 8.2 (7.1,9.5) 12.0 (9.6,12.0) 13.3 19.0 Bioswale 6/37 6/25 10.0 9.7 17.0 (10.4,21.0) 12.9 (8.4,17.0) 30.0 22.0
Manufactured Device 8/142 14/151 16.1 9.8 27.0 (25.0,28.3) 23.4 (19.0,25.5) 34.0 29.4 Media Filter 11/120 11/114 4.0 3.3 7.2 (5.6,9.8) 8.2 (5.4,10.5) 14.9 14.0
Porous Pavement NA NA NA NA NA NA NA NA Retention Pond NA NA NA NA NA NA NA NA Wetland Basin NA NA NA NA NA NA NA NA
Wetland Channel NA NA NA NA NA NA NA NA NA – not available or less than 3 studies for BMP/constituent.

International Stormwater BMP Database
Pollutant Category Summary: Nutrients Page 32 December 2010
5 CONCLUSIONS AND RECOMMENDATIONS
5.1 Recommendations for BMP Selection and Design
The analysis of BMP performance data aligns relatively well with observed urban runoff concentration characteristics and theoretical background of unit treatment processes and transport mechanisms for phosphorus and nitrogen. Key findings include:
• Phosphorus in stormwater runoff is generally highly particulate-bound. As a result, BMPs with unit processes for removing particulates (i.e., sedimentation and filtration), will generally provide good removal for total phosphorus. In particular, BMPs with permanent pools appear to be effective at reducing the major forms of phosphorus. Leaching of phosphorus from soils/planting media and resuspension of captured particulate phosphorus may be a cause of phosphorus increases observed in vegetated BMPs such as bioretention, swales, and filter strips. Vegetated BMPs should be designed with adequate inlet protection, dense vegetation, and drop structures or check dams to minimize resuspension of particulates. The use of virgin compost or chemical fertilizers should be avoided and planting media within BMPs should be tested for phosphorus content if phosphorus is a constituent of concern.
• BMPs with permanent pools (i.e., retention ponds and wetlands) appear to be able to reduce nitrate concentrations, but may increase organic nitrogen. The opposite appears to be true for biofilters and media filters. Based on the theory of unit processes and knowledge of the nitrogen cycle, it is hypothesized that retention ponds and wetlands sequester nitrate in wetland sediments and vegetation during the growing season and then release nitrogenous solids during vegetation die-off periods. As indicated by the relatively high TKN removal and low NOx removal for media filters, inert filtration appears capable of capturing nitrogenous solids, but the conditions are not as conducive for significant denitrification or nitrogen uptake as compared to bioretention or BMPs with permanent pools (retention ponds and wetland basins). Therefore, a BMP designed for permanently reducing nitrogen may include a permanent wet pool followed by a vegetated swale or media filter. Alternatively, a bioretention cell with pore storage above and below the underdrain may provide aerobic and anaerobic zones for nitrification/denitrification processes. Harvesting of vegetation and removal of captured sediment may also be key maintenance practices for reliable removal of nitrogen.
Less is known about the fate and transport of organic carbon in BMP systems, but the performance results indicate that retention ponds may be capable of reducing concentrations of this constituent, presumably due to the sequestration of organic carbon into biota. Additional organic carbon data are needed to adequately evaluate BMP performance with regard to this constituent.

International Stormwater BMP Database
Pollutant Category Summary: Nutrients Page 33 December 2010
When selecting BMPs to reduce nutrient loading, volume reduction should also be considered. This analysis focuses only on the effluent concentrations achieved for nutrients. Volume reduction analysis for BMPs in the BMP Database is provided in a separate technical summary (see www.bmpdatabase.org).
5.2 Recommendations for Appropriate Uses of Data
The BMP Database nutrient data set can be useful for characterizing the treatment performance for selected BMP categories. However, the number of studies and number of data points should be closely reviewed when assessing the reliability of the summary statistics provided. When possible, a closer investigation of the underlying data sets is encouraged. Additional screening of studies or particular monitoring periods may be warranted in some cases. For example, a researcher may choose to focus on a subset of the data with influent concentrations comparable to those expected for their site, particularly given the relatively low influent concentrations present in the BMP Database for certain BMP-constituent concentrations. While the number of non-detects in the nutrient data set is not as severe as for other constituent classes, it is important to understand the potential statistical bias introduced into summary statistics when simple substitution methods are employed. Statistics that quantify the variability or uncertainty of the data set may be particularly affected by a high number of non-detects. The number of non-detects has been summarized for each BMP and constituent type in the Attachment 1 statistical summary report.
5.3 Additional Research
• More studies with larger numbers of storm events and additional within-storm sample collection and analyses in a range of geographical locations would be helpful in drawing more statistically rigorous conclusions for all BMP types.
• Analyze influent and effluent data pairs to identify whether functional relationships (e.g., linear) may exist.
• Analyze studies with influent and effluent data pairs to identify whether changes in nitrogen and phosphorus speciation occur.
• Compare design attributes and unit treatment processes of well and poor performing BMPs.
• Critically evaluate the influence of individual studies within a BMP category on influent and effluent summary statistics.
• Compare BMP performance for constituents with differing influent concentration ranges (i.e., “bins”) to assess how influent concentration affects performance for the BMP-constituent combination.
• Divide manufactured devices by fundamental unit processes and analyze separately; identify devices that are designed with the intent of nutrient removal.
• Evaluate remobilization of trapped pollutants, especially for BMPs with permanent pools and/or potential for anoxic conditions.
International Stormwater BMP Database
Pollutant Category Summary: Nutrients Page 34 December 2010
• Investigate the effects of seasonality and cold climates on BMP performance; identify additional studies conducted in cold climates and during winter months.
6 ATTACHMENTS Attachment 1. Statistical Summary Report Attachment 2. Analysis Data Set in Excel 7 REFERENCES Barrett, M. (2010). Personal communication with Michael Barrett, Center for Research in Water
Resources, University of Texas regarding Caltrans Roadside Vegetated Treatment Swale Study. December 2010.
Barrow, N. J. (1984). “Modeling the Effects of pH on Phosphate Sorption by Soils.” European Journal of Soil Science. 35(2):283-297.
Davis, A.P., Shokouhian, M., Sharma, H., and Minami, C. (2006). “Water Quality Improvement Through Bioretention Media: Nitrogen and Phosphorus Removal.” Water Environment Research, 78(3):284-293.
Dong, A., Simsiman, G.V., and Chesters, G. (2003). “Particle-Size Distribution and Phosphorus Levels in Soil, Sediment, and Urban Dust and Dirt Samples from the Menomonee River Watershed, Wisconsin, U.S.A.” Water Research, 17(5):569-577.
Holford, I. C. R. and Patrick, Jr., W. H. (1979). “Effects of Reduction and pH Changes on Phosphate Sorption and Mobility in an Acid Soil.” Soil Sci. Soc. Am. J. 43:292-297.
Efron, B. and Tibishirani, R. (1993). An Introduction to the Bootstrap. Chapman & Hall, New York.
Hunt W. F., Jarrett, A. R., Smith, J. T., and Sharkey, L. J. (2006). “Evaluating Bioretention Hydrology and Nutrient Removal at Three Field Sites in North Carolina.” Journal of Irrigation and Drainage Engineering, 132(6)600-608.
Kadlec, R.H. and Knight, R.L. (1996). Treatment Wetlands. CRC Press, New York, N.Y.
Kim, H.H., Seagren, E.A., Davis, A.P. (2003). “Engineered Bioretention for Removal of Nitrate from Stormwater Runoff.” Water Environment Research, 75(4):355-367.
Metcalf and Eddy, Inc. (1991). Wastewater Engineering, Treatment, Disposal and Reuse. Third Edition. Revised by G. Tchobanoglous and F.L. Burton. McGraw Hill, New York, N.Y.
Minton, G. (2005). Stormwater Treatment. Sheridan Books, Inc., Chelsea, Michigan.
NYSDEC (2010). 2010 Stormwater Management Design Manual. Prepared under a joint effort between the New York State Department of Environmental Conservation (DEC), the Soil and Water Conservation Committee, and the Central New York Regional Planning and Development Board.

International Stormwater BMP Database
Pollutant Category Summary: Nutrients Page 35 December 2010
Pitt, R.E. and Maestre, A. (2005). “Stormwater Quality as Described in the National Stormwater Quality Database.” 10th International Conference on Urban Drainage, Copenhagen/Denmark, 21-26 August 2005.
Reddy, K.R. and Patrick, W.H. (1984). “Nitrogen Transformations and Loss in Flooded Soils and Sediments.” CRC Crit. Rev. Environ. Control, 13:273-309.
Sengupta, S. and Ergas, S. (2006). Autotrophic Biological Denitrification with Elemental Sulfur or Hydrogen for Complete Removal of Nitrate-Nitrogen from a Septic System Wastewater. Final report to The NOAA/UNH Cooperative Institute for Coastal and Estuarine Environmental Technology (CICEET). http://ciceet.unh.edu/news/releases/fallReports/pdf/sengupta03.pdf
Strecker, E., Leisenring, M., Poresky, A., Pomeroy, C., Mattson, J., and Barrett, M. (2009). Recommended Initial Set of Water Quality Constituents and BMPs to Address in BMP Algorithms - Task 3A Technical Memo of Linking BMP Performance to Receiving Water Protection to Improve BMP Selection and Design. WERF Project SW1R06. Submitted to Project Issue Area Team August 24, 2009.
Surbeck, C.Q., Jiang, S.C., and Grant, S.B. (2010). “Ecological Control of Fecal Indicator Bacteria in an Urban Stream.” Environ. Sci. Technol., 44(2):631–637.
Tchobanoglous, G. and Schroeder, E.D. (1985). Water Quality. Addison-Wesley Publishing Co., Reading, MA.
USEPA (1983). Results of the Nationwide Urban Runoff Program. Final Report, Water Planning Division, Washington D.C.
USEPA (1975). Process Design Manual for Nitrogen Control. EPA/625/1-75/007.
USEPA (1993). Method 365.1—Determination of phosphorus by semi-automated colorimetry (Revision 2.0). Odell, J.W. ed., 1993, U.S. Environmental Protection Agency, Environmental Monitoring Systems Laboratory, 17 p.
USEPA (1998). National Strategy for Development of Regional Nutrient Criteria. EPA 822-R-98-002. Office of Water. June 1998.
USEPA (1999). Protocol for Developing Nutrient TMDLs. EPA 841-B-99-007. November 1999.
USEPA (2002). National Water Quality Inventory 2000 Report. EPA-841-F-02-003. Office of Water. August 2002.
USGS (2010). Chesapeake Bay River Input Monitoring Program: Sources and Behavior of Water Quality Constituents. http://va.water.usgs.gov/chesbay/RIMP/waterchem.html. Accessed December 21, 2010.
Vaze, J. and Chiew, F.H.S. (2004). “Nutrient Loads Associated with Different Sediment Sizes in Urban Stormwater and Surface Pollutants.” Journal of Environmental Engineering, 130(4):391-396.
Washbush, R.J., W.R. Selbig, and Bannerman, R.T. (1999). Sources of Phosphorus in Stormwater and Street Dirt from Two Urban Residential Basins in Madison, Wisconsin, 1994-95, USGS Water Resources Investigations Report 99-4021.

International Stormwater BMP Database
Pollutant Category Summary: Nutrients Page 36 December 2010
WERF (2003). Metals Removal Technologies for Urban Stormwater. 97-IRM-2. Water Environment Federation (publisher), Alexandria, VA; IWA Publishing, London.
WERF (2005). Critical Assessment of Stormwater Treatment Controls and Control Selection Issues. 02-SW-01. Water Environment Federation (publisher), Alexandria, VA; IWA Publishing, London.