INTERNATIONAL RUBBER CONFERENCE 2012, KERALA,...
13
11/1/2012 1 STUDY ON PERFORMANCE OF CLONES IN SSCT DERIVED FROM HYBRIDIZATION AMONG 1981 HEVEA GERMPLASM AND ORIENTAL CLONES Nurmi-Rohayu A.H., Mohd Nasaruddin bin Mohd Aris, Zarawi bin Ab Ghani, Rasyidah binti Mohd Razar and Ong Chin Wei INTERNATIONAL RUBBER CONFERENCE 2012, KERALA, INDIA 29 TH – 31 ST OCTOBER 2012 INTRODUCTION • In 1920s, rubber breeding in Malaya has successfully produced high yielding clones using the population introduced by Henry Wickham. • However, due to the narrow genetic base of the rubber population, the genetic improvement leveled off in the breeding programme.
Transcript of INTERNATIONAL RUBBER CONFERENCE 2012, KERALA,...

11/1/2012
1
STUDY ON PERFORMANCE OF CLONES IN SSCT DERIVED FROM HYBRIDIZATION
AMONG 1981 HEVEA GERMPLASM AND ORIENTAL CLONES
Nurmi-Rohayu A.H., Mohd Nasaruddin bin Mohd Aris, Zarawi bin Ab Ghani, Rasyidah binti Mohd Razar and Ong Chin Wei
INTERNATIONAL RUBBER CONFERENCE 2012,KERALA, INDIA
29TH – 31ST OCTOBER 2012
INTRODUCTION
• In 1920s, rubber breeding in Malaya has successfully produced high yielding clones using the population introduced by Henry Wickham.
• However, due to the narrow genetic base of the rubber population, the genetic improvement leveled off in the breeding programme.

11/1/2012
2
INTRODUCTION
0
500
1000
1500
2000
2500
3000
3500
Unselectedseediling
Pil B 84 RRIM 501 RRIM 600 RRIM 712 RRIM 803 RRIM 937 RRIM 2007 RRIM 3001
Planting Materials
Increase in yield through breeding kg/ha/yr
INTRODUCTION
• 1981, The IRRDB and Gorvernment of Brazil had carried out an expedition to collect wild Hevea germplasm in order to widen the existing narrow genetic base.
• More than 10,000 genotypes were evaluated and the promising genotypes were incorporated in the breeding programme by crossing them with high yielding oriental clones.

11/1/2012
3
INTRODUCTION
• The promising progenies selected and planted in RRIM Research Centre in Kota Tinggi.
• The objective of this paper is to evaluate the growth performance and latex production of clones derived from hybridization among 1981 germplasm and oriental clones for selection of improved breeding materials.
MATERIALS
• 41 genotypes derived from 13 crosses between 1981 Hevea germplasm and oriental clones
– Control clones : PB 260, RRIM 2020, RRIM 2025
PB 260 X 23A (22/418) PB 260 X 23A(25/431) PB 260 X 23A(44/23)
PB 260 X 23B (22/456) PB 260 X 23B (24/294) PB 260 X 23B (35/120)
PB 260 X 23B(23/353) PB 260 X 23B(23/383) PB 260 X 23B(44/438)
PB 260 X 23B(9/42) PB 330 X 23B(24/294) RRIM 914 X 23B(44/438)
RRIM 916 X 23B(44/438)

11/1/2012
4
METHODS
Small Scale Clone Trial
• Experimental Design
– 10 x 10 Simple Lattice (2 replications)
– 8 plants/plot (450 trees/ha).
PARAMETERS
• Girth measurement
– taken annually from the second year after planting on all recording trees, measured in cm at a height of 150 cm above the union.
• Latex production
– tapped when approximately 50% of the trees have reached tappability girth of minimum 45.0 cm with S2 d3 tapping system.
• Bark measurement
– measured after three years of tapping period.

11/1/2012
5
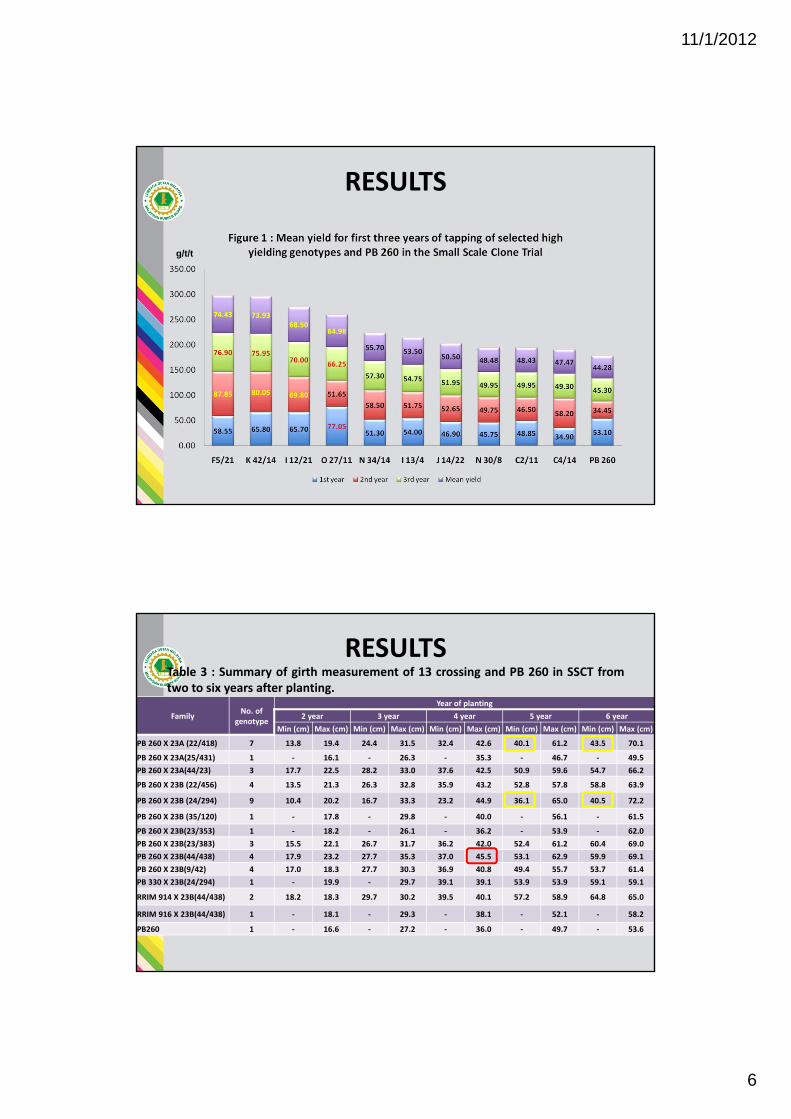
RESULTS
FamilyNo. of
genotype
Mean yieldMean yield
1st year 2nd year 3rd year
Min Max Min Max Min Max Min Max
PB 260 X 23A (22/418) 7 5.80 51.30 3.90 58.50 5.70 57.30 5.30 55.70
PB 260 X 23A(25/431) 1 ‐ 9.25 ‐ 9.55 ‐ 10.70 ‐ 9.83
PB 260 X 23A(44/23) 3 32.85 58.55 34.75 87.85 37.80 76.90 36.03 74.43
PB 260 X 23B (22/456) 4 17.20 77.05 13.80 51.65 18.25 66.25 17.12 64.98
PB 260 X 23B (24/294) 9 7.00 50.00 12.65 61.70 9.60 58.35 9.20 56.68
PB 260 X 23B (35/120) 1 ‐ 10.15 ‐ 15.95 ‐ 14.15 ‐ 13.42
PB 260 X 23B(23/353) 1 ‐ 32.10 ‐ 26.05 ‐ 30.35 ‐ 29.50
PB 260 X 23B(23/383) 3 34.90 48.85 45.55 58.20 44.35 49.95 42.88 48.43
PB 260 X 23B(44/438) 4 32.10 65.80 36.40 80.05 36.50 75.95 35.15 73.93
PB 260 X 23B(9/42) 4 13.35 65.70 17.30 69.80 17.20 70.00 15.95 68.50
PB 330 X 23B(24/294) 1 ‐ 20.05 ‐ 17.50 ‐ 20.45 ‐ 19.33
RRIM 914 X 23B(44/438) 2 21.45 25.30 15.50 22.45 21.50 23.95 20.77 22.62
RRIM 916 X 23B(44/438) 1 ‐ 30.70 ‐ 34.60 ‐ 34.90 ‐ 33.40
PB 260 1 ‐ 53.10 ‐ 34.45 ‐ 45.30 ‐ 44.28
Table 1 : Summary of mean yield (g/t/t) of 13 crossing and PB 260 in SSCT for threeyears of tapping period.
RESULTS
Source of variation1 year 2 year 3 year Mean 3 year
df MS VR df MS VR df MS VR df MS VR
Clone 43 609.28 7.77*** 43 851.29 5.16*** 43 691.85 6.79*** 43 702.45 7.48***
Replication 1 10.50 0.13ns 1 11.44 0.07 ns 1 0.26 0.00 ns 1 0.01 0.00 ns
Error 43 78.39 41 165.12 41 101.95 43 93.90
Table 2 : Analysis of varian of mean yield (g/t/t) for three years of tapping period.
Note: VR – Variance ratio, ns – not significant (p>0.05), *** p <0.001
11/1/2012
6
RESULTS
g/t/t
RESULTS
FamilyNo. of
genotype
Year of planting
2 year 3 year 4 year 5 year 6 year
Min (cm) Max (cm) Min (cm) Max (cm) Min (cm) Max (cm) Min (cm) Max (cm) Min (cm) Max (cm)
PB 260 X 23A (22/418) 7 13.8 19.4 24.4 31.5 32.4 42.6 40.1 61.2 43.5 70.1
PB 260 X 23A(25/431) 1 ‐ 16.1 ‐ 26.3 ‐ 35.3 ‐ 46.7 ‐ 49.5
PB 260 X 23A(44/23) 3 17.7 22.5 28.2 33.0 37.6 42.5 50.9 59.6 54.7 66.2
PB 260 X 23B (22/456) 4 13.5 21.3 26.3 32.8 35.9 43.2 52.8 57.8 58.8 63.9
PB 260 X 23B (24/294) 9 10.4 20.2 16.7 33.3 23.2 44.9 36.1 65.0 40.5 72.2
PB 260 X 23B (35/120) 1 ‐ 17.8 ‐ 29.8 ‐ 40.0 ‐ 56.1 ‐ 61.5
PB 260 X 23B(23/353) 1 ‐ 18.2 ‐ 26.1 ‐ 36.2 ‐ 53.9 ‐ 62.0
PB 260 X 23B(23/383) 3 15.5 22.1 26.7 31.7 36.2 42.0 52.4 61.2 60.4 69.0
PB 260 X 23B(44/438) 4 17.9 23.2 27.7 35.3 37.0 45.5 53.1 62.9 59.9 69.1
PB 260 X 23B(9/42) 4 17.0 18.3 27.7 30.3 36.9 40.8 49.4 55.7 53.7 61.4
PB 330 X 23B(24/294) 1 ‐ 19.9 ‐ 29.7 39.1 39.1 53.9 53.9 59.1 59.1
RRIM 914 X 23B(44/438) 2 18.2 18.3 29.7 30.2 39.5 40.1 57.2 58.9 64.8 65.0
RRIM 916 X 23B(44/438) 1 ‐ 18.1 ‐ 29.3 ‐ 38.1 ‐ 52.1 ‐ 58.2
PB260 1 ‐ 16.6 ‐ 27.2 ‐ 36.0 ‐ 49.7 ‐ 53.6
Table 3 : Summary of girth measurement of 13 crossing and PB 260 in SSCT fromtwo to six years after planting.

11/1/2012
7
RESULTSTable 4 : Summary of girth measurement of 13 crossing and PB 260 in SSCT fromseven to nine years after planting.
FamilyNo. of
genotype
Year of planting
7 year 8 year 9 year
Min (cm) Max (cm) Min (cm) Max (cm) Min (cm) Max (cm)
PB 260 X 23A (22/418) 7 45.4 72.4 47.5 76.9 48.4 80.2
PB 260 X 23A(25/431) 1 ‐ 51.9 ‐ 53.8 ‐ 54.0
PB 260 X 23A(44/23) 3 56.8 68.4 58.0 71.3 58.8 73.3
PB 260 X 23B (22/456) 4 62.7 66.3 65.1 68.8 66.4 70.6
PB 260 X 23B (24/294) 9 43.5 74.6 45.7 79.0 46.9 81.2
PB 260 X 23B (35/120) 1 ‐ 64.3 ‐ 66.2 ‐ 67.7
PB 260 X 23B(23/353) 1 ‐ 65.8 ‐ 70.8 ‐ 73.9
PB 260 X 23B(23/383) 3 64.4 73.5 67.3 77.9 68.4 79.4
PB 260 X 23B(44/438) 4 62.6 71.6 66.5 77.0 71.0 79.4
PB 260 X 23B(9/42) 4 54.9 63.7 56.5 65.4 57.8 67.3
PB 330 X 23B(24/294) 1 ‐ 61.9 ‐ 65.4 ‐ 66.8
RRIM 914 X 23B(44/438) 2 64.1 81.2 65.5 85.1 68.1 88.4
RRIM 916 X 23B(44/438) 1 ‐ 55.4 ‐ 56.7 ‐ 57.8
PB 260 1 ‐ 61.0 ‐ 63.3 ‐ 65.1
RESULTS
FamilyNo. of
genotype
Girth increment Bark thickness
Before tapping During tapping Virgin bark Renewed bark
Min (cm/yr) Max (cm/yr) Min (cm/yr) Max (cm/yr) Min (mm) Max (mm) Min (mm) Max (mm)
PB 260 X 23A (22/418) 7 8.7 13.9 1.7 4.2 6.3 9.5 4.9 7.5
PB 260 X 23A(25/431) 1 ‐ 10.2 ‐ 1.5 ‐ 6.1 ‐ 5.5
PB 260 X 23A(44/23) 3 11.1 13.0 1.4 2.5 7.6 9.8 6.3 7.7
PB 260 X 23B (22/456) 4 12.1 13.1 2.2 2.6 7.6 8.5 6.0 7.1
PB 260 X 23B (24/294) 9 8.6 15.0 1.7 3.8 5.6 8.8 5.0 7.2
PB 260 X 23B (35/120) 1 ‐ 12.8 ‐ 2.1 ‐ 9.3 ‐ 7.5
PB 260 X 23B(23/353) 1 ‐ 11.9 ‐ 4.0 ‐ 8.1 ‐ 6.7
PB 260 X 23B(23/383) 3 12.3 13.0 2.7 3.5 7.9 8.8 6.4 7.0
PB 260 X 23B(44/438) 4 11.8 13.3 1.9 4.1 7.5 9.2 6.5 7.3
PB 260 X 23B(9/42) 4 10.8 12.5 1.4 2.2 8.1 9.9 6.0 7.9
PB 330 X 23B(24/294) 1 ‐ 11.3 ‐ 2.6 ‐ 8.7 ‐ 7.7
RRIM 914 X 23B(44/438) 2 11.8 15.7 2.4 3.8 7.6 8.8 6.3 7.0
RRIM 916 X 23B(44/438) 1 ‐ 11.0 ‐ 1.5 ‐ 7.1 ‐ 5.5
PB 260 1 ‐ 11.4 ‐ 2.3 ‐ 8.0 ‐ 7.1
Table 5 : Summary of girth increment and bark thickness of 13 crossing and PB 260in SSCT from seven to nine years after planting.

11/1/2012
8
RESULTS
Source of variation df2 year 3 year 4 year 5 year
MS VR MS VR MS VR MS VR
Clone 43 12.42 2.07*** 18.73 2.05*** 29.94 2.46*** 67.63 3.26***
Replication 1 21.80 3.63ns 2.35 0.26 ns 0.19 0.02 ns 2.55 0.12 ns
Error 43 5.99 9.15 12.15 20.75
Table 6 : Analysis of varian of mean girth measurement for nine years afterplanting.
Note: VR – Variance ratio, ns – not significant (p>0.05), *** p <0.001
Note: VR – Variance ratio, ns – not significant (p>0.05), *** p <0.001
Source of variation df6 year 7 year 8 year 9 year
MS VR MS VR MS VR MS VR
Clone 43 103.42 3.83*** 114.68 3.81*** 136.95 4.21*** 158.25 4.01***
Replication 1 0.58 0.02ns 0.04 0.00ns 11.92 0.37 ns 0.10 0.00 ns
Error 43 27.03 29.48 32.52 39.42
RESULTSFigure 3 : Girth increment before tapping and during tapping of five genotypes andPB 260

11/1/2012
9
RESULTS
Source of variation dfBefore tapping During tapping Virgin bark Renewed bark
MS VR MS VR MS VR MS VR
Clone 43 3.95 2.76*** 1.91 4.18*** 1.64 3.10*** 0.95 2.53***
Replication 1 4.47 3.12ns 0.01 0.04ns 0.30 0.57 ns 0.03 0.08 ns
Error 43 1.43 0.45 0.52 0.37
Table 7 : Analysis of varian of mean girth increment and bark thickness.
Note: VR – Variance ratio, ns – not significant (p>0.05), *** p <0.001
RESULTSFigure 4 : Bark thickness of five genotypes and PB 260

11/1/2012
10
RESULTS
F5/21 J14/22
DISCUSSION
• Generally germplasm materials have low yield, but when crossed with high yielding oriental clone they were found to produce progenies with higher yield than the germplasm parents and the oriental clones.
– Indicates the additive genetic effects on yield from both parents.
– PB 260 X 23A(44/23), PB 260 X 23B(44/438), PB 260 X 23B(9/42) and PB 260 X 23B (22/456)

11/1/2012
11
DISCUSSION
• Five potential genotypes with high latex production are F5/21, K42/14, I12/21, O27/11 and N34/14.
• Most of the genotypes reached tappable size of 45.0 cm after five years of planting.
– The utilization of the 1981 germplasm materials would enhance the growth vigour
DISCUSSION
• Incorporation of the 1981 germplasm in the breeding programme could increase both growth vigour and yield within individual progenies.
– Produce better latex timber clones in the future.

11/1/2012
12
CONSLUSION
• There are some promising vigorous genotypes with high latex yield.
– These genotypes are suitable for planting not only for latex but also for rubberwood production.
• The genotypes will be further tested prior to recommendation.
ACKNOWLEDGEMENT
• Director General of Malaysian Rubber Board
– Dato’ Dr. Salmiah binti Ahmad
• Director of Production Development Division
– Dr. Mohd Nasaruddin bin Mohd Aris
• Acting Head of Crop Improvement and Protection Unit
– Mr. Zarawi bin Ab Ghani
• Crop Improvement & Protection Unit
– Mr. Abdul Hamid bin Othman, Mr. Amran bin Saari, Mr. Mohamad Sanusi bin Mohamad Redzuan, Mr. Shahrul bin Ab Manaf and Mr Mohd Arabi bin Hj Ismail.

11/1/2012
13
Thank You