International Rice Research Notes - IRRI - Booksbooks.irri.org/IRRN23no3_content.pdf ·...
36
VOLUME 23 NUMBER 3 1998 International Rice Research Notes INTERNATIONAL RICE RESEARCH INSTITUTE
Transcript of International Rice Research Notes - IRRI - Booksbooks.irri.org/IRRN23no3_content.pdf ·...

VOLUME 23 NUMBER 3 1998
InternationalRice Research
Notes
INTERNATIONAL RICE RESEARCH INSTITUTE
2 IRRN 1998
International Rice Research NotesThe International Rice Research Notes (IRRN) expedites communi-cation among scientists concerned with the development ofimproved technology for rice and rice-based systems.
The IRRN is a mechanism to help scientists keep each otherinformed of current rice research findings. The concise scientificnotes are meant to encourage rice scientists to communicate withone another to obtain details on the research reported.
The IRRN is published three times a year in April, August,and December by the International Rice Research Institute.
IRRN production teamEditors: Bill Hardy, Katherine LopezCopy editor: Tess RolaLayout and design: Erlie PutunganArtwork: Erlie PutunganWord processing: Arleen Rivera
○ ○ ○ ○ ○ ○ ○ ○ ○ ○ ○ ○ ○ ○ ○
ContentsVol. 23, No. 3, 1998
Germplasm improvement
GeneticsGenetic variability in floral traits of 10 cytosterile lines of rice
(Oryza sativa L.) 4Does cross-pollination occur during seed regeneration at the
International Rice Genebank? 5
Genetic researchPhylogenetic relationship of genus Oryza as revealed by RAPD
analysis 6
Genetic evaluationIdentification of an alternate cytoplasmic male sterile source in
rice 8Inheritance study of seedling elongation in rice 9Studies on combining ability and heterosis in rice 10
Breeding methods — tissue cultureEffects of L-tryptophan, L-proline, and activated charcoal on
plant regeneration in indica rice (Oryza sativa L.) 10
Grain qualityModeling water uptake and degree of polish of milled rice 12Breeding of Gan wan nuo 5, a new high-quality glutinous indica
variety 12
Pest resistance — diseasesInheritance of resistance to bacterial leaf blight in differential
rice variety Asominori 13Potential sources of resistance against RGSV-2 in wild rice
germplasm 14Green leafhopper-susceptible advanced lines resistant to rice
tungro viruses 16
Stress tolerance — excess waterInheritance of submergence tolerance at the early seedling
stage in rainfed lowland rices 17
Stress tolerance — adverse soilsPerformance of different rice lines in Zn-deficient soil 18Genetic variability and path analysis in rice grown in saline
soil 19
Integrated germplasm improvement — rainfed lowlandSatyam and Kishori, two high-yielding varieties developed for
the rainfed lowlands of Bihar, India 20
Evaluating IRRN and its audiencesIn a 1990 study, IRRI found that survey respondents, consistingof individual and institutional subscribers of the InternationalRice Research Notes (IRRN) as well as IRRI scientists andresearchers, considered IRRN to be the most useful among IRRIpublications.
Considering this finding and the perceived need to improvethe IRRN and make it a more useful publication, IRRI’sCommunication and Publications Services (CPS) is conductinga readership survey to get more concrete information aboutIRRN audiences and their information needs and preferences.The study is intended to identify the factors that make IRRN asuccessful and useful publication, and also to pinpoint aspectswhere it can be improved.
Attached is a 3-part questionnaire that coverssociodemographic information, general perceptions aboutdistribution, and perceptions and preferences on content andlayout of IRRN. The questionnaire has been distributed toindividual and institutional recipients of IRRN on the mailinglist. Other readers and individuals not on the mailing list butwho are interested in participating in the survey are invited tofill out the questionnaire. Please mail the completedquestionnaire no later than 30 December 1998 to IRRN Central,Communication and Publications Services, IRRI, P.O. Box 933,1099 Manila, Philippines.
If you wish to get an electronic copy (email/pdf file) of thequestionnaire, please send an email to [email protected] if you want to answer the questionnaire online, please goto the IRRI homepage at http://www.cgiar.org/irri/irrn.htm.
Upcoming changes in the content and format of IRRN arepart of a larger effort to improve the quality, usefulness, andaccessibility of this valued IRRI publication. Other componentsof the renewal project include the appointment of an IRRIeditorial board of scientists composed of six internationallyrecruited staff, creation of a position for IRRN ManagingEditor, and release of IRRN on the World Wide Web.
Vol. 23, No. 3 3
The International Rice Research Institute (IRRI) was established in 1960 by the Ford and RockefellerFoundations with the help and approval of the Government of the Philippines. Today IRRI is one of 16nonprofit international research centers supported by the Consultative Group on International AgriculturalResearch (CGIAR). The CGIAR is cosponsored by the Food and Agriculture Organization of the UnitedNations (FAO), the International Bank for Reconstruction and Development (World Bank), the UnitedNations Development Programme (UNDP), and the United Nations Environment Programme (UNEP). Itsmembership comprises donor countries, international and regional organizations, and private foundations.
As listed in its most recent Corporate Report, IRRI receives support, through the CGIAR, from a numberof donors including UNDP, World Bank, European Union, Asian Development Bank, and RockefellerFoundation, and the international aid agencies of the following governments: Australia, Belgium, Canada,People’s Republic of China, Denmark, France, Germany, India, Indonesia, Japan, Republic of Korea, TheNetherlands, Norway, Philippines, Spain, Sweden, Switzerland, United Kingdom, Thailand and UnitedStates.
Integrated germplasm improvement — uplandOn-farm characterization of upland rice varieties in north
Thailand 21
Crop resource management
Fertilizer managementEvaluation of P sources in a rice - wheat cropping system in
northwestern India 22Growth and yield response of improved and traditional rice
varieties to N fertilization at various growth stages 23
Crop managementLock-lodge technology for rice ratooning 24
Disease managementSoil-borne and seed-borne pathogens of rice in rice - wheat
system-based farmers’ fields in Uttar Pradesh 24Incidence of rice stripe necrosis virus in upland rice in West
Africa 25
Integrated pest management — diseasesSeed-borne fungi associated with rice seed lots in Pakistan 26
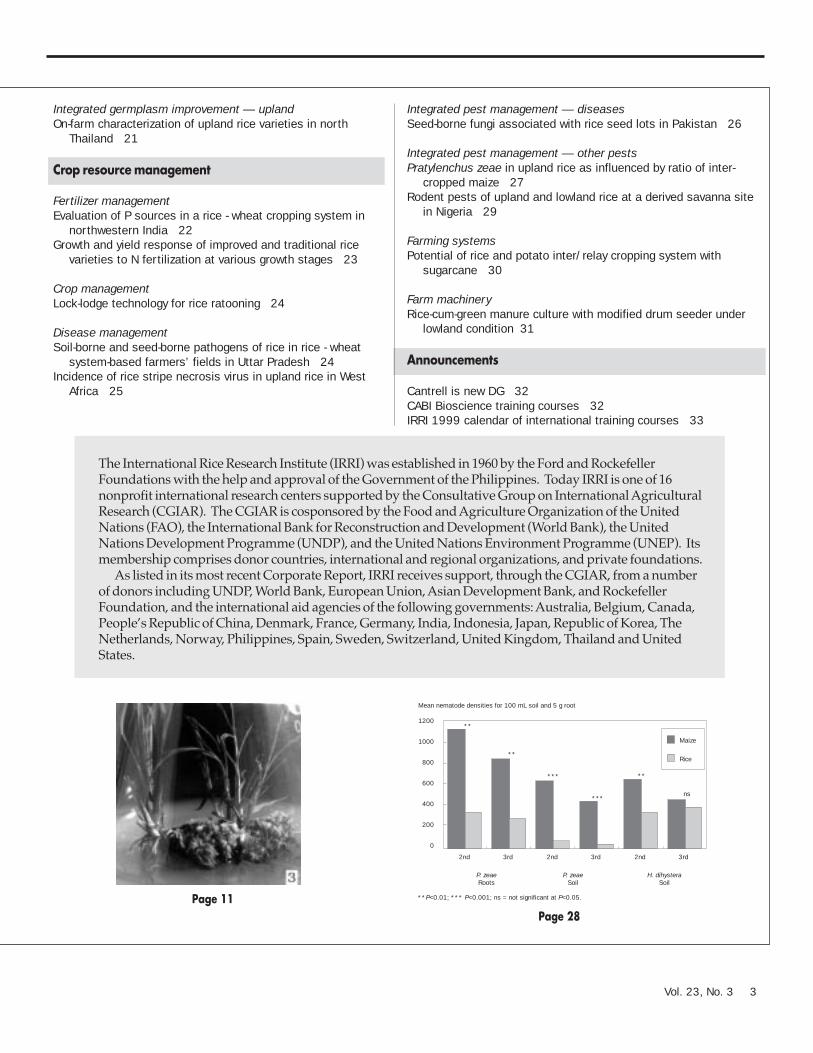
Integrated pest management — other pestsPratylenchus zeae in upland rice as influenced by ratio of inter-
cropped maize 27Rodent pests of upland and lowland rice at a derived savanna site
in Nigeria 29
Farming systemsPotential of rice and potato inter/relay cropping system with
sugarcane 30
Farm machineryRice-cum-green manure culture with modified drum seeder under
lowland condition 31
Announcements
Cantrell is new DG 32CABI Bioscience training courses 32IRRI 1999 calendar of international training courses 33
Page 11
1200
1000
800
600
400
200
0
2nd 3rd 2nd 3rd 2nd 3rd
**
**
***
***
**
ns
Maize
Rice
Mean nematode densities for 100 mL soil and 5 g root
P. zeaeRoots
P. zeaeSoil
H. dihysteraSoil
**P<0.01; *** P<0.001; ns = not significant at P<0.05.
Page 28
4 IRRN 1998
Germplasm improvementGenetics
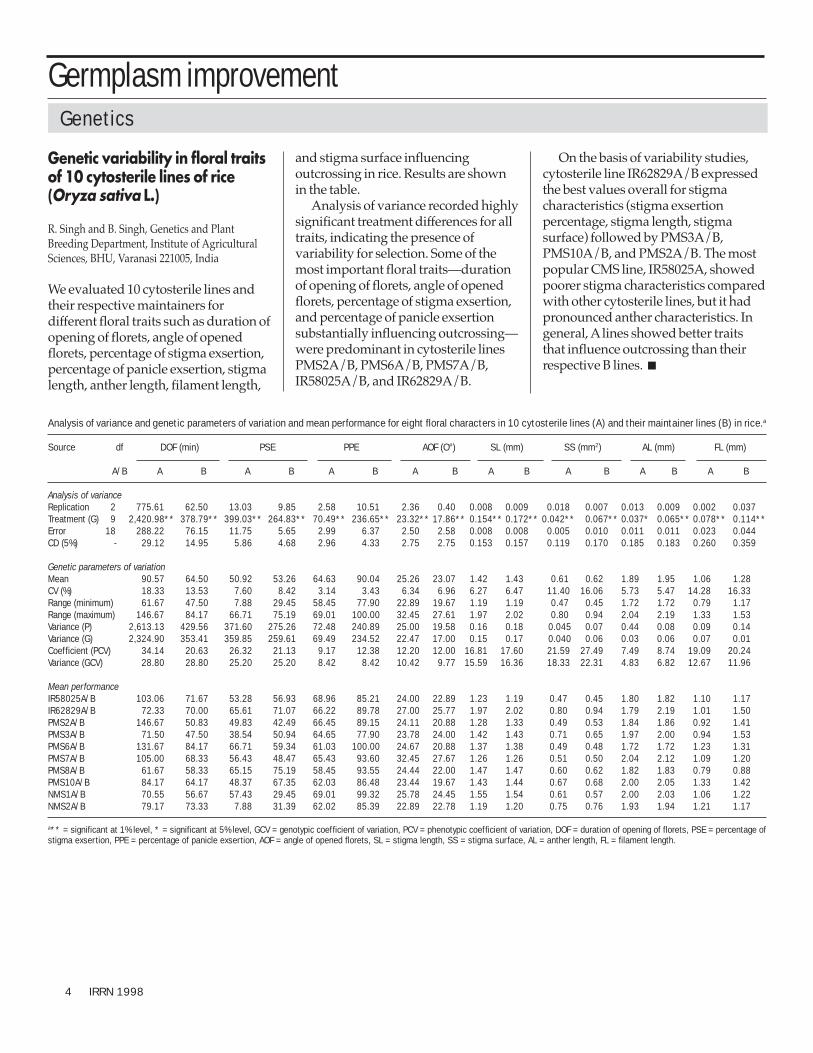
Analysis of variance and genetic parameters of variation and mean performance for eight floral characters in 10 cytosterile lines (A) and their maintainer lines (B) in rice.a
Source df DOF (min) PSE PPE AOF (O°) SL (mm) SS (mm2) AL (mm) FL (mm)
A/B A B A B A B A B A B A B A B A B
Analysis of varianceReplication 2 775.61 62.50 13.03 9.85 2.58 10.51 2.36 0.40 0.008 0.009 0.018 0.007 0.013 0.009 0.002 0.037Treatment (G) 9 2,420.98** 378.79** 399.03** 264.83** 70.49** 236.65** 23.32** 17.86** 0.154** 0.172** 0.042** 0.067** 0.037* 0.065** 0.078** 0.114**Error 18 288.22 76.15 11.75 5.65 2.99 6.37 2.50 2.58 0.008 0.008 0.005 0.010 0.011 0.011 0.023 0.044CD (5%) - 29.12 14.95 5.86 4.68 2.96 4.33 2.75 2.75 0.153 0.157 0.119 0.170 0.185 0.183 0.260 0.359
Genetic parameters of variationMean 90.57 64.50 50.92 53.26 64.63 90.04 25.26 23.07 1.42 1.43 0.61 0.62 1.89 1.95 1.06 1.28CV (%) 18.33 13.53 7.60 8.42 3.14 3.43 6.34 6.96 6.27 6.47 11.40 16.06 5.73 5.47 14.28 16.33Range (minimum) 61.67 47.50 7.88 29.45 58.45 77.90 22.89 19.67 1.19 1.19 0.47 0.45 1.72 1.72 0.79 1.17Range (maximum) 146.67 84.17 66.71 75.19 69.01 100.00 32.45 27.61 1.97 2.02 0.80 0.94 2.04 2.19 1.33 1.53Variance (P) 2,613.13 429.56 371.60 275.26 72.48 240.89 25.00 19.58 0.16 0.18 0.045 0.07 0.44 0.08 0.09 0.14Variance (G) 2,324.90 353.41 359.85 259.61 69.49 234.52 22.47 17.00 0.15 0.17 0.040 0.06 0.03 0.06 0.07 0.01Coefficient (PCV) 34.14 20.63 26.32 21.13 9.17 12.38 12.20 12.00 16.81 17.60 21.59 27.49 7.49 8.74 19.09 20.24Variance (GCV) 28.80 28.80 25.20 25.20 8.42 8.42 10.42 9.77 15.59 16.36 18.33 22.31 4.83 6.82 12.67 11.96
Mean performanceIR58025A/B 103.06 71.67 53.28 56.93 68.96 85.21 24.00 22.89 1.23 1.19 0.47 0.45 1.80 1.82 1.10 1.17IR62829A/B 72.33 70.00 65.61 71.07 66.22 89.78 27.00 25.77 1.97 2.02 0.80 0.94 1.79 2.19 1.01 1.50PMS2A/B 146.67 50.83 49.83 42.49 66.45 89.15 24.11 20.88 1.28 1.33 0.49 0.53 1.84 1.86 0.92 1.41PMS3A/B 71.50 47.50 38.54 50.94 64.65 77.90 23.78 24.00 1.42 1.43 0.71 0.65 1.97 2.00 0.94 1.53PMS6A/B 131.67 84.17 66.71 59.34 61.03 100.00 24.67 20.88 1.37 1.38 0.49 0.48 1.72 1.72 1.23 1.31PMS7A/B 105.00 68.33 56.43 48.47 65.43 93.60 32.45 27.67 1.26 1.26 0.51 0.50 2.04 2.12 1.09 1.20PMS8A/B 61.67 58.33 65.15 75.19 58.45 93.55 24.44 22.00 1.47 1.47 0.60 0.62 1.82 1.83 0.79 0.88PMS10A/B 84.17 64.17 48.37 67.35 62.03 86.48 23.44 19.67 1.43 1.44 0.67 0.68 2.00 2.05 1.33 1.42NMS1A/B 70.55 56.67 57.43 29.45 69.01 99.32 25.78 24.45 1.55 1.54 0.61 0.57 2.00 2.03 1.06 1.22NMS2A/B 79.17 73.33 7.88 31.39 62.02 85.39 22.89 22.78 1.19 1.20 0.75 0.76 1.93 1.94 1.21 1.17
a** = significant at 1% level, * = significant at 5% level, GCV = genotypic coefficient of variation, PCV = phenotypic coefficient of variation, DOF = duration of opening of florets, PSE = percentage ofstigma exsertion, PPE = percentage of panicle exsertion, AOF = angle of opened florets, SL = stigma length, SS = stigma surface, AL = anther length, FL = filament length.
Genetic variability in floral traitsof 10 cytosterile lines of rice(Oryza sativa L.)
R. Singh and B. Singh, Genetics and PlantBreeding Department, Institute of AgriculturalSciences, BHU, Varanasi 221005, India
We evaluated 10 cytosterile lines andtheir respective maintainers fordifferent floral traits such as duration ofopening of florets, angle of openedflorets, percentage of stigma exsertion,percentage of panicle exsertion, stigmalength, anther length, filament length,
and stigma surface influencingoutcrossing in rice. Results are shownin the table.
Analysis of variance recorded highlysignificant treatment differences for alltraits, indicating the presence ofvariability for selection. Some of themost important floral traits—durationof opening of florets, angle of openedflorets, percentage of stigma exsertion,and percentage of panicle exsertionsubstantially influencing outcrossing—were predominant in cytosterile linesPMS2A/B, PMS6A/B, PMS7A/B,IR58025A/B, and IR62829A/B.
On the basis of variability studies,cytosterile line IR62829A/B expressedthe best values overall for stigmacharacteristics (stigma exsertionpercentage, stigma length, stigmasurface) followed by PMS3A/B,PMS10A/B, and PMS2A/B. The mostpopular CMS line, IR58025A, showedpoorer stigma characteristics comparedwith other cytosterile lines, but it hadpronounced anther characteristics. Ingeneral, A lines showed better traitsthat influence outcrossing than theirrespective B lines. ■

Vol. 23, No. 3 5
98-071
Does cross-pollination occurduring seed regeneration at theInternational Rice Genebank?
R. Reaño, IRRI, and J.L. Pham, IRRI, secondedfrom ORSTOM (Institut français de recherchéscientifique pour le développement encoopération), Paris, France
Preserving genetic integrity ofaccessions through cycles ofconservation and regeneration is amajor objective of the International RiceGenebank (IRG). The careful manage-ment of seed lots at all steps of the con-servation-regeneration process con-tributes to this objective. Althoughcultivated rice is a self-pollinated crop,cross-pollination between accessionscan potentially occur during seed re-generation when numerous accessionsusually flower at the same time.
To estimate the outcrossing rate inOryza sativa and determine whether theplot design currently used at IRG forseed regeneration permits outcrossingbetween accessions, an experiment wasconducted at IRRI during the 1996 dryseason.
Five pairs of varieties were used(Table 1). All accessions used as thepollen source (male) had a purple-pigmented basal leaf sheath, whereaspollinated (female) accessions had agreen basal leaf sheath. Hybridseedlings showed purple pigmenta-tion. The pollen-receivers represented alarge range of variation for stigmalength and stigma exsertion and thepollinators were matched to the otheraccessions for plant height andflowering date criteria (Table 1).
Table 1. Accessions used in the experiment.
Female varieties (green) Male varieties (purple)
Accession Variety Source Stigma Stigma Plant Days to Accession Variety Source Plant Days tono. name exsertion length height 50% no. name height 50%
(%) (mm) (cm) flowering (cm) flowering
36951 BG 90-2 Sri Lanka 70.8 1.21 133 89 27334 Padi Kawaluhan Indonesia 141 893513 Red Rice Iran 69.2 1.87 130 80 46747 Tikanathi India 136 803375 Secano de Brazil El Salvador 68.1 1.88 135 80 58951 Dhanush Ban Nepal 138 802755 Tojo Japan 35.8 1.00 139 80 2325 Duk Zuk Zodo Korea 142 803432 CI 8898-2 Africa 32.2 1.03 145 80 3441 Mamoriaka Africa 152 80
Four different planting designs ortreatments were studied (Fig. 1). Allplots were separated from each otherby a 1.5-m-wide alley. Two replicationswere made for all treatments. Theexperimental plots were laid out suchthat pollen sources, especially intreatment T3, were oriented across thepredominant direction of the wind (Fig.1).
Seeds from the female plants werecollected from about 50-75 panicles per
treatment per pair of varieties, fromwhich 600-900 good seeds, dependingon availability, were germinated fortesting.
Varieties BG 90-2, Secano de Brazil,and Red Rice, with an averageoutcrossing rate across treatments of0.40%, 0.27%, and 0.35% (Table 2),respectively, were more subjected tooutcrossing than Tojo and CI 8898-2(0.02%) (Fig. 2). These three varietieshave longer and more exserted stigmas.
T0:Clippedpanicles
T1:Alternatehills
T2:Alternaterows
T3:Side-by-sideplots
Predominantwind
N
1. Planting designs tested in the experiment (x: male plants, : female plants).

6 IRRN 1998
Table 2. Average outcrossing rates (%) observed, by entry and treatment.a
Pollinated accession T0 T1 T2 T3 Av (by entry)
BG 90-2 0.83 0.50 0.25 0 0.40Tojo 0.08 0 0 0 0.02CI 8898-2 0.08 0 0 0 0.02Secano de Brazil 0.83 0.25 0 0 0.27Red Rice 0.92 0.50 0 0 0.35
aSee Fig. 1 for treatment details.
2. Outcrossing rates (%) observed for the different variety × planting design combinations.
This study also demonstrated thatcross-pollination can occur in farmers’fields where intentional or accidentalvarietal mixtures are grown, and cancontribute to the overall evolutionaryprocess of rice genetic resources. ■
1
0.9
0.8
0.7
0.6
0.5
0.4
0.3
0.2
0.1
0
RedRice BG 90-2
Secanode
Brazil
Tojo CI 8898-2
Outcrossing rate (%)
T0 (clipped panicles)
T1 (alternate hills)
T2 (alternate rows)
T3 (side-by-side plots)
The latter trait appeared to be the keytrait for the ability to receive exogenouspollen. Treatment T0 was the only onewhere outcrossing was observed for allvarieties; the outcrossing rate wasfound to be more correlated to stigmaexsertion (r = 0.977, P = 0.004) thanstigma length (r = 0.650, P = 0.25). OnlyBG 90-2, the variety with the mostexserted stigma, was cross-pollinatedin treatment T2. Outcrossing rate wasrelated to the proximity of male andfemale plants.
The highest outcrossing rates wereobserved in T0, where panicles wereclipped together (0.08-0.92%). Allfemale varieties showed cross-pollination in this design. The secondhighest frequency of hybrid seeds wasobserved in T1, where male and femaleplants were alternated (0-0.5%). Veryfew hybrid seeds were observed in T2(alternate rows). No hybrid wasobserved in T3 (side-by-side plots).
No outcrossing was observed in T3,which mimics the field design used bythe IRG to regenerate seeds. The expe-riment did not show that outcrossingdoes not occur during seed regenera-tion, but it strongly suggested that ifoutcrossing occurs, it occurs at a ratemuch lower than the 0.9% observedwhen panicles are clipped together.Moreover, during normal seed rege-neration, seeds are harvested only fromthe four middle rows out of the eightrows of each plot to decrease the risk ofoutcrossing. Overall, results did notsuggest any need to modify the designfor the next regeneration cycles.
Results from T1 showed that seedmixtures can be a significant source ofoutcrossing and must be avoided. Also,multiplication plots must be carefullymonitored to discard plants grownfrom seeds left from previousexperiments.
Genetic research
Phylogenetic relationship ofgenus Oryza as revealed byRAPD analysis
Z.W. Xie, Y. Zhou, Laboratory of Systematic andEvolutionary Botany, Institute of Botany, ChineseAcademy of Agricultural Sciences (CAAS),Beijing 100093; B.R. Lu, IRRI; Y.P. Zou and D.Y.Hong, CAAS
The agronomically important genusOryza L. includes some 20 wild and 2cultivated species and is divided intofour complexes based on morpho-logical and cytogenetical studies. Newmolecular approaches, such asrestriction fragment length poly-morphism (RFLP), internal transcribedspacer (ITS) sequencing, randomamplified polymorphic DNA (RAPD),and chloroplast sympo sequencerepeats (cpSSR), have been increasinglyemployed to assess phylogeneticrelationships of the genus, butcontroversy still exists with regard tospecies relationships. This studyapplied RAPD technology todetermine the phylogenetic relation-ships of Oryza and evaluate the valueand limitation of this technology inphylogenetic studies.
Total DNA was extracted from freshor dried leaves of 36 accessions repre-senting 23 Oryza taxa and 1 accessionfrom Porteresia coarctata and Leersiahexandra (see table). Polymerase chainreaction (PCR) RAPD was carried outon a Rapidcycler (ATC) in a volume of10 µL, containing 1.2 µmol L-1 primer, 5-10 ng µL-1 genomic DNA template, 50mmol L-1 Tris HCl (pH 8.3), 0.5 µg (L-1
BSA, 2 mmol L-1 MgCl2, 0.5U Taq DNApolymerase, 200 µmol L-1 dNTP, 1%Ficoll, and 1 mmol L-1 tartrazine. Thefirst program was two cycles of 1 min at

Vol. 23, No. 3 7
94 °C, 10 s at 35 °C, and 20 s at 72 °C,followed by 45 cycles of 2 s at 94 °C, 10 sat 35 °C, and 1 min at 72 °C. Thereaction was held at 72 °C for 4 min atthe end of the cycles. The RAPDproducts were electrophoresed in 1.5%agarose gels and then stained withethidium bromide.
Of the 30 randomly selectedprimers, 16 (OPL-01, 02, 03, 05, 07, 08,10, 11, 13, 14, 16, 18, 19, 20, and OPY-06and OPY-08) successfully showedamplified interspecific polymorphism.RAPD bands were scored as present (1)or absent (0), each of which was treatedas an independent character regardlessof its intensity. Inconsistent bands wereexcluded from the data analysis. Datawere compiled in a binary matrix forsimilarity-based analyses using theprogram of NTSYS-pc (Version 2.02a).The SIMQUAL program was used tocalculate Jaccard’s coefficient, acommon estimator of genetic identity,or to estimate interspecific relation-ships. Cluster analysis using thesimilarity estimates was performedwith the UPGMA method.
The 16 RAPD primers produced atotal of 368 fragments, ranging from200 to 2,000 bp. A high degree ofpolymorphism was revealed by a largenumber of fragments, including somespecies-specific or genome-specificones, indicating the usefulness ofRAPD variation in polygenetic studiesof rice species. The dendrogram (seefigure) generated from UPGMA agreedwell with the current grouping of Oryzaspecies by Vaughan (1989), but withsome exceptions. All species with AAgenome formed a single group,corresponding to the O. sativa complex.Species with BB, CC, BBCC, and CCDDgenomes formed a different group,corresponding to the O. officinaliscomplex. The O. ridleyi and O.meyeriana complexes were included inthe third group. O. brachyantha wasgrouped with O. schlechteri, and thenjoined Porteresia coarctata and Leersiahexandra to form another cluster (seefigure).
The cultivated O. sativa subsp.japonica and subsp. indica were closely
related to their putative ancestors, O.nivara and O. rufipogon. One accessionof O. nivara showed a higher affinity toO. sativa than to O. rufipogon or other O.nivara accessions. It was difficult toseparate O. nivara from O. rufipogonbased on the RAPD variation. Thissupports the results from rDNA ITSsequence analysis (Y. Zhou et al,unpub. data). Two accessions of O.glumaepatula showed cleardifferentiation from O. rufipogon or O.nivara, suggesting its independenttaxonomic status. The African cultigenO. glaberrima closely clustered with itsprogenitor O. barthii, supporting thehypothesis that the Asian and Africancultivated rice were domesticatedindependently. The subgroup of O.meridionalis and O. longistaminata wasrelatively separated from the other AA
genome species, which agrees with thetreatment of O. meridionalis and O.longistaminata as independent species.
In the second largest group with BB,BBCC, CC, and CCDD genome species,two accessions of diploid O. officinalis(CC) from China were clustered withO. minuta (BBCC), whereas anothertetraploid accession from the Philip-pines clustered with O. eichingeri and O.rhizomatis, indicating remarkabledifferentiation between the diploid andtetraploid O. officinalis. Three SouthAmerican species with CCDD genomesclustered together with the CC genomespecies, suggesting close affinity to theCCDD and CC genome species.
Noticeably, the EE genome O.australiensis formed an independentgroup, strongly indicating its uniqueorigin and differentiation from other
Accessions and origin of Porteresia, Leersia, and Oryza species used in this study.
Taxon Accession no. Genome Country of origin
O. sativa subsp. indica 951001 AA ChinaO. sativa subsp. japonica 951002 AA ChinaO. nivara (1) 100918a AA CambodiaO. nivara (2) 100195a AA MyanmarO. rufipogon (1) 940135 AA ChinaO. rufipogon (2) 940331 AA ChinaO. rufipogon (3) 940332 AA ChinaO. rufipogon (4) 102186a AA IndiaO. meridionalis (1) 103317a AA AustraliaO. meridionalis (2) 103321a AA AustraliaO. glumaepatula (1) 103810a AA VenezuelaO. glumaepatula (2) 100969a AA SurinamO. glaberrima 103056a AA MaliO. barthii (1) 101257a AA ChadO. barthii (2) 104140a AA CameroonO. longistaminata (1) 104075a AA NigeriaO. longistaminata (2) 101207a AA Côte d'IvoireO. punctata (2x) (1) 104071a BB CameroonO. punctata (4x) (2) 105607a BBCC ChadO. minuta 101082a BBCC PhilippinesO. officinalis (2x) (1) 940130 CC ChinaO. officinalis (2x) (2) 940198 CC ChinaO. officinalis (4x) (3) 105112a ? PhilippinesO. eichingeri 105182a CC Sri LankaO. rhizomatis 103421a CC Sri LankaO. alta 105143a CCDD GuyanaO. latifolia 105141a CCDD Costa RicaO. grandiglumis 105669a CCDD BrazilO. australiensis 105263a EE AustraliaO. meyeriana 104990a GG MalaysiaO. granulata (1) 100879a GG ChinaO. granulata (2) 940208 GG ChinaO. ridleyi 100877a HHJJ MalaysiaO. longiglumis 105148a HHJJ IndonesiaO. brachyantha 105151a FF Sierra LeoneO. schlechteri ? Papua New GuineaPorteresia coarctata 104502a ? BangladeshLeersia hexandra ? China
aMaterials obtained from IRRI with International Rice Genebank collection numbers.

8 IRRN 1998
Dendrogram produced from UPGMA cluster analysis of 38 accessions of Porteresia, Leersia,and Oryza species based on RAPD variation patterns. Accession number and origin of speciesfollowed the arrangement in the table.
species in the O. sativa and O. officinalisgroups. O. ridleyi and O. longiglumiswere closely related to each other andformed a group. In the O. meyerianacomplex, one accession of O. granulatafrom China clustered with O. meyerianaand another one from India with O.ridleyi and O. longiglumis, although theO. ridleyi and O. meyeriana complexeshad genome-specific repeated
sequences to distinguish one from theother. O. brachyantha and O. schlechteriwere unexpectedly clustered together.This result was different from previousreports. Furthermore, O. brachyanthaand O. schlechteri showed higheraffinities to Porteresia coarctata andLeersia hexandra than to other species inthe genus Oryza, and the four speciesunexpectedly joined together. ■
Genetic evaluation
Identification of an alternatecytoplasmic male sterile source inrice
T. Vanaja and V.V. Radhakrishnan, AgriculturalResearch Station, Mannuthy, Kerala 680651, India
Research is in progress in China, at IRRI,and elsewhere to diversify sources ofcytoplasmic male sterility (CMS) in rice.
To study gene action in high-yieldingrice varieties of diverse origin, 13 gene-tically distinct parents were selectedfrom nine clusters, comprising 56 ricegenotypes of different ecogeo-graphicorigin, formed through Mahalanobis D2statistics. Selected parents were sub-jected to full diallel crosses and F15 plantswere raised. Observations were taken onyield components.
Among 156 F1 progenies, we obtainedtwo highly sterile F1 progenies from thecrosses Vytila-3/IR36 and Vytila-3/Hraswa (Vytila-3 is an improved saline-resistant rice variety bred for Keralaconditions and Hraswa is an extra short-duration rice variety—70-75 d—recom-mended for cultivation in Kerala). The F1progenies of their reverse crosses—IR36/Vytila-3 and Hraswa/Vytila-3—werefully fertile. This suggested that Vytila-3possesses sterility-inducing cytoplasm.Percentage of pollen sterility wasestimated using iodine potassium iodidesolution; 70% pollen sterility was foundin both crosses using Vytila as the femaleparent.
Among the 100 BC1F1 progenies fromthe cross Vytila-3 × IR36 [(Vytila-3 × IR36)× IR36], 50% pollen sterility in 52% of theplants and 80-82% pollen sterility amongthe rest was observed. The segregation ofF2 progenies of the same cross (Vytila-3 ×IR36) was also analyzed for pollensterility. Of the 78 F2 progenies, 4 plantsshowed 100% sterility and 74 plantsshowed sterility ranging from 3% to 92%.
F2 progenies of the cross Vytila-3 ×Hraswa were also analyzed for pollensterility. The plants also exhibited a highrange of pollen sterility (from 5% to 80%).
0.122 0.342 0.561 0.781 1.000Similarity coefficient
Indica
Japonica
O. nivara (1)
O. rufipogon (2)
O. rufipogon (3)
O. rufipogon (4)
O. nivara (2)
O. rufipogon (1)
O. glumaepatula (1)
O. glumaepatula (2)
O. glaberrima
O. barthii (1)
O. barthii (2)
O. meridionalis1
O. meridionalis (2)
O. longistaminata
O. longistaminata
O. punctata (1)
O. punctata (2)
O. minuta
O. officinalis (2)
O. officinalis (1)
O. officinalis (3)
O. eichingeri
O. rhizomatis
O. alta
O. latifolia
O. grandiglumis
O. australiensis
O. meyeriana
O. granulata (1)
O. granulata (2)
O. ridleyi
O. longiglumis
O. brachyantha
O. schlechteri
Porteresia
Leersia

Vol. 23, No. 3 9
From the segregation progenies ofthe cross Vytila-3 × IR36, we were ableto isolate four completely CMS linessuitable for warm, humid climaticconditions at Kerala (Figs. 1 and 2).
Virmani et al (1985) reportedattaining a highly sterile BC4F1 progenyfrom the cross ARC13829-26/IR1079-2-3-1.
ReferenceVirmani SS, Raj KG, Casal C, Dalmacio RD,
Aurin PA. 1985. Rice genetics. Manila(Philippines): International RiceResearch Institute. 635 p. ■
1. 100% pollen sterility in F2 Vytila-3/IR36.
2. 92% pollen sterility in F2 Vytila-3/IR36.
IR42
0 10 20 30 40 50 60 70 80
60
50
40
30
20
10
Before submergence21 DAS
JalamagnaF1
F2
Plant height (cm)
IR42
20 30 40 50 60 70 80 90
50
40
30
20
10
0
30 DAS
JalamagnaF1
F2
Plant height (cm)
Frequency of plants
Frequency of plants
IR42
0 10 20 30 40 50 60 70 80
60
50
40
30
20
10
After submergence28 DAS
JalamagnaF1
F2
Plant height (cm)
Frequency of plants
90 100 110
50
40
30
20
10
Frequency of plants
37 DAS
IR42F1
F2
Jalamagna
30 40 50 60 70 80Plant height (cm)
90 100 110 120130 140 150
Frequency distribution of plant height (cm) in 21- and 30-d-old F2 populations of IR42/Jalamagna. Horizontal lines show the range of height of parents and F1s about the mean(solid circle).
Inheritance study of seedlingelongation in rice
P.M. Mohapatra, A.R. Panda, and S.N. Ratho,Genetics and Plant Breeding Division, CentralRice Research Institute (CRRI), Cuttack, Orissa,India
The inheritance of seedling elongationin rice was studied in the cross IR42(dwarf nonelongating)/Jalamagna (tallelongating) for two different ages of
and plant distribution was distinctlyunimodal, with a peak at 55 cm. Aftersubmergence, plant height ranged from30 to 110 cm, separating the populationinto elongating type (such asJalamagna) and nonelongating type(such as IR42); distribution was bi-modal. Of 235 F2 plants studied, 130were elongating and 105 were non-elongating, fitting the 9:7 ratio (χ2 =0.0818, P = 0.75-0.90).
For 30 DAS, seedling height variedfrom 20 to 75 cm before submergence.Plant distribution was unimodal. Aftersubmergence, distribution was clearlybimodal, with a wider height range of40-150 cm. Of 244 F2 plants, 148 wereelongating types and 96 were non-elongating types, which fitted the 9:7ratio χ2 = 1.924, P = 0.10-0.25).
Results suggested two dominantcomplementary genes responsible forseedling elongation in rice. Thepresence of both genes conferred anelongation ability similar to that ofJalamagna, and the absence of eithergene or both genes resulted in plantssuch as IR42, the nonelongatingparent. ■
seedlings (21 and 30 d old) under deepwater conditions during the 1995 wetseason at CRRI. Seedlings of F1 and F2and parental lines raised in smallgalvanized iron trays (size 50 × 40 cm)were submerged in a water tank. Seed-ling heights were taken just before sub-mergence. On the first day of sub-mergence, water depth was 40 cmwhich was raised the following day to80 cm and 90 cm for 21- and 30-d-oldseedlings, respectively. These levelswere maintained for 7 d.
Seedling heights were recorded afterdraining the tank. The mean heights ofF1 and the elongating parent (Jalamag-na) before submergence with 21- and30-d-old seedlings were 42 and 43 cm,and 48 and 47 cm, respectively (seefigure). The respective values aftersubmergence were 80 and 85 cm, and122 and 126 cm, respectively,suggesting the dominance ofelongation ability. The figure shows thefrequency distribution curves forheight. The segregation pattern forheight observed in the F2 before andafter submergence is described below.
For 21 DAS, seedling height beforesubmergence ranged from 20 to 70 cm

10 IRRN 1998
Studies on combining ability andheterosis in rice
P.V. Satyanarayana, Agricultural ResearchStation, Maruteru 534122, W.G. District, AndhraPradesh; I. Kumar, Pro Agro Co., Ltd.,Hyderabad; and M.S.S. Reddy, Genetics andPlant Breeding Department, College of Agricul-ture, APAU, Hyderabad, India
The usefulness of a particular cross inthe exploitation of heterosis in rice isjudged by analyzing combining ability.An attempt was made to understandthe nature of gene action governinggrain yield in heterotic F1 ricecombinations at the Directorate of RiceResearch in Hyderabad, India.
For this study, we used 33 genotypesas male parents to make 99 crosses withthree cytoplasmic male sterile lines—V20A, IR58025A, and IR62829A—in aline × tester mating design. The 138treatments of 99 F1s of 3 lines, 33 testers,and 2 traditional varieties—Jaya andRasi—were laid out in a randomizedcomplete block design (RCBD) withthree replications in the 1992 dry season(DS). Each treatment (plot) consisted ofone row of 15 plants, with one planthill-1 and 20 × 15-cm spacing. Fiveplants from each plot were randomlymeasured for yield and yieldcomponent analysis.
Analysis of variance indicated thatdifferences among treatments, whichincluded 36 parents and 99 hybrids,were highly significant for allcharacters studied, implying a highdegree of genetic differences in thematerial.
In general, variance due to specificcombining ability (SCA) was greaterthan that due to general combiningability (GCA) for the charactersstudied, indicating the predominanceof nonadditive gene interaction ingoverning yield and other relatedtraits. This offers the possibility ofexploiting heterosis.
Of the 99 F1s, 21 cross combinationsexhibited >20% yield advantage overthe best check Jaya. The table presentsthe performance, SCA effects of crosses,GCA effects of parents, and standard
Yield performance, SCA effects of crosses, GCA effects of parents, and standard heterosis in heterotic hybridcombinations identified, 1992 dry season.a
Yield plant-1 SCA effect GCA effect GCA effect StandardCode Cross combination (g) of female of male heterosis
(over Jaya)
A1/R31 IR58025A/Suweon 287 R 27.8 6.63** 1.46**H 4.96**H 75.9**A3/R15 IR62829A/Chianung Senyu 26.7 5.84** –0.13 A 6.21**H 68.4**A3/R26 IR62829A/Mahsuri 25.7 11.17** –0.13 A –0.11 A 62.8**A2/R5 IR58025A/IR46R 24.0 2.71* 1.46**H 5.11**A 51.8**A2/R17 IR58025A/Suweon 318R 24.0 4.94** 1.46**H 2.88**H 51.8**A2/R28 IR58025A/ARC11353R 23.0 4.88** 1.46** 1.94 A 45.6**A1/R30 V20A/UPR254-85-ITCA 22.6 6.75** –1.33**L 2.41*H 42.4**A2/R2 IR58025A/IR9761-19-1R 22.4 1.49 ns 1.46**H 4.66**H 41.1**A3/R4 IR62829A/Vajram R 22.3 2.69* –0.13 A 4.91**H 40.8**A3/R9 IR58025A/IR28178-70-2-3R 21.9 2.33 ns 1.46**H 3.36**H 38.7**A1/R22 V20A/IR2797-125 21.8 3.46** –1.33**L 4.78**H 37.9**A2/R32 IR58025A/HKR119 20.9 2.63* 1.46**H 2.15 A 32.3**A3/R11 IR62829A/IR35366-40-3-3R 20.8 4.67** –0.13 A 1.54 A 31.6**A3/R7 IR62829A/IR13419-13-1R 20.5 1.90 ns –0.13 A 3.96**H 29.8**A2/R15 IR58025A/Chianung Senyu 20.4 –1.95 ns 1.46**H 6.21**H 29.1**A2/R14 IR58025A/IET9311 20.3 2.50* 1.46**H 1.61 A 28.6**A1/R5 V20A/IR46R 19.7 1.17* –1.33**L 5.11**H 24.7**A1/R4 V20A/Vajram R 19.6 1.24 ns –1.33**L 4.94**H 24.2**A2/R7 IR58025A/IR13419-13-1R 19.6 –0.60 ns 1.46** 3.96**H 23.8**A1/R18 V20A/IRI361R 19.2 4.78** –1.33**L 0.96 A 21.5**A1/R2 V20A/IR9761-19-1R 19.0 0.95 ns –1.33**L 4.66**H 20.3**
a**, * = significant at l and 5% level, respectively; ns = not significant, H = high GCA effects, A = average, L = low GCA effects.
heterosis over Jaya. Thirteen of these 21superior crosses exhibited significantSCA effects. The other eight crossesregistered nonsignificant SCA effects.The cross A3/R26 had very high SCAeffects but did not rank high in yield.On the other hand, crosses A2/R31 andA3/R15 showed a very high meanyield performance with moderatelysignificant SCA effects. Crosses withnonsignificant SCA effects performedbetter than some crosses withsignificant SCA effects (such as A2/R31, A3/R11, A2/R14, A2/R18, etc.).
These results clearly indicated thathigh-yielding hybrids need not be theones with high SCA effects and viceversa as reported earlier.
Results showed that of 13 crosseswith significant SCA effects, 10 crossesinvolved one parent with high GCAeffects and others had either high,average, or low combining abilityeffects (see table). This indicatesadditive as well as nonadditive geneticinteractions operating in the crossesstudied. ■
Breeding methods — tissue culture
Effects of L-tryptophan,L-proline, and activated charcoalon plant regeneration in indicarice (Oryza sativa L.)
A.K. Sahrawat and S. Chand, Plant TissueCulture and Genetics Research Group, School ofLife Sciences, Devi Ahilya University, KhandwaRoad Campus, Indore 452001, India
Production and maintenance ofembryogenic calli and subsequentplant regeneration in higher frequency
are important aspects of tissue culture.A rapid decrease in morphogeneticcapacity with age in culture has oftenbeen observed. To overcome thisproblem, several methods have beensuggested. We report the promotiveeffect of L-tryptophan, L-proline, andactivated charcoal on plantregeneration in long-term calluscultures of indica rice.
Callus cultures were raised from 4-d-old coleoptile tissue of indica rice(Oryza sativa L. cv Kasturi). Mature

Vol. 23, No. 3 11
seeds were surface-sterilized and keptfor germination on MS0 medium (MSwithout any growth hormone) for thefirst 2 d in the dark at 26 ± 2 °C and thentransferred to 16 h/8 h light/dark.Coleoptile tissues (1 cm long) weredissected from 4-d-old germinatingseeds and cultured on MS mediumcontaining 0.5 mg kinetin L-1 and 2.5mg 2,4-D L-1 (MS1).
Cultures were initially incubated inthe dark at 24 ±2 °C for 3 wk and thentransferred to a fresh medium and keptunder 16 h/8 h light/dark for the next3 wk. After 6 wk, embryogenic calliwere divided into small pieces andtrans-ferred to various maintenancemedia (see table) for 8 mo before they
Effects of L-tryptophan, L-proline, and activated charcoal (added to MS medium) on plant regeneration fromlong-term callus cultures of indica rice.
Maintenance Calli forming Calli forming Greenmedium (mg L-1) shoot buds shoots (%) plantlets+ (supplements)a (no.) (no.)
MS1 5 23.8 7MS1 + L-tryptophan (100) 9 42.8 33MS1 + L-tryptophan (100) + activated charcoal (1%) 15 71.4 80MS1 + L-proline (100) 8 39.0 35MS1 + L- proline (100) + activated charcoal (1%) 14 66.7 65
aMaintenance media (MS1) = MS + 0.5 mg L–1 2,4-D + 0.5 mg L–1 kinetin. Regeneration media = MS + 0.5 mg IAA L-1 + 4.0 mgBAP L-1. Data are average of three replications treatment-1; each treatment consists of seven calli (average weight 0.29 greplicate-1). In each case, 21 calli were plated. The experiment was repeated two times.
1. Nodular and embryogenic calli after 20 dof culture initiation.
3. Multiple shoot proliferation on MSmedium containing 0.5 mg IAA L-1 + 4.0 mgBAP L-1 (after 28 d of transfer).
2. Initiation of somatic embryoid-like struc-tures from embryogenic callus on MS1, amaintenance medium containing 0.5 mg2,4-D L-1 + 0.5 mg kinetin L-1 + 100 mgL-tryptophan L-1.
were transferred to the regenerationmedium, MS + 0.5 mg IAA L-1 + 4.0 mgBAP L-1.
Callus initiation was observed after4 d of inoculation. Compact andglobular embryogenic calli were clearlyvisible after 20 d of culture initiation(Fig. 1). The first 45 embryogenic calliclumps were transferred on variousmaintenance media where they weresubcultured at 4-wk intervals for 8 mo.During maintenance, somaticembryoid-like structures (Fig. 2) wereobserved on a maintenance medium(MS1) containing 100 mg L-tryptophanL-1.
After 8 mo, calli maintained onmedium containing L-tryptophan, L-
proline, and activated charcoalremained embryogenic. Nearly half ofthe calli clumps (24 of 45 embryogeniccalli clumps) maintained without L-tryptophan, L-proline, and activatedcharcoal turned blackish and lost theirembryogenic potential. When theremaining embryogenic calli clumps(approximate wt 0.29 g) were trans-ferred to the regeneration medium (MS+ 0.5 mg IAA L-1 + 4.0 mg BAP L-1), afew calli clumps (23.8%) showed greenshoot bud induction after 14 d. Amongcalli clumps obtained from a mediumcontaining L-tryptophan and activatedcharcoal, 71.4% showed green shootbud after 8 d of transfer on a regene-ration medium. These shoot budsfurther proliferated into multipleshoots (Fig. 3).
The maximum average number ofplantlets (5.3 per calli clump) wasrecovered from calli clumpsmaintained on a medium containing100 mg L-tryptophan L-1 and 1%activated charcoal. A maintenancemedium containing L-proline (100 mgL-1) and activated charcoal (1%) wassuitable for regenerating greenplantlets. Regenerated plantlets werecounted after 6 wk of subculture. Calliclumps maintained without L-tryptophan, L-proline, and activatedcharcoal produced only 1.3 plantletsper calli clump. The regeneratedplantlets were rooted on MS medium

12 IRRN 1998
4. Regenerated plantlets showing rootingon MS medium containing 1.0 mg IBA L-1.
containing 1.0 mg IBA L-1 (Fig. 4) andwere transferred to pots.
Results indicated the usefulness ofL-tryptophan and activated charcoal inincreasing regeneration of green plantsfrom long-term callus cultures of indicarice. ■
Grain quality
Modeling water uptake anddegree of polish of milled rice
J.P. Pandey, Post Harvest Process and FoodEngineering Department, College of Technology,G.B. Pant University of Agriculture and Technol-ogy, Pantnagar, 263145 Nagar, India
This study was undertaken to modelthe process of water uptake behaviorduring cooking and to correlate wateruptake with degree of polish for twovarieties (coarse Jaya and scented fineBasmati) commonly grown in thewestern part of Uttar Pradesh, India.Rough rice samples were collectedfrom a farmer’s field just after harvest,cleaned, and shade-dried up to millingmoisture content (14% dry basis). Thesewere then shelled and polished in a
Satake rice sheller and polisher.Milling/polish time varied from 0 s to60 s to control the degree of branremoval (degree of polish) with anincrement of 15 s. The degree of polishof milled samples ranged from 2.7% to8.4% for Jaya and 2.9% to 8.5% forBasmati at 15 s and 60 s, respectively.
The 1,000-kernel weight of Jaya(28.6 g) was higher than that of Basmati(24.5 g). The length and width-thickness ratio of Jaya were 8.67 mmand 3.04 mm, respectively, and those ofBasmati were 11.09 mm and 5.13 mm.The angle of repose of Basmati (32°)was wider than Jaya’s (24.8°). Bulk andtrue density were determined bymeasuring the weight of knownvolumes of samples and by the methodof relative density, respectively.Porosity, the index of void space in thebulk, was calculated as follows:
(True density – bulk density)Porosity = 100 (1)
True density
Table 1 shows the bulk density, truedensity, and porosity of the two ricevarieties.
Table 1. Physical and gravimetric properties of Jayaand Basmati rice.
Property Jaya Basmati
Size (mm)Length 8.7 11.1Width 2.8 2.0Thickness 2.0 1.8
1,000-kernel weight (g) 28.6 24.5Bulk density (g cc–1) 0.6 0.5True density (g cc–1) 1.3 1.0Porosity (%) 51.2 51.4Angle of repose(°) 24.8 32.6
Table 2. Degree of polish, head yield, and wateruptake of Jaya and Basmati rice varieties.
Time of Jaya Basmatimilling(s) Dp
a Hy Wup Dp Hy Wup
0 0 89.0 – 0 85.0 –15 2.7 64.3 355 2.9 65.1 35230 4.6 61.9 357 4.9 63.9 36245 6.7 58.1 362 6.4 63.1 37160 8.4 57.2 368 8.5 63.0 384
aDp = degree of polish (% on brown rice basis), H
y = head
yield (%), and Wup = water uptake (g).
Water uptake and kernel elongationafter cooking were also determined(Table 2). Kernel elongation was 35%more in Basmati than in Jaya for 6%degree of polish. A similar observationwas recorded for different samples ofmilled rice. Water uptake was found tobe more for the same degree of polishfor Basmati than for Jaya. Water uptakebehavior for Jaya and Basmati can bedescribed by the following equation:
Wup = A × eB Dp (2)
where A = 1.71 and B = 0.91.This mathematical expression
describes the kinetics of water uptake(mL) and its relation with degree ofpolish (%) satisfactorily under obtain-able conditions. The correlation coeffi-cient and standard error of estimate forthe above equation were 0.987 and0.089, respectively. ■
Breeding of Gan wan nuo 5,a new high-quality glutinousindica variety
F.S. Cao, S.F. Yang, and S.L. Yang, ApplicationInstitute of Atomic Energy, Jiangxi Academy ofAgricultural Sciences, Nanchang 330200, China
Gan wan nuo 5, released in 1993 by theJiangxi Provincial Seed Board, is a newglutinous indica rice variety with highquality. It was derived from the crossMY82166/Ma ba xian nuo. MY82166 isan indica rice with high resistance toblast, whereas Ma ba xian nuo is anaromatic glutinous indica variety.Gan wan nuo 5 is suitable for laterseason planting in the double-croppedarea of southern China and single-cropped area of central China. Yield ofthis variety averaged 6.8 t ha-1 indouble-cropped areas; it was 7.5 t ha-1
in single-cropped areas. This yield was7% more than that of Jing Nuo 6, aglutinous check, and nearly the same asthat of Shan you 63, a check hybrid.Because of its high quality and othergood traits (see table), the award-winning Gan wan nuo 5 is replacingJing Nuo 6 in many areas.

Vol. 23, No. 3 13
Major traits of Gan wan nuo 5, Rice Research Insti-tute of China, 1992.
Trait Value
Brown rice (%) 79.7Milled rice recovery (%) 69.7Head rice (%) 58.2Kernel length(mm) 5.5L-W ratio 2.2Alkali spreading value 6Gel consistency (mm) 100Amylose content (%) 1.6Protein content of head rice (%) 8.0
Gan wan nuo 5 has a strong, 120-cm-long stem. It has a growth duration of135-140 d in single-cropped areas. Thevariety has high yield potential withgood irrigation and good management.
Gan wan nuo 5 has a 1,000-grainweight of 25.3 g, panicle length of 24.9cm, and 141 filled grains panicle–1. Thevariety is used for making stuffeddumplings, cakes, and sweet wines.
Gan wan nuo 5 is widely plantedand is spreading quickly in southernand central China. A total area of 70,000ha was devoted to the crop from 1992 to1998. ■
Pest resistance —diseases
Inheritance of resistance tobacterial leaf blight in differen-tial rice variety Asominori
K. Ise, Japan International Research Center forAgricultural Sciences (JIRCAS), Tsukuba, Ibaraki3058686, Japan; C.Y. Li, Y.Q. Sun, and C.R. Ye,Yunnan Academy for Agricultural Sciences(YAAS), Kunming, Yunnan, China
Asominori is one of the internationaldifferentials used for testing thepathogenicity of the bacterial leaf blight(BLB) pathogen, Xanthomonas oryzae pv.oryzae. It has been one of the varietiesmost resistant to BLB in Japan since itsrelease in 1973. Extensive testing underthe JIRCAS and YAAS collaborativeresearch project on rice geneticresources between 1994 and 1996showed that Asominori has stableresistance to BLB in both indica and
japonica rice-growing areas in Yunnan,China. Hence, Asominori is considereda useful source of durable resistance toBLB. We found that Asominori has anallele of the Xa1 locus on chromosome 4for BLB resistance, although it has beenreported to harbor Xa17 independentfrom Xa1.
First, we found that Asominori grainshowed a positive reaction to phenolsolution, even though almost alljaponica varieties in Japan have beenreported to show negative reactions.The trait was inherited as a monogeniccharacter in F2 plants betweenAsominori and varieties Kogyoku andSt No. 1, which showed a negativereaction to phenol. No segregant had anegative reaction to phenol in the F3seeds of each F2 plant (n = 240) betweenAsominori and a near-isogenic line ofTaichung 65 with a marker Ph,suggesting that Asominori had the Phgene on chromosome 4.
To further test the associationbetween phenol reaction of grains andresistance to BLB, we screened 16varieties or breeding lines in thepedigree of Asominori. Only Saikai 85displayed a positive phenol reaction
and resistance to BLB isolates. None ofthe other 15 varieties/lines (Tadukan,Senbonasahi, Pi No. 2, Saikai 97,Jikkoku, Zensho 26, Benisengoku,Chukyoasahi, Ojo, Saikai 59, Chujo 2,Norin 22, Tozan 38, Shinyamabuki, andSachikaze) showed either of the twotraits.
Second, BLB resistance of thevarieties and their hybrids wasevaluated by the clipping inoculationmethod around the heading stage in arice field. Table 1 shows the reaction ofparental varieties, F1, and F2 plants. Allthe F1 plants were resistant to BLBisolates T7174 (race I), H9153 (race II-2),and H75304 (race V), which werecollected in Japan. The segregationratios in the F2 populations were 3(resistant): 1 (susceptible), suggestingthat BLB resistance in Asominori wascontrolled by a single dominant gene.The BLB resistance gene of Asominoriand Ph was closely linked with arecombination value of 2.4% in thecoupling phase; all the segregationratios were consistent with the geneticmodel (Table 2). This value was alsoconsistent with the 2.8% recombinationbetween Ph and Xa1 reported earlier
Table 1. Segregation for reaction to BLB isolates in F2 populations between Asominori, Kogyoku, and St No. 1.
Variety or cross combination Number of plants for each reaction toT7174, H9153, and H75304a Goodness of fit to 3:1
RRR RSR SSS Total χ2 Probability
Asominori 15 0 0 15Kogyoku 0 15 0 15St No. 1 0 0 15 15Asominori/Kogyoku (F1) 3 0 0 3Asominori/St No.1 (F1) 5 0 0 5Asominori/Kogyoku (F2) 296 94 0 390 0.168 0.6-0.7Asominori/St No.1 (F2) 50 0 24 74 2.180 0.1-0.2Asominori/St No.1 (F2) 265b 0 73b 338 2.087 0.1-0.2
aR = resistant, S = susceptible, RRR stands for resistant reaction to three BLB isolates used, respectively. bInoculated by isolatesT7174 and H75304 only.
Table 2. Linkage relationship between BLB resistance and a genetic marker Ph in F2 populations betweenAsominori, Kogyoku, and St No. 1.
Cross combination (F2) Segregation modea Recombination Goodness of fitvalue ± SE (%)b
AB Ab aB ab χ2 Probability
Asominori/Kogyoku 292 4 5 89 2.37 ± 0.78 0.335 0.9-1.0Asominori/St No. 1 49 1 1 23 2.48 ± 1.83 2.254 0.5-0.6
aA = a dominant gene for BLB resistance in Asominori; B = Ph gene for phenol reaction. bWeighted mean of recombination valuesis 2.4% in a coupling phase.

14 IRRN 1998
using Japanese and IRRI varieties.Furthermore, we did not observe asegregant susceptible to isolates T7174and H75304 in the F2 plants (n = 390)and to isolate T7174 in the F3 (n = 880)from Asominori/Kogyoku harboringthe resistance gene Xa1. Thus, weconcluded that Asominori had an alleleat the Xa1 locus controlling resistanceto the three BLB isolates.
Another allele at the Xa1 locus, Xa1-h, was previously reported in IRRIvarieties IR28, IR29, and IR30. The Xa1-
h allele differs from the Xa1 of Kogyokuin that Xa1-h shows high resistance toBLB race I at both the seedling andadult stages, whereas Xa1 showsunstable resistance at the seedling stageand high resistance at the adult stage.The resistance of IR28, IR29, IR30, andKogyoku to BLB race V was controllednot by the alleles of Xa1, but by those ofXa12 closely linked with Xa1. The alleleof Asominori on the Xa1 locus,however, displayed high resistance toraces I and V at both the seedling and
adult stages. Therefore, we tentativelydesignated the Xa1 allele responsiblefor the high resistance in Asominori asXa1-as(t).
Asominori with Xa1-as(t) has beenhighly resistant to BLB for more than 20yr whereas Kogyoku and Asakaze withXa1 showed a breakdown in resistance.We are developing near-isogenic lineson Xa1-as(t) to clarify the relationshipbetween the durability of Asominori’sresistance and the pleiotropic effects ofXa1-as(t). ■
Potential sources of resistanceagainst RGSV-2 in wild ricegermplasm
E. Coloquio, R.C. Cabunagan, and O. Azzam,IRRI
IRRI varieties released after IR28possess a source of resistance fromOryza nivara against rice grassy stuntvirus, RGSV-1 strain. Although theresistance seems to be durable, thepresence of a resistance-breakingstrain, RGSV-2 (Hibino et al 1985),raises concerns about possibleoutbreaks if no new sources ofresistance are found. Since 1985, about12,000 accessions have been screenedagainst the two strains, but no suitableresistance sources have been identified(Koganezawa 1994). Thus, during 1996-97, a collection of wild rice species wasscreened for RGSV-2 using thestandard mass-screening cage method(Ling et al 1970) and some accessions,which showed low visual scores, wereevaluated further using the enzyme-linked immunosorbent assay (ELISA).
Based on ELISA scores, several O.officinalis accessions from thePhilippines, Indonesia, Malaysia,Brunei, and Thailand, O. minuta fromthe Philippines, and O. punctata fromNigeria showed 0% infection (Table 1).Because all these species are alsoresistant to the three brownplanthopper (BPH) biotypes, however,it is difficult to predict whether theresistance is targeted against the virusor the vector. Two O. nivara accessions
Table 1. Mass screening of wild rice species for resistance to RGSV-2.
Accession Wild rice species Origin Biotype ELISAno.
BPH 1 BPH 2 BPH 3 n Score % infection
100115 O. brachyantha Guinea 22 14 64100139 O. glaberrima Africa 19 18 95100153 O. glaberrima Africa 34 31 91100170 O. latifolia Costa Rica 3 3 3 25 20 80100180 O. officinalis Malaysia 1 3 3 21 1 5100882 O. australiensis Unknown 1 3 3 26 19 73100890 O. latifolia India 7 7 9 24 16 67100937 O. punctata Ghana 1 3 3 4 1 25100956 O. latifolia India 3 5 7 23 20 87100961 O. glumaepatula Cuba 19 4 21101074 O. officinalis Philippines 1 3 3 17 0 0101089 O. minuta Philippines 3 3 3 26 0 0101234 O. brachyantha Sierra Leone 3 3 3 23 2 9101330 O. punctata Nigeria 2 0 0101408 O. punctata Ghana 3 1 3 25 20 80101417 O. punctata Kenya 1 5 9 17 5 29101466 O. meridionalis Australia 9 9 9 32 28 88102569 O. glaberrima Liberia 24 21 88103437 O. glaberrima Senegal 9 9 9 6 6 100103801 O. officinalis Indonesia 1 1 1 6 0 0103888 O. punctata Tanzania 3 3 1 25 4 16103889 O. punctata Tanzania 3 3 1 28 24 86103896 O. punctata Tanzania 3 3 1 5 4 80104059 O. punctata Nigeria 1 3 1 28 0 0104064 O. punctata Nigeria 1 5 1 19 3 16104672 O. officinalis Malaysia 3 3 3 31 0 0104974 O. punctata Kenya 9 7 78105100 O. officinalis Brunei 1 1 1 33 29 88105102 O. officinalis Brunei 1 1 1 21 0 0105145 O. latifolia Colombia 38 32 84105227 O. rufipogon Thailand 6 6 100105240 O. rufipogon Thailand 14 14 100105250 O. rufipogon Thailand 29 27 93105303 O. meridionalis Australia 25 22 88105327 O. nivara India 11 10 91105365 O. officinalis Thailand 25 0 0105417 O. nivara Sri Lanka 23 17 74105425 O. rufipogon Sri Lanka 16 1 6105662 O. glumaepatula Brazil 21 19 90105823 O. rufipogon Thailand 14 3 21105845 O. nivara Thailand 13 7 54105846 O. nivara/O. sativa Thailand 25 17 68105848 O. rufipogon Thailand 9 6 67105855 O. rufipogon Bangladesh 31 22 71105891 O. rufipogon Bangladesh 10 8 80105893 O. nivara/O. sativa Bangladesh 30 27 90105 TN1 Taiwan 40 40 100

Vol. 23, No. 3 15
Table 2. Mass screening of O. nivara germplasm collection for resistance to RGSV-2.
Accession Biotype Visual score ELISA scoreno. Wild rice species Origin
BPH 1 BPH 2 BPH 3 n % infection n % infection
100195 O. nivara Myanmar 9 7 3 15 67100196 O. nivara Myanmar 17 64100196 O. nivara Myanmar 6 83100200 O. nivara/O. sativa Myanmar 9 9 9 18 78100593 O. nivara Taiwan 5 80100899 O. nivara India 9 9 9 18 89100899 O. nivara India 9 9 9 5 40100900 O. nivara/O. rufipogon India 9 9 9 15 27 13 61100902 O. nivara/O. rufipogon India 9 9 9 19 63100911 O. nivara/O. rufipogon Thailand 7 9 9 17 35 17 35100912 O. nivara/O. rufipogon Thailand 9 9 9 32 75100918 O. nivara Cambodia 3 9 9 4 50 4 75100918 O. nivara Cambodia 3 9 9 5 40100946 O. sativa/O. nivara India 9 9 9 28 61 28 21100951 O. nivara Unknown 4 50101508 O. nivara India 9 9 7 13 38101962 O. rufipogon/O. nivara India 9 9 9 25 24 21 57101978 O. nivara India 9 9 9 27 96101994 O. nivara Sri Lanka 9 9 7 11 27102165 O. nivara India 3 1 5 11 36102169 O. nivara India 3 3 3 2 50102171 O. nivara India 10 30102174 O. nivara India 9 9 9 26 27102176 O. nivara India 3 1 3 14 28102178 O. nivara India 3 1 3 1 0102179 O. nivara India 3 3 3 8 25103407 O. nivara Sri Lanka 9 7 7 22 27103415 O. nivara Sri Lanka 20 25103416 O. nivara Sri Lanka 3 9 9 18 22103418 O. nivara Sri Lanka 3 9 3 67103419 O. nivara Sri Lanka 3 3 5 12 50103420 O. nivara Sri Lanka 9 9 13 8103821 O. nivara China 7 7 7 13 46103830 O. nivara Bangladesh 9 9 9 13 23103834 O. nivara Bangladesh 9 9 9 16 19103835 O. nivara Bangladesh 9 9 9 12 0103838 O. nivara Bangladesh 9 9 9 4 75103840 O. nivara Bangladesh 9 9 9 11 18104309 O. nivara Thailand 5 9 5 12 58104443 O. nivara Thailand 9 9 9 4 0 4 50105316 O. nivara India 15 20 13 23105789 O. nivara Thailand 24 54105790 O. nivara Thailand 16 81105794 O. nivara Thailand 35 94105796 O. nivara Thailand 11 54 11 72105797 O. nivara Thailand 37 100105801 O. nivara Thailand 35 100105803 O. nivara Thailand 28 89105810 O. nivara Thailand 20 65105811 O. nivara Thailand 18 28 18 39105814 O. nivara Thailand 13 38 13 61105815 O. nivara Thailand 22 72105817 O. nivara/O. spontanea Thailand 30 77105818 O. nivara Thailand 25 80105821 O. nivara Thailand 34 73105822 O. nivara Thailand 20 30 17 29105824 O. nivara Thailand 14 64105825 O. nivara Thailand 17 52 16 31105828 O. nivara Thailand 32 65105833 O. nivara Thailand 18 33 16 31105835 O. nivara/O. sativa Thailand 30 50 27 62105841 O. nivara Thailand 12 42 11 45105852 O. nivara Thailand 38 92105859 O. nivara Thailand 9 88105862 O. nivara Thailand 27 62105863 O. nivara Thailand 24 70105864 O. nivara Thailand 31 67105865 O. nivara Thailand 15 67105866 O. nivara Thailand 10 20 8 62105868 O. nivara Thailand 20 50 20 75105 TN1 Taiwan 40 40 40 100

16 IRRN 1998
from Bangladesh (IRGC 103835 andIRGC 105316) and a cross between O.sativa and O. nivara (IRGC 105316),which showed less than 30% infection(Table 2) based on visual scores andELISA, could be considered aspotential resistance donor lines.Because O. nivara is susceptible to BPH,the resistance could be against thevirus.
ReferencesHibino H, Cabauatan PO, Omura T,
Tsuchizaki T. 1985. Rice grassy stuntvirus strain causing tungro-likesymptom in the Philippines. PlantDis. 69(6):538-541.
Koganezawa H. 1994. Type ofresistance to rice viruses. Paperpresented at a workshop onresistance to rice viruses,International Rice ResearchInstitute, Los Baños, Laguna,Philippines.
Ling KC, Aguiero VM, Lee SH. 1970. Amass screening method for testingresistance to grassy stunt disease ofrice. Plant Dis. Rep. 54(7):565-569. ■
Green leafhopper-susceptibleadvanced lines resistant to ricetungro viruses
E.R. Tiongco, H.C. Martin, S.E. Abdula, X.A.Truong, A.E. Villanueva, L.S. Sebastian, Philip-pine Rice Research Institute, Muñoz, NuevaEcija, Philippines; and E.R. Angeles and G.S.Khush, IRRI
Eight rice varieties and lines suscepti-ble to green leafhoppers were tested infield plots in Muñoz, Nueva Ecija, andMidsayap, North Cotabato, for theirreactions to tungro viruses. IR26,TKM6, Utri Merah, IR69705-1-1-3-2-1,IR69706-1-4-2-5-2-2, IR73889-5-1-1-1-1-1-2, IR1561-228-3-3, and TN1 (control)were tested during the 1996 wet season(WS), 1997 dry season (DS), and 1997WS cropping. They were planted in 4 ×4-m plots laid out in a randomizedcomplete block design with fourreplications. All rice hills were scored
visually for disease incidence at 30 and60 d after transplanting (DAT).
Leaf samples of each entry from fivequadrats in an × pattern with nine hillseach were also taken in all replicates inthe same period for enzyme-linkedimmunosorbent assay (ELISA) to deter-mine the presence of rice tungro bacilli-form virus (RTBV) and rice tungrospherical virus (RTSV). Each leafsample was crushed in a leaf and budpress (Eijkelkamp Agrisearch Equip-ment, The Netherlands) and leaf sapwas extracted with 1 mL of 0.1 Mphosphate buffer (pH 7) containing0.15 M NaCl and 0.05% Tween 20. ForELISA, the microtiter plate (Costar,Cambridge, MA) was coated byimmunoglobulin (courtesy of IRRI) at0.5 µg mL-1 for RTBV and 1 µg mL-1 forRTSV. The immunoglobulin-alkalinephosphate conjugate was diluted 1,000times for RTBV and 500 times for RTSV.For each plate, four wells were set asidefor the extracts of healthy TN1 leaves,along with one well for extracts ofRTBV + RTSV-infected TN1 leaves andone well with the extraction buffer forthe control. The presence of tungroviruses in the extracts was determinedby measuring the absorbance at 405 nmin a MicroELISA reader (Bio-Rad 3550).Absorbance of more than twice themean of four healthy control readingswas considered positive.
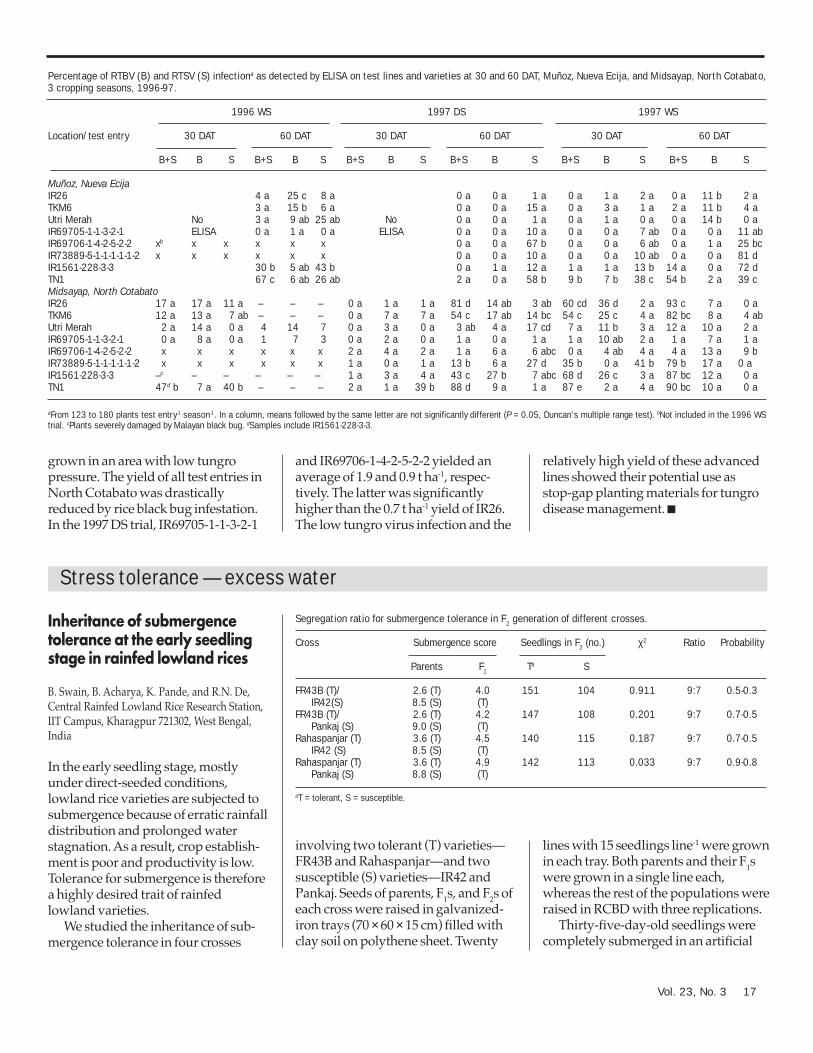
At the Nueva Ecija site, very lowtungro incidence based on symptomswas recorded at 30 DAT during thethree seasons (data not shown).Because of the very low diseaseincidence observed and the limitedsupply of antiserum, the 1996 WS and1997 DS samples, taken at 30 DAT atthis site, were not tested by ELISA.
The ELISA results of the 1997 WSsamples taken at 30 DAT also showedlow rates of RTBV + RTSV and RTBVinfection. During this period, moreinfection by RTSV alone than by RTBV+ RTSV and RTBV alone was recordedin most entries and was significantlyhigh in TN1. Increased infection byeither RTSV and RTBV or both wasobserved in all entries at 60 DAT. IR26,TKM6, Utri Merah, IR69705-1-1-3-2-1,
and IR69706-1-4-2-5-2-2 showedsignificantly lower infection by RTBV +RTSV compared with other entries. The1996 and 1997 WS trials had higherrates of RTBV + RTSV infection at 60DAT than the 1997 DS trial whereinfection by mostly RTSV alone wasobtained (see table). This confirmedprevious observations of low tungroincidence in the DS and at the earlystage of crop growth, especially in areaswith a low level of disease pressure.
In North Cotabato during the 1996and 1997 WS trials, significantly higherRTBV + RTSV infection on TN1 wasobtained as early as 30 DAT. Moresingle infections of RTSV or RTBV,rather than dual infection, wereobtained at 30 DAT in the 1997 DS trial,with significantly higher infection byRTSV alone observed on TN1 than onother test entries. This again showedthe prevalence of dual infection duringthe WS crop. Although higher tungroinfection occurred at 30 DAT in NorthCotabato than in Nueva Ecija, UtriMerah and its derivatives, IR69705-1-1-3-2-1 and IR69706-1-4-2-5-2-2,maintained their low infection even at60 DAT regardless of season (see table).IR26 and TKM6 recorded high RTBV +RTSV infection at 60 DAT during the1997 DS and 1997 WS trials, in contrastto their low infection in Nueva Ecijaduring the same period, indicating thatthese varieties succumbed to tungrounder high disease pressure orpresence of a virus strain that can infectthese varieties. During the trials, visualscoring of the plants was difficult at 60DAT due to the effects of rice black bug(Scotinophara coarctata F.) infestation,which severely damaged the plants,especially in the 1996 WS trial, in whichmost plants died.
The average yield of 3.6 t ha-1 ofIR69705-1-1-3-2-1 during the 1996 WStrial in Nueva Ecija was not signi-ficantly different from the 4.0 t ha-1 yieldof IR26 (a high-yielding variety).Similarly, IR69706-1-4-2-5-2-2 yielded4.0 t ha-1 in the 1997 DS trial at the samelocation. These results showed that theyield of test varieties is on a par withthat of a high-yielding variety when
Vol. 23, No. 3 17
grown in an area with low tungropressure. The yield of all test entries inNorth Cotabato was drasticallyreduced by rice black bug infestation.In the 1997 DS trial, IR69705-1-1-3-2-1
Percentage of RTBV (B) and RTSV (S) infectiona as detected by ELISA on test lines and varieties at 30 and 60 DAT, Muñoz, Nueva Ecija, and Midsayap, North Cotabato,3 cropping seasons, 1996-97.
1996 WS 1997 DS 1997 WS
Location/test entry 30 DAT 60 DAT 30 DAT 60 DAT 30 DAT 60 DAT
B+S B S B+S B S B+S B S B+S B S B+S B S B+S B S
Muñoz, Nueva EcijaIR26 4 a 25 c 8 a 0 a 0 a 1 a 0 a 1 a 2 a 0 a 11 b 2 aTKM6 3 a 15 b 6 a 0 a 0 a 15 a 0 a 3 a 1 a 2 a 11 b 4 aUtri Merah No 3 a 9 ab 25 ab No 0 a 0 a 1 a 0 a 1 a 0 a 0 a 14 b 0 aIR69705-1-1-3-2-1 ELISA 0 a 1 a 0 a ELISA 0 a 0 a 10 a 0 a 0 a 7 ab 0 a 0 a 11 abIR69706-1-4-2-5-2-2 xb x x x x x 0 a 0 a 67 b 0 a 0 a 6 ab 0 a 1 a 25 bcIR73889-5-1-1-1-1-1-2 x x x x x x 0 a 0 a 10 a 0 a 0 a 10 ab 0 a 0 a 81 dIR1561-228-3-3 30 b 5 ab 43 b 0 a 1 a 12 a 1 a 1 a 13 b 14 a 0 a 72 dTN1 67 c 6 ab 26 ab 2 a 0 a 58 b 9 b 7 b 38 c 54 b 2 a 39 cMidsayap, North CotabatoIR26 17 a 17 a 11 a – – – 0 a 1 a 1 a 81 d 14 ab 3 ab 60 cd 36 d 2 a 93 c 7 a 0 aTKM6 12 a 13 a 7 ab – – – 0 a 7 a 7 a 54 c 17 ab 14 bc 54 c 25 c 4 a 82 bc 8 a 4 abUtri Merah 2 a 14 a 0 a 4 14 7 0 a 3 a 0 a 3 ab 4 a 17 cd 7 a 11 b 3 a 12 a 10 a 2 aIR69705-1-1-3-2-1 0 a 8 a 0 a 1 7 3 0 a 2 a 0 a 1 a 0 a 1 a 1 a 10 ab 2 a 1 a 7 a 1 aIR69706-1-4-2-5-2-2 x x x x x x 2 a 4 a 2 a 1 a 6 a 6 abc 0 a 4 ab 4 a 4 a 13 a 9 bIR73889-5-1-1-1-1-1-2 x x x x x x 1 a 0 a 1 a 13 b 6 a 27 d 35 b 0 a 41 b 79 b 17 a 0 aIR1561-228-3-3 –c – – – – – 1 a 3 a 4 a 43 c 27 b 7 abc 68 d 26 c 3 a 87 bc 12 a 0 aTN1 47d b 7 a 40 b – – – 2 a 1 a 39 b 88 d 9 a 1 a 87 e 2 a 4 a 90 bc 10 a 0 a
aFrom 123 to 180 plants test entry-1 season-1. In a column, means followed by the same letter are not significantly different (P = 0.05, Duncan's multiple range test). bNot included in the 1996 WStrial. cPlants severely damaged by Malayan black bug. dSamples include IR1561-228-3-3.
and IR69706-1-4-2-5-2-2 yielded anaverage of 1.9 and 0.9 t ha-1, respec-tively. The latter was significantlyhigher than the 0.7 t ha-1 yield of IR26.The low tungro virus infection and the
relatively high yield of these advancedlines showed their potential use asstop-gap planting materials for tungrodisease management. ■
Stress tolerance — excess water
Inheritance of submergencetolerance at the early seedlingstage in rainfed lowland rices
B. Swain, B. Acharya, K. Pande, and R.N. De,Central Rainfed Lowland Rice Research Station,IIT Campus, Kharagpur 721302, West Bengal,India
In the early seedling stage, mostlyunder direct-seeded conditions,lowland rice varieties are subjected tosubmergence because of erratic rainfalldistribution and prolonged waterstagnation. As a result, crop establish-ment is poor and productivity is low.Tolerance for submergence is thereforea highly desired trait of rainfedlowland varieties.
We studied the inheritance of sub-mergence tolerance in four crosses
involving two tolerant (T) varieties—FR43B and Rahaspanjar—and twosusceptible (S) varieties—IR42 andPankaj. Seeds of parents, F1s, and F2s ofeach cross were raised in galvanized-iron trays (70 × 60 × 15 cm) filled withclay soil on polythene sheet. Twenty
lines with 15 seedlings line-1 were grownin each tray. Both parents and their F1swere grown in a single line each,whereas the rest of the populations wereraised in RCBD with three replications.
Thirty-five-day-old seedlings werecompletely submerged in an artificial
Segregation ratio for submergence tolerance in F2 generation of different crosses.
Cross Submergence score Seedlings in F2 (no.) χ2 Ratio Probability
Parents F1 Ta S
FR43B (T)/ 2.6 (T) 4.0 151 104 0.911 9:7 0.5-0.3IR42(S) 8.5 (S) (T)
FR43B (T)/ 2.6 (T) 4.2 147 108 0.201 9:7 0.7-0.5Pankaj (S) 9.0 (S) (T)
Rahaspanjar (T) 3.6 (T) 4.5 140 115 0.187 9:7 0.7-0.5IR42 (S) 8.5 (S) (T)
Rahaspanjar (T) 3.6 (T) 4.9 142 113 0.033 9:7 0.9-0.8Pankaj (S) 8.8 (S) (T)
aT = tolerant, S = susceptible.

18 IRRN 1998
Performance of different ricelines in Zn-deficient soil
P. Thongbai, G.J.D. Kirk, C. Quijano, and D.Senadhira, IRRI
Ten rice lines with different responsesto Zn deficiency were grown in a Zn-deficient soil with 0 (Zn0) or 10 (Zn10)mg Zn kg-1 soil. The soil was a finemontmorillonitic calcareous TypicHydraquent from Tiaong, Quezon,Philippines (DTPA-extractable Zn 0.04mg kg-1, pH 7.8). Portions (3 kg) of the
soil were placed in plastic pots andflooded with water for 3 wk. Pre-germinated seeds were then sown andthe plants were grown for 3 wk in aglasshouse under typical humidtropical wet-season conditions. Thefollowing measurements were made:Zn deficiency score by the IRRIStandard evaluation system for rice,number of leaves with Zn deficiencysymptoms, number of tillers, plantheight, shoot dry weight, and shoot Zncontent.
cemented tank. A water depth of 50 cmabove the seedling level and a watertemperature of 30 °C were maintainedfor 12 d. Recovery score was measured7 d after submergence (1-5, tolerant; >5-9, susceptible).
ANOVA revealed significantdifferences among the populations inreaction to submergence.
Submergence scores in the F1s offour crosses-FR43B(T)/IR42(S),FR43B(T)/Pankaj(S), Rahaspanjar(T)/IR42(S), and Rahaspanjar(T)/
Pankaj(S)-tended toward those of thetolerant parents.
In the F2 generation, the segregationratio was 9:7 (T:S) (see table). This ratioindicated that submergence tolerancecan be explained by the comple-mentary action of at least two genes. ■
Stress tolerance — adverse soils
Nine indices of performance werecalculated from the results and ranked(Table 1). These indices are all quanti-tative and Zn-specific, and couldtherefore be used for quantitative traitloci (QTL) analysis. The indices wereused to distinguish different perform-ance characteristics (Table 2).
Results showed that lines IR26, IR58,CSR10, and IR65 were intolerant of Zndeficiency, with IR26, CSR10, and IR65tending to accumulate Zn without anincrease in growth. Lines IR8192,Madhukar, FR13A, Ketumbar, and to a
Table 1. Performance indices for growth under Zn deficiency.
Rankinga
Performance index ScoringIR26 IR58 IR65 CSR10 Ketum- KDML IR9764 Mah- FR IR8192 Kuatik Ma-
bar 105 suri 13 A Putih dhukar
Visual score in Zn0 a: best, d: worst d c b b a c a c a a c aNumber of leaves with deficiency symptoms in Zn0 a: least, d: most d c b b b c a d d a d dShoot dry wt/shoot Zn concentration in Zn0 a: highest, c: lowest c b c b b b b c a a c bShoot dry wt/ quantity of Zn in shoot in Zn0 a: highest, g: lowest f b g e b b c f b a d cShoot Zn concentration in Zn0 a: highest, e: lowest a e a b e c b a e e b dQuantity of Zn in shoot in Zn0 a: highest, c: lowest c c c c c b b c a a c aAv % growth (dry wt, tiller no.) reduction a: least, d: most c d d c b b b b b a a a(Dry wt Zn0/dry wt Zn10)% a: highest, d: lowest c c b d c a b d a a d a(Dry wt Zn10 - dry wt Zn0)/quantity of Zn supplied a: highest, g: lowest f e g b d f c a b a b b
aThe same letters in a row indicate that rankings are not significantly different at P = 0.05 by Duncan's multiple range test.
Table 2. Performance characteristics based on indices in Table 1.
Characteristic Index rankings IR26 IR58 IR65 CSR10 Ketumbar KDML 105 IR9764 Mahsuri FR13A IR8192 Kuatik Madhukarrequired Putih
Tolerance deficiency Low 1, 2, 7 L a L ML ML H MH H MH MH H MH HInternal efficiency (transport and High 3, 4, 6; use within plant) low 5 – – – – H M L L H H L HExternal efficiency (mobilization in Low 3, 4, 6; rhizosphere, absorption) high 5 – – – – L M H H L L H LResponsiveness High 8, 9 L M L MH M L M MH H HH MH HHigh accumulation (high shoot Zn with poor growth) High 5,low 6 H L H H L M H H L L H LLow accumulation (low shoot Zn with good growth) Low 5, high 6 L MH L L M M ML L HH HH L H
a H = high, M = moderate, L = low.

Vol. 23, No. 3 19
lesser extent, KDML 105 were efficientin internal transport and use of Zn;IR9764, Mahsuri, Kuatik Putih, and to alesser extent, KDML 105 were efficientin Zn acquisition from the soil. LinesIR8192, FR13A, and Madhukar wereresponsive to Zn addition as well asefficient in internal use. ■
Genetic variability and pathanalysis in rice grown insaline soil
O.M. Gonzales and R. Ramírez, NuclearLaboratory of the Agricultural Research Institute"Jorge Dimitrov", Gaveta Postal 2140, Bayamo85100, Granma, Cuba
Our study aimed to examine geneticvariability, heritability, and correlationcoefficients among different characterswhen rice varieties were grown undersaline conditions. We estimated thegenetic parameters of sevenquantitative characters in 20 ricegenotypes grown under salineconditions. The experiment was laidout in a randomized block design andreplicated three times during 1995-96on saline soils (4-5 dS m-1) at the RiceResearch Station “Jucarito,” GranmaProvince, Cuba. Hills were spaced 20 ×10 cm, with a single seedling hill-1.Observations were recorded on fiverandomly selected plants replication–1.The mean, standard deviation,phenotypic coefficient of variation(PCV), genotypic coefficient ofvariation (GCV), broad-senseheritability (h2), and genetic advance asa percentage of mean (GA%) werecalculated for seven traits. Pathcoefficient analysis was used topartition the genotypic correlationcoefficient into direct and indirecteffects.
Significant differences wereobserved for all traits, indicating greatvariability between genotypes. PCVwas usually higher than GCV, but thedifference was very low, indicating lessenvironmental influence on theexpression of different traits. The
higher GCV and PCV for grain yieldplant–1, panicle weight, and plantheight provided better scope forimprovement through selection forsaline conditions (Table 1).
A moderate amount of variability(11-12%) was observed for paniclesplant-1 and filled grains panicle-1,whereas a low GCV and low GA%were observed for panicle length and1,000-grain weight. These indicatedthat the characters were under highenvironmental influence, and thatselection based on these characterswould be ineffective under salineconditions.
The high value of GCV, h2, and GA%estimated for grain yield plant-1, plantheight, and panicle weight indicatedthe predominance of additive geneaction, and that direct phenotypicselection based on these traits would beeffective for varietal improvement onsaline soils.
Grain yield plant-1 was positivelyand significantly correlated withpanicle weight, filled grains panicle-1,1,000-grain weight, and plant height,but negatively and significantlycorrelated with panicles plant-1. Paniclelength did not show any correlationwith yield (Table 2).
The path coefficient analyses alsoindicated that panicle weight, filledgrains panicle-1, and plant height hadthe largest direct effect on yield. Thus,these three characters emerged as themain components of rice grain yieldunder saline conditions. Othercharacters, such as panicles plant-1,panicle length, and 1,000-grain weight,did not show any direct effect on yield,but they influenced yield via plantheight. Panicle weight, filled grainspanicle-1, and plant height appeared tobe the most reliable indices for selectionunder Cuba’s saline conditions. ■
Table 1. Genetic parameters for seven traits in rice varieties grown in saline soil.
Trait Mean Standard PCVa GCV h2 GA%deviation
Plant height (cm) 100.5 1.82 28.18 28.16 90.6 30.2Panicles plant-1 (no.) 9.6 0.80 11.52 11.48 94.8 21.4Panicle length (cm) 24.8 2.24 3.00 2.97 37.2 12.9Panicle weight (g) 4.3 0.52 22.84 22.80 89.4 22.8Filled grains panicle-1 (no.) 92.8 9.60 12.65 12.63 42.5 22.61,000-grain weight (g) 29.3 0.80 6.05 6.02 97.0 10.6Grain yield plant-1 (g) 12.6 2.62 39.86 39.84 97.2 34.5
aPCV = phenotypic coefficient of variation, GCV = genotypic coefficient of variation, h2 = heritability, GA% = genetic advance as % ofmean.
Table 2. Path analysis showing direct and indirect effects on yield.a
TotalVariable Plant Panicles Panicle Panicle Filled grains 1,000-grain genotypic
height plant-1 length weight panicle-1 weight correlationwith yield
1 0.437 0.145 –0.043 0.078 0.027 –0.088 0.557**2 –0.148 –0.026 0.040 –0.069 –0.011 0.066 –0.549**3 0.118 0.107 –0.161 0.055 0.033 –0.082 0.2704 0.249 0.213 –0.065 1.138 0.017 –0.062 0.691**5 0.160 0.066 –0.073 0.033 0.575 –0.046 0.875***6 0.170 0.124 –0.059 0.038 0.015 0.226 0.564**
aResidual effect = 0.082 direct effects. All others are indirect effects. ** = significant at 5% level, *** = significant at 1% level.

20 IRRN 1998
Integrated germplasm improvement — rainfed lowland
Table 1. Performance of Satyam and Kishori in state multilocational varietal trials conducted under normalplanting conditions, 1993-96.
Yield (t ha-1)a
Year Site LSD (at 5%) CV (%)Satyam Kishori Radha Pankaj
1993 Patna 3.3 3.5 3.6 2.8 1.3 16.60Pusa 5.6 3.8 4.6 3.6 0.6 07.30Sabour 4.9 4.5 5.2 5.4 0.5 06.58Bikramganj 6.0 2.7 6.1 5.3 0.9 08.34
1994 Patna 5.6 4.8 3.7 3.5 0.3 05.48Sabour 3.4 3.8 2.3 2.8 0.7 13.29Bikramganj 4.3 4.6 2.7 4.5 1.1 19.40
1995 Patna 2.0 3.9 2.0 1.8 0.6 20.00Jhanjharpur 3.7 4.6 2.9 3.0 0.4 14.30Pusa 3.1 4.1 1.6 – 0.1 13.09Sabour 3.9 – 4.0 3.3 0.4 18.00Bikramganj 3.6 – 4.8 3.1 0.2 04.34
1996 Pusa 4.3 4.3 4.1 4.1 0.3 16.87Patna 3.4 4.0 3.0 3.7 0.2 17.64Dhangain 5.5 5.7 5.8 5.3 0.3 12.83Jhanjharpur 4.6 4.5 3.6 3.8 0.2 11.94Pooled mean 4.1 4.2 3.7 3.6 – –Pooled LSD (5%) 1.3 1.1 1.5 1.6 – –
aMean of three replicates.
Satyam and Kishori, twohigh-yielding varietiesdeveloped for the rainfedlowlands of Bihar, India
R. Thakur, A.K. Singh, R.S. Singh, S.B. Mishra,N.K. Singh, and J.N. Rai, Rice Research Unit,Rajendra Agricultural University (RAU), Bihar,Pusa (Samastipur) 848125, India
Rainfed lowlands constitute nearly halfof the total rice area in Bihar (2.7 millionha). The rice crop depends on themonsoon. When the monsoon isdelayed, rice planting is also delayed.No high-yielding varieties (HYVs) aresuitable for delayed conditions mainlybecause they flower at the end ofOctober when low temperature sets in,causing nonuniform flowering andpoor seed setting. Farmers thereforerely on traditional photoperiod-sensitive, tall cultivars that are tolerantof cold at flowering. HYVs areconsequently grown under favorableconditions only.
To develop HYVs adapted todelayed monsoon conditions, crossesinvolving traditional cultivars (as oneof the parents) were made in the early1980s. Several cultures derived fromIR8/Barogar and RD19/Desaria weretested under both normal and delayedmonsoon conditions against standard
checks in a regional trial. Based onaverage performance, many cultureswere promoted to state multilocationalvariety trials with three replications in1993. From 1993 to 1996, RAU1119-13-3-1 (Kishori) derived from IR8/Barogarand RAU3025-2-1B-2-1 (Satyam)derived from RD19/Desaria weresuperior to Radha and Pankaj (Table 1),the standard checks recommendedearlier for normal planting conditions.Satyam had a 10.8% and 13.8% yield
advantage over Radha and Pankaj,respectively, whereas Kishori yielded13.5% and 16.6% more than the checks.These varieties were also tested in themultilocational Indian Council ofAgricultural Research (ICAR)-IRRIcollaborative shuttle breeding trial ineastern India, under both normal (30-d-old seedlings) and delayed planting(60-d-old seedlings) against checksadapted to rainfed lowland conditions,including Sabita, a photoperiod-
Table 2. Yield performance (t ha-1) of Kishori and Satyam in ICAR-IRRI collaborative shuttle breeding trial in eastern India, 1994-96.
Kishori Satyam Rajshree Mahsuri Sabita LSD (at 5%) CV (%)Year Site
Ia IIb I II I II I II I II I II I II
1994 Masodha – 5.6 7.0 4.1 5.3 4.4 5.0 3.2 4.4 4.2 0.8 0.5 09.0 09.3Patna 5.9 2.1 4.3 4.0 3.9 3.3 6.6 2.0 5.8 0.9 1.5 0.9 17.4 27.5Pusa 4.5 3.8 6.1 4.3 4.3 3.1 3.0 2.2 2.7 2.8 0.4 0.3 06.9 06.4Titabar 5.1 4.4 4.3 3.7 4.4 3.5 3.4 3.4 – – 0.8 0.6 13.5 13.0
1995c Patna 2.8 5.8 1.7 5.1 1.9 3.8 2.2 4.7 3.0 1.5 0.3 1.5 0.3 0.6Pusa 6.3 3.2 5.6 2.3 3.9 2.6 3.4 1.9 1.4 1.8 0.1 0.2 16.6 07.4Raipur 2.1 1.9 2.3 2.3 3.0 1.9 2.6 1.9 3.0 2.2 0.9 0.9 09.7 07.9
1996 Patna 5.3 2.3 5.1 2.4 3.8 1.8 4.1 2.4 4.1 2.4 0.3 0.6 14.5 09.5Pusa 4.2 3.1 4.4 2.9 4.1 2.9 3.4 1.8 3.5 3.1 0.2 0.3 06.6 11.7Masodha 6.2 3.8 5.3 3.5 3.5 1.4 3.0 3.4 4.3 3.4 0.3 0.3 08.2 21.5Titabar 5.3 3.1 4.9 2.8 3.8 2.5 3.8 2.5 3.0 2.5 0.5 0.4 10.2 10.6Pooled mean 5.0 3.6 4.6 3.4 3.8 2.8 3.7 2.8 35.2 24.8 – – – –Pooled LSD (5%) 1.5 1.3 1.8 1.1 0.9 1.2 1.7 1.2 1.3 1.6 – – – –
aTransplanted at 30 d after sowing. bTransplanted at 60 d after sowing. cDirect seeding vs transplanting.

Vol. 23, No. 3 21
sensitive variety. They outyieldedchecks under normal and delayedplanting conditions (Table 2). Becauseof their superior performance innumerous on-farm trials, Satyam andKishori were released for general
cultivation in rainfed lowlands fornormal and delayed monsoonconditions.
Both have intermediate heights (120-125 cm), compact erect habit, and 145-
150-d maturity. Satyam has long finegrains and Kishori has long boldgrains. They are resistant to bacterialblight and tolerant of brown spot andZn and Fe deficiencies. ■
Integrated germplasm improvement — upland
On-farm characterizationof upland rice varieties innorth Thailand
K. Van Keer, Laboratory for Soil Fertility and SoilBiology, KU Leuven tout court, 3001 Leuven,Belgium; G. Trebuil and B. Courtois, IRRI,seconded from CIRAD-CA; C. Vejpas, IRRI
An on-farm diagnostic survey on theextent and causes of variability ofupland rice yields was carried outduring 1993-96 in Mae Haeng, ChiangMai Province, in upper northernThailand (600-700 masl).
Farmers’ varieties were charac-terized from physiological, agronomic,and genetic points of view.Data were obtained over foursuccessive wet seasons from a total of423 small squares (1 m2) from 63farmers’ fields representing anextensive range of upland rice-cropping conditions under a pre-dominant swidden cultivation system.Plots were monitored every 2 wk toquantify key physiological and agro-nomic parameters needed to under-stand yield buildup patterns of varioustypes of cultivars. Isozyme analysiswas carried out to assess the geneticvariability of farmers’ upland ricevarieties.
All upland rice cultivars were foundto belong to group 6 (tropical japonicas)of Glaszmann’s classification. Hetero-geneity was sometimes detectedbetween samples of the same varietycoming from different farms. The rareallele 3 at locus Amp-1 typical of varie-ties from the Himalayan foothills wasobserved in some cultivars. Only twolate-maturing varieties were found tobe glutinous, a type of rice used to
prepare rice cakes during traditionalfestivals.
Two main types of cultivars, early(95-115 d) and late maturing (138-177d), were distinguished and playeddifferent roles on the farms. Late-maturing varieties clearly constitutedthe most important type in terms ofproduction volume, whereas early
maturing varieties were planted toimprove food security before the mainharvesting period. Early and latecultivars were found to be weakly andstrongly photoperiod-sensitive,respectively. When expressed in degreedays, crop duration cycle was evenlysplit between the vegetative andreproductive phases for early cultivars
Table 1. Physiological and genetic characteristics of local upland rice varieties in Mae Haeng Village, ChiangMai Province, Thailand, 1993-96.
Variety Importance Varietal groupa Photoperiodism Grain type DD to PIb DD toharvest
Early maturing typesChaloina Rare Tropical japonica Weakly sensitive Nonglutinous 650 1340Kochokai Rare 800 1400Chaloioe Dominant 670 1350Kochole Rare 590 1270
Late maturing typesChaae Rare Tropical japonica Strongly sensitive Nonglutinous 1060 1900Chanoko Common Glutinous 1060 1910Chafuma Common Nonglutinous 1000 1860Chazu Rare Nonglutinous 1230 2120Komu Rare Nonglutinous 1150 1960Chanona Rare Glutinous 860 1790
aBased on isozyme analysis. bDD = degree-days (13 °C threshold temperature), PI = panicle initiation.
Table 2. Agronomic characteristics of Chaloina and Chaae grown in Mae Haeng Village, Chiang Mai Province,Thailand, 1993-96.
Variety Chaloina Chaae
Duration Early LateObservations (no.) 75 234Maximum grain yield (g m-2 at 0% H2O) 308 438Maximum 100-grain weight (g at 0% H2O) 23.2 25.0Threshold valuea for filled spikelets m-2 (no.) 13,300 17,500Maximum value for filled spikelets m-2 (no.) 16,200 20,600Maximum grain filling (%) 81 98Threshold value for spikelets m-2 (no.) 20,100 21,500Maximum value for spikelets m-2 (no.) 22,000 26,700Maximum value for spikelets panicle-1 (no.) 144 183Threshold value for panicles m-2 (no.) 155 146Maximum value for panicles m-2 (no.) 228 237Maximum value for panicles plant-1 (no.) 2.8 3.6Threshold value for plants m-2 (no.) 81 66
aThreshold value = value required to achieve the maximum for a particular yield component.

22 IRRN 1998
whereas for late-maturing ones, thereproductive phase tended to be longer(Table 1).
For the two dominant varieties,Chaloina (early) and Chaae (late),maximum grain yields were measuredin fields with no inputs applied butwhere environmental constraints wereminimal. Yields for Chaloina andChaae reached 308 and 438 g m-2 at 0%H2O, respectively (Table 2). Theserelatively high yields can thus be consi-dered the maximum yield potential inthe subsequent analyses of yieldbuildup processes and agronomic diag-nosis of limiting factors and conditions.
Table 2 shows the maximum valuesof yield components unit area-1 charac-terizing the classic four successivephases of the yield buildup processes.Threshold values corresponding to theminimum level of the previous yieldcomponents required to achieve thepotential level of the following one arealso provided.
The maximum number of paniclesunit area-1 was found to be similar forboth varieties but was reacheddifferently. Because of Chaloina’s lowermaximum number of panicles plant-1, itrequired a higher threshold of plantsm-2 to achieve a number of panicles (230m–2) similar to the potential achieved byChaae.
The differentiation in potentialyields between Chaloina and Chaaestarted at spikelet formation andcontinued in the following phases. Ahigher maximum number of spikeletspanicle-1 was recorded for the late-maturing cultivar as well as a betterrate of grain filling (possibly due tomore favorable climatic conditionsrather than genetic differences) andhigher maximum grain weight.
These maxima and the associatedthreshold values for yield componentscan be used to construct an empiricalmodel of upland rice yield buildupprocesses. Such a model can be used foreither agronomic diagnoses of limitingfactors of yield and for designing andevaluating improved sequences ofcultivation practices. ■
Crop resource managementFertilizer management
Evaluation of P sources in arice - wheat cropping system innorthwestern India
B. Singh, Y. Singh, T.S. Khera, C.S. Khind, andRachna Nayyar, Soils Department, PunjabAgricultural University, Ludhiana 141004, India
Increasing costs have resulted inreduced applications of P fertilizers torice - wheat systems in the Indo-Gangetic plains of India. Partly toaddress this issue, nitrophosphate Psources have been developed by acidu-lation of rock phosphate with nitricacid rather than imported and ex-pensive sulfuric acid. These are cheaperthan the traditional superphosphateand diammonium phosphate.
We evaluated three nitrophosphateP sources along with superphosphateand diammonium phosphate on wheat(1996-97) and rice (1997) grown inrotation at Ludhiana in northwesternIndia. The nitrophosphates contained80% (Narmadaphos), 60% (ammoniumnitrophosphate), and 30% (Suphala) oftheir total P in water-soluble form. Soil
in the experimental field was aFatehpur loamy sand with 9% clay, 83%sand, 0.33% organic C, pH 7.4, and 11.2kg P ha-1 (Olsen P). All P sources wereapplied to wheat at 17.6, 26.4, and 35.2kg P ha-1 in a randomized completeblock design. No P was applied to rice.Nonetheless, the residual effect of the Psources in the following crop of rice wastested. Both wheat and rice weresupplied with 120 kg N ha-1 and 25 kg Kha-1.
The table shows grain yield and Puptake for both rice and wheat. A signi-ficant response of wheat to applicationof P as superphosphate or diammo-nium phosphate was observed up to17.6 kg P ha-1. Nitrophosphate fertili-zers possessing 60% and 80% P inwater-soluble form were as efficient aswholly water-soluble sources in in-creasing grain yield and P uptake bywheat. The source with only 30% water-soluble P was significantly inferior toother sources even when applied athigher P levels. No residual effect of anyof the five sources was observed on theyield and P uptake of rice. ■
Effect of different applied phosphatic fertilizers on grain yield and P uptake by wheat following a crop of rice.Ludhiana, India, 1996-97.
P level Wheat RiceP source (kg ha-1)
Grain yield P uptake Grain yield P uptake(t ha-1) (kg ha-1) (t ha-1) (kg ha-1)
No P (control) 0 2.4 7.7 5.2 16.1Single superphosphate 17.6 3.8 12.3 5.4 17.1
26.4 4.0 14.1 5.2 16.535.2 4.1 15.9 5.1 15.9
Diammonium phosphate 17.6 4.0 12.9 5.4 16.626.4 4.3 15.1 5.7 17.435.2 4.2 16.0 5.9 17.2
Narmadaphos 17.6 4.0 13.1 5.2 16.4(80% water-soluble P) 26.4 4.2 15.8 5.6 16.2
35.2 4.2 15.4 5.8 16.9Ammonium nitrophosphate 17.6 4.2 14.2 5.2 16.3(60% water-soluble P) 26.4 4.2 14.8 5.4 15.7
35.2 4.2 15.4 5.5 16.3Suphala 17.6 3.4 12.5 5.0 16.0(30% water-soluble P) 26.4 3.6 13.6 5.7 17.0
35.2 3.7 13.6 5.2 16.6 LSD (P = 0.05) 0.3 0.7 nsa nsa
ans = not significantly different.
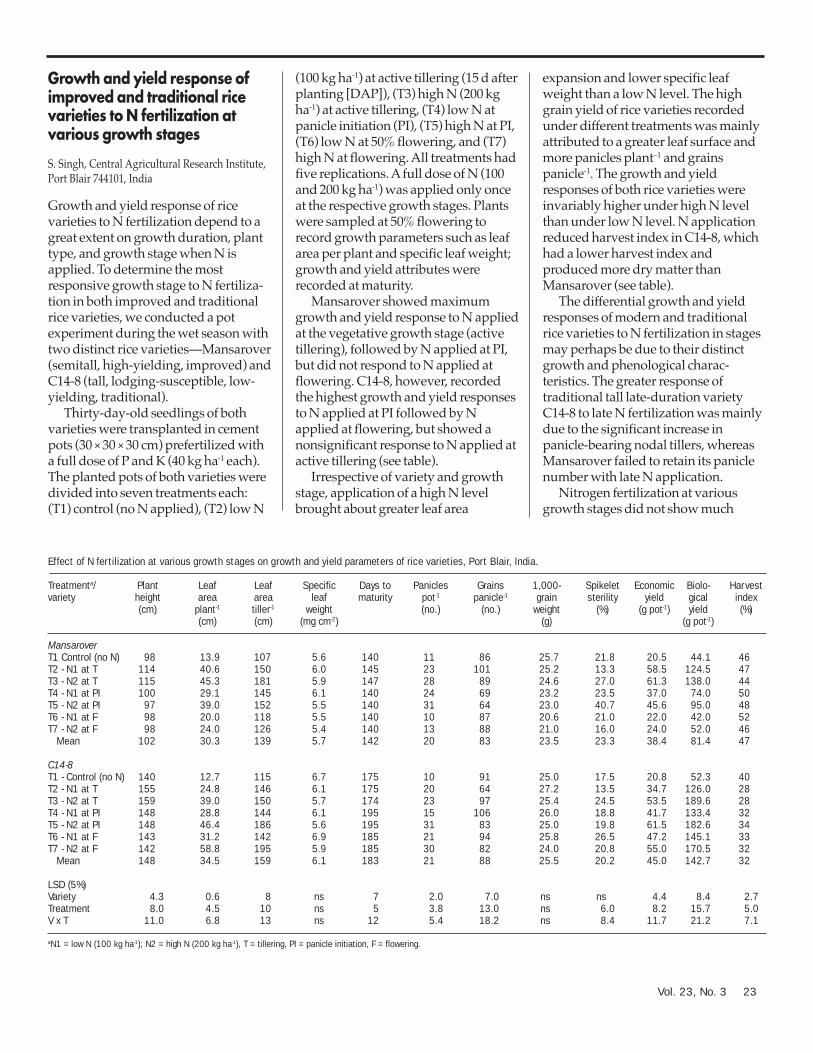
Vol. 23, No. 3 23
Growth and yield response ofimproved and traditional ricevarieties to N fertilization atvarious growth stages
S. Singh, Central Agricultural Research Institute,Port Blair 744101, India
Growth and yield response of ricevarieties to N fertilization depend to agreat extent on growth duration, planttype, and growth stage when N isapplied. To determine the mostresponsive growth stage to N fertiliza-tion in both improved and traditionalrice varieties, we conducted a potexperiment during the wet season withtwo distinct rice varieties—Mansarover(semitall, high-yielding, improved) andC14-8 (tall, lodging-susceptible, low-yielding, traditional).
Thirty-day-old seedlings of bothvarieties were transplanted in cementpots (30 × 30 × 30 cm) prefertilized witha full dose of P and K (40 kg ha-1 each).The planted pots of both varieties weredivided into seven treatments each:(T1) control (no N applied), (T2) low N
(100 kg ha-1) at active tillering (15 d afterplanting [DAP]), (T3) high N (200 kgha-1) at active tillering, (T4) low N atpanicle initiation (PI), (T5) high N at PI,(T6) low N at 50% flowering, and (T7)high N at flowering. All treatments hadfive replications. A full dose of N (100and 200 kg ha-1) was applied only onceat the respective growth stages. Plantswere sampled at 50% flowering torecord growth parameters such as leafarea per plant and specific leaf weight;growth and yield attributes wererecorded at maturity.
Mansarover showed maximumgrowth and yield response to N appliedat the vegetative growth stage (activetillering), followed by N applied at PI,but did not respond to N applied atflowering. C14-8, however, recordedthe highest growth and yield responsesto N applied at PI followed by Napplied at flowering, but showed anonsignificant response to N applied atactive tillering (see table).
Irrespective of variety and growthstage, application of a high N levelbrought about greater leaf area
expansion and lower specific leafweight than a low N level. The highgrain yield of rice varieties recordedunder different treatments was mainlyattributed to a greater leaf surface andmore panicles plant–1 and grainspanicle-1. The growth and yieldresponses of both rice varieties wereinvariably higher under high N levelthan under low N level. N applicationreduced harvest index in C14-8, whichhad a lower harvest index andproduced more dry matter thanMansarover (see table).
The differential growth and yieldresponses of modern and traditionalrice varieties to N fertilization in stagesmay perhaps be due to their distinctgrowth and phenological charac-teristics. The greater response oftraditional tall late-duration varietyC14-8 to late N fertilization was mainlydue to the significant increase inpanicle-bearing nodal tillers, whereasMansarover failed to retain its paniclenumber with late N application.
Nitrogen fertilization at variousgrowth stages did not show much
Effect of N fertilization at various growth stages on growth and yield parameters of rice varieties, Port Blair, India.
Treatmenta/ Plant Leaf Leaf Specific Days to Panicles Grains 1,000- Spikelet Economic Biolo- Harvestvariety height area area leaf maturity pot-1 panicle-1 grain sterility yield gical index
(cm) plant-1 tiller-1 weight (no.) (no.) weight (%) (g pot-1) yield (%)(cm) (cm) (mg cm-2) (g) (g pot-1)
MansaroverT1 Control (no N) 98 13.9 107 5.6 140 11 86 25.7 21.8 20.5 44.1 46T2 - N1 at T 114 40.6 150 6.0 145 23 101 25.2 13.3 58.5 124.5 47T3 - N2 at T 115 45.3 181 5.9 147 28 89 24.6 27.0 61.3 138.0 44T4 - N1 at PI 100 29.1 145 6.1 140 24 69 23.2 23.5 37.0 74.0 50T5 - N2 at PI 97 39.0 152 5.5 140 31 64 23.0 40.7 45.6 95.0 48T6 - N1 at F 98 20.0 118 5.5 140 10 87 20.6 21.0 22.0 42.0 52T7 - N2 at F 98 24.0 126 5.4 140 13 88 21.0 16.0 24.0 52.0 46 Mean 102 30.3 139 5.7 142 20 83 23.5 23.3 38.4 81.4 47
C14-8T1 - Control (no N) 140 12.7 115 6.7 175 10 91 25.0 17.5 20.8 52.3 40T2 - N1 at T 155 24.8 146 6.1 175 20 64 27.2 13.5 34.7 126.0 28T3 - N2 at T 159 39.0 150 5.7 174 23 97 25.4 24.5 53.5 189.6 28T4 - N1 at PI 148 28.8 144 6.1 195 15 106 26.0 18.8 41.7 133.4 32T5 - N2 at PI 148 46.4 186 5.6 195 31 83 25.0 19.8 61.5 182.6 34T6 - N1 at F 143 31.2 142 6.9 185 21 94 25.8 26.5 47.2 145.1 33T7 - N2 at F 142 58.8 195 5.9 185 30 82 24.0 20.8 55.0 170.5 32 Mean 148 34.5 159 6.1 183 21 88 25.5 20.2 45.0 142.7 32
LSD (5%)Variety 4.3 0.6 8 ns 7 2.0 7.0 ns ns 4.4 8.4 2.7Treatment 8.0 4.5 10 ns 5 3.8 13.0 ns 6.0 8.2 15.7 5.0V x T 11.0 6.8 13 ns 12 5.4 18.2 ns 8.4 11.7 21.2 7.1
aN1 = low N (100 kg ha-1); N2 = high N (200 kg ha-1), T = tillering, PI = panicle initiation, F = flowering.

24 IRRN 1998
impact on days to maturity inMansarover, but showed a markedeffect on maturity period in C14-8when applied at later growth stages,mainly because of a delay in maturity
Crop management
Lock-lodge technology forrice ratooning
R. Mohan, L. Aruna, J. Ram Mohan, and R.Poonguzhalan, Pandit Jawaharlal Nehru Collegeof Agriculture and Research Institute, Karaikal609603, India
Ratooning of rice could be an importantcrop establishment alternative in manyagroecosystems. But low yieldpotential and asynchronous grainripening constrain the widescale use ofratooning in the tropics. Braiding andlodging (lock-lodge method) thestubbles after harvest of the main cropcan overcome these limitationsconsiderably.
We tested the ratoon performance ofvarieties IR20, ADT38, CO 43, andPonni in an experiment conducted at
Grain yield and duration of main and ratoon rice varieties.
Grain yield (t ha-1) Duration (d)Variety
Conventional Lock-lodge Main crop Conventional Lock-lodge Main cropratoon ratoon ratoon ratoon
IR20 1.4 (41.1) 2.9 (82.7) 3.5 62 95 117CO 43 1.7 (38.9) 3.1 (70.8) 4.4 97 97 140ADT38 1.3 (23.7) 3.0 (55.2) 5.4 79 105 133Ponni 1.5 (26.1) 2.4 (41.2) 5.9 71 97 140
Numbers in parentheses indicate the percentage grain yield when compared with the respective main crop.
of nodal panicles. It is clear from theresults that active tillering was the mostN-responsive growth stage in high-yielding Mansarover, whereas the
reproductive and flowering stageswere found to be the most N-effectivegrowth stages in traditional varietyC14-8. ■
Tamil Nadu Agricultural University inCoimbatore in 1993-94 using bothconventional and lock-lodge methodsof ratooning. Results showed that lock-lodge ratooning consistently out-yielded the conventional methodirrespective of variety. All the traits ofthe ratoon crop measured weresignificantly better in the lock-lodge
ratoon crop. Grain yield of lock-lodgeratoon crop increased by 41.2% forPonni to 82.7% for IR20 compared withtheir respective main crop (see table).Growth duration of lock-lodge ratoonranged from 95 to 105 d, whereas that ofconventional ratoon ranged from 62 to97 d depending on variety. ■
Disease management
Soil-borne and seed-bornepathogens of rice in rice - wheatsystem-based farmers’ fields inUttar Pradesh
A. Kumar, G.B. Pant University of Agricultureand Technology (GBPUAT), Pantnagar 263145,Uttar Pradesh, India; L. Willocquet and S. Savary,IRRI-ORSTOM Project on Rice Pest Characteriza-tion, IRRI; and U.S. Singh, GBPUAT
Pests (insects, weeds, pathogens) arean important component for sustainingrice - wheat systems. Among them,soil- and seed-borne pathogens mayplay a specific role. Cropping practicesmay affect the dynamics of thesepathogens, both in their survival andepidemic phases. More specifically, thecarryover role of other crops in rotationwith rice may be critical for these
diseases. Pathogen interactions mayalso alter disease patterns in a field.These interactions remain largelyunknown, and we report here somepreliminary results on this topic.
Disease incidence due to a few soil-and seed-borne pathogens was quanti-fied in farmers’ fields for sheath blight(ShB, Rhizoctonia solani), stem rot (SR,Sclerotium oryzae), brown spot (BS,Cochliobolus miyabeanus), sheath rot(ShR, Sarocladium oryzae), panicle blast(PB, Pyricularia grisea), crown sheath rot(CShR, Gaeumannomyces graminis), andfalse smut (FS, Ustilaginoidea virens).These diseases can be transmitted byseeds (BS, ShR, PB, CShR) or survive aspropagules in the soil or in plant debris(ShB, SR, BS, PB, CShR, FS) (Ou 1985).Glume discoloration (GD) symptomswere also considered because they are
associated with the presence ofdifferent fungi, such as P. grisea and C.miyabeanus. Eight fields selected torepresent a range of crops precedingrice were assessed: two with wheat (B3and B6), one with rice (B4), one withsorghum (B1), one with maize (PP5),one with lentil (B9), one with fallow(PP2), and one with mint (PP3).
Diseases were assessed at the milkstage. In each field, 20 hills weresampled following a zigzag pattern.For each hill, the total number of tillers;number of tillers infected by ShB, SR,BS, and CShR; total number of panicles;number of panicles infected by ShR, PB,and FS; and number of paniclesshowing GD were recorded.Sheath blight, stem rot, brown spot,glume discoloration, and sheath rotwere consistently observed in all eight

Vol. 23, No. 3 25
fields (see table). The other diseases,when present, occurred at lowincidences (0-8%) and were notconsidered for multivariate analyses.The highest incidences were observedfor ShB and BS (up to 68% and 85%,respectively), whereas ShR incidenceremained below 20% in all fields (seetable).
Sheath blight incidence wasrelatively high in all fields (around20%) and reached 75% in PP5. Brownspot incidence varied widely betweenfields, from 8% to 90%. Stem rot wasextremely variable too, but within asmaller range of incidence (2-35%).Sheath rot was observed in all fields,but at low incidence. Glume discolo-ration incidence was around 25% in allfields, except B4 and PP5, which hadlower levels (10% and 3%,respectively).
Pearson coefficients of correlationwere computed based on diseaseincidence data collected at the hill level.ShB and SR were negatively correlated
(-0.388; P < 0.001), and BS waspositively correlated with GD (+0.19; P= 0.013). Panicle blast was positively,negatively, and negatively correlatedwith ShB, SR, and GD, respectively, butthese correlations should be interpretedcautiously, given the low levels of PBencountered. In a principal componentanalysis done on disease incidence, thefirst two axes explained 54% of totalvariance and the third axis explained19% (see figure). The first axis mainlyreflects a strong opposition betweenShB and SR incidences. Axis 2 reflectsthe association between GD and BS.Axis 3 reflects the opposition betweenSR and BS.
These preliminary results point todifferent trends:• Sheath blight and stem rot appear to
be negatively correlated, perhapsbecause of differences in environ-ments that favor these two diseasesor competition between thecorresponding propagules, duringeither the inoculum survival stage or
the establishment of the firstinfections at the base of the riceplant.
• Glume discoloration is correlatedwith BS. Indeed, C. miyabeanus isreported as a fungus associated withGD.
• Sheath rot seems to be negativelyassociated with BS (see figure); thiswill have to be further documented.
• Linkages between rotations anddisease levels can, cautiously, behypothesized. For instance, in thecase of ShB, PP5 showed an ShBlevel nearly twice that of other fields.This field was previously plantedwith maize, which can host R. solaniAG 1-1A. The effect of the maize-ricesystem on ShB will have to befurther documented.
ReferenceOu SH. 1985. Rice diseases. 2d ed. Kew
(England): CommonwealthMycological Institute. 380 p. ■
Output of principal component analysis on incidence of different diseases in eight farmers’fields.
Fraction of infected tillers or panicles in eight farmers' fields under a rice - wheat system, Uttar Pradesh, India.a
Field ShB BS SR ShR CShR GD PB FS
B1 0.18 0.7 0.18 0.09 0 0.29 0 0B3 0.16 0.45 0.25 0.09 0 0.26 0 0B4 0.22 0.37 0.15 0.04 0 0.10 0 0.02B6 0.20 0.07 0.03 0.03 0 0.25 0 0.05B9 0.15 0.35 0.40 0.08 0 0.25 0 0.01PP2 0.25 0.67 0.08 0.04 0.04 0.18 0.05 0.06
PP3 0.31 0.87 0.14 0.03 0.04 0.26 0 0.01PP5 0.68 0.15 0.04 0.04 0.03 0.03 0.27 0.04
aShB = sheath blight, BS = brown spot, SR = stem rot, ShR = sheath rot, CShR = crown sheath rot, GD = glume discoloration,PB = panicle blast, FS = false smut.
1.0
0.5
0.0
–0.5
–1.0–1.0 –0.5 0.0 0.5 1.0
Factor 1
SHBSR
SHR
GDBS
–1.0 –0.5 0.0 0.5 1.0Factor 1
SHB
SR
SHR
GD
BS
1.0
0.5
0.0
–0.5
–1.0–1.0 –0.5 0.0 0.5 1.0
Factor 1
SHB
SR
SHR
GD
BS
1.0
0.5
0.0
–0.5
–1.0–1.0 –0.5 0.0 0.5 1.0
Factor 2
SHB
SR
SHR
GD
BS
Factor 3Factor 3Factor 2
Incidence of rice stripe necrosisvirus in upland rice in WestAfrica
D.E. Johnson, M. Dingkuhn, S.N. Fomba, WestAfrica Rice Development Association, 01 BP 2551,Côte d’Ivoire; and F. Morales, CentroInternacional de Agricultura Tropical (CIAT),Colombia
Rice stripe necrosis (RSNV) is causedby a virus transmitted by the soil-bornefungus Polymyxa graminis. The diseaseis characterized by seedling death, leafstripes and necrosis, and plantmalformation. The disease wasreported by Louvel and Bidaux in 1977in Côte d’Ivoire, West Africa, and thevirus was isolated by Fauquet andThouvenel in 1983.
In 1991, the disease appeared inColombia. Symptoms were initiallyattributed to soil and nutritionalproblems, aphids, and nematodes butsubsequent studies identified thedisease as RSNV. The disease spreadrapidly and yield losses associated with

26 IRRN 1998
Number of rice hills with RSNV symptoms in asample area of 160 hills at one upland site, 56 dafter emergence, Côte d’Ivoire.
Cultivar Weed-free Weeds present
WAB56-50a 10 10WAB99-1-1a 6 36ITA257a 8 20AUS257a 7 27Digba Youbab 13 22YS236b 8 9WAB04325c 0 0ACC102257c 0 0WAB02097c 0 0
aImproved Oryza sativa. bTraditional O. sativa. cO. glaberrima.
the presence of RSNV in Colombiaaveraged 20%, with some areasincurring losses above 50%.
In an experiment in Jan 1995, thereaction of rice cultivars to RSNV wascompared in plots that were eitherhand-weeded once or maintainedweed-free. This experiment revealeddifferences in RSNV incidence betweencultivars at different weed controllevels, especially between Oryza sativa
cultivars that were affected to a greatextent in plots with weeds (see table).The increased disease incidence in plotswith weeds suggested that the diseasemay be encouraged by the presence ofalternative hosts or that the rice plantswhen stressed due to competition withweeds, become more susceptible. TheO. glaberrima cultivars in the experi-ment, however, were unaffected. Thepresence of RSNV in rice grown in Côted’Ivoire in 1997 at the same experi-mental site which was affected in 1995was positively confirmed by serolo-gical tests at CIAT, Colombia.
The high and increasing levels ofcrop loss caused by RSNV in Colombianecessitate studies on its distribution,mode of transmission, and controlmeasures. Host resistance to RSNVclearly exists within O. glaberrima, andthis could be exploited through inter-specific hybridization with O. sativa toproduce resistant cultivars. Nowadaysin West Africa, RSNV incidence is at an
Integrated pest management — diseases
Seed-borne fungi associatedwith rice seed lots in Pakistan
A.R. Bhutta and S.A. Hussain, Central SeedHealth Laboratory, Federal Seed Certification andRegistration Department (FSCRD), Islamabad,Pakistan
A total of 97 seed samples collectedfrom five locations (Lahore, Sahiwal,D.I. Khan, Hyderabad, Sukkur) were
tested from 1994 to 1996 at the CentralSeed Health Laboratory of the FSCRDin Islamabad. The standard blottermethod as described by theInternational Seed Testing Associationwas used. Four hundred seeds wereplated at the rate of 25 seeds plate-1.Seeds were incubated at 20 ± 2 °C for 7d, and fungi were identified under astereomicroscope.
extremely low level, which may be afunction of the extensive nature of theupland rice production systems in theregion and of the low level of mechani-zation. At sites in Sierra Leone and Côted’Ivoire, where the disease has becomea local problem, rice production wasmechanized and relatively intensive.With the current intensification of rice-based farming systems in West Africa,the disease threatens to becomeincreasingly more prevalent.
ReferencesFauquet C, Thouvenel J-C. 1983.
Association d’un nouveau virus enbâtonnet avec la maladie de lanécrose à rayures du riz, en Côted’Ivoire. C.R. Acad. Sc. Paris 296:575-580.
Louvel D, Bidaux J-M. 1977. Observa-tion de nouveaux symptomespathologiques sur des varietiesprecoces de riz en Côte d’Ivoire.Agron. Trop. 32(3): 257-261. ■
Fifteen seed-borne fungi weredetected from these seed lots (table). Ofthese, Bipolaris oryzae, Pyricularia oryzae,Fusarium moniliforme, Trichoconispadwickii, Rhizoctonia solani, andMicrodochium oryzae have beenreported to cause field diseases inPakistan. The incidence of seed-bornefungi varied from one locality toanother. Cercospora oryzae, M. oryzae,
Fungi detected in rice seed lots in Pakistan from 1993 to 1996.
1993-94 1994-95 1995-96
Locality Samples Fungi % range Samples Fungi % range Samples Fungi % rangetested tested tested(no.) (no.) (no.)
Lahore 20 Bipolaris oryzae 0.0 - 3.2 5 B. oryzae 0.0 - 2.0 8 B. oryzae 0.5 - 3.5Cercospora oryzae 0.0 - 3.2 – 0.0 C. oryzae 0.0 - 0.5Curvularia lunata 0.5 - 1.8 C. lunata 0.0 - 1.0 C. lunata 1.0 - 6.5Fusarium graminearum 0.0 - 0.2 – 0.0 F. graminearum 0.0 - 0.5F. moniliforme 2.0 - 2.2 F. moniliforme 2.0 - 5.0 F. moniliforme 0.5 - 1.5F. solani 0.0 - 1.2 – 0.0 –F. semitectum 0.0 - 1.0 F. semitectum 0.0 - 5.5 F. semitectum 1.0 - 5.5Microdochium oryzae 0.0 - 1.0 – 0.0 M. oryzae 0.0 - 0.5Nigrospora oryzae 0.0 - 1.0 N. oryzae 0.0 - 1.5 – 0.0Phoma sp. 0.0 - 0.8 Phoma sp. 0.0 - 0.5 Phoma sp. 0.0 - 0.5
continued on next page.

Vol. 23, No. 3 27
Table continued.
1993-94 1994-95 1995-96
Locality Samples Fungi % range Samples Fungi % range Samples Fungi % rangetested tested tested(no.) (no.) (no.)
Pyricularia oryzae 0.5 – 0.0 – 0.0Rhizoctonia oryzae 0.0 - 5.8 – 0.0 – 0.0Stemphylium sp. 0.0 - 1.0 – 0.0 Stemphylium sp. 0.5Trichoconis padwickii 5.8 - 14.8 T. padwickii 3.8 - 13.0 T. padwickii 2.0 - 5.7
Sahiwal 6 B. oryzae 0.0 - 2.5 5 B. oryzae 0.0 - 2.0 7 B. oryzae 0.5 - 1.0C. lunata 0.0 - 2.0 C. lunata 0.0 - 1.5 C. lunata 0.0 - 4.0F. moniliforme 0.0 - 2.5 F. moniliforme 0.0 - 2.5 F. moniliforme 0.0 - 1.0F. semitectum 0.0 - 3.0 F. semitectum 0.0 - 2.5 F. semitectum 0.0 - 1.5T. padwickii 2.0 - 9.0 T. padwickii 1.0 - 6.0 T. padwickii 0.5 - 3.0
D.I. Khan 5 B. oryzae 0.5 - 1.5 4 B. oryzae 0.5 - 1.5 4 B. oryzae 0.0 - 1.5C. lunata 1.5 - 14.5 C. lunata 0.5 - 5.0 C. lunata 0.0 - 4.0F. moniliforme 0.0 - 2.5 F. moniliforme 0.5 - 2.0 F. moniliforme 0.0 - 1.0F. semitectum 0.5 F. semitectum 0.5 - 2.0 F. semitectum 0.0 - 2.0
Hyderabad 5 B. oryzae 0.0 - 1.0 5 B. oryzae 0.0 - 0.5 4 B. oryzae 0.0 - 0.5C. lunata 0.0 - 1.0 C. lunata 0.0 - 27.0 C. lunata 0.0 - 21.0F. equiseti 0.0 - 0.5 – 0.0 0.0F. moniliforme 0.0 - 1.0 F. moniliforme 0.0 - 1.0 F. moniliforme 0.0 - 2.5F. solani 0.0 - 0.5 F. solani 0.0 – 0.0F. semitectum 0.0 - 0.5 – 0.0 – 0.0N. oryzae 0.0 - 1.0 – 0.0 – 0.0Phoma sp. 0.5 - 1.5 – 0.0 – 0.0Stemphylium sp. 0.5 – 0.0 – 0.0T. padwickii 6.5 - 11.0 T. padwickii 2.0 - 5.0 T. padwickii 1.0 - 4.0
Sukkur 5 B. oryzae 0.0 - 4.5 (–) 14 B. oryzae 1.0 - 19.5C. lunata 0.0 - 0.5 C. lunata 0.5 - 3.5F. equiseti 0.0 - 1.0 – 0.0F. moniliforme 3.0 - 6.0 F. moniliforme 0.5 - 1.5F. semitectum 2.5 - 3.0 F. semitectum 0.0 - 2.5N. oryzae 0.5 - 1.0 N. oryzae 0.5 - 1.0Phoma sp. 0.0 - 0.5 Phoma sp. 0.5Stemphylium sp. 0.0 - 1.0 Stemphylium sp. 0.0 - 0.5T. padwickii 3.5 - 12.5 T. padwickii 1.5 - 10.0
Total 41 19 37
Integrated pest management — other pests
and P. oryzae prevailed in the Lahorearea only. Fusarium equiseti wasrecorded only on seed from Hyderabadand Sukkur. Fewer seed-borne fungiwere observed in seed samples fromD.I. Khan. The involvement of C.oryzae, Nigrospora oryzae, Phoma sp.,
Rhizoctonia oryzae, and Stemphylium sp.in actual disease development has notyet been demonstrated.
Seed health testing is important tocontrol crop diseases. The use of che-mical seed treatment to improve seedquality and planting value has already
been reported. Considering the preva-lence and incidence of fungal patho-gens in rice seed lots, Pakistan’s seedhealth certification program shouldinclude fungicide treatment of prebasicseeds to control field diseases. ■
Pratylenchus zeae in upland riceas influenced by ratio ofintercropped maize
D.L. Coyne, Natural Resources Institute,Chatham Maritime, Kent ME4 4TB, UK; A.Ndongidila, West Africa Rice DevelopmentAssociation (WARDA), 01 BP 2551, Bouaké, Côted’Ivoire; I. Oyediran, E.A. Heinrichs, Departmentof Entomology, University of Nebraska, 202 PlantIndustry-East Campus, Lincoln, NE 68583-0816,USA; and R.A. Plowright, International Institute
of Parasitology, 295a Hatfield Road, St. Albans,Hertfordshire, UK
In West Africa, maize is commonlyrelayed or intercropped with uplandrice in traditional low-input systems.The density of maize as an intercropmay vary depending on many factors,including individual farmer pre-ferences and country or region. Somenematodes that parasitize rice arecommon to maize, notably Pratylenchus
zeae, which is a pest of both crops. Thisstudy was done to examine theinfluence of maize - rice intercroppingon the population density of P. zeae inrice.
Nematode densities were recordedin a trial at WARDA, established tomonitor the influence of crop ratios onthe incidence of stem borer pests onupland rice. The migratory endo-parasite P. zeae and the ectoparasiteHelicotylenchus dihystera were present in

28 IRRN 1998
Mean nematode populations recovered from maize and rice plants under different ratios of intercrop.a
2nd season 3rd season 3rd season(maturity) (40 DAS) (maturity)
NematodeMaize:rice Maize Rice Maize Rice Maize Rice
1:0 815 – 23 – 602 –P. zeae 1:3 1210 455 32 14 968 353(5 g roots) 1:5 1330 282 22 15 975 213
0:1 – 240 – 19 – 220LSD 646 236 27 18 421 143
1:0 603 – 73 – 443 –1:3 735 106* 33 10 492 59*
P. zeae 1:5 590 28 130 13 428 24(100 mL soil) 0:1 – 0 – 15 – 6
LSD 687 64 97 14 269 47
a* = significantly different (P < 0.05 from rice monocrop), – = not sampled.
the trial area. The trial was firstestablished in Jun 1995, continued fortwo successive seasons, and wasirrigated when necessary. Nematodesampling was conducted on threeoccasions: at maturity of the secondseason, at 40 d after sowing (DAS), andat maturity of the third season.Nematode populations from rice andmaize in the different treatments werecompared (see table). Populations atmaturity across all treatments,combined by crop, were also compared(see figure).
Five maize plants and 5 hills of ricewith soil were removed from each plotand bulked. Nematodes were extractedfrom a 100-mL soil and 5-g rootsubsample using the modified traymethod.
Maize cv EV 8744 SR (BC6F2B #Sine’ 94B [110-d duration] and riceWAB 56-50 [115-d duration]) weredirect-sown at 3 and 5 seeds hill–1,respectively, on 12 × 12-m plots.Treatments were arranged in arandomized block design with fourreplications. The same design wasretained throughout sole crops andmaize-rice intercrops at ratios of 1:3 and1:5. Treatment effects on nematodepopulation densities were analyzedwith two-way ANOVA.
Results indicated that intercroppingwith maize had no significant effect onthe population density of P. zeae in riceroots. Furthermore, although maize isclearly a very good host for P. zeae (seefigure), intercropping did not increasethe population density of the nematodein either rice or maize in the secondconsecutive year of the trial.
In contrast, P. zeae numbers in soilfrom the rhizosphere of rice increasedas the proportion of maize in themixture increased (P < 0.01) (see table).This increase in soil population
1200
1000
800
600
400
200
0
2nd 3rd 2nd 3rd 2nd 3rd
**
**
***
***
**
ns
Maize
Rice
Mean nematode densities for 100 mL soil and 5 g root
P. zeaeRoots
P. zeaeSoil
H. dihysteraSoil
**P<0.01; *** P<0.001; ns = not significant at P<0.05.
Review of notes. The IRRN editor will send an acknowledgment card or an e-mail message when a note is received. An IRRIscientist, selected by the editor, reviews each note. Reviewer names are not disclosed. Depending on the reviewer’s report, a notewill be accepted for publication, rejected, or returned to the author(s) for revision.
Comments. If you have comments or suggestions about the IRRN, please write to the editor.
Pratylenchus zeae and Helicotylenchus dihystera densities: combined treatments for rice andmaize sampled at maturity in the 2nd and 3rd cropping seasons.
densities of P. zeae likely resulted fromthe migration of nematodes fromheavily infested and senescing roots ofneighboring maize crops at maturity.The impact of this migration on ricegrowth is likely to be greater wheremaize is sown early and harvestedearly in the rice season, as is often the
case in West Africa, thereby releasinghigh populations of nematodes toinvade rice roots. P. zeae is a recognizedpest of both crops and is responsible forproduction losses. Using cultivars thatexpress tolerance for resistance to nema-todes would therefore be an advantagefor these low-input systems. ■

Vol. 23, No. 3 29
Rodent pests of upland andlowland rice at a derivedsavanna site in Nigeria
A.A. Asimalowo, A.I. Ayodele, Wildlife andFisheries Management Department, University ofIbadan; and B.N. Singh, c/o InternationalInstitute of Tropical Agriculture (IITA), Ibadan,Nigeria
Rodents are one of the major pestsdamaging the rice crop in Nigeria.Their population, damage, and speciesvariation were monitored in upland,rainfed, and irrigated lowland areas inthe 1994-95 dry and wet seasons. Thesefields were located at different siteswithin the experimental farm at IITA,Ibadan. The location represents aderived savanna agroecological zone,with an average bimodal rainfall of1,400 mm.
Rodent species were sampled bymechanical trapping, fecal droppings,and use of poisoned baits for identi-fication. Damage was monitored atvarious growth stages of the crop. Thetotal of all catches was used to calculatepercentage of occurrence of individualspecies. Varietal preferences based ondamage in different replicates weremonitored in breeders’ trials. Zincphosphide was first administeredfollowed by coumatetralyl (0.375 ai)rodenticide to capture and manage therodent population.
Ten rodent species were trapped (seetable). In the uplands, three species—Arvicantis niloticus rufinus (Nile rat),Rattus morio (jumping mouse), and alagormorph Xerus erythropus (groundsquirrel)—were observed in the wetseason. Three other species—Dasymusincomtus (shaggy rat), Mastomysnatalensis (multimammate rat), andSteatomys caurinus (fat mouse)—wereobserved in the irrigated lowlands inboth dry and wet seasons. All threespecies dig burrows in levees aroundfields.
Rodent species and crop damage stage in different rice-growing environments.
Rice- Occurrence Crop Months of damagegrowing (%) damage
Common name Scientific name environment stageand seasona
Ground squirrel Xerus erythropus U; 3.3 Tillering May to AugWS
Nile rat Arvicantis U; 17.3 Maturity Sep to Octniloticus rufinus WS
Jumping mouse Rattus morio U; 2.5 Maturity Sep to OctWS
Fat mouse Steatomys caurinus I; 5.3 Maturity Apr to AugDS
Shaggy rat Dasymus incomtus I; 14.0 Maturity JunDS
Multimammate rat Mastomys natalensis I; 35.8 Maturity JunDS
Swamp rat Malacomys longipes I, 3.5 Maturity Mar to OctR; 5.1WS, DS
Black rat Rattus rattus frugivorus I, 0.3 Maturity Mar to OctR; 0.5WS, DS
Slender gerbil Taterillus gracilis R; 6.6 Maturity Oct to DecWS
Cane rat Thryonomys swinderianus U, 2.3 Vegetative May to DecR, 1.5 toI; 2.0 maturityWS
aU = uplands, I = irrigated lowlands, R = rainfed lowlands, DS = dry season, WS = wet season.
Routine research. Reports of screen-ing trials of varieties, fertilizer, crop-ping methods, and other routineobservations using standard method-ologies to establish local recommen-dations are not ordinarily accepted.Examples are single-season, single-trial field experiments. Field trialsshould be repeated across more thanone season, in multiple seasons, or inmore than one location as appropriate.All experiments should includereplications and an internationallyknown check or control treatment.
Two other species, Malacomyslongipes (swamp rat) and Rattus rattusfrugivorus (black rat), overlap in bothrainfed and irrigated lowlands. Onespecies, Taterillus gracilis (slendergerbil), was observed in rainfedlowland fields only. Another large-sized species, Thryonomys swinderianus(cane rat), was observed in all threerice-growing ecologies and at all cropgrowth stages. In irrigated lowlands, itinvades only during crop maturation,when fields are dry. The table showscrop damage stage and frequency ofoccurrence of each rodent pest. Themultimammate rat occurred in thehighest frequency (36%).
Rodent activities were mostlynocturnal but, at high populationdensity, they were also seen duringdaytime. Only the ground squirrel wasdiurnal. All rat species, except for thecane rat, cut individual tillers atmaturity. The cane rat damaged alltillers in a hill before proceeding to
other hills. It also did not accept anypoisoned or unpoisoned bait andtherefore was controlled by wirefencing. Among the rice varietiestested, DJ11-307-15 was selectivelyattacked by the cane rat in the rainfedlowland yield trial in all three replica-tions. The cane rat may have certainpreference traits compared with otherrodents. Many other rice varieties wereattacked in one or two replications. ■

30 IRRN 1998
Farming systems
Potential of rice and potatointer/relay cropping systemwith sugarcane
G.P. Singh and S.N. Singh, Uttar Pradesh Councilof Sugarcane Research, Shahjahanpur 242001,Uttar Pradesh, India
The planting spindle bud culturemethod was developed to exploitproductivity and profitability per unitarea. The method uses inter/relaycropping of rice and potato withsugarcane, and two sugarcane cuttingsfrom the same piece of land in 1 1/2 yr.With this, the profitability of the systemcan be further improved by growingwheat as an intercrop after the cane’ssecond cutting in Nov-Dec.
After field preparation, 1-mo-oldplantlets of sugarcane developed by thespindle bud culture technique weretransplanted in rows at a distance of90 cm on 20 Jun. Thereafter, five rows ofrice (Saket 4) were transplanted 18 cmapart (normal spacing is 20 cm) ininterrow spaces of sugarcane afterflooding, followed by semipuddling bya plow. The rice crop, with a plantpopulation of 100% on a per unit areabasis, was harvested during the secondhalf of Oct. After that, one row of potato
was sown by the ridge method afterfield preparation, maintaining 50% ofthe plant population at a row-to-rowdistance of 45 cm. Potato tubers wereharvested in the first half of Feb andyield was recorded.
The sugarcane crop planted on 20Jun formed sparse canopies. Themature canes (first crop cutting) wereharvested during the last week of Mar.Thereafter, stubbles along with watershoots and late-formed tillers were leftto grow from Apr onward. Finalharvesting was done in Nov and caneyield and quality characters wererecorded. A split-plot statistical designwas used, with planting technique asthe main plot and inter/relay croppingsystem as the subplot.
The nutrient needs of all three cropswere met separately based on standardrecommendations. The field wasfertilized with 180 kg N ha-1 forsugarcane, and 120-60-60 kg NPK ha-1
for rice and potato. In sugarcane, abasal dose of 1/4 N was applied attransplanting and the remaining 3/4dose in four equal splits (two top-dressed after harvesting of rice andpotato and the remaining two top-dressed after harvesting of maturecanes after Mar at tillering). In addition,
two foliar sprays of urea at 10% weregiven to the second crop of sugarcanein Jul. In rice and potato, the abovenutrient doses were given based on therecommended application method.
Moreover, five manual hoeings/weedings were done in the interrowspaces of sugarcane to allow it todevelop a full canopy.
The mean yield of transplanted riceintercropped with sugarcane was 4.3 tha-1, 17.4% more than that of direct-seeded rice (see table). Rice yield in thissystem was not affected adversely to alarge extent due to sparse canopy andless tillering of sugarcane broughtabout by decreasing temperature, asshown by the sugarcane yield in thefirst cutting. But yield of intercroppedcane averaged 18.2% less than that ofsugarcane alone. Potato intercroppedwith transplanted sugarcane plantletsyielded more because of sufficientspace for cultural operations. The yieldof sugarcane using transplantedplantlets was 35% higher than thestandard method, which reducedgermination.
In the second cutting, sugarcaneyield was much higher under inter/relay cropping than in sole cane. This isdue to the dense canopy and greater
Production potentials of rice and potato inter/relay cropping system with sugarcane.a
Yield of sugarcane (t ha–1) Commercial cane sugar (%)Treatment Rice Potato Cost of Gross Net
yield yield First Second Total First Second Mean cultivation return return(t ha–1) (t ha–1) cutting cutting cutting cutting (Rs ha–1) (Rs ha–1)b (Rs ha–1)
T1: Transplanting ofsugarcane plantlets alone – – 43.4 89.2 132.6 10.8 11.0 10.9 32,631 92,827 60,196T2: Transplanting ofplantlets + rice(transplanted) – potato 4.2 16.5 37.2 101.5 138.7 10.7 10.7 10.7 50,107 147,922 97,815T3: Transplanting ofplantlets + rice(broadcast) – potato 3.5 15.4 36.3 99.4 135.8 10.4 10.7 10.6 49,486 140,552 91,066T4: Settc planting ofsugarcane alone – – 29.7 74.1 103.9 10.5 10.3 10.4 32,811 72,709 39,898T5: Sett planting + rice(transplanted) – potato 4.4 14.2 23.7 89.6 113.4 10.3 10.0 10.2 50,287 125,651 75,364T6: Sett planting + rice(broadcast) – potato 3.7 13.0 22.5 86.8 109.3 10.4 10.7 10.6 49,690 117,516 67,826
aNet plot size used : 8 × 4.5 = 36.0 m2. bPrevailing market prices: Sugarcane, Rs70 q–1, Rice, Rs360 q–1, Potato, Rs215 q–1. cA sett is a mature cane cut into pieces of 2-3 internodes/nodes (eyes)and used for planting as a seed material.

Vol. 23, No. 3 31
Farm machinery
Rice-cum-green manure culturewith modified drum seederunder lowland condition
P. Rajendran, A. Tajuddin, and C. Ramaswami,Tamil Nadu Agricultural University, Coimbatore641003, India
We initially investigated Sesbaniaaculeata as an intercrop in wet-seededrice. Compared with rice alone, riceintercropped with green manure (GM)had a yield advantage when GM wasincorporated at about 35-40 cm height.Mean height of the rice crop was 32 cm.Further work is required, however, tofind cheaper ways of incorporating GMand weeding to reduce cultivationcosts.
A modified seeder was developedbased on the IRRI drum seeder design(Fig. 1). The seeder was field-tested in a0.03-ha unreplicated plot in 1998. It hastwo wheels and sows rice and GM inalternate rows 12.5 cm apart. Theseeder width is 0.75 m. The walkingspeed is around 1.5 km h-1. Includingtime loss for unhooking and hookingthe handle after each pass, two men cancover 0.54 ha d-1. The advantages of theseeder are shown in Table 1.
The low seeding rate of GM (20 kgha–1) was due to seed availability.
The GM intercrop was trampledboth manually and by using the IRRIsingle-row conoweeder at 36 DAS (Fig.2). Table 2 shows the benefits of thetechnology.
This trial indicated the possibility ofintercropping rice with GM as a poten-tially useful technology. Fine-tuning ofthe intercropping technology consider-ing rice duration, cultivation season,and location is the focus of futureresearch. ■
number of cane plants caused byfavorable temperature in April as wellas by the residual effect of potato oncane plants. The commercial cane sugar(CCS) percentage in cane was more orless identical under different cropping
systems. Overall performance for yieldand economic returns of rice, potato,and sugarcane were higher under theinter/relay cropping system ofsugarcane + rice-potato (preferably with
transplanted plantlets) than under thesole cane crop. This method can besuccessfully adopted by small andmarginal farmers after the May harvestof late-sown wheat.■
1. A modified IRRI drum seeder. (Net weight = 17 kg, wheel diameter = 60 cm, drumdiameter = 20 cm).
Table 1. Advantages of the seeder.
Modified seeder for rice + GM intercropping Transplanting rice
Duration, wet biomass 36 d, 7 t ha–1, and 20 kg ha–1, respectively Advantage of dualaddition, seeding rate of GM cropping does not exist
Green manure height 40 cm and 35, respectively –and number of nodules plant–1
Rice establishment charges over $15 ha–1 a $100 ha–1
same preparatory cultivation
aIncludes additional cost for proper leveling.
Wheel Skid GM seedrow
Rice seed row
Table 2. Benefits of using the modified seeder.
Trampling-cum-weeding by IRRI Manual tramplingsingle-row conoweeder
Labor requirement (man-days) 18 ha–1 54 ha–1
Cost involved ha–1 US$14 US$42Additional benefit compared with no intercrop Weeds are buried completely,
thereby adding more organic matter.

32 IRRN 1998
2. Trampling of Sesbania cannabina intercrop by single-row conoweeder
Just-trampled rows Trampling action
Announcements
CABI Bioscience training courses
Insect Pathology30 Mar to 23 Apr 1999This course draws on the expertise ofthe CABI Bioscience multidisciplinarybiopesticide team and offersparticipants the opportunity to learnabout the stages of biopesticideproduction, from exploration toregistration. The course fee is £4,000.This does not include accommodation,although inexpensive universityaccommodation can be bookedthrough CABI Bioscience for thiscourse.
International Course on theIdentification of Fungi of Agriculturaland Environmental Significance12 Jul to 13 Aug 1999Training on the identification andclassification of economicallyimportant fungi, particularly thoseassociated with plant diseases andthose that are difficult to identify. Thecourse will take account of both tropicaland temperate examples in all sections.The course fee of £3,900 includes allmaterials and the cost of self cateringaccommodation.
Entomology Foundation Course23 Aug to 24 Sep 1999This popular, intensive and practicalcourse is designed to give participantsthe knowledge and skills they need toidentify a broad range of insects, and togive an insight into their biology. The
Cantrell is new DG
A good administrator and anexcellent communicator—this is howIRRI Board of Trustee Chair RoelofRabbinge describes the new IRRIdirector general, Dr. Ronald P.Cantrell. After a 6-mo long screeningprocess, the Search Committeeannounced the selection of thisdistinguished agronomist who wasprofessor of plant breeding and headof the Agronomy Department ofIowa State University in the UnitedStates. Dr Cantrell took up hisposition as IRRI director general on 1Sep 1998.
The new IRRI director general hashad extensive experience in agricul-tural research, both internationallyand in the U.S. He has been directorof the Maize and WheatImprovement Center (CIMMYT) inMexico. Previous to this, heconducted farm-level research in
Burkina Faso as chief of PurdueUniversity’ farming systems team.He was also professor of agronomyin Purdue, teaching genetics and, atthe same time, doing sorghumbreeding research. He was a formermanager of the Cargill CornResearch Station in Nebraska, beingresponsible for developing maizehybrids for Cargill’s western salesregion.
Dr. Cantrell’s awards are in theareas of teaching, research, andleadership, as have the manyprofessional assign-ments he hasundertaken outside his areas ofemployment. The latest of these ishis being elected this year aspresident of the Crop ScienceSociety of America, of which he is afellow. He is also a fellow of theAmerican Society of Agronomy.
Dr. Cantrell attended Texas TechUniversity, receiving his BS inagronomy in 1966. He earned his
MS and PhD in plant breedingand genetics in PurdueUniversity in 1969 and 1970,respectively.
His appointment as directorgeneral comes as IRRI enters the21st century. The IRRIconstituents have expressedconfidence in Dr. Cantrell’s abilityto maintain the institute’s statusas the flagship center of the CGsystem. ■

Vol. 23, No. 3 33
IRRI 1999 calendar of international training courses
Course/venue Number Duration Inclusiveof trainees in weeks dates
Basic Experimental Designand Data Analysis (IRRI) 15 2 1-12 Feb
Rice Production (IRRI) 25 2 18-29 Jan
Introduction to IRRIStat 15 1 1-5 MarStatistical Software (IRRI)
Hybrid Rice Breeding 24 8 1 Mar-23 Apr
Introduction to SAS (IRRI) 15 1 26-30 Apr
Precision Rice Farming for Asia (IRRI) 20 4 Apr-Mayb
Instructional Video Production (IRRI) 12 4 7 Jun-2 Jul
Introduction to New Developments in G × E 15 1 7-11 JunAnalysis and Interpretation of Results (IRRI)
Analysis of Unbalanced Data (IRRI) 15 1 31 May-4 Jun
Analysis of Categorical Data (IRRI) 15 1 21-25 Jun
Rice Seed Health Training (IRRI) 10 12 5 Jul-24 Sep
Adaptive Research with a Farming 20 6 19 Jul-27 AugSystems Perspective1 (FSSRI, UPLB,College, Laguna, Philippines)
Integrated Pest Management in Rice2
(NCPC, UPLB, College, Laguna, Philippines) 20 8 Aug-Octb
Soil & Water Biochemistry Ecotoxicology (IRRI) 9 3 23 Aug-10 Sep
Applications of Molecular Tools 15 2-3 Septo Study Rice Virusesa (China/IRRI) 8 6 Sep
Genetic Evaluation and Utilization for Rainfed 15 4 Sep-Octb
Rice Ecosystems3 (URRC, Ubon, Thailand)
Transgenic Rice: Production and Deployment 13 3 27 Sep-17Octwith Special Reference to SheathBlight and Rice Stem Borer Resistance
Rice Production Research4
(PTRRC, Pathum Thani, Thailand) 25 8 Oct-Nov
aTwo venues are beng explored; to be finalized later. bTentative schedule.
Collaborative Regional Training Courses
1Farming Systems and Soil Resources Institute (FSSRI), PhilRice, UPLB, and IRRI.2National Crop Protection Center (NCPC), University of the Philippines Los Baños (UPLB).3Ubon Rice Research Center (URRC) and IRRI.4Pathum Thani Rice Research Center (PTRRC) and IRRI.
Note: For more information about the IRRI training activities, please visit us at http://www.cgiar/org/irri/training
Note: For further details on all courses, please contact Mrs.Stephanie Groundwater, CABI Bioscience, UK Center, Egham,Surrey, TW20 9TY, UK. Tel: +44(0) 1784 470111. Fax:(01491) 829100. Email: [email protected].
Errata• In vol. 23, No. 2 (1998), on page 45
(column 3), Cnaphalocrosis should beCnaphalocrocis.
• Leptocorisa acuta should beLeptocorisa oratorius. The former is amisidentification and if it is presentin the IRRI farm, its population isvery low. L. oratorius is the mostcommon and most abundant ricebug around. ■
course is intended for those with someprevious experience of entomology,working in agriculture, forestry, orenvironmental protection worldwide.Advanced modules will be available onsome orders immediately after thecourse. The course fee of £4,400includes self catering accommodation.
Biological Control of Arthropod Pestsand Weeds30 Aug to 24 Sep 1999This course is aimed at agriculturalresearchers and extension workers,including crop protection staff whowish to broaden their knowledge ofpest management. Participants willlearn the principles and basicmethodology of biological pestmanagement, how to conservepredators and parasites, how tointroduce natural enemies from thenative habitat of exotic pests, and howto culture arthropod and microbialcontrol agents for field release. Thecourse fee of £3,600 includes tuition, allmaterials, and self-cateringaccommodation. ■


Instructions for contributorsNOTES
General criteria. Scientificnotes submitted to the IRRN forpossible publication should● be original work,● have international or pan-national relevance,● be conducted during theimmediate past three years orbe work in progress,● have rice environmentrelevance,● advance rice knowledge,● use appropriate researchdesign and data collectionmethodology,● report pertinent, adequatedata,● apply appropriate statisticalanalysis, and● reach supportable conclu-sions.
Routine research. Reports ofscreening trials of varieties,fertilizer, cropping methods,and other routine observationsusing standard methodologiesto establish local recommenda-tions are not ordinarily ac-cepted. Examples are single-season, single-trial fieldexperiments. Field trials shouldbe repeated across more thanone season, in multipleseasons, or in more than onelocation as appropriate. Allexperiments should includereplications and an internation-ally known check or controltreatment.
Multiple submissions. Nor-mally, only one report for asingle experiment will beaccepted. Two or more itemsabout the same work submittedat the same time will bereturned for merging. Submit-ting at different times multiplenotes from the same experi-ment is highly inappropriate.Detection will result in therejection of all submissions onthat research.
IRRN categories. Specify thecategory in which the notebeing submitted should appear.Write the category in the upperright-hand corner of the firstpage of the note.
GERMPLASM IMPROVEMENTgenetic resourcesgeneticsbreeding methodsyield potentialgrain qualitypest resistance
diseasesinsectsother pests
stress tolerancedroughtexcess wateradverse temperatureadverse soilsother stresses
integrated germplasm improve-ment
irrigatedrainfed lowlanduplandflood-prone (deepwater and tidal wetlands)
seed technology
CROP AND RESOURCEMANAGEMENT
soilssoil microbiologyphysiology and plant nutritionfertilizer management
inorganic sourcesorganic sources
crop managementintegrated pest management
diseasesinsectsweedsother pests
water managementfarming systemsfarm machinerypostharvest technologyeconomic analysis
ENVIRONMENTSOCIOECONOMIC IMPACTEDUCATION AND COMMUNI-
CATIONRESEARCH METHODOLOGY
Manuscript preparation.Arrange the note as a briefstatement of research objec-tives, a short description ofproject design, and a succintdiscussion of results. Relateresults to the objectives. Do notinclude abstracts. Do not citereferences or include abibliography. Restrain acknowl-edgments.
Manuscripts must be inEnglish. Limit each note to nomore than two pages of double-spaced typewritten text. Submitthe original manuscript and aduplicate, each with a clear copyof all tables and figures. Authorsshould retain a copy of the noteand of all tables and figures.
Apply these rules, asappropriate, in the note:
● Specify the rice productionecosystems as irrigated, rainfedlowland, upland, and flood-prone(deepwater and tidal wetlands).● Indicate the type of riceculture (transplanted, wetseeded, dry seeded).● If local terms for seasons areused, define them by character-istic weather (wet season, dryseason, monsoon) and bymonths.● Use standard, internationallyrecognized terms to describerice plant parts, growth stages,and management practices. Donot use local names.● Provide genetic background fornew varieties or breeding lines.● For soil nutrient studies,include a standard soil profiledescription, classification, andrelevant soil properties.● Provide scientific names fordiseases, insects, weeds, andcrop plants. Do not use commonnames or local names alone.● Quantify survey data, such asinfection percentage, degree ofseverity, and sampling base.● When evaluating susceptibility,resistance, and tolerance,report the actual quantificationof damage due to stress, whichwas used to assess level orincidence. Specify the measure-ments used.● Use generic names, not tradenames, for all chemicals.
● Use the International Systemof Units for measurements. Forexample, express yield data inmetric tons per hectare (t ha–1)for field studies. Do not uselocal units of measure.● Express all economic data interms of the US$. Do not uselocal monetary units. Economicinformation should be pre-sented at the exchange rateUS$:local currency at the timedata were collected.● When using acronyms orabbreviations, write the namein full on first mention, followedby the acronym or abbreviationin parentheses. Use theabbreviation thereafter.● Define any nonstandardabbreviations or symbols usedin tables or figures in a foot-note, caption, or legend.
Each note can have nomore than two tables and/orfigures (graphs, illustrations, orphotos). All tables and figuresmust be referred to in the text;they should be grouped at theend of the note, each on aseparate page. Tables andfigures must have clear titlesthat adequately explain thecontents.
Review of notes. The IRRNeditor will send an acknowledg-ment card or an e-mailmessage when a note isreceived. An IRRI scientist,selected by the editor, reviewseach note. Reviewer names arenot disclosed. Depending onthe reviewer’s report, a notewill be accepted for publication,rejected, or returned to theauthor(s) for revision.
Comments. If you have com-ments or suggestions about theIRRN, please write to the editor.
Mailing address. Send notesand correspondence to theIRRN Editor, IRRI, P.O. Box 933,Manila 1099, Philippines.Fax: (63-2) 845-0606E-mail: [email protected],[email protected] page: http://www.cgiar.org/irriRiceweb: http://www.riceweb.orgRiceworld: http://www.riceworld.org

INTERNATIONAL RICE RESEARCH INSTITUTE
P. O. Box 933, 1099 Manila, Philippines
Printed Matter
ISSN 0115-0944