International Public Opinion on Climate Change
26
International Public Opinion on Climate Change
Transcript of International Public Opinion on Climate Change

International Public Opinionon Climate Change

International Public Opinion on Climate Change 1
Table of Contents
Introduction ................................................................................................................................................. 2
Executive Summary .................................................................................................................................... 3
1 Climate Change Knowledge and Beliefs ............................................................................................. 5
2 Worry and Perceived Risks Regarding Climate Change ..................................................................... 9
3 Support for Government Action to Address Climate Change ........................................................... 13
4 Energy and the Economy ................................................................................................................... 16
5 Climate Activism ............................................................................................................................... 19
6 Six Climate Change Audiences ......................................................................................................... 20
Appendix I: Survey Method...................................................................................................................... 22

International Public Opinion on Climate Change 2
Introduction
This report presents results from an international survey, conducted in partnership with Facebook Data for Good, investigating public climate change knowledge, attitudes, policy preferences, and behavior among Facebook users in more than 30 countries and territories worldwide. A few of the findings included in this report were originally presented in April 2021 in our brief report International Public Support for Climate Action. Interview dates: February 17 – March 3, 2021. Interviews: 76,328 Facebook monthly active users (18+) from 31 countries and territories. The Yale research team was supported by the MacArthur Foundation. Principal Investigators: Anthony Leiserowitz, PhD Yale Program on Climate Change Communication [email protected] Jennifer Carman, PhD Yale Program on Climate Change Communication [email protected] Seth Rosenthal, PhD Yale Program on Climate Change Communication [email protected] Cite as: Leiserowitz, A., Carman, J., Buttermore, N., Wang, X., Rosenthal, S., Marlon, J., & Mulcahy, K. (2021).
International Public Opinion on Climate Change. New Haven, CT: Yale Program on Climate Change Communication and Facebook Data for Good.

International Public Opinion on Climate Change 3
Executive Summary
This report describes climate change beliefs, attitudes, policy preferences, and behaviors among Facebook users in 31 countries and territories worldwide. The survey was fielded in partnership with Facebook Data for Good from February 17 to March 3, 2021. Among the key findings:
Climate Change Knowledge and Beliefs
• Knowledge about climate change: Respondents in Australia (78%) and Germany (77%) are the most likely to say they know “a lot” or “a moderate amount” about climate change. In contrast, respondents in Nigeria (28%) and Malaysia (20%) are the most likely to say they have “never heard of” climate change.
• Climate change is happening: Respondents in Costa Rica (94%), Brazil, and Spain (both 92%) are the most likely to think climate change is happening, while respondents in Indonesia (78%), Egypt, and Saudi Arabia (both 79%) are the least likely.
• Climate change is human-caused: Respondents in Spain (64%) and Italy (60%) are the most likely to think that climate change is mostly caused by human activities, while respondents in Indonesia (16%) and Nigeria (24%) are the least likely.
• Need for information about climate change: Respondents in the Philippines (83%), followed by South Africa and Vietnam (both 78%) are the most likely to say they need “a lot more” or “some more” information about climate change to form a firm opinion about it, while respondents in the United States, Australia, and the Netherlands (all 44%) are the least likely.
Worry and Perceived Risks Regarding Climate Change
• Worry about climate change: Respondents in Mexico (94%), Costa Rica (92%), and Colombia(91%) are the most likely to say they are “very worried” or “somewhat worried” about climatechange, while respondents from Egypt (50%) and Nigeria (58%) are the least likely.
• Climate change will be personally harmful: Respondents are the most likely to say thatclimate change will harm them personally “a great deal” or “a moderate amount” in Vietnam andMexico (both 83%), and the least likely to say so in the Czech Republic (28%) and theNetherlands (31%).
• Climate change will harm future generations: Respondents are the most likely to say thatclimate change will harm future generations “a great deal” or “a moderate amount” in Mexico(89%), Vietnam, and Costa Rica (both 88%), while respondents in Egypt (48%) and SaudiArabia (53%) are the least likely to say so.
• Personal importance of climate change: Respondents in Costa Rica (81%), and Italy,Colombia, and the Philippines (all 78%) are the most likely to say that climate change is“extremely” or “very” important to them personally, while respondents in Egypt and Russia(both 31%) are the least likely to say so.
Support for Government Action to Address Climate Change
• Climate change as a government priority: Respondents in Mexico (91%), Colombia, andCosta Rica (both 89%) are the most likely to say that climate change should be a “high” or “veryhigh” priority for their government, while respondents in Saudi Arabia (53%) and Egypt (55%)are the least likely to say so.

International Public Opinion on Climate Change 4
• Support for the Paris Climate Agreement: Support for the Paris Climate Agreement is highest in Costa Rica (96%), Spain, Japan, Vietnam, Italy, and Mexico (all 95%). Support is lowest, though still a majority, in the United States (74%) and Nigeria (80%).
• Governments should do more about climate change: Respondents are most likely to say their governments should do “much more” or “more” to address climate change in Italy, Colombia, and Spain (all 89%), and are the least likely in Saudi Arabia (42%) and Egypt (47%).
Energy and the Economy
• Perceived economic impacts of action to reduce climate change: Respondents in the Philippines (76%) and South Africa (69%) are the most likely to say that action to reduce climate change will improve economic growth and provide new jobs, while respondents in the Czech Republic (24%) and the Netherlands (28%) are least the likely to say so.
• Increasing use of renewable energy: Respondents in Spain (91%), and Costa Rica and Italy (both 90%) are the most likely to say that their country or territory should use “much more” or “somewhat more” renewable energy, while respondents in Saudi Arabia (62%), and the Czech Republic and Indonesia (both 66%) are the least likely.
• Decreasing use of fossil fuels: Respondents in Spain (76%) and the United Kingdom (75%) are the most likely to say that their country or territory should use “much less” or “somewhat less” fossil fuels, while respondents in Saudi Arabia (21%) and Nigeria (23%) are the least likely.
Climate Activism
• Willingness to participate in a campaign for climate action: Respondents in Colombia and Mexico (both 79%) are the most likely to say that they are currently participating, “definitely would” participate, or “probably would” participate in a citizens’ campaign to convince leaders to take action to reduce climate change. Respondents in the Netherlands and Japan (both 29%) are the least likely.
Six Climate Change Audiences
• Six climate change audiences: Our prior research has found that people in the United States can be categorized into six distinct groups – Global Warming’s Six Americas – based on their beliefs and attitudes about climate change. Applying this analysis to these countries and territories, Costa Rica (64%) and Colombia (63%) have the largest proportions of respondents in the Alarmed group, while the Czech Republic (13%) and Russia (15%) have the smallest. On the other end of the spectrum, the United States (11%) and Australia (8%) have the largest, though still small, proportions of respondents in the Dismissive group.

International Public Opinion on Climate Change 5
1 Climate Change Knowledge and Beliefs
1.1 Respondents in many countries and territories say they know at least a moderate amount about climate change.
A majority of respondents in about half (15 of the 31) of the countries and territories surveyed say they know at least a moderate amount about climate change. Respondents in Australia (78%) and Germany (77%) are the most likely to say they know “a lot” or “a moderate amount,” followed by the Netherlands (76%), the UK (75%), Canada (74%), Ireland (73%), France (72%), and the United States (71%).
By contrast, substantial percentages of respondents say they have “never heard of” climate change in Nigeria (28%), Malaysia (20%), Egypt (19%), Saudi Arabia (18%), Vietnam (16%), and South Africa and India (both 15%). It is also important to note that this survey was conducted on the Facebook platform and so likely underrepresents populations with lower incomes and literacy rates, groups that prior research has found are more likely to know little or nothing about climate change.

International Public Opinion on Climate Change 6
1.2 The great majority of respondents think climate change is happening.
After being asked about their current level of knowledge about climate change, respondents were given a short definition of climate change: “Climate change refers to the idea that the world’s average temperature has been increasing over the past 150 years, will increase more in the future, and that the world’s climate will change as a result. What do you think: Do you think climate change is happening?” The great majority of respondents in all 31 surveyed countries and territories say that they think climate change is happening. This includes nine in ten or more respondents in Costa Rica (94%), Brazil, (92%), Spain (92%), France (91%), Taiwan (91%), Mexico (91%), Japan (91%), Poland (90%), Colombia (90%), Argentina (90%), and the United Kingdom (90%). This percentage is lowest, but still high, in Egypt (79%), Saudi Arabia (79%), and Indonesia (78%). In the United States, the respondents who say climate change is happening (80%) outnumber those who think it is not happening (12%) by a ratio of more than six to one.

International Public Opinion on Climate Change 7
1.3 Most respondents think climate change is at least partially caused by humans.
A majority of respondents in all 31 surveyed countries and territories say that climate change is at least partially caused by human activities. However, majorities say that climate change is mostly caused by human activities in only 13 countries and territories. Respondents in Spain (64%) and Italy (60%) are the most likely to say that climate change is mostly caused by human activities, while respondents in Indonesia (16%) are the least likely. A total of about three in four respondents in the United States (74%) say climate change is at least partially caused by human activities, but only four in ten (40%) say it is mostly caused by human activities.
Respondents in Nigeria (29%) are the most likely to say climate change is caused mostly by natural changes in the environment, followed by respondents in South Africa (24%), Egypt (22%), Saudi Arabia (20%), and the Philippines (19%).

International Public Opinion on Climate Change 8
1.4 Most respondents say they need more information about climate change.
A majority of respondents in all surveyed countries and territories say they need at least a little more information about climate change to form a firm opinion about it. Respondents in Vietnam are the most likely to say that they need “a lot” more information (52%), followed by respondents in Nigeria (51%), the Philippines (51%), South Africa (48%), Turkey (45%), and Indonesia (45%). Respondents in the United Kingdom (12%) and the Netherlands (12%) are the least likely to say they need “a lot” more information. Respondents from the United States (37%) and Australia (36%) are the most likely out of all surveyed countries and territories to say they do not need any more information.

International Public Opinion on Climate Change 9
2 Worry and Perceived Risks Regarding Climate Change
2.1 A majority of respondents in every country and territory are worried about climate change.
A majority of respondents in every country and territory surveyed say they are “very” or “somewhat” worried about climate change, ranging from more than nine in ten respondents in Mexico (94%), Costa Rica (92%), and Colombia (91%) to half of respondents in Egypt (50%). In the United States, about two-thirds of respondents (66%) say they are “very” or “somewhat” worried about climate change – nearly two times as many as say they are “not very” or “not at all” worried about it (34%).

International Public Opinion on Climate Change 10
2.2 Many respondents think climate change will harm them personally.
A majority of respondents in 24 out of 31 surveyed countries and territories think climate change will harm them personally either “a great deal” or “a moderate amount,” including majorities in five countries that say climate change will harm them “a great deal.” Respondents are the most likely to say that climate change will personally harm them “a great deal” or “a moderate amount” in Mexico (83%), Vietnam (83%), and Costa Rica (80%), and the least likely to say so in the Czech Republic (28%). In the United States, about half of respondents (49%) think climate change will harm them personally either “a great deal” or “a moderate amount,” while about one in five (21%) do not think climate change will harm them at all.

International Public Opinion on Climate Change 11
2.3 Most respondents think climate change will harm future generations.
A majority of respondents in nearly every country or territory say that climate change will harm future generations “a great deal” or “a moderate amount,” ranging from nearly nine in ten respondents in Mexico (89%) to just under half of respondents in Egypt (48%). In fact, a majority of respondents in 23 countries and territories say climate change will harm future generations “a great deal.”
In the United States, most respondents say climate change will harm future generations either “a great deal” (54%) or “a moderate amount” (16%), while about one in ten (11%) say that climate change will not harm future generations at all.

International Public Opinion on Climate Change 12
2.4 Climate change is personally important to most respondents.
A majority of respondents in 24 of the 31 surveyed countries and territories say that the issue of climate change is either “extremely” or “very” important to them personally. Respondents are the most likely to say that climate change is “extremely” or “very” important in Costa Rica (81%), followed by Italy (78%), Colombia (78%), and the Philippines (78%). Respondents are the least likely to say so in Russia (31%), Egypt (31%), the Czech Republic (32%), and the Netherlands (32%). In the United States, about half of respondents (49%) say that climate change is “extremely” or “very” important to them, while 13% say it is “not at all” important.

International Public Opinion on Climate Change 13
3 Support for Government Action to Address Climate Change
3.1 Most respondents say climate change should be a high priority for their government.
As we first reported in April 2021, a majority of respondents in every surveyed country and territory say climate change should be a “high” or “very high” priority for their own governments, led by Mexico (91%), Colombia (89%), and Costa Rica (89%), to a low of 53% in Saudi Arabia. In the United States, 61% of respondents say climate change should be a “high” or “very high” priority, while 22% say it should be a “low” priority.

International Public Opinion on Climate Change 14
3.2 There is overwhelming international support for the Paris Climate Agreement.
In December 2015, officials from 197 countries (nearly every country in the world) met in Paris at the United Nations Climate Change Conference and negotiated a global agreement to limit global warming. On Earth Day, April 2016, the United States and 174 other countries signed the agreement, with all of the other countries following suit.
Within every country or territory surveyed, there is overwhelming support for participation in the Paris Climate Agreement.1 Support for the Paris agreement is highest in Costa Rica (96%), followed closely by Spain, Japan, Vietnam, Italy, and Mexico (all 95%). Support is lowest in the United States, although a large majority of respondents (74%) still say they “strongly” or “somewhat” support participation in the agreement.
1 Because Taiwan is not a signatory to the Paris Climate Agreement, but has committed to its goals, respondents in Taiwan were asked to what degree they support or oppose “Taiwan's commitment to the goals set in the Paris agreement.”
International Public Opinion on Climate Change 15
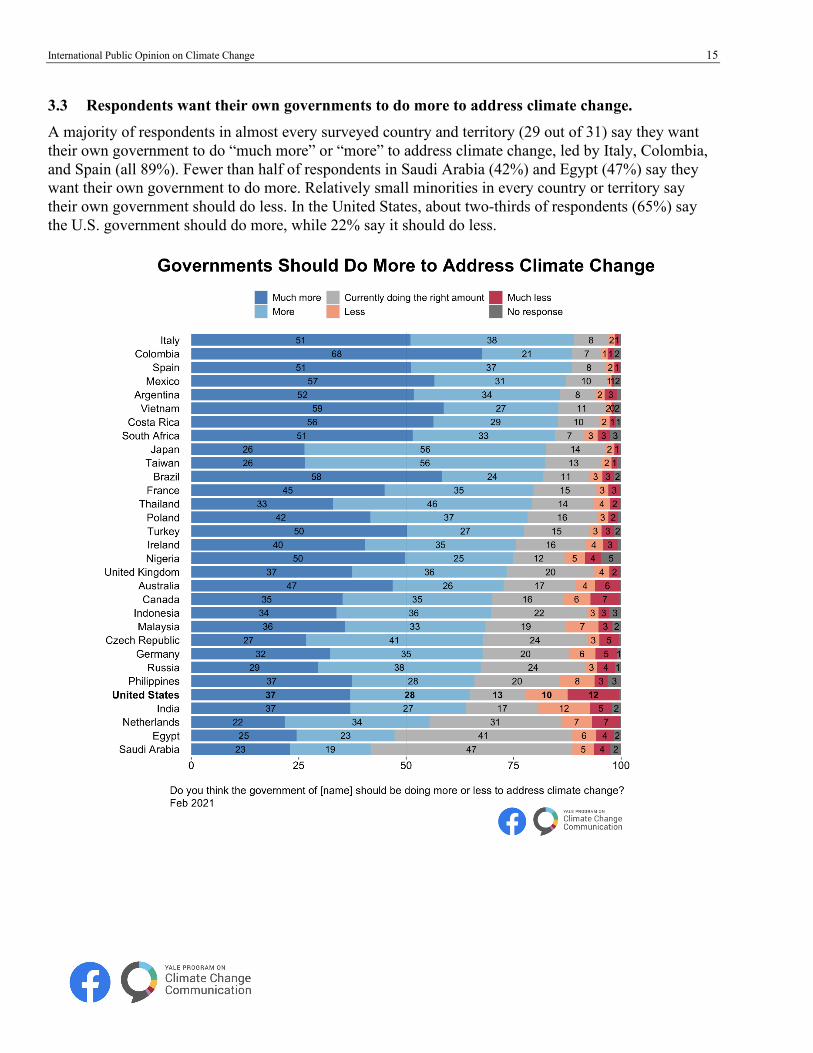
3.3 Respondents want their own governments to do more to address climate change.
A majority of respondents in almost every surveyed country and territory (29 out of 31) say they want their own government to do “much more” or “more” to address climate change, led by Italy, Colombia, and Spain (all 89%). Fewer than half of respondents in Saudi Arabia (42%) and Egypt (47%) say they want their own government to do more. Relatively small minorities in every country or territory say their own government should do less. In the United States, about two-thirds of respondents (65%) say the U.S. government should do more, while 22% say it should do less.

International Public Opinion on Climate Change 16
4 Energy and the Economy
4.1 Majorities in most countries and territories think that action to reduce climate change will improve economic growth.
Majorities of respondents in about two-thirds of the countries and territories surveyed (21 out of 31) think that action to reduce climate change will improve economic growth and provide new jobs. Respondents in the Philippines (76%) are the most likely to think so, while respondents in the Czech Republic (24%) are the least likely. In contrast, respondents in the Czech Republic (39%) and Japan (39%) are the most likely to think that action to reduce climate change will reduce economic growth and cost jobs, while respondents in the Philippines (11%), Nigeria (11%), and Brazil (12%) are the least likely to think so. In the United States, most respondents (52%) think that action to reduce climate change will improve economic growth and provide new jobs, while fewer than three in ten (28%) think it will reduce economic growth and cost jobs.

International Public Opinion on Climate Change 17
4.2 Majorities in every country or territory support increased use of renewable energy.
Large majorities in every surveyed country or territory say that it should use “somewhat more” or “much more” renewable sources of energy than it does currently. Respondents in Spain (91%), Costa Rica (90%), and Italy (90%) are the most likely to think that their country should use “somewhat more” or “much more” renewable energy, while respondents in Saudi Arabia (62%) are the least likely. Relatively few respondents say that their country or territory should use less renewable energy. In the United States, nearly three in four respondents (73%) say that the country should use “somewhat more” or “much more” renewable energy, including about half (51%) who say the U.S. should use “much more.”

International Public Opinion on Climate Change 18
4.3 Majorities in most countries and territories support decreased use of fossil fuels.
Majorities in nearly two-thirds (20 out of 31) of the countries and territories surveyed say their country or territory should use “somewhat less” or “much less” fossil fuels than it does currently. Respondents in Spain (76%) are the most likely to say that their country should reduce their use of fossil fuels, while respondents in Saudi Arabia (21%) are the least likely. In a few countries, many respondents say that their country should increase their use of fossil fuels, including a majority of respondents in Nigeria (54%). In the United States, most respondents (59%) say that the country should use “somewhat less” or “much less” fossil fuels, while about one in five (18%) say the country should use “somewhat more” or “much more.”

International Public Opinion on Climate Change 19
5 Climate Activism
5.1 Majorities in most countries and territories are willing to participate in a citizens’ campaign to reduce climate change.
Substantial numbers of respondents in every country or territory, including majorities in 19 countries and territories surveyed, say they “definitely” or “probably” would participate, or currently are participating, in a citizens’ campaign to convince leaders to take action to reduce climate change. Respondents in Mexico (79%) and Colombia (79%) are the most likely to say they are currently participating, “definitely would” participate, or “probably would” participate in a citizens’ campaign. Respondents from the Netherlands (29%) and Japan (29%) are the least likely to say they are participating or would participate in a such a campaign. In the United States, 5% of respondents say they are already participating in a citizens’ campaign urging action to reduce climate change, and an additional 38% say that they “definitely” or “probably” would do so.

International Public Opinion on Climate Change 20
6 Six Climate Change Audiences
6.1 Many people around the world are Alarmed about climate change.
Our prior research has found that people in the United States can be categorized into six distinct groups based on their beliefs and attitudes about climate change (Global Warming’s Six Americas). The Alarmed are convinced climate change is happening, human-caused, an urgent threat, and they strongly support climate policies. The Concerned think human-caused climate change is happening, is a serious threat, and support climate policies. However, they tend to believe that climate impacts are still distant in time and space, thus the issue remains a lower priority. The Cautious have not yet made up their minds: Is climate change happening? Is it human-caused? Is it serious? The Disengaged know little to nothing about climate change and rarely if ever hear about it. The Doubtful do not think climate change is happening or they believe it is just a natural cycle. The Dismissive are convinced climate change is not happening, human-caused, or a threat, and they oppose most climate policies.
We previously developed a tool, the Six Americas Super Short Survey (SASSY), that categorizes respondents into this six audiences framework with just 4 questions. Ideally, an in-depth study should be conducted within each country to develop its own tailored segmentation of climate change audiences. However, the SASSY tool can be used as a first-order approximation and a means of cross-national comparison using the same set of questions.
Applying this analysis internationally, we find that in about two-thirds (21 of the 31) of the countries and territories surveyed, the Alarmed are the single largest group. In fact, half or more respondents in nine countries and territories are Alarmed: Costa Rica (64%), Colombia (63%), Mexico (62%), Brazil (59%), the Philippines (55%), Turkey (55%), Vietnam (54%), Taiwan (51%), and India (50%). The Czech Republic has the smallest percentage in the Alarmed group (13%). In the United States, about one-third of respondents are Alarmed (34%).
By contrast, very few respondents in any country or territory are Dismissive. The United States has the largest proportion of Dismissives, but they are only about one-tenth of respondents overall (11%).

International Public Opinion on Climate Change 21

International Public Opinion on Climate Change 22
Appendix I: Survey Method
The data in this report are based on a survey of 76,328 Facebook monthly active users, aged 18 and older. The survey was conducted February 17 – March 3, 2021. Sampled Facebook users saw an invitation to answer a short survey at the top of their Facebook Newsfeed and had the option to click the invitation to complete the survey on the Facebook platform.
The sample was drawn from the population of Facebook monthly active users, defined as registered and logged-in Facebook users who had visited Facebook through the website or a mobile device in the last 30 days.2 Within each country or territory surveyed, we drew a sample in proportion to publicly available age and gender benchmarks. The sample population in the United States was drawn in proportion to the U.S. Census Bureau Current Population Survey 2018 March Supplement. All other countries and territories were sampled in proportion to data from the United Nations Population Division 2019 World Population Projections.
Data were weighted separately for each country and territory using a multi-stage, pre- and post-survey weighting process based on census and nationally representative survey benchmarks, Facebook demographics, and Facebook engagement metrics, balanced to the total number of survey completions.3
This project was a partnership between the Yale Program on Climate Change Communication and Facebook Data for Good. The survey instrument was designed by Anthony Leiserowitz, Seth Rosenthal and Jennifer Carman of Yale University, with support by Nicole Buttermore and Kelsey Mulcahy at Facebook. The survey was fielded by Facebook. The charts were designed by Xinran Wang and Jennifer Marlon of Yale University.
Rounding error and tabulation
Percentages are weighted based on general population parameters for each surveyed country and territory.
For tabulation purposes, percentage points are rounded to the nearest whole number. As a result, percentages in a given chart may total slightly higher or lower than 100%. Summed response categories (e.g., “I definitely would do it” + “I probably would do it”) are rounded after sums are calculated (e.g., 25.3% + 25.3% = 50.6%, which, after rounding, would be reported as 25% + 25% = 51%).
2 The Facebook monthly active users figure is reported in the company’s quarterly earnings report found on https://investor.fb.com. As of March 31, 2021, there were 2.85 billion monthly active users globally, including 259 million monthly active users in the US and Canada. 3 Weights were generated in three stages. First, we adjusted for sampling in proportion to age and gender census benchmarks. Second, we adjusted for non-response error using Inverse Propensity Score Weighting (IPSW) on Facebook demographics and Facebook engagement metrics to make the sample more representative of Facebook monthly active users. The Facebook monthly active user sampling frame constitutes a sizable proportion of the global population, but the proportion of adults who use Facebook differs from country to country. To more closely reflect the entire adult population in a country or territory, we used poststratification to publicly available nationally representative survey benchmarks, using weights from the first stages as inputs. The final weights were balanced to the total number of survey completions.

International Public Opinion on Climate Change 23
Sample size for surveyed countries and territories
The unweighted sample sizes for each country and territory are as follows:
• Argentina (n = 2,450) • Australia (n = 2,668) • Brazil (n = 2,093) • Canada (n = 2,888) • Colombia (n = 2,040) • Costa Rica (n = 2,464) • Czech Republic (n = 2,431) • Egypt (n = 1,394) • France (n = 2,339) • Germany (n = 2,375) • India (n = 4,502) • Indonesia (n = 1,377) • Ireland (n = 1,483) • Italy (n = 2,554) • Japan (n = 2,747) • Malaysia (n = 1,125) • Mexico (n = 2,378) • Netherlands (n = 2,495) • Nigeria (n = 1,125) • Philippines (n = 1,126) • Poland (n = 2,446) • Russia (n = 2,568) • Saudi Arabia (n = 952) • South Africa (n = 1,512) • Spain (n = 2,319) • Taiwan (n = 1,918) • Thailand (n = 1,442) • Turkey (n = 1,712) • United Kingdom (n = 2,587) • United States (n = 13,555) • Vietnam (n = 1,263)